Embed Size (px)
Citation preview
379
Ann. N.Y. Acad. Sci. 1043: 379–389 (2005). © 2005 New York Academy of Sciences.doi: 10.1196/annals.1333.044
Glycation Does Not Alter LDL-Induced Secretion of Tissue Plasminogen Activator and Plasminogen Activator Inhibitor-1 from Human Aortic Endothelial Cells
RICHARD L. KLEIN,a,b ANDREA J. SEMLER,a JOHN W. BAYNES,c
SUZANNE R. THORPE,c TIMOTHY J. LYONS,d AND ALICIA J. JENKINSe
aDivision of Endocrinology-Diabetes-Medical Genetics, Medical University of South Carolina, Charleston, South Carolina 29425, USAbResearch Service, Ralph H. Johnson Department of Veterans Affairs Medical Center, Charleston, South Carolina 29401, USAcDepartment of Chemistry and Biochemistry, University of South Carolina,Columbia, South Carolina 29208, USAdSection of Endocrinology, Oklahoma University Health Sciences Center, Oklahoma City, Oklahoma 73104, USAeDepartment of Medicine, University of Melbourne, Melbourne, Australia
ABSTRACT: Diabetes may induce both quantitative and qualitative changes inlipoproteins, especially low-density lipoprotein (LDL). Effects of LDL glyca-tion on endothelial cell secretion of tissue plasminogen activator (tPA) andplasminogen activator inhibitor-1 (PAI-1) have not been fully elucidated. Hu-man aortic endothelial cell (HAEC) tPA and PAI-1 production were deter-mined after incubation with LDL (50 to 500 �g/mL protein, 24 h) from threesources: (1) nondiabetic LDL (N-LDL) modified in vitro to form six prepara-tions: native, nonmodified (N); glycated (G); minimally oxidized (MO); mini-mally oxidized and glycated (MOG); heavily oxidized (HO); and heavilyoxidized and glycated (HOG); (2) in vivo glycated and relatively nonglycatedLDL subfractions from type 1 diabetic patients; (3) LDL from type 1 diabeticpatients and matched controls, which was subfractionated using density gradi-ent ultracentrifugation. In experiments using LDL modified in vitro, the rate oftPA release by HAECs incubated with N-LDL (83 ± 4 ng/mg cell protein/24 h)did not differ significantly from those incubated with G-LDL (73 ± 7), MO-LDL (74 ± 13), or MOG-LDL (66 ± 15) and was not influenced by LDL concen-tration. The rate of PAI-1 release was similar in HAECs incubated with N-LDL(5.7 ± 0.6 �g/mg cell protein/24 h), G-LDL (5.7 ± 0.7), MO-LDL (5.5 ± 0.8), orMOG-LDL (5.7 ± 0.9) and was not influenced by LDL concentration. In con-trast, tPA release was significantly decreased in cells incubated with LDL (10�g/mL) modified extensively by oxidation, and averaged 45.2 ± 5.0 and 43.7 ±9.9 ng/mg/24 h for HO-LDL and HOG-LDL, respectively, and was further de-
Address for correspondence: Richard L. Klein, Ph.D., Strom Thurmond Biomedical ResearchFacility, Room 501, Medical University of South Carolina, 114 Doughty Street, Charleston, SC29403. Voice: 843-789-6801; fax: 843-876-5133.
380 ANNALS NEW YORK ACADEMY OF SCIENCES
creased with increasing concentrations of the heavily oxidized LDL prepara-tions. PAI-1 release was not significantly decreased relative to N-LDL in cellsincubated with low concentrations (5 to 50 �g/mL) of HO-LDL andHOG-LDL, but was decreased to 3.2 ± 0.5 and 3.1 ± 0.7 �g/mg/24 h forHO-LDL and HOG-LDL at 200 �g/mL, respectively. Results using in vivo gly-cated versus nonglycated LDL showed that tPA and PAI-1 release did not differbetween subfractions. Release of tPA averaged 5.11 ± 0.6 and 5.12 ± 0.7 ng/mg/24 h, whereas release of PAI-1 averaged 666 ± 27 ng/mg/24 h and 705 ± 30 ng/mg/24 h for nonglycated and glycated LDL subfractions, respectively. UsingLDL of different density subclasses, tPA and PAI-1 release in response to LDLfrom diabetic patients compared with control subjects did not differ whenHAECs were incubated with LDLs of increasing density isolated from eachsubject pair. We conclude that oxidation of LDL, but not glycation, may con-tribute to the altered fibrinolysis observed in diabetes.
KEYWORDS: fibrinolysis; lipoproteins, LDL; glycation; endothelial cells; tissueplasminogen activator; plasminogen activator inhibitor-1
BACKGROUND
Qualitative changes such as nonenzymatic glycation and oxidation may potenti-ate the atherogenicity of low-density lipoprotein (LDL) despite normal plasma levelsin most people with type 1 diabetes.1–3 Glycation of LDL occurs from the onset ofdiabetes, correlates with other indices of glycemic control, including HbA1c,4 andalters LDL metabolism.5
Thrombogenicity, which is implicated in atherosclerosis, is the result of the bal-ance between coagulation and fibrinolysis. The major bioactive product of the fibrin-olytic system is plasmin, which degrades fibrinogen and fibrin. Formation ofplasmin from its precursor plasminogen is promoted by circulating tissue plasmino-gen activator (tPA) and urokinase-type plasminogen activator (uPA), and is inhibitedby plasminogen activator inhibitor-1 (PAI-1). Vascular endothelial cells are one ofthe major sources of tPA and PAI-1 in the body. Fibrinolysis is decreased in patientswith diabetes.6,7
We determined effects of LDL modified by in vitro glycation and/or oxidation, ofLDL modified by in vivo glycation, and of LDL subfractionated by density on theproduction of tPA and PAI-1 by cultured human aortic endothelial cells (HAECs).
METHODS
Preparation of In Vitro–Modified LDL
Isolation
Blood (300 mL) from each of five fasting, healthy, normolipidemic, nondiabeticvolunteers was collected and pooled in the presence of a lipoprotein preservative so-lution (LPPC) containing EDTA (2.8 mM), chloramphenicol (62 µM), gentamycinsulfate (50 µg/mL), and ε-amino-caproic acid (10 mM). LDL (1.019 < d < 1.063)was isolated, washed, and concentrated at the isolation density, and then dialyzedagainst saline/EDTA (150 mM NaCl, 300 µM EDTA, pH 7.8).
381KLEIN et al.: LDL-INDUCED SECRETION OF tPA AND PAI-1
Modification
LDL (5 mg LDL protein/mL) was modified in vitro to form six different LDLpreparations:
(1) Native LDL (N-LDL): LDL stored in saline/EDTA, pH 7.6, under N2. (2) Glycated LDL (G-LDL): LDL incubated with 150 mM glucose for 3 d at
37°C under N2. (3) Minimally oxidized LDL (MO-LDL): LDL incubated with CuCl2 (50 µM)
at 37°C until absorbance at 234 nm reached an apparent maximum.(4) Minimally oxidized and glycated LDL (MOG-LDL): LDL previously
incubated with glucose, as described for G-LDL, then oxidized asdescribed above for MO-LDL.
(5) Heavily oxidized LDL (HO-LDL): LDL incubated with CuCl2 (50 µM) at37°C for 20 h.
(6) Heavily oxidized and glycated LDL (HOG-LDL): LDL incubated withglucose as described for G-LDL, then oxidized as described for HO-LDL.
Preparation of In Vivo–Modified LDL Subfractions
In one series of studies, glycated and relatively nonglycated LDL subfractionswere prepared from LDL isolated from type 1 diabetic patients using affinity chro-matography.8 In a second series, LDL subclasses were prepared from the plasma of10 pairs of complication-free type 1 diabetic subjects and matched, healthy controlsusing discontinuous density gradient ultracentrifugation.9 Fractions were pooled todivide the total LDL into three fractions: (1) the peak LDL tube (LDL-P), containingthe highest LDL cholesterol concentration; (2) the larger diameter, lighter densityLDL eluting before LDL-P (LDL-L); and (3) the smaller diameter, denser LDL elut-ing after LDL-P (LDL-H).
Endothelial Cell Culture
Human aortic endothelial cells (Cascade Biologics, Portland, OR) were main-tained in Medium 200 containing 2% Low Serum Growth Supplement (Cascade Bi-ologics, Portland, OR), according to the supplier’s instructions. Cells from passages4 to 6 were used. Cells were grown to confluence in 12-well cluster plates, thenmaintained for an additional three days to attain quiescence before use.
Statistical Analysis
Results are expressed as the mean ± SD, and statistical significance was assessedusing one-way analysis of variance with post hoc determination of significance forthe series of studies with in vitro–modified LDL preparations and with the three sub-fractions isolated using density gradient ultracentrifugation. Statistical significancewas assessed using paired-t analysis for the series of studies using in vivo glycatedand nonglycated LDL subfractions. The SigmaStat statistical package (Version 3.0,SPSS Inc., Chicago, IL) was used for all analyses.
382 ANNALS NEW YORK ACADEMY OF SCIENCES
RESULTS
Biochemical Characterization of LDL Preparations
In Vitro–Modified Preparations
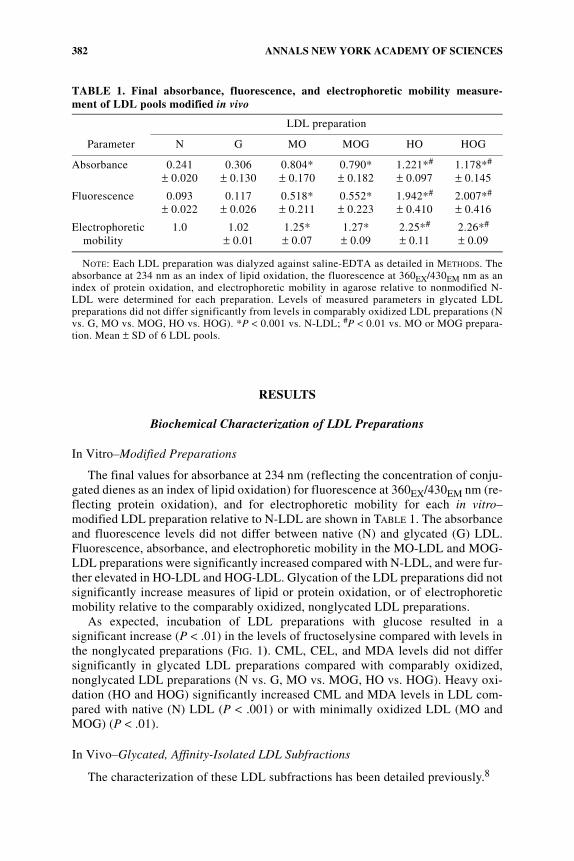
The final values for absorbance at 234 nm (reflecting the concentration of conju-gated dienes as an index of lipid oxidation) for fluorescence at 360EX/430EM nm (re-flecting protein oxidation), and for electrophoretic mobility for each in vitro–modified LDL preparation relative to N-LDL are shown in TABLE 1. The absorbanceand fluorescence levels did not differ between native (N) and glycated (G) LDL.Fluorescence, absorbance, and electrophoretic mobility in the MO-LDL and MOG-LDL preparations were significantly increased compared with N-LDL, and were fur-ther elevated in HO-LDL and HOG-LDL. Glycation of the LDL preparations did notsignificantly increase measures of lipid or protein oxidation, or of electrophoreticmobility relative to the comparably oxidized, nonglycated LDL preparations.
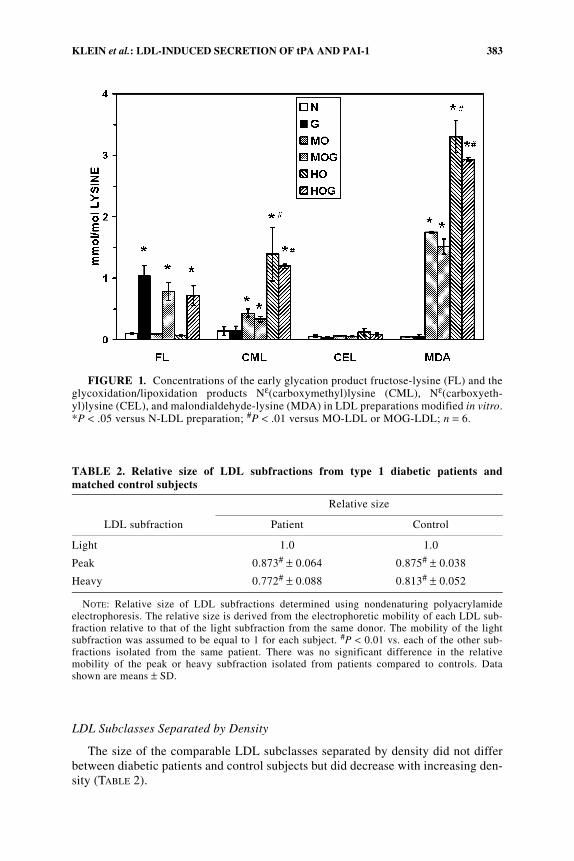
As expected, incubation of LDL preparations with glucose resulted in asignificant increase (P < .01) in the levels of fructoselysine compared with levels inthe nonglycated preparations (FIG. 1). CML, CEL, and MDA levels did not differsignificantly in glycated LDL preparations compared with comparably oxidized,nonglycated LDL preparations (N vs. G, MO vs. MOG, HO vs. HOG). Heavy oxi-dation (HO and HOG) significantly increased CML and MDA levels in LDL com-pared with native (N) LDL (P < .001) or with minimally oxidized LDL (MO andMOG) (P < .01).
In Vivo–Glycated, Affinity-Isolated LDL Subfractions
The characterization of these LDL subfractions has been detailed previously.8
TABLE 1. Final absorbance, fluorescence, and electrophoretic mobility measure-ment of LDL pools modified in vivo
Parameter
LDL preparation
N G MO MOG HO HOG
Absorbance 0.241± 0.020
0.306± 0.130
0.804*± 0.170
0.790*± 0.182
1.221*#
± 0.0971.178*#
± 0.145
Fluorescence 0.093± 0.022
0.117± 0.026
0.518*± 0.211
0.552*± 0.223
1.942*#
± 0.4102.007*#
± 0.416
Electrophoretic mobility
1.0 1.02± 0.01
1.25*± 0.07
1.27*± 0.09
2.25*#
± 0.112.26*#
± 0.09
NOTE: Each LDL preparation was dialyzed against saline-EDTA as detailed in METHODS. Theabsorbance at 234 nm as an index of lipid oxidation, the fluorescence at 360EX/430EM nm as anindex of protein oxidation, and electrophoretic mobility in agarose relative to nonmodified N-LDL were determined for each preparation. Levels of measured parameters in glycated LDLpreparations did not differ significantly from levels in comparably oxidized LDL preparations (Nvs. G, MO vs. MOG, HO vs. HOG). *P < 0.001 vs. N-LDL; #P < 0.01 vs. MO or MOG prepara-tion. Mean ± SD of 6 LDL pools.
383KLEIN et al.: LDL-INDUCED SECRETION OF tPA AND PAI-1
LDL Subclasses Separated by Density
The size of the comparable LDL subclasses separated by density did not differbetween diabetic patients and control subjects but did decrease with increasing den-sity (TABLE 2).
TABLE 2. Relative size of LDL subfractions from type 1 diabetic patients andmatched control subjects
LDL subfraction
Relative size
Patient Control
Light 1.0 1.0
Peak 0.873# ± 0.064 0.875# ± 0.038
Heavy 0.772# ± 0.088 0.813# ± 0.052
NOTE: Relative size of LDL subfractions determined using nondenaturing polyacrylamideelectrophoresis. The relative size is derived from the electrophoretic mobility of each LDL sub-fraction relative to that of the light subfraction from the same donor. The mobility of the lightsubfraction was assumed to be equal to 1 for each subject. #P < 0.01 vs. each of the other sub-fractions isolated from the same patient. There was no significant difference in the relativemobility of the peak or heavy subfraction isolated from patients compared to controls. Datashown are means ± SD.
FIGURE 1. Concentrations of the early glycation product fructose-lysine (FL) and theglycoxidation/lipoxidation products Nε(carboxymethyl)lysine (CML), Nε(carboxyeth-yl)lysine (CEL), and malondialdehyde-lysine (MDA) in LDL preparations modified in vitro.*P < .05 versus N-LDL preparation; #P < .01 versus MO-LDL or MOG-LDL; n = 6.
384 ANNALS NEW YORK ACADEMY OF SCIENCES
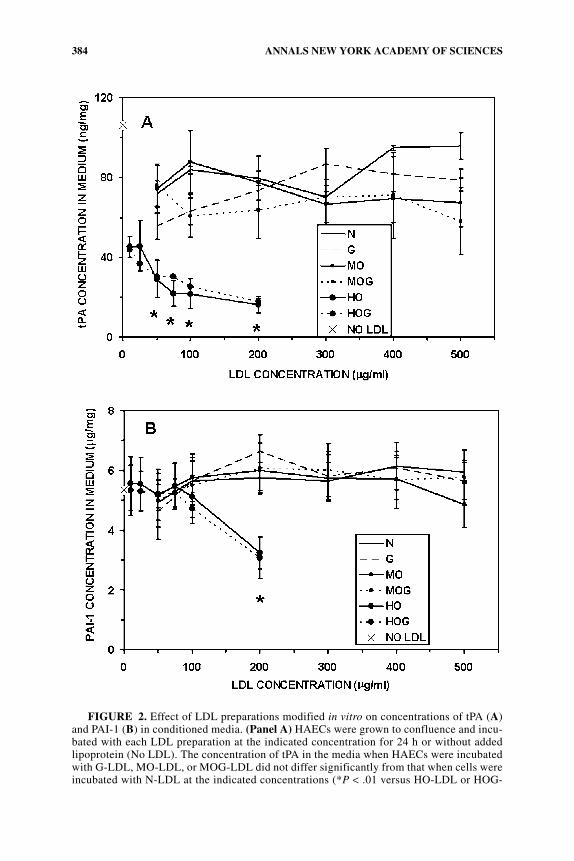
FIGURE 2. Effect of LDL preparations modified in vitro on concentrations of tPA (A)and PAI-1 (B) in conditioned media. (Panel A) HAECs were grown to confluence and incu-bated with each LDL preparation at the indicated concentration for 24 h or without addedlipoprotein (No LDL). The concentration of tPA in the media when HAECs were incubatedwith G-LDL, MO-LDL, or MOG-LDL did not differ significantly from that when cells wereincubated with N-LDL at the indicated concentrations (*P < .01 versus HO-LDL or HOG-
385KLEIN et al.: LDL-INDUCED SECRETION OF tPA AND PAI-1
Effect of LDL on tPA and PAI-1 Release from Human Aortic Endothelial Cells
In Vitro–Modified LDL Preparations
Levels of tPA in media in which HAECs were incubated with increasing concen-trations of G-LDL, MO-LDL, or MOG-LDL did not differ significantly comparedwith levels of tPA from the media of cells incubated with N-LDL at any concentra-tion studied (10 to 500 µg/mL), (FIG. 2A). HO-LDL and HOG-LDL at each concen-tration studied significantly reduced tPA levels in the media compared with all otherLDL preparations studied (P < .001). HO-LDL and HOG-LDL at 50 to 200 µg/mLsignificantly decreased tPA levels in the media compared with the same lipoproteinpreparations incubated at lower concentrations (P < .01). Concentrations of tPA inthe media did not differ significantly when the nonglycated form of the LDL prepa-ration was incubated with HAECs compared with the comparably oxidized, but gly-cated LDL preparation (N vs. G, MO vs. MOG, HO vs. HOG; P = NS).
PAI-1 levels in media when HAECs were incubated with increasing concentra-tions of G-LDL, MO-LDL, or MOG-LDL did not differ significantly compared withcells incubated with N-LDL at any concentration studied (10 to 500 µg/mL)(FIG. 2B). Lower concentrations of HO-LDL and HOG-LDL (5 to 100 µg/mL) didnot have any significant effect on PAI-1 release relative to N-LDL at 50 µg/mL. HO-LDL and HOG-LDL at 200 µg/mL significantly reduced PAI-1 levels compared withall other levels of HO-LDL and HOG-LDL studied. PAI-1 concentrations in the me-dia did not differ significantly when the nonglycated form of the LDL preparationwas incubated with HAECs compared with the comparably oxidized but glycatedLDL preparation (N vs. G, MO vs. MOG, HO vs. HOG; P = NS).
In Vivo–Glycated and –Nonglycated LDL Subfractions
The in vivo–glycated and –nonglycated LDL subfractions from each diabetic pa-tient were incubated with HAECs for 24 h as detailed in the METHODS. The concen-tration of tPA released into the medium from cells incubated with nonglycated LDLsubfractions did not differ significantly from that when cells were incubated with theglycated LDL subfraction from the same patient (5.11 ± 0.60 vs. 5.12 ± 70 ng/mgcell protein, respectively). Similarly, there were no significant differences in the con-centration of PAI-1 in the medium of cells incubated with the nonglycated LDL sub-fraction compared with the glycated LDL subfraction from the same patient (666 ±
LDL at 10 to 25 µg/mL) or versus the comparable concentration of N-LDL. The tPA con-centration in the medium of cells incubated with N-LDL, G-LDL, MO-LDL, MOG-LDL,HO-LDL, or HOG-LDL was significantly reduced, regardless of the LDL concentration, ascompared with basal incubations without LDL (No LDL, P < .0001). (Panel B) The concen-tration of PAI-1 in the media when HAECs were incubated with G-LDL, MO-LDL, orMOG-LDL did not differ significantly from that when cells were incubated with N-LDL atthe indicated concentrations (*P < .01 versus HO-LDL or HOG-LDL at lower concentra-tions) or when cells incubated with N-LDL, G-LDL, MO-LDL, MOG-LDL. PAI-1 concen-tration in basal incubations without LDL (No LDL) in the medium did not differsignificantly from cells incubated with any LDL preparation except HO-LDL or HOG-LDLat 200 µg/mL (P < .01).
386 ANNALS NEW YORK ACADEMY OF SCIENCES
FIG
UR
E3.
See
foll
owin
g pa
ge f
or l
egen
d.
387KLEIN et al.: LDL-INDUCED SECRETION OF tPA AND PAI-1
27 vs. 705 ± 30 ng/mg cell protein, respectively). The concentration of tPA in themedium in LDL-free incubations (7.8 ± 0.5 ng/mg cell protein) was significantlygreater (P < .01) than that in media from HAECs incubated with the glycated or non-glycated LDL subfractions from each patient. The concentration of PAI-1 in the me-dium in LDL-free incubations did not differ significantly from that in media fromcells incubated with the LDL subfractions and averaged 671 ± 41 ng/mg cell protein.
LDL Subclasses Separated by Density
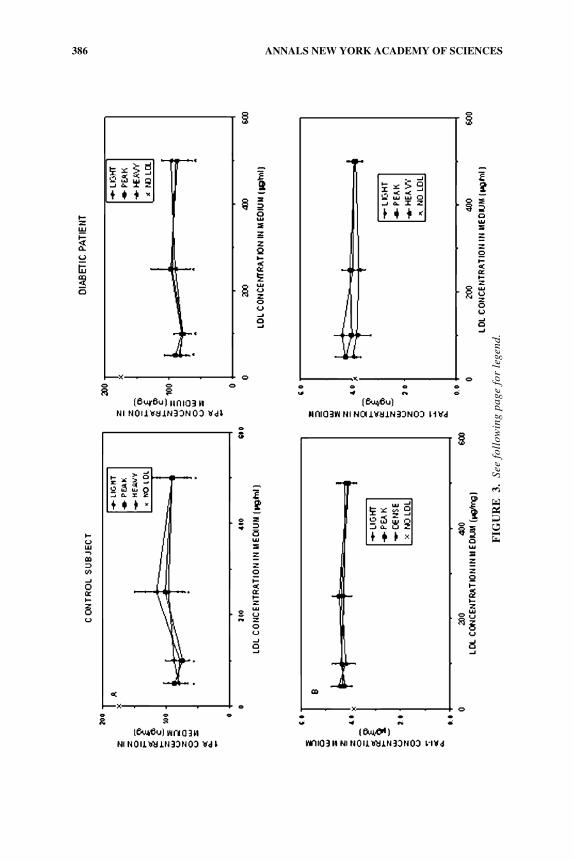
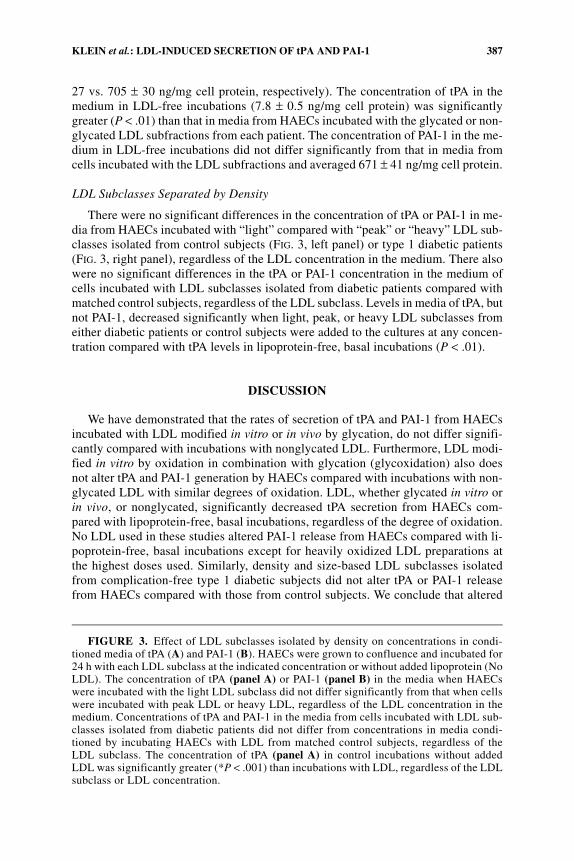
There were no significant differences in the concentration of tPA or PAI-1 in me-dia from HAECs incubated with “light” compared with “peak” or “heavy” LDL sub-classes isolated from control subjects (FIG. 3, left panel) or type 1 diabetic patients(FIG. 3, right panel), regardless of the LDL concentration in the medium. There alsowere no significant differences in the tPA or PAI-1 concentration in the medium ofcells incubated with LDL subclasses isolated from diabetic patients compared withmatched control subjects, regardless of the LDL subclass. Levels in media of tPA, butnot PAI-1, decreased significantly when light, peak, or heavy LDL subclasses fromeither diabetic patients or control subjects were added to the cultures at any concen-tration compared with tPA levels in lipoprotein-free, basal incubations (P < .01).
DISCUSSION
We have demonstrated that the rates of secretion of tPA and PAI-1 from HAECsincubated with LDL modified in vitro or in vivo by glycation, do not differ signifi-cantly compared with incubations with nonglycated LDL. Furthermore, LDL modi-fied in vitro by oxidation in combination with glycation (glycoxidation) also doesnot alter tPA and PAI-1 generation by HAECs compared with incubations with non-glycated LDL with similar degrees of oxidation. LDL, whether glycated in vitro orin vivo, or nonglycated, significantly decreased tPA secretion from HAECs com-pared with lipoprotein-free, basal incubations, regardless of the degree of oxidation.No LDL used in these studies altered PAI-1 release from HAECs compared with li-poprotein-free, basal incubations except for heavily oxidized LDL preparations atthe highest doses used. Similarly, density and size-based LDL subclasses isolatedfrom complication-free type 1 diabetic subjects did not alter tPA or PAI-1 releasefrom HAECs compared with those from control subjects. We conclude that altered
FIGURE 3. Effect of LDL subclasses isolated by density on concentrations in condi-tioned media of tPA (A) and PAI-1 (B). HAECs were grown to confluence and incubated for24 h with each LDL subclass at the indicated concentration or without added lipoprotein (NoLDL). The concentration of tPA (panel A) or PAI-1 (panel B) in the media when HAECswere incubated with the light LDL subclass did not differ significantly from that when cellswere incubated with peak LDL or heavy LDL, regardless of the LDL concentration in themedium. Concentrations of tPA and PAI-1 in the media from cells incubated with LDL sub-classes isolated from diabetic patients did not differ from concentrations in media condi-tioned by incubating HAECs with LDL from matched control subjects, regardless of theLDL subclass. The concentration of tPA (panel A) in control incubations without addedLDL was significantly greater (*P < .001) than incubations with LDL, regardless of the LDLsubclass or LDL concentration.
388 ANNALS NEW YORK ACADEMY OF SCIENCES
endothelial cell production of modulators of fibrinolysis are not modulated by LDLmodified by glycation, but are affected by LDL oxidation.
Our results, that LDL glycation does not affect endothelial cell production of fi-brinolysis regulators, contrast with those of Shen et al.,10 who demonstrated a de-crease in tPA and an increase in PAI-1 from human umbilical vein endothelial cells(HUVECs) in response to in vitro glycated LDL. Differences in cell types (HUVECsvs. HAECs) and differences in cell exposure times (48 vs. 24 h) may account for thedifferent observations, with longer incubations times facilitating endothelial cell–in-duced LDL oxidation, as recognized by Shen. In addition, in vitro glycation of LDLby our protocol, and in vivo glycation, was not associated with significant oxidationas demonstrated by a lack of increase in levels of conjugated dienes, fluorescence,and electrophoretic mobility in this study (TABLE 1), or by a decrease in levels of lip-id soluble antioxidants, or increase in TBARS or carboxymethyllysine in previousresearch.11 Shen et al. exposed their LDL to glucose for several weeks. Our three-day protocol is in keeping with the half-life of circulating LDL. Furthermore, the invitro glycation incubations of Shen et al. were performed in the presence of sodiumborohydride, which would result in the formation of glucitollysine adducts ratherthan fructoselysine adducts. The effect of these differences in lysine modificationson LDL recognition by endothelial cell lipoprotein receptors and subsequent tPA andPAI-1 production are unknown.
We also did not observe any change in PAI-1 production from HAECs exposed toin vivo glycated and nonglycated LDL, and to diabetic and nondiabetic LDL densitysubfractions. In contrast, Shen et al. noted increased PAI-1 production in response toLDL preparations from diabetic patients.12 In addition to differences in cell types andLDL exposure times, the clinical status of our patients differ. Our diabetic subjectswere complication-free and had good to moderate glycemic control (mean HbA1c <8%). The patients in the Shen et al. study included many subjects with vascular com-plications, and their glycemic control was worse (mean HbA1c = 8.9%). These fac-tors may have induced other compositional alterations (not quantified), such as inchanges lipid content, fatty acids, phospholipids, and sialic acid content.
Small, dense LDL did not differ in its effect on tPA or PAI-1 secretion fromHAECs compared with larger, more buoyant LDL subfractions. Small, dense LDLmay be atherogenic indirectly by its association with other features of the metabolicsyndrome, such as low HDL-C, or directly by easier egress into the vascular wall,greater retention by vascular matrix, and greater susceptibility to oxidation. Thus, al-though small, dense LDL is associated with greater cardiovascular risk, its mecha-nism of damage may not be via modulation of endothelial cell thrombogenicity/fibrinolysis.
Our studies suggest that extensively oxidized (HO) and glycoxidized (HOG)LDL may have deleterious effects on arterial endothelial cell function. Supplemen-tation with antioxidants may have a protective effect. We demonstrated previouslythat α-tocopherol enrichment of LDL is associated with improvements in retinalcapillary cell viability and function, including reduction of retinal capillary endo-thelial cell supernatant PAI-1 and endothelin-1 levels and increased nitrite levels.11
This in vitro benefit of vitamin E is not yet supported by clinical studies; however,other antioxidants that get to the site of damage (intracellular vs. cell membrane),and enzymatic type antioxidants such as superoxide dismutase mimetics, may bemore effective.
389KLEIN et al.: LDL-INDUCED SECRETION OF tPA AND PAI-1
In summary, we have demonstrated that LDL modified in vitro by glycation and/or mild oxidation, in vivo–modified LDL from complication-free diabetic subjects,and small, dense LDL from type 1 diabetic patients do not affect arterial endothelialcell release of modulators of fibrinolysis compared with native LDL. More extensiveoxidation of LDL, in the presence or absence of glycation, reduces tPA levels in aconcentration-dependent manner and reduces PAI-1 at high doses. We conclude thataltered endothelial cell production of modulators of fibrinolysis is not mediated byglycated LDL, but may be affected by extensive oxidation such as may occur in thesubendothelial space.
REFERENCES
1. JENKINS, A.J., W.T. GARVEY & R.L. KLEIN. 2003. Lipoprotein abnormalities in type 1diabetes. Curr. Opin. Endocrinol. Diab. 10: 245–250.
2. JENKINS, A.J., J.D. BEST, R.L. KLEIN & T.J. LYONS. 2004. Lipoproteins, glycoxidation,and diabetic angiopathy. Diab. Metab. Rev. 20: 349–368.
3. LOPES-VIRELLA, M.F., R.L. KLEIN & G. VIRELLA. 1996. Modification of lipoproteins indiabetes. Diab. Metab. Rev. 12: 69–90.
4. LYONS, T.J., J.S. PATRICK, J.W. BAYNES, J.A. COLWELL & M.F. LOPES-VIRELLA. 1986.Glycation of low density lipoprotein in patients with Type 1 diabetes. Correlationswith other parameters of glycaemic control. Diabetologia 29: 685–689.
5. LYONS, T.J. & A.J. JENKINS. 1997. Glycated lipoproteins. Curr. Opin. Lipidol. 8: 174–180.6. SOBEL, B.E. 2003. Fibrinolysis and diabetes. Front. Biosci. 8: d1085–d1092.7. NORDT, T.K. & C. BODE. 2000. Impaired endogenous fibrinolysis in diabetes mellitus:
mechanisms and therapeutic approaches. Semin. Thromb. Hemost. 26: 495–501.8. JENKINS, A.J., S.R. THORPE, C.N. CHASSEREAU, et al. 2004. The in vivo glycated LDL
subfraction is not more susceptible to oxidation than non-glycated LDL in Type 1diabetic patients. Metabolism 53: 969–976.
9. KELLEY, J.L. & A.W. KRUSKI. 1986. Density gradient ultracentrifugation of serum lipo-proteins in a swinging bucket rotor. Methods Enzymol. 128: 170–181.
10. ZHANG, J., S. REN, D. SUN & G.X. SHEN. 1998. Influence of glycation on LDL-inducedgeneration of fibrinolytic regulators in vascular endothelial cells. Arterioscler.Thromb. Vasc. Biol. 18: 1140–1148.
11. JENKINS, A.J., W. LI, K. MOLLER, et al. 1999. Pre-enrichment of modified low densitylipoproteins with alpha-tocopherol mitigates adverse effects on cultured retinal capil-lary cells. Curr. Eye Res. 19: 137–145.
12. REN S., H. LEE, L. HU & G.X. SHEN. 2002. Impact of diabetes-associated lipoproteinson generation of fibrinolytic regulators from vascular endothelial cells. J. Clin.Endocrinol. Metab. 87: 286–291.