Embed Size (px)
Citation preview

ORIGINAL PAPER
Glycine betaine application modifies biochemical attributesof osmotic adjustment in drought stressed wheat
Neha Gupta • Sanjeev Kaur Thind •
Navtej Singh Bains
Received: 14 February 2013 / Accepted: 3 October 2013 / Published online: 10 October 2013
� Springer Science+Business Media Dordrecht 2013
Abstract Nineteen wheat genotypes were used to
examine the effects of foliar applied glycine betaine (GB,
100 mM) on concentration of various osmolytes (such as
proline, choline, GB and sucrose) under drought stress
conditions. Drought stress caused a significant increase in
proline content and GB content of wheat genotypes, both at
maximum tillering and anthesis stages. Choline and
sucrose were accumulated significantly at higher levels
under stress conditions at both the stages. GB application
increased the proline content and endogenous levels of GB
in comparison to their stressed counterparts both at maxi-
mum tillering and anthesis stages but this increase was
observed to be genotype specific. Furthermore, significant
decrease in choline levels and sucrose contents of GB
treated plants at anthesis stage and enhanced levels of
proline questioned about involvement of GB in production
of other osmolytes as well as stage specific response of
wheat genotypes to GB spray. But these changes in
osmolyte accumulation (OA) were not correlated with
relative water content and stress tolerance index observed,
under both GB sprayed and non-sprayed drought stressed
conditions. So OA could not be considered as a selection
criteria for drought tolerance in wheat.
Keywords Drought stress � Wheat � Proline �Glycine betaine levels
Abbreviations
GB Glycine betaine
OA Osmolyte accumulation
RWC Relative water content
STI Stress tolerance index
Introduction
Wheat is a cereal of choice and a staple food for people
all over the world. About 230 million ha of land is used
for wheat cultivation worldwide and half of this area is
routinely afflicted with drought stress (Trethowan and
Reynolds 2007). As one of the abiotic constraints, drought
determines yield and quality of wheat, through sink
strength and source capacity. Losses in grain yield due to
drought may range from 17 to 70 %. Drought stress
involves not only water deprivation but also nutrient
limitations, salinity and oxidative stress to plants. Among
the various protection mechanisms of plants, accumula-
tion of osmolytes/compatible organic solutes is important
for ensuring survival under stress conditions. These
compatible solutes are of low molecular weight, having
high solubility in water and are non-toxic even at high
concentrations (Bohnert et al. 1995). Osmolyte accumu-
lation (OA), usually called osmotic adjustment, has long
been proposed as a selection criterion in traditional
breeding or through marker assisted selection and genetic
engineering programmes to generate drought tolerant
crops (Ludlow and Muchow 1990; Zhang et al. 1999). A
wide variety of osmolytes including betaines, polyols,
sugars and amino acids etc. exist in the plant kingdom
(Rhodes and Hanson 1993). Among the many betaines
N. Gupta (&) � S. K. Thind
Department of Botany, Punjab Agricultural University,
Ludhiana 141004, India
e-mail: [email protected]
N. S. Bains
Department of Plant Breeding and Genetics, Punjab Agricultural
University, Ludhiana 141004, India
123
Plant Growth Regul (2014) 72:221–228
DOI 10.1007/s10725-013-9853-0

and its related compounds known in plants, glycine
betaine (GB) occurs most abundantly in response to
dehydration stress (Mohanty et al. 2002; Yang et al.
2003). GB (N,N0,N00-trimethylglycine) is a quaternary
ammonium compound that is naturally synthesized by a
large number of organisms, including members of plant
families Chenopodiaceae, Amaranthaceae, Graminae,
Compositae and Malvaceae (Rhodes and Hanson 1993;
Gorham 1996; Blunden et al. 1999). In addition to its
function in osmoregulation, GB plays an important role in
stabilization of complex proteins, enzymes (e.g., Rubisco)
and membranes (Bohnert and Jensen 1996; Allakhverdiev
et al. 2003), besides protection of photosynthetic appa-
ratus from photodamage (Sakamoto and Murata 2002;
Zhao et al. 2007) and maintenance of electron flow in
thylakoid membranes (Ma et al. 2006) under various
stress conditions. Moreover, involvement of GB in regu-
lation of the activities of antioxidant enzymes has been
reported (Ma et al. 2006; Park et al. 2007; Raza et al.
2007; Wang et al. 2010).
Transgenics for enzymes involved in GB synthesis
[such as betaine aldehyde dehydrogenase (BADH), cho-
line dehydrogenase (CDH), choline monooxygenase
(CMO) and choline oxidase (COD)] in rice (Sakamoto
et al. 1998), tomato (Park et al. 2007), Arabidopsis (Alia
et al. 1999), tobacco (Ma et al. 2007) and wheat (Wang
et al. 2010) exhibited an enhancement in tolerance to
cold, drought, heat and salinity stress. Inability to pro-
duce sufficient amounts of GB in some of these trans-
genics has been attributed to low availability of its
substrate choline, reduced transport of choline across the
chloroplast envelope and the high energy cost of GB
biosynthesis. In this context, an alternative approach
involving exogenous application of GB has gained
attention. There are many reports demonstrating positive
effects of exogenous application of GB on growth, sur-
vival and tolerance of a wide variety of GB accumulator/
non accumulator plants under various stress conditions
(Rajasekaran et al. 1997; Diaz-Zorita et al. 2001). Foliar
application of GB in wheat was also found to alleviate
photoinhibition (Ma et al. 2006), improve photosynthesis
via altering lipid composition of thylakoid membranes
(Zhao et al. 2007) and maintain higher antioxidant
enzyme activities under drought and salinity stress (Raza
et al. 2007; Liang et al. 2009). But none of these studies
were carried out under long term field stress conditions
where multiple stresses and complexity in stress response
occurs. Moreover, little information was available on
exogenously applied GB affecting other osmolytes levels
in wheat genotypes differing in drought tolerance.
Keeping in view the above points, the present study
aimed at understanding the role of applied GB in terms
of changes induced in levels of various compatible
osmolytes and their contribution to water deficit tolerance
in wheat under field conditions.
Materials and methods
Seeds of eight cultivars (C306, PBW175, PBW527,
PBW343, PBW550, DBW17, PBW 621 and HD 2967) and
eleven advanced lines (BW9022, BW9097, BW9183,
BW9005, BW9016, BW8989, BW8366, BW9151,
BW8362, BW9025 and BWL0089) of wheat were obtained
from Department of Plant Breeding and Genetics, Punjab
Agricultural University, Ludhiana. Field experiments were
conducted during the growing seasons of 2010–2011 and
2011–2012. The experiment was laid out in a split plot
design with three main plot treatments (i.e. control or
normal irrigated, drought stress and drought stress with GB
application) and 19 wheat varieties as subplot treatments.
Each main plot treatment was tested by three replications
with a subplot size of 2 9 3 m2. Wheat genotypes were
sown in field according to standard agronomic practices at
a seed rate of 40 kg/acre and row to row spacing of 23 cm.
Drought stress was imposed by withholding irrigation
throughout the season, except for a pre-sowing irrigation to
ensure optimum germination. Drought stressed plots were
covered with plastic sheets during rains. Control plots were
provided with five irrigations (each of 8–10 cm depth)
during the crop life cycle. In case of GB sprayed plots,
aqueous 100 mM GB solution containing 0.1 % TWEEN
20 was sprayed on the leaves until run off twice a day for
2 days as described by Ma et al. (2006) at maximum til-
lering and anthesis stages. The two types of GB non-
sprayed plots i.e. control (normal irrigated) and drought
stressed plots were sprayed with only water containing
0.1 % TWEEN 20 at both the stages. After 1 week of GB
application, leaf samples were collected from each plot.
The youngest fully expanded leaf and flag leaf from 10
random plants were excised for biochemical estimations at
maximum tillering and anthesis stages respectively.
Determination of free proline
The proline content was determined spectrophotometeri-
cally by the ninhydrin method as described by Bates et al.
(1973). Leaf samples (0.250 g) from each replicate were
homogenised in 5 ml of 3 % sulphosalicylic acid for pro-
line extraction. The filtrate (2 ml) was then reacted with
acid ninhydrin and glacial acetic acid at 100 �C for 1 h.
After termination of the reaction in an ice bath, extraction
was done using toluene and absorbance of toluene con-
taining the pink coloured chromophore was determined at
520 nm. The proline concentration was determined from a
standard curve and calculated on fresh weight basis.
222 Plant Growth Regul (2014) 72:221–228
123

Determination of glycine betaine and choline content
Leaf GB and choline was determined following Grieve and
Grattan (1983). Extraction of GB and choline was done
from dried leaf material (0.5 g) in deionized water (20 ml)
for 24 h at 25 �C. The extract (0.5 ml) was then mixed
with 0.5 ml of 2 N H2SO4 and cooled in an ice-bath for an
hour. Then after addition of 0.2 ml potassium tri-iodide
solution, the contents were gently mixed and placed in an
ice-bath for 16 h. GB periodide crystals obtained were then
dissolved in 9 ml of 1,2-dichloroethane and optical density
of the solution was measured at 365 nm.
For choline estimation, the aqueous extract (0.5 ml)
obtained from dried leaf material was mixed with 0.5 ml of
0.2 M potassium phosphate buffer (pH 6.8) instead of 2 N
H2SO4. The other steps followed were same as for GB
estimation. The concentrations of choline and GB were
calculated on the dry weight basis.
Determination of sucrose
Sucrose content was estimated using the resorcinol method
of Roe et al. (1949) and extraction of sugars was done by
ethyl alcohol.
Relative leaf water content and stress tolerance index
(STI)
Leaf relative water content (RWC) was calculated via leaf
discs by the formula (FW-DW/TW-DW) 9 100 %, where
FW was fresh weight, TW was the turgid or saturated fresh
weight and DW was the dry weight after oven drying of leaf
discs at 80 �C for 48 h (Ma et al. 2007). The STI was cal-
culated by the formula: Yd 9 Yp/( �Yp)2 where Yd was mean
grain yield of a genotype under drought, Yp was mean grain
yield of a genotype under control conditions and �Yp was
mean grain yield of all genotypes under control conditions.
Statistical analysis
All measurements were recorded on three replications. The
data were subjected to statistical analysis by means of factorial
experiment in a random block design using two way ANOVA,
consisting of 19 genotypes and treatments at 3 levels.
Results
Proline content in wheat leaves
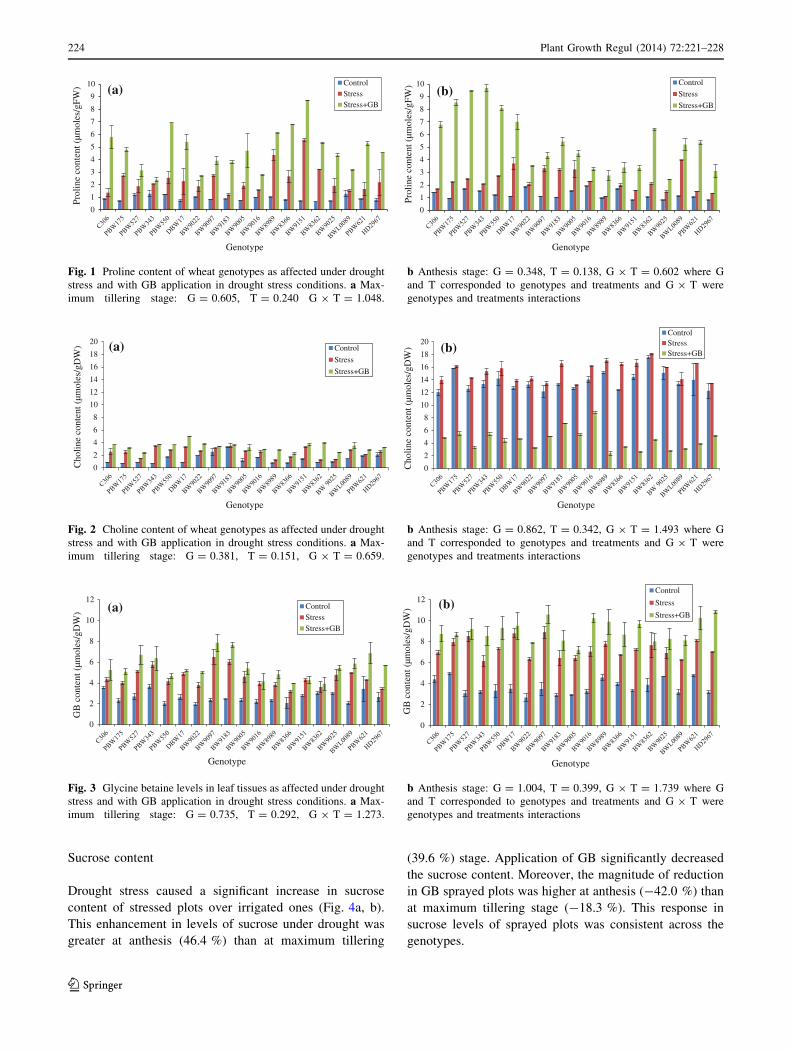
Free proline content in leaves was significantly (P B 0.05)
higher in drought stressed plots (pooled across genotypes)
as compared to irrigated plots (Fig. 1a, b). Further, this
increase was more pronounced at maximum tillering stage
(181.01 %) than at anthesis (96.09 %). Not all genotypes,
however, followed this trend and four exceptions were
observed. Application of GB to drought stressed plots
enhanced proline accumulation further both at maximum
tillering (114.7 %) and anthesis stages (147.5 %). Inter-
estingly, the level of enhancement of proline content as a
result of GB application was seemed to depend upon the
inherent levels prior to spray. Overall nine genotypes
(C306, PBW 175, BW 9097, BW 9183, BW 8989, BW
9151, BW 8362, BWL0089 and PBW 621) at maximum
tillering stage and fourteen genotypes at anthesis stage
(C306, PBW 527, PBW 343, DBW 17, BW 9022, BW
9097, BW 9183, BW 9005, BW 8989, BW 8366, BW
8362, BWL0089, PBW 621 and HD2967) showed this
response in proline accumulation with GB spray under
drought stress conditions. Most of the genotypes showing
relatively lower proline levels prior to spray exhibited a
larger magnitude of increase on GB application. Genotype
specific response was also reflected in seven genotypes
(PBW175, PBW 343, BW 9183, BW 8989, BW 9151, BW
8362 and BWL0089) wherein GB application changed the
stage response (maximum tillering versus anthesis) at
which higher proline levels were observed.
Choline and glycine betaine contents
As depicted in Fig. 2a and b, choline content of drought
stressed plots showed a significant increase over irrigated
ones. The increase was of a much higher magnitude at
maximum tillering stage (111.5 %) in comparison to
anthesis stage (12.2 %). The actual content of choline,
however was lower at maximum tillering stage. Contrast-
ing effect of GB spray on choline levels was observed at
the two stages. While GB application enhanced choline
levels at maximum tillering stage (44.5 %), significant
reduction (-70.4 %) was observed at anthesis stage.
Importantly, this reduction in choline content was consis-
tent across genotypes.
In case of GB content, drought stressed plots had sig-
nificantly higher levels of GB in comparison to irrigated
plots (Fig. 3a, b). This enhancement in GB levels was more
pronounced at anthesis (104.8 %) as compared to maxi-
mum tillering stage (77.0 %). Application of GB to
drought stressed plots significantly increased its own con-
tent. Further, this response of GB sprayed plots was con-
sistent across the genotypes at both the maximum tillering
(22.3 %) and anthesis stages (24.4 %). Interestingly, higher
levels of GB in sprayed plots at anthesis were in contrast to
reduction observed in choline accumulation at that stage.
Plant Growth Regul (2014) 72:221–228 223
123
Sucrose content
Drought stress caused a significant increase in sucrose
content of stressed plots over irrigated ones (Fig. 4a, b).
This enhancement in levels of sucrose under drought was
greater at anthesis (46.4 %) than at maximum tillering
(39.6 %) stage. Application of GB significantly decreased
the sucrose content. Moreover, the magnitude of reduction
in GB sprayed plots was higher at anthesis (-42.0 %) than
at maximum tillering stage (-18.3 %). This response in
sucrose levels of sprayed plots was consistent across the
genotypes.
0
1
2
3
4
5
6
7
8
9
10Pr
olin
e co
nten
t (µm
oles
/gFW
)
Genotype
ControlStressStress+GB
(a)
0
1
2
3
4
5
6
7
8
9
10
Prol
ine
cont
ent (
µmol
es/g
FW)
Genotype
Control
Stress
Stress+GB
(b)
Fig. 1 Proline content of wheat genotypes as affected under drought
stress and with GB application in drought stress conditions. a Max-
imum tillering stage: G = 0.605, T = 0.240 G 9 T = 1.048.
b Anthesis stage: G = 0.348, T = 0.138, G 9 T = 0.602 where G
and T corresponded to genotypes and treatments and G 9 T were
genotypes and treatments interactions
0
2
4
6
8
10
12
14
16
18
20
Cho
line
cont
ent (
µmol
es/g
DW
)
Genotype
Control
Stress
Stress+GB
(a)
0
2
4
6
8
10
12
14
16
18
20
Cho
line
cont
ent (
µmol
es/g
DW
)
Genotype
ControlStressStress+GB(b)
Fig. 2 Choline content of wheat genotypes as affected under drought
stress and with GB application in drought stress conditions. a Max-
imum tillering stage: G = 0.381, T = 0.151, G 9 T = 0.659.
b Anthesis stage: G = 0.862, T = 0.342, G 9 T = 1.493 where G
and T corresponded to genotypes and treatments and G 9 T were
genotypes and treatments interactions
0
2
4
6
8
10
12
GB
con
tent
(µm
oles
/gD
W)
Genotype
ControlStressStress+GB
(a)
0
2
4
6
8
10
12
GB
con
tent
(µm
oles
/gD
W)
Genotype
Control
Stress
Stress+GB(b)
Fig. 3 Glycine betaine levels in leaf tissues as affected under drought
stress and with GB application in drought stress conditions. a Max-
imum tillering stage: G = 0.735, T = 0.292, G 9 T = 1.273.
b Anthesis stage: G = 1.004, T = 0.399, G 9 T = 1.739 where G
and T corresponded to genotypes and treatments and G 9 T were
genotypes and treatments interactions
224 Plant Growth Regul (2014) 72:221–228
123

Relative leaf water content and stress tolerance index
As represented in Table 1, relative leaf water content
(RWC) was significantly higher in irrigated (control) plots
over their drought stressed counterparts. GB application
was found to improve RWC of wheat genotypes under
drought stress at both the stages but short of the level
observed in irrigated plots. Moreover, STI of sprayed plots
was also found to be significantly increased over non-
sprayed counterparts (Table 1). In order to evaluate the
association of RWC and STI to levels of compatible solutes
under drought stress, a correlation analysis was carried out
0
5
10
15
20
25
30
35
40
45Su
cros
e co
nten
t (m
g/gF
W)
Genotype
ControlStressStress+GB
(a)
0
5
10
15
20
25
30
35
40
45
Sucr
ose
cont
ent (
mg/
g FW
)
Genotype
ControlStressStress+GB
(b)
Fig. 4 Sucrose accumulation in leaf tissues under drought stress and
with GB application in drought stress conditions. a Maximum
tillering stage: G = 4.029, T = 1.601, G 9 T = 6.978. b Anthesis
stage: G = 2.039, T = 0.810, G 9 T = 3.532 where G and T
corresponded to genotypes and treatments and G 9 T were genotypes
and treatments interactions
Table 1 Comparison of relative water content and stress tolerance index of wheat genotypes subjected to irrigation (control), drought stress and
exogenous application of glycine betaine (100 mM) under drought stress conditions
Genotypes Relative water content (%) Stress tolerance index
Maximum tillering stage Anthesis stage
Irrigated Drought
stress
Drought
stress ? GB
Irrigated Drought
stress
Drought
stress ? GB
Drought
stress
Drought
stress ? GB
C306 86.071 77.778 80.619 82.846 78.000 80.118 0.539 0.782
PBW175 85.769 74.648 82.615 84.375 78.392 80.000 0.572 0.736
PBW527 83.063 71.233 80.000 81.481 78.356 81.673 0.604 0.790
PBW343 87.732 80.000 83.117 84.127 80.636 82.792 0.455 0.673
PBW550 85.964 83.019 82.483 82.500 79.310 80.982 0.809 0.820
DBW17 83.651 80.060 80.615 82.049 76.667 78.500 0.627 0.850
BW9022 83.750 81.441 81.571 81.136 79.697 80.484 0.415 0.687
BW9097 84.118 79.688 80.000 84.211 78.275 80.000 0.495 0.763
BW9183 84.030 81.885 80.667 81.967 78.185 80.714 0.676 0.922
BW9005 86.091 81.500 82.690 86.228 79.655 80.240 0.995 1.078
BW9016 85.455 80.625 82.500 87.710 80.556 81.143 0.526 0.918
BW8989 86.189 82.060 83.333 85.075 80.848 82.235 0.924 1.013
BW8366 87.324 71.642 84.714 87.831 78.207 80.462 0.935 0.913
BW9151 83.846 73.333 81.507 82.645 79.929 81.037 0.634 0.680
BW8362 86.302 70.423 82.545 84.906 77.186 78.846 0.703 0.931
BW 9025 86.873 81.159 82.235 83.134 77.090 79.323 0.572 0.621
BWL0089 87.500 83.333 84.103 87.356 78.484 80.714 0.655 0.791
PBW621 86.041 75.000 80.011 85.000 78.846 82.791 0.943 1.095
HD2967 83.151 80.211 82.014 82.258 78.214 81.667 0.926 1.031
* CD at 5 % level of significance for RWC: Maximum tillering stage: G = 3.626, T = 1.441, G 9 T = 6.281 For STI: G = 0.154, T = 0.501,
G 9 T = NS
Anthesis stage: G = NS, T = 1.679, G 9 T = NS; where CD represented critical differences at 5 % level of significance, NS corresponded to
non significant differences, G corresponded to genotypes, T corresponded to treatments and G 9 T corresponded to interaction between
genotypes and treatments
Plant Growth Regul (2014) 72:221–228 225
123

under both non-sprayed and GB sprayed conditions
(Table 2). Increased levels of proline, choline and sucrose
content as observed in drought stressed plots at maximum
tillering stage were not correlated significantly to levels of
RWC under stress conditions. Further this non-significant
relationship of above mentioned osmolytes was also
observed at anthesis stage. Following a similar correlation
pattern, contribution of osmolytes (proline, choline and
sucrose) to STI was non-significant at both the stages under
drought stress.
As mentioned previously, GB application induced
changes in levels of above mentioned osmolytes which
showed stage-specific and genotype dependent behaviour.
Inspite of the changes, their correlation with RWC and STI
was observed to be non-significant in GB sprayed plots.
Interestingly, GB content at maximum tillering stage
showed significant correlation with RWC and STI to a
greater extent in comparison to other osmolytes. GB con-
tent of drought stressed plots at maximum tillering stage
showed significant negative correlation with STI (r =
-0.533). Reversal of this relationship occurred with GB
spray at maximum tillering stage. This negative correlation
between GB and STI, at maximum tillering suggested that
enhanced levels of GB at early stages under drought stress
could decrease the tolerance ability. No such response
between GB content and STI was observed at anthesis
under drought stress. An enhanced level of GB in sprayed
plots at the stage of maximum tillering was also signifi-
cantly negative correlated with RWC (r = -0.580). In
contrast, GB levels of non sprayed plots at maximum til-
lering stage and GB levels at anthesis under both sprayed
and non sprayed conditions were not correlated with RWC.
While correlation was studied between RWC and STI at
both stages, non significant relationship existed between
the two at both stages.
Discussion
Osmolyte accumulation is often, related with osmotic
adjustment, without knowing the contribution of osmolytes
to this physiological mechanism. Moreover, maintenance
of turgor and dehydration tolerance has also been associ-
ated with the phenomenon of OA. All these strategies were
thought to enhance plant resistance to water deficit as well
as other abiotic stresses. Based on this, the present research
was carried out to study the variations in content of various
osmolytes in wheat genotypes under drought stress and
their relationship with drought tolerance in wheat. Fur-
thermore, exogenous application of GB was done at
selected growth stages i.e. maximum tillering and anthesis,
to study the effect of this osmolyte on its own content and
contents of other compatible solutes produced under
drought stress conditions. This osmolyte was selected on
basis of previous studies on exogenous application of
osmolytes, which supported enhancement in tolerance of
wheat crop to different abiotic stresses via osmotic
adjustment, improved anti-oxidative defense system and
increased photosynthetic rate by GB (Ma et al. 2006; Raza
et al. 2007) which could result in yield benefits.
In current study, foliar application of GB (100 mM)
significantly improved STI of wheat genotypes under
drought stress. In order to determine whether this
improvement was because of OA in GB treated plots,
contents of various osmolytes were estimated. GB appli-
cation under drought stress conditions resulted in enhanced
levels of osmolytes (proline and GB) but lowering the
sucrose content in leaves. This decrease in sucrose content
could be due to involvement of sucrose in GB induced
synthesis of compatible solutes like proline, choline etc., by
either acting as a carbon skeleton or as an energy source.
Another reason would be more transport of sucrose to
promote growth of developing sinks such as roots at til-
lering and grains at anthesis under drought stress by GB. In
contrast to enhanced levels of proline and GB due to GB
application, choline showed a decline at anthesis stage.
This was observed across all 19 wheat genotypes. Choline
Table 2 Correlation analysis of relative water content (RWC) and
stress tolerance index (STI) with various osmolytes under drought
stress and exogenously applied glycine betaine (GB) conditions
Parameters RWC STI
Maximum
tillering
Anthesis Maximum
tillering
Anthesis
Drought stress
Proline -0.320 -0.254 0.160 -0.169
Choline 0.404 0.116 -0.332 0.140
Glycine
betaine
0.346 -0.338 -0.533* -0.004
Sucrose 0.408 -0.275 -0.064 -0.010
STI -0.063 0.035 1.000 1.000
Drought stress ? GB
Proline 0.079 0.071 0.137 -0.225
Choline -0.240 -0.026 -0.164 0.233
Glycine
betaine
-0.580* 0.368 0.001 0.218
Sucrose -0.077 0.110 0.074 0.262
STI 0.035 0.243 1.000 1.000
* Significant at 5 % level of significance. Significant correlation
(P B 0.05) suggested the dependence of one component on the other
or in other terms as one component determined the level of other
component. Moreover, significant negative correlation indicated that
the studied components were related to each other in a way that
increase in one component decreases the value of other component.
226 Plant Growth Regul (2014) 72:221–228
123

is a precursor of GB and reduction in its levels due to
exogenous GB application may be explained by presence
of a feed-back loop. Significant increase in RWC and STI
was observed in case of GB sprayed plots which seemed
due to OA in these wheat genotypes. But non-significant
correlation of osmolytes levels (such as proline, choline
and sucrose) with RWC and STI, at both the stages under
GB sprayed and non sprayed drought stressed conditions
indicated that production of these osmolytes could be a
consequence of stress rather than a metabolic response.
Moreover GB content of sprayed plots and RWC were
negatively correlated at maximum tillering stage. No
relationship between them was observed at anthesis.
Interestingly, GB content of drought stressed plots at
maximum tillering stage was negatively correlated with
STI which suggested that enhancement in GB levels could
decrease the tolerance index, thus may cause yield reduc-
tions under stress. This was in contrast to results obtained
with GB spray under drought stress where enhanced levels
of GB and increased STI were observed, although no
correlation existed between them. The reason behind this
response of GB to STI under non-sprayed and GB sprayed
condition is unclear. It could be hypothesized that accu-
mulated osmolytes might be involved in some downstream
metabolic processes of signal transduction under drought
stress. There may be a possibility that GB accumulation
could have some indirect effects on STI via changes in
sucrose metabolism etc., under drought stress which in turn
affected dry matter accumulation. Previous studies on
maize (Bolanos and Edmeades 1991) and barley (Grumet
et al. 1987) also reported that correlation between OA and
performances under drought were weak, inconsistent and
non-significant. Our results supported reviewed studies on
OA by Serraj and Sinclair (2002), who suggested that
under natural stress environments, stress is not lethal to
affect plant survival where osmoprotection could play a
role. OA could cause osmoprotection, turgor maintenance
and dehydration avoidance at severe stress level which
might threaten plant survival. Such severe stress levels
could result in loss of crop yield capability and crop yields
will be low. If OA operate in leaves, resulting in turgor
maintenance causing leaf area expansion, delay in leaf
wilting and rolling, delayed stomatal conductance, then
there would be increased risk of exhausting soil water
under drought stress and high rates of plant dehydration
would be sustained. This would result in leaf and plant
death when the threshold level of lethal RWC reaches.
Thus in conclusion, our results suggested that OA in
leaves was not responsible in causing tolerance to drought
and for yield benefits in wheat under drought stress. So OA
could not be considered as a selection criteria for drought
tolerance in wheat. There is a need for a more precise
research on osmotic adjustment via these compatible
solutes and their exogenous application to alleviate various
abiotic stresses.
Acknowledgments This work was supported by Council of Scien-
tific and Industrial Research (Project No. 09/272/0129-EMR-I), New
Delhi, India.
References
Alia, Kondo Y, Sakamoto A, Nonaka H, Hayashi H, Pardha PS, Chen
THH, Murata N et al (1999) Enhanced tolerance to light stress of
transgenic Arabidopsis plants that express the codA gene for a
bacterial choline oxidase. Plant Mol Biol 40:279–288
Allakhverdiev SI, Hayashi H, Nishiyama Y, Ivanov AG (2003)
Glycine betaine protects the D1/D2/Cyt559 complex of photo-
system II against photo-induced and heat-induced inactivation.
J Plant Physiol 160:41–49
Bates LS, Waldren RP, Teare ID (1973) Rapid determination of free
proline for water stress studies. Plant Soil 39:205–207
Blunden G, Yang M, Janicsak M, Mathe I, Carabot-Cuervo A (1999)
Betaine distribution in the Amaranthaceae. Biochem Syst Ecol
27:87–92
Bohnert HJ, Jensen RG (1996) Metabolic engineering for increased
salt tolerance—the next step. Aust J Plant Physiol 23:661–666
Bohnert HJ, Nelson DE, Jensen RG (1995) Adaptations to environ-
mental stresses. Plant Cell 7:1099–1111
Bolanos J, Edmeades GO (1991) Value of selection for osmotic
potential in tropical maize. Agron J 83:948–956
Diaz-Zorita M, Fernandez-Canigia MV, Grosso GA (2001) Applica-
tions of foliar fertilizers containing glycinebetaine improve
wheat yields. J Agron Crop Sci 186:209–215
Gorham J (1996) Glycinebetaine is a major nitrogen containing solute
in Malvaceae. Phytochemistry 43:367–369
Grieve CM, Grattan SR (1983) Rapid assay for determination of
water soluble quaternary ammonium compounds. Plant Soils
70:303–307
Grumet R, Albrechtsen RS, Handon AD (1987) Growth and yield of
barley isopopulations differing in solute potential. Crop Sci
27:991–995
Liang C, Zhang XY, Luo Y, Wang GP, Zou Q, Wang W (2009)
Overaccumulation of glycine betaine alleviates the negative
effects of salt stress in wheat. Russ J Plant Physiol 56:370–376
Ludlow MM, Muchow RC (1990) A critical evaluation of traits for
improving crop yields in water limited environments. Adv Agron
43:107–153
Ma QQ, Wang W, Li YH, Li DQ, Zou Q (2006) Alleviation of photo
inhibition in drought stressed wheat (Triticum aestivum) by foliar
applied glycine betaine. J Plant Physiol 163:165–175
Ma XL, Wang YJ, Xie SL, Wang C, Wang W (2007) Glycinebetaine
application ameliorates negative effects of drought stress in
tobacco. Russ J Plant Physiol 54:472–479
Mohanty A, Kathuria H, Ferjani A, Sakamoto A, Mohanty P, Murata
N, Tyagi AK (2002) Transgenics of an elite indica rice variety
Pusa Basmati1 harbouring the codA gene are highly tolerant to
salt stress. Theor Appl Genet 106:51–57
Park EJ, Jeknic Z, Pino MT, Murata N, Chen THH (2007)
Glycinebetaine accumulation is more effective in chloroplasts
than in the cytosol for protecting transgenic tomato plants
against abiotic stress. Plant Cell Environ 30:994–1005
Rajasekaran LR, Kriedemann PE, Aspinall D, Paleg LG (1997)
Physiological significance of proline and glycinebetaine: main-
taining photosynthesis during NaCl stress in wheat. Photosyn-
thetica 34:357–366
Plant Growth Regul (2014) 72:221–228 227
123

Raza SH, Athar HR, Ashraf M, Hameed A (2007) Glycinebetaine
induced modulation of antioxidant enzyme activities and ion
accumulation in two wheat cultivars differing in salt tolerance.
Environ Exp Bot 60:368–376
Rhodes D, Hanson AD (1993) Quaternary ammonium and tertiary
sulfonium compounds in higher plants. Ann Rev Plant Physiol
Plant Mol Biol 44:357–384
Roe JH, Epstein JH, Goldstein NP (1949) A photometric method for
the determination of insulin in plasma and urine. J Biol Chem
178:839–845
Sakamoto A, Alia, Murata N (1998) Metabolic engineering of rice
leading to biosynthesis of glycinebetaine and tolerance to salt
and cold. Plant Mol Biol 38:1011–1019
Sakamoto A, Murata N (2002) The role of glycine betaine in the
protection of plants from stress: clues from transgenic plants.
Plant Cell Environ 25:163–171
Serraj R, Sinclair TR (2002) Osmolyte accumulation: can it really
help increase crop yield under drought conditions? Plant Cell
Environ 25:333–341
Trethowan RT, Reynolds MP (2007) Drought resistance: genetic
approaches for improving productivity under stress. In: Buck
HT, Nisi JE, Salomon N (eds) Wheat production in stressed
environments. Developments in plant breeding, vol 12. Springer,
New York, pp 289–299
Wang GP, Zhang XY, Li F, Luo Y, Wang W (2010) Over
accumulation of glycine betaine enhances tolerance to drought
and heat stress in wheat leaves in the protection of photosyn-
thesis. Photosynthetica 48:117–126
Yang WJ, Rich PJ, Axtell JD, Wood KV, Bonham CC, Ejeta G,
Mickelbart MV, Rhodes D (2003) Genotypic variation for
glycine betaine in sorghum. Crop Sci 43:162–169
Zhang J, Nguyen HT, Blum A (1999) Genetic analysis of osmotic
adjustment in crop plants. J Exp Bot 50:291–302
Zhao XX, Ma QQ, Liang C, Fang Y, Wang YQ, Wang W (2007)
Effect of glycinebetaine on function of thylakoid membranes in
wheat flag leaves under drought stress. Biol Plant 51:584–588
228 Plant Growth Regul (2014) 72:221–228
123