Embed Size (px)
Citation preview

C. Lerot, F. Hendrick, I. De Smedt, T. Stavrakou, J.-F. Müller and M. Van Roozendael
DOAS seminar – 13 March 2015
Glyoxal vertical columns retrievals from OMI and GOME-2A observations
Work in progress

Outline
• Introduction – glyoxal in the atmosphere
• Glyoxal column retrievals from space nadir sensors:
- Main features of the algorithm v2010
- Algorithmic changes
- GOME-2/OMI consistency
• First validation results in Xianghe and Bujumbura.
• Glyoxal : Formaldehyde ratio.
• Summary

Introduction
CHOCHO
Oxidation of NMVOCs
Direct emissions from fuel combustion biomass burning
Photolysis
OH oxidation
Conversion to SOA
Dry and wet deposition
Sources Sinks
Anthr.(i), 26%
Fires (d), 12%
Fires (i), 8%
Anthr.(d), 3% Biog.
51%
Glyoxal atmospheric lifetime: 2-4 h.

Interest of Measurements
» VOCs play an important role in air quality issues (e.g. production of tropospheric ozone in polluted environments)
» With a small lifetime, glyoxal is an indicator of short-lived NMVOCs Additional constraints for the quantification of their emissions.
» Combined with measurements of other short-lived VOCs, it offers the potential to better distinguish anthropogenic, biogenic and pyrogenic NMVOC emissions (e.g. CHOCHO:HCHO ratio).
» Glyoxal influences the atmospheric radiative budget as it is recognized as a significant source of secondary organic aerosols (SOA) Constraints for the quantification of SOA production.
» Importance to have global and high spatial resolution observations to identify local emissions and their spatial structures.

Satellite retrievals of glyoxal
- Original algorithm for GOME-2A developed in 2009 (Lerot et al., ACP, 2010).
2 main steps:
1. Slant column retrieval from measured reflectances
2. Conversion to vertical columns: • Background correction procedure using Pacific reference sector.
• Conversion factor (AMF) calculations require radiative transfer
simulations (with LIDORT) and a-priori profiles provided by the CTM
IMAGES.
Absorption
cross-sections (s)
CHOCHO +
O3, NO2, H2O, O4, Ring
+ liquid water
Gly
oxal
Cro
ss-s
ecti
on
X 10-19 [cm²/molec]
Wavelength [nm]
Typical optical density: ~ 1-3 x 10⁻⁴ one order of magnitude smaller than other species Very sensitive to spectral interferences. Individual measurements are useless;
averaging needed.

Spectral interferences between glyoxal and liquid water
absorption cross-sections.
Liquid Water Optical density in Dec. 2008
Glyoxal SCD in Dec. 2008
No liquid water With liquid water
1. Liquid Water Optical Density retrieval (405 – 490 nm)
2. Glyoxal slant column retrieval (435 – 460 nm)
Input for step 2
Liquid water optical density retrievals
Satellite retrievals of glyoxal

Multi-annual GOME-2 glyoxal total column global fields
Satellite retrievals of glyoxal
Enhanced glyoxal signal over regions with:
• Important biogenic emissions
• Frequent fire events
• Anthropogenic activities
• Tropical oceans (ongoing debate on the veracity of this signal)

Recent developments
1. Strong focus on GOME-2A/OMI consistency: Application of common settings to both sensors.
2. DOAS fit - Update of cross-section data base. - On-line convolution of cross-sections with a fitted slit function (for GOME-2A). - Daily mean background radiance spectrum as the reference instead of solar spectra.
3. Normalization procedure - Row- or VZA-dependent procedure 4. AMF computation - Over lands: A priori profiles provided by an updated version of the CTM IMAGES. - Over oceans: use of a fixed a priori profile (TORERO). - Extension of the weighting function LUT. - No cloud correction any more, only pixels with CF<0.2 are kept. Reduction of the
influence of the a priori information.
Transfer of an updated version of the algorithm to OMI

Update of cross-section data base
Species Algorithm 2010 Algorithm 2015
CHOCHO Volkamer et al. Volkamer et al.
Ozone GOME FM Brion et al.
NO2 Vandaele et al. (1 XS) Vandaele et al. (2 XS)
O2-O2 Greenblatt et al. Thalman et al.
H2O (vapor) Hitran 2005 Hitran 2010
Ring Based on Kurucz sun spectrum
Based on SAO sun spectrum (2010)
Liquid water Pope et al. Modified Pope et al. + Peters et al. (includes VRS)

Update of cross-section data base
Impact of O4 cross-section
- Spectral interferences between glyoxal and O4 are significant.
- The level of correlation remains unchanged for Thalman et al. compared to Greenblatt.

Update of cross-section data base
Impact of O4 cross-section
Spectral interferences between O4 and Liquid Water
No Liquid water cross-section - Spectral interferences between glyoxal, O4 and the
liquid water cause the low bias in glyoxal columns if liquid water is not included in the DOAS fit.

Update of cross-section data base
Impact of O4 cross-section
Spectral interferences between O4 and Liquid Water
Liquid water absorption fixed
- Spectral interferences between glyoxal, O4 and the liquid water cause the low bias in glyoxal columns if liquid water is not included in the DOAS fit.
- With liquid water included in the fit, the O4 SCDs increase in remote oceans, leading to more realistic glyoxal columns.
- Using Thalman et al. data, the LW-O4 correlation is slightly reduced, which leads to smaller glyoxal columns over oceans (field somewhat less homogeneous).
- Switching from Greenblatt to Thalman has no significant impact on residuals.

Update of cross-section data base Impact of H2O (vapor) cross-section
GOME-2 Algorithm v2010
- The correlation between glyoxal and water vapor is reduced when using Hitran 2010.
- Large H2O columns are found mostly over tropical oceans.
This update leads to a reduction of glyoxal columns over equatorial oceans.

Update of cross-section data base Treatment of liquid water absorption (Peters et al., AMT, 2014)
Their findings: • Over remote oceans, spectral structures are introduced by liquid water absorption
and VRS. The two effects are impossible to disentangle. • The Pope et al. liquid water cross-section has been measured at low resolution (~7
nm) and is thus imperfect.
• Fitting an intensity offset accounts for high-frequency structures introduced by VRS.
• They measured with a MAX-DOAS a residual liquid water cross-section to be used in combination with the Pope et al. data. This cross-section accounts for imperfections in Pope et al. cross-sections and for broad-band structures caused by VRS.
All liquid water effects considered by the fit of two cross-sections + offset
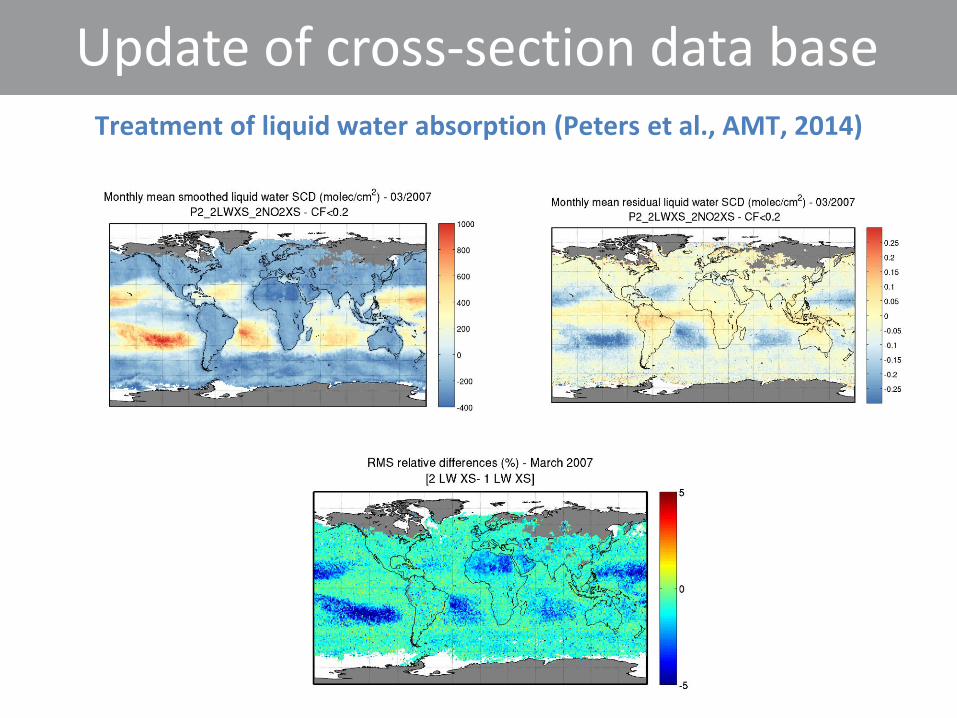
Update of cross-section data base Treatment of liquid water absorption (Peters et al., AMT, 2014)

Update of cross-section data base Treatment of liquid water absorption (Peters et al., AMT, 2014)
• Residuals slightly improved over remote oceans.
• The main impact is a reduction of the glyoxal SCD latitudinal dependence, mostly due the impact on O4 SCDs (again!).
Relative reduction of the equatorial oceanic glyoxal signal.
Cloud correction: two approaches
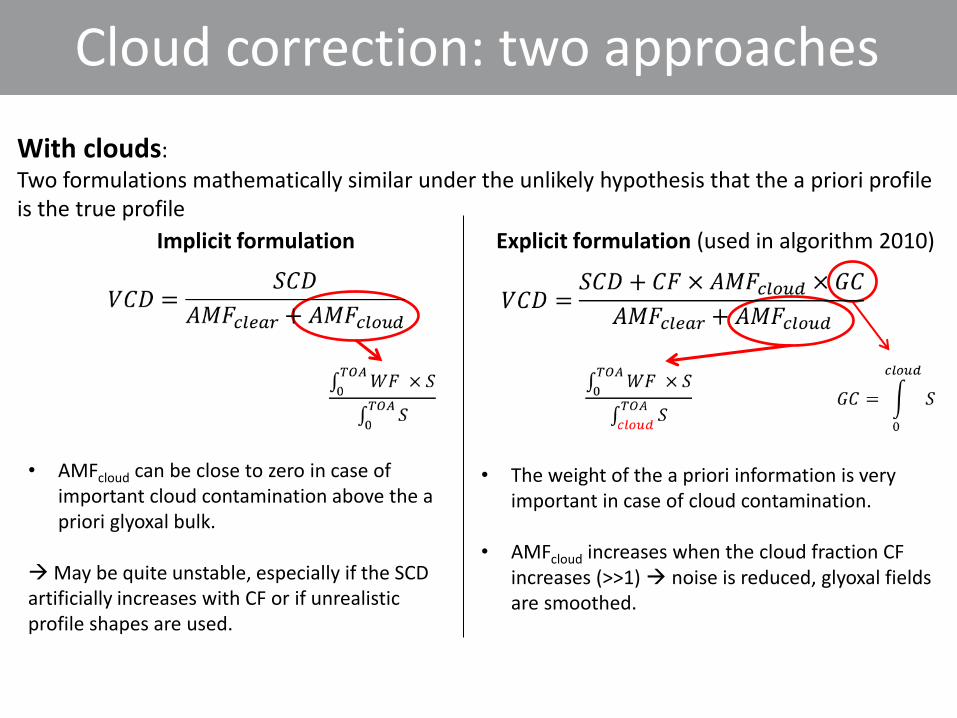
With clouds:
Two formulations mathematically similar under the unlikely hypothesis that the a priori profile is the true profile
Implicit formulation Explicit formulation (used in algorithm 2010)
• AMFcloud can be close to zero in case of
important cloud contamination above the a priori glyoxal bulk.
May be quite unstable, especially if the SCD artificially increases with CF or if unrealistic profile shapes are used.
• The weight of the a priori information is very important in case of cloud contamination.
• AMFcloud increases when the cloud fraction CF increases (>>1) noise is reduced, glyoxal fields are smoothed.

Cloud correction: two approaches
CF <0.4
Impact of the two methods: illustration on August 2007
1. Explicit formulation (old retrieval settings)
CF <0.4 – Ghost column removed
No cloud correction – CF <0.2 • A significant part of the column comes from the ghost column, provided by the IMAGES profile below the cloud.
• The a priori information may be biased (e.g. US in this example)
• Using the explicit formulation leads to smoother glyoxal fields, but maybe not more realistic.

Cloud correction: two approaches Impact of the two methods: illustration on August 2007
2. Implicit formulation (old retrieval settings)
No cloud correction – CF <0.2
• The implicit formulation leads to artifacts due to the increase of the glyoxal SCDs when the cloud fractions increase.
• The a priori profile shapes used for the AMF computation are inconsistent with such an increase (AMFs decrease when cloud fractions increase) Unstable correction.
Best option: No cloud correction and filter for pixels with CF>20%.
Implicit formulation – CF <0.4

GOME-2A: Impact of all changes
GOME-2 Algorithm v2010 GOME-2 Algorithm v2015
• General decrease of tropical glyoxal columns (there was a strong bias compared to IMAGES in that region).
• Oceanic columns significantly reduced. HUGE sensitivity to the DOAS settings and cross-sections used.
Drawing conclusions on oceanic glyoxal from satellite observations should be done extremely cautiously.
• Slight VZA dependence still visible for a few months, despite the VZA-dependent normalization.
Comparison of the GOME-2 and OMI glyoxal fields
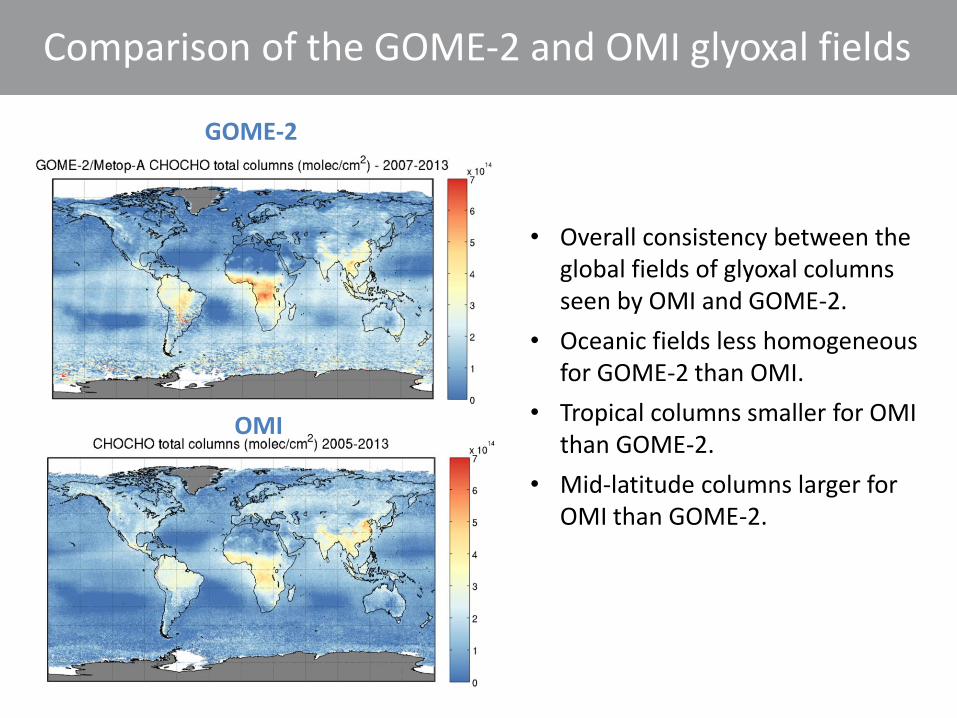
GOME-2
OMI
• Overall consistency between the global fields of glyoxal columns seen by OMI and GOME-2.
• Oceanic fields less homogeneous for GOME-2 than OMI.
• Tropical columns smaller for OMI than GOME-2.
• Mid-latitude columns larger for OMI than GOME-2.

Comparison of the GOME-2 and OMI glyoxal fields
• Overall consistency between the global fields of glyoxal columns seen by OMI and GOME-2.
• Oceanic fields less homogeneous for GOME-2 than OMI.
• Tropical columns smaller for OMI than GOME-2.
• Mid-latitude columns larger for OMI than GOME-2.

Comparison of the GOME-2 and OMI glyoxal fields
Tropical regions (1)

Comparison of the GOME-2 and OMI glyoxal fields
Tropical regions (2)

Comparison of the GOME-2 and OMI glyoxal fields
Mid-latitude regions
• Overall good consistency between the two products. • Mean tropical glyoxal columns larger in the morning (GOME-2) than in the early
afternoon (OMI). At mid-latitudes, the OMI columns are slightly larger than the GOME-2 columns.
• At mid-latitudes, the consistency is less good. For example, seasonalities in Europe and Northern US are less visible in GOME-2 data (could it be real?).
• The OMI glyoxal product is very stable over the entire mission lifetime on contrary to the GOME-2A product, which is more affected by instrumental degradation.

First validation results in Xianghe
SH=0.5 km a priori
SH=1.0 km a priori
• MAX-DOAS analyses carried out by Michel (DOAS inversion) and François (OE analyses).
• Focus on OMI data (ovp dist=100 km).
• Seasonality very similar in OMI and MAX-DOAS retrievals.

First validation results in Xianghe
• MAX-DOAS analyses carried out by Michel (DOAS inversion) and François (OE analyses).
• Focus on OMI data (ovp dist=100 km).
• Seasonality very similar in OMI and MAX-DOAS retrievals.
• Application of AKs further improves the agreement between the satellite and MAX-DOAS columns (for SH=0.5km)
• The a priori profile shape used in bePRO analyses impacts the final MAX-DOAS columns (investigation on-going):
- Best agreement with OMI when using SH=0.5km.
- bePRO analyses of better quality with SH=0.5km.
- Unexplained discrepancy between bePRO and the geometrical approximation
SH=0.5 km a priori
SH=1.0 km a priori
SH=0.5 km a priori
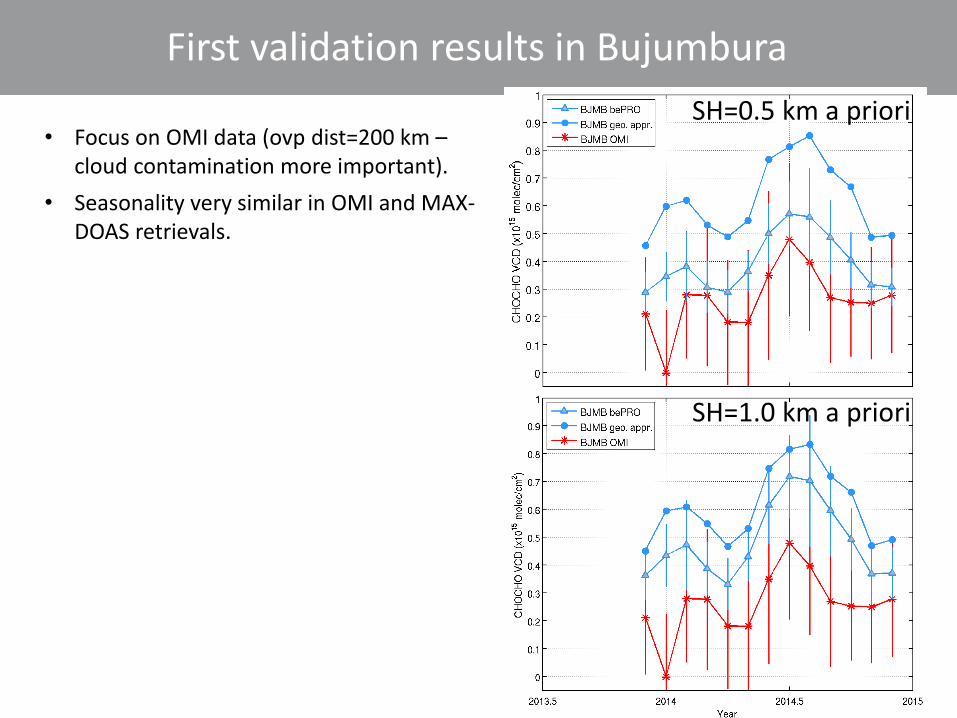
First validation results in Bujumbura
• Focus on OMI data (ovp dist=200 km – cloud contamination more important).
• Seasonality very similar in OMI and MAX-DOAS retrievals.
SH=1.0 km a priori

First validation results in Bujumbura
• Focus on OMI data (ovp dist=200 km – cloud contamination more important).
• Seasonality very similar in OMI and MAX-DOAS retrievals.
• Application of AKs further improves the agreement between the satellite and MAX-DOAS columns (for SH=0.5km and SH=1km). This should be refined by better accounting of the orography.
• The a priori profile shape used in bePRO analyses impacts the final MAX-DOAS columns (investigation on-going):
- Best agreement with OMI when using SH=0.5km.
- bePRO analyses of similar quality for both SH values.
- Unexplained discrepancy between bePRO and the geometrical approximation
SH=0.5 km a priori
SH=1.0 km a priori

OMI CHOCHO:HCHO ratio R
• R increases in regions dominated by anthropogenic and pyrogenic emissions.

OMI CHOCHO:HCHO ratio R
• R increases in regions dominated by anthropogenic and pyrogenic emissions.
With MERIS fire counts superimposed

OMI CHOCHO:HCHO ratio
Previous studies on this ratio: 1. Vrekoussis et al. (2010) – based on GOME-2:
• R < 0.04 in urban areas • R > 0.06 in rural environments
2. Di Gangi et al. (2012) – based on in situ
measurements during two campaigns: • R < 0.02 for biogenic regimes • R ~= 0.025-0.035 for polluted air masses • R further increased during two biomass
burning events. • They point to the inconsistency with the
Vrekoussis et al. results.
Our measurements are much more consistent with the Di Gangi et al. results.
Summary
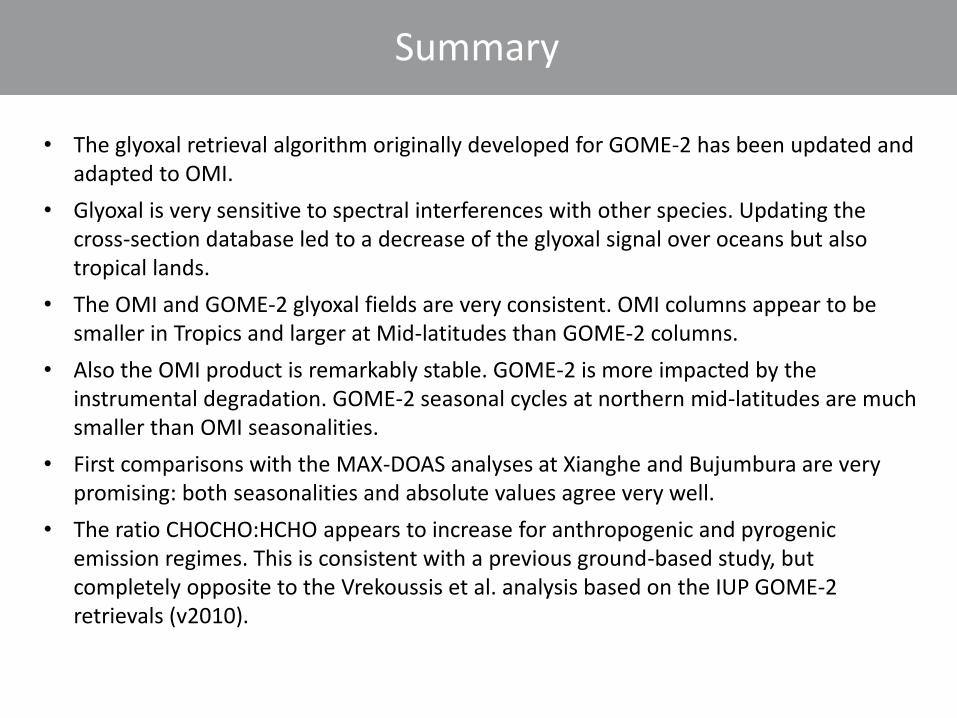
• The glyoxal retrieval algorithm originally developed for GOME-2 has been updated and adapted to OMI.
• Glyoxal is very sensitive to spectral interferences with other species. Updating the cross-section database led to a decrease of the glyoxal signal over oceans but also tropical lands.
• The OMI and GOME-2 glyoxal fields are very consistent. OMI columns appear to be smaller in Tropics and larger at Mid-latitudes than GOME-2 columns.
• Also the OMI product is remarkably stable. GOME-2 is more impacted by the instrumental degradation. GOME-2 seasonal cycles at northern mid-latitudes are much smaller than OMI seasonalities.
• First comparisons with the MAX-DOAS analyses at Xianghe and Bujumbura are very promising: both seasonalities and absolute values agree very well.
• The ratio CHOCHO:HCHO appears to increase for anthropogenic and pyrogenic emission regimes. This is consistent with a previous ground-based study, but completely opposite to the Vrekoussis et al. analysis based on the IUP GOME-2 retrievals (v2010).