Embed Size (px)
Citation preview
RussiaMining
Norilsk Nickel
Fleming UCB Research
US$2.40
year-end december 1997 1998 1999e 2000e
financialsSales (US$m) 3,111 2,579 3,140 3,633EBIT (US$m) 298 312 1,700 2,100Net income (US$m) –723 –86 805 1,100EPS (US$) –4.6 –0.5 4.3 5.8CFPS (US$) 1.4 1.0 5.3 7.1
ratiosRoCE (%) 2.2 7.4 14.9 18.5RoE (%) –6.0 –2.4 15.3 17.1Gearing (%) 7.2 15.6 13.6 10.5
valuationPER (x) na na 0.6 0.4EV/sales (x) 0.5 0.3 0.2 0.0EV/EBITDA (x) 3.0 1.9 0.3 0.0PCFR (x) 1.7 2.5 0.5 0.3
performance 1 month 3 months 12 months
Absolute (%) –14.81 –30.81 +367.54Relative to RTS (%) +5.45 +16.46 +103.2
share price and price relative
1996 1997 1998 19990
2
4
6
8
10
12
Buy
Positive
market cap US$454m
nav per shareUS$22.9
no of shares189m
rts – us$ index84.50
reutersNKEL.RTSx
bloombergNKEL$ RU
free float35%
Share price and
related multiples in
this note are as at
5 October 1999.
Alexei Yazikov +44 171 382 [email protected]
Fleming UCB ZAO
Romanov Pereulok 4, Moscow 103875Telephone +7 095 967 1000Facsimile +7 095 967 1001
•
•
•
•
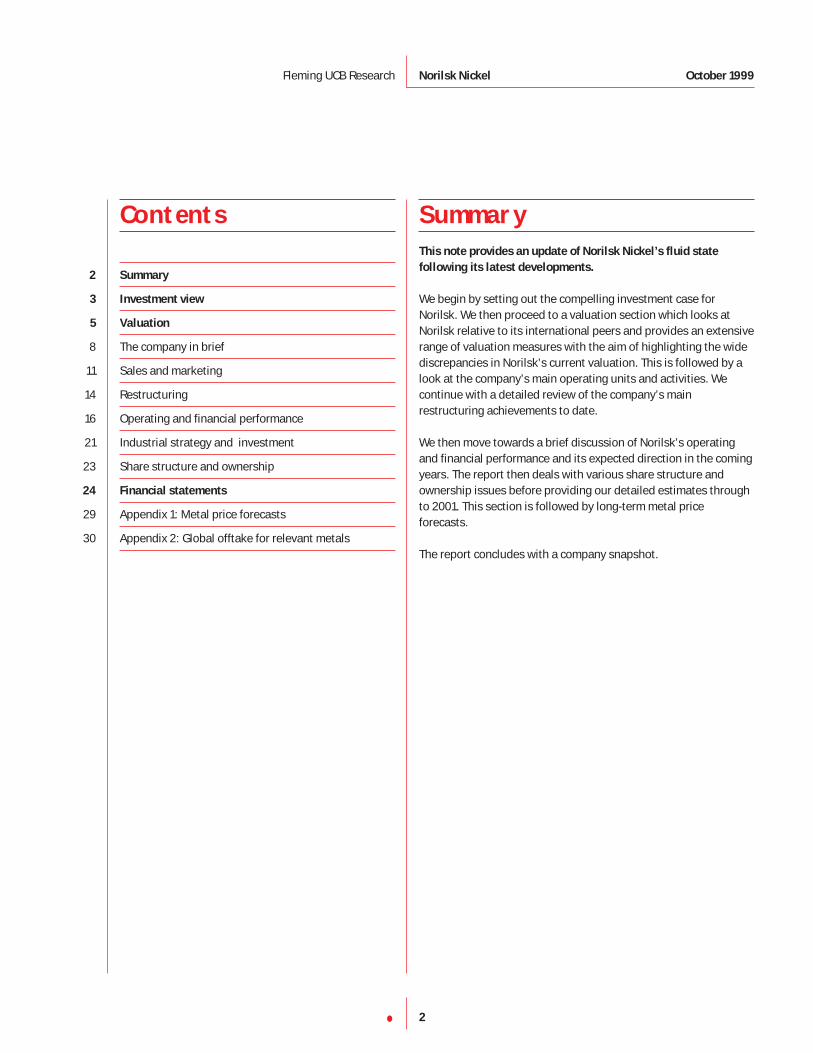
The discreet charmof metallurgyNorilsk Nickel’s devaluation-linkedwindfall profits, a faster-than-expectedrestructuring process and an improvingoutlook for the metal market lead us toreview and upgrade our earnings forecast.
The changes in Norilsk’s overallprofitability are remarkable: in 1998, itsoperating margin nearly doubled YoY from22.6% to 41.9%. We expect even moreexciting results this year due to full-yeardevaluation gains, metal price recovery,continued restructuring efforts and higherproduction of PGMs. Our calculationsshow that revenues from by-productsessentially cover the company’s entirecash costs, ie Norilsk is currentlyproducing nickel for free.
Norilsk shares are now well correlated tothe Russian market, although theirliquidity is lower than other blue-chipstocks. Norilsk’s share price is up 350%since January, outperforming the RTS byalmost 90%. However, the stock is stillbelow any reasonable valuation measures.
Norilsk’s valuations are outstanding evenby Russian standards, with 1999e PCFR of0.5x and 1999e PER of 0.6x. Norilsk’scurrent market cap appears to discount atruly horrendous scenario and earningsand cash flow multiples offer unique value.
5 October 1999
SummaryThis note provides an update of Norilsk Nickel’s fluid state
following its latest developments.
We begin by setting out the compelling investment case forNorilsk. We then proceed to a valuation section which looks atNorilsk relative to its international peers and provides an extensiverange of valuation measures with the aim of highlighting the widediscrepancies in Norilsk’s current valuation. This is followed by alook at the company’s main operating units and activities. Wecontinue with a detailed review of the company’s mainrestructuring achievements to date.
We then move towards a brief discussion of Norilsk’s operatingand financial performance and its expected direction in the comingyears. The report then deals with various share structure andownership issues before providing our detailed estimates throughto 2001. This section is followed by long-term metal priceforecasts.
The report concludes with a company snapshot.
Contents
Summary
Investment view
Valuation
The company in brief
Sales and marketing
Restructuring
Operating and financial performance
Industrial strategy and investment
Share structure and ownership
Financial statements
Appendix 1: Metal price forecasts
Appendix 2: Global offtake for relevant metals
2
3
5
8
11
14
16
21
23
24
29
30
2•
Fleming UCB Research Norilsk Nickel October 1999
Investment viewMany investors continue to follow the events at Norilsk mainly
for their direct impact on the metal markets and their indirect
impact on the earnings prospects and valuations of more
traditional mining investments. However, the combin ation of
Norilsk’s continued progress on the restructuring front, the
weakening equity market and windfall profits from the rouble
devaluation lead us to believe that Norilsk is a must in a
diversified Russian portfolio.
The changing picture
Investors should not be trapped into believing that Norilsk isstatic. The company is indeed still riddled with severe problems,ranging from outdated metallurgical facilities to cripplingoveremployment and social costs. However, since taking overNorilsk’s day-to-day control more than three years ago, thecompany’s management has made significant headway intoturning the Soviet era industrial giant into a profit-orientedcompany.
To meet these challenges and regain investor attention, Norilskhas had to define clearly an industrial strategy firmly establishingthe principle of profit maximisation. By mid-1997, the completedprivatisation of the state’s control package had established a clearownership picture which paved the way for an intensifiedrestructuring effort. By the end of 1998, Norilsk had considerablystrengthened its financial position by successfully restructuringfederal and regional budget debts and taking control of its PGMrevenues. Although much remains to be done, Norilsk has alreadytaken important steps in the restructuring process.
Greater control over sales
After setting up a successful export business in the first half of the1990s, Norilsk finally established near-total control over its PGMsales in 1998–1h99. PGM sales represent revenues ofapproximately US$0.8bn–US$0.9bn per year, and, until mid–1997,were subject to a near-arbitrary control by the state. The Primakovgovernment eventually granted Norilsk a 10-year palladium exportquota – a significant improvement on the previous one-year quota.Furthermore, in March 1999 Norilsk Nickel acquired 100% ofInterrosimpex, its main trading partner for base metals, from theInterros group, thus securing control of its own export sales.
Employee reductions
During 1998, Norilsk reduced its workforce by more than 12%. Afurther 10%–11% employee reduction should take place this year,bringing Norilsk’s workforce to 100,000 by the end of the year. Thisprocess should lead to annual labour cost savings of aboutUS$120m in the next three years (year-end 1998 wage levels).
An extensive investment programme
Norilsk’s management is set to begin the implementation of acoherent industrial strategy. This will involve an investmentprogramme to increase the operating and technological level ofthe group’s facilities to international standards. While Norilsk hasoutlined a range of investment projects, costing roughly US$3bnover the next 10 years, the most immediate priorities will requirefunding of US$1.5bn over the next three to four years. Thecompany’s proposed development strategy to 2010 implies thatNorilsk will concentrate on cost-cutting measures, rather than onincreasing production. All in all, given the evidence we have of thecompany’s strengthening financial position, the development of itslong-term industrial strategy, combined with some level of lastingcompetitive benefits from the devaluation of the rouble, webelieve that there is a strong case to support a continuation ofsmooth, increasingly efficient operations.
Earnings growth at last
As one of Russia’s largest exporters, Norilsk benefited enormouslyfrom the rouble devaluation in August 1998. Norilsk exports over90% of its production, and with a cost base which is more than90% rouble-denominated, this means that Norilsk is currentlygenerating large positive cash flows. The rouble devaluation alsogreatly eased Norilsk’s debt problems, as the bulk of its debts arerouble-denominated.
The changes in Norilsk’s overall profitability are remarkable: in1998 operating margin nearly doubled YoY from 22.6% to 41.9%.We expect even more exciting results this year due to full-yeardevaluation gains, metal price recovery, continued restructuringefforts and higher production of PGMs. We believe that, even withour prudent forecast for metal prices, Norilsk will be able toachieve a 15.6% average rise in US dollar sales over the next threeyears. But the largest increase can be expected in net earnings,which we believe will rise from 1998’s loss of around US$86m toan astonishing US$1,251m profit by the end of 2001.
3•
Fleming UCB Research
Investment view
Norilsk Nickel October 1999
Effect of economic crisis
As well as having a positive influence on Norilsk’s finances,Russia’s default/devaluation crisis inflicted a blow to some ofNorilsk’s restructuring plans, as it is set to slow down thecompany’s investment programme and delay the transfer offunding of Norilsk’s social assets until at least late 2000.Furthermore, the World Bank-funded US$500m programme torelocate 70,000 Norilsk employees has been delayed and Norilsknow either has to fund the programme from its own funds orpostpone it until better times. On the other hand, those negativedevelopments were more than offset by the massive benefits fromthe rouble devaluation.
Risks associated with the stock are largely exaggerated
For portfolio investors, it is not enough that Norilsk is restructuringand that its operations are running smoothly. With the currentpolitical turmoil in Russia, investors are now questioning theownership of the underlying assets and the revenues theygenerate.
Many of the threats to reverse privatisation which are currentlybeing made by various opposition politicians are targetingcontrolling share blocks in some of Russia’s most lucrativecompanies, including Norilsk, which were acquired by favouredbanks or company managers through a controversial ‘shares-for-loans’ programme. This programme enabledUneximbank to establish management control of Norilsk in early1996 and Interros (Uneximbank’s investment arm) to purchase thestate’s control block in August 1997 f0r the equivalent of US$12.90per share, or for a total of US$620m. While the privatisation ofNorilsk had many faults in terms of openness and transparency,the tender did compare favourably as regards to fair pricing asroughly 85% of the market price at the time was paid. Since anyprivatisation reversal programme must compensate shareholders,the fair pricing of August 1997 and the considerable budgetfunding required should, in effect, rule out such a scenario. Shouldthe privatisation deal be reversed (ie, the state regains thecontrolling stake in the company) the impact of it on minorityshareholders would not be drastic: at its worst, it would meanradical changes in the current progressive management of thecompany.
Having said that, there are other ways to skin a cat, and measuressuch as increased taxes, or export duties, would have a heavy tollon Norilsk Nickel’s performance. Should such measures breakthrough the determined resistance of the corporate sector, muchof the windfall gains from devaluation currently being earned byexporters would, in effect, be expropriated. The current price levelwould suggest that the market is pricing in the worst-casescenario, tantamount to over half of Norilsk’s future revenuesbeing expropriated – hardly a plausible situation. Needless to say,the implementation of such ‘robbery measures’ would bring abouta crash in the remaining equity market.
An enticing valuation
To say that Norilsk’s shares are undervalued is an understatement.The current undemanding valuations clearly fail to take intoaccount both Norilsk’s considerable ongoing restructuring effortand the windfall profits it is set to earn from devaluation. Even thecurrent tough market conditions (27.1% risk-free rate, using thebenchmark 30-year Russian Eurobond yield), the unstable politicalsituation in the country and specific risks associated with the stockcannot fully justify the enormous discount at which the stock istrading relative to its international peers. Moreover, Norilsk’svaluations are outstanding even by Russian standards: with 1999ePCFR of 0.5x and 1999e PER of 0.6x on most of the multiplesNorilsk is valued lower than any company in Fleming UCB’sresearch universe. While investors’ concern about the stock isunderstandable, the current price implies a truly horrendous butfar-fetched scenario.
From the discussion above, we conclude that the discount at whichNorilsk shares are trading is far too big and, while the market ispricing in all of the concerns associated with the stock, thevaluation fails to take into account the company’s enormouspotential.
4•
Fleming UCB Research
Investment view
Norilsk Nickel October 1999
ValuationDifficult to set a target price
It goes without saying that Norilsk Nickel is undervalued. Thecurrent EV/sales of just 0.4x and forward 1999 PER of 0.5x speakfor themselves. However, it is difficult to set a target price forNorilsk’s shares: investors’ negative perception of the companyand the stock’s relatively low liquidity make Norilsk a special caseamong Russian blue chips. The aim of our valuation section is tohighlight the extent to which the stock is undervalued in bothrelative and absolute terms.
DCF valuation
Our DCF valuation is based on a detailed forecast which runs until2005. We assume that production volumes will increase slowlyover the forecast period, with further emphasis on higher PGMproduction in line with the industrial strategy adopted by thecompany, and that they will remain at an average 1999–2001 levelin the long term. The long-term real price forecasts are providedcourtesy of Nick Moore and Larry Kaplan at Flemings Global MiningGroup and presented in appendix 1 on page 29.
Figure 1 Long-term output assumptions
Nickel (’000 tonnes) 231.8
Copper (’000 tonnes) 431.0Cobalt (’000 tonnes) 4.5Platinum (’000 oz) 974.0Palladium (’000 oz) 3,039.4
Source: Fleming UCB
Although we foresee the EBIT margin settling at above 50% at thebeginning of the next century, we intentionally reduced it to 25%when calculating the terminal value, to account for the relativeunpredictability of metal prices, and the changing operating and
economic environment in the long run. We further assume anotional tax rate of 35% and a steady state growth whichincorporates the presumption that capex will equal depreciation.We use the market value for the company’s capital structure toestimate its WACC, using a US$ risk-free rate to a discount of27.1%, which is the current yield on the longest available Russiangovernment bond, and add a 6% equity risk premium.
Figure 3 Main DCF assumptions
US$ risk-free rate (%) 27.1
1999e share of debt (%) (market value) 24.41999e share of equity (%) (market value) 75.61999e debt (US$ m) 1461999e other assets and liabilities (US$m) 596.5Real equity risk premium (%) 6.0Adj beta 1.3Real terminal growth rate (%) 0.0WACC (%) 30.9
Source: Fleming UCB
The results confirm our initial feeling that shares are trading at anenormous discount to the intrinsic value of Norilsk’s lucrativemining operations. Even with the current high country riskpremium, future free cash flows are worth around US$3.5bn in realterms, or US$19 per share. To enhance our analysis, we haveattempted to estimate the conditions justifying the current pricelevel by changing our metal prices assumptions and increasing therate of export tax. Figure 4 shows that the company’s value falls totoday’s dismal market capitalisation of just above US$450m whenbase metals and PGM prices are 40% below our forecast, andwhen the state takes over 40% of export revenue via anoutrageous additional tax burden.
5•
Fleming UCB Research Norilsk Nickel October 1999
Figure 2 Unleveraged free cash flows (US$m)
(US$m) 1999e 2000e 2001e 2002e 2003e 2004e 2005e
Fully taxed EBIT 1,106 1,366 1,511 1,336 1,273 1,275 1,295Depreciation 197 228 291 318 343 374.7 391Unleveraged cash flow 1,303 1,594 1,801.6 1,655 1,617 1,650 1,686Capital expenditure –350 –450 –550 –550 –550 –550 –550Operating working capital –154 –13 19 101 –2 5 4Unleveraged free cash flow 799 1,131 1,270 1,205 1,064 1,105 1,140
Source: Fleming UCB
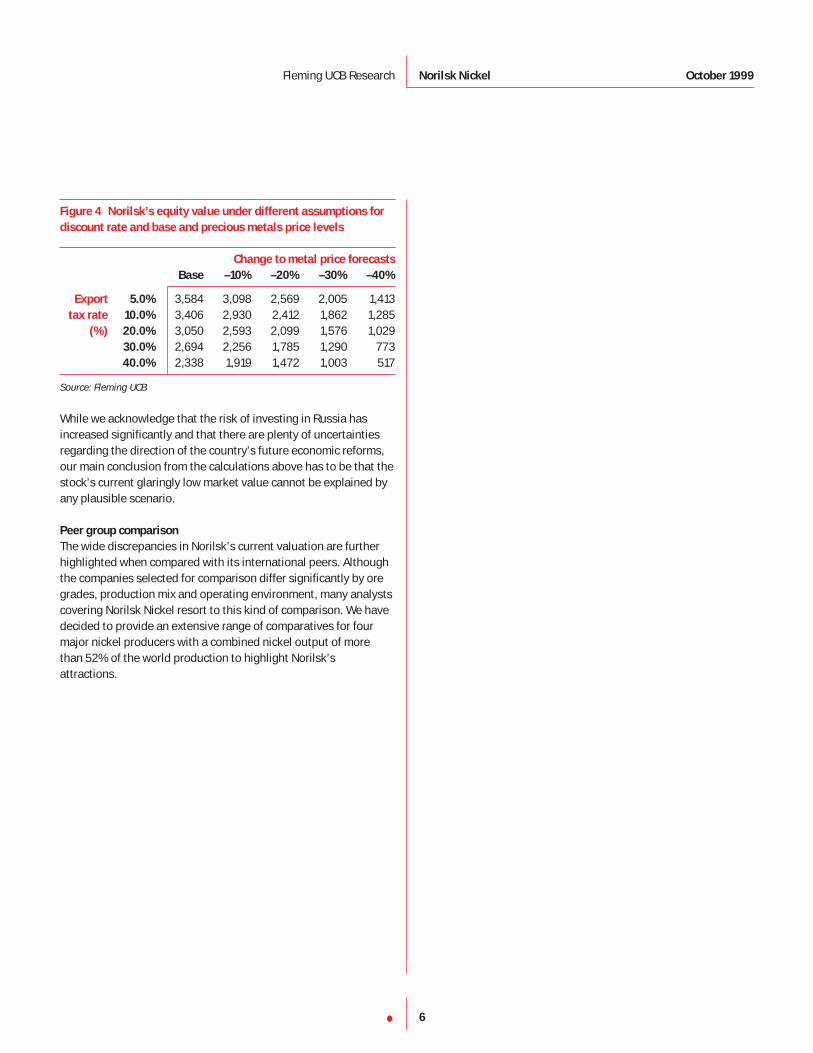
Figure 4 Norilsk’s equity value under different assumptions for
discount rate and base and precious metals price levels
Change to metal price forecasts
Base –10% –20% –30% –40%
Export 5.0% 3,584 3,098 2,569 2,005 1,413tax rate 10.0% 3,406 2,930 2,412 1,862 1,285
(%) 20.0% 3,050 2,593 2,099 1,576 1,02930.0% 2,694 2,256 1,785 1,290 77340.0% 2,338 1,919 1,472 1,003 517
Source: Fleming UCB
While we acknowledge that the risk of investing in Russia hasincreased significantly and that there are plenty of uncertaintiesregarding the direction of the country’s future economic reforms,our main conclusion from the calculations above has to be that thestock’s current glaringly low market value cannot be explained byany plausible scenario.
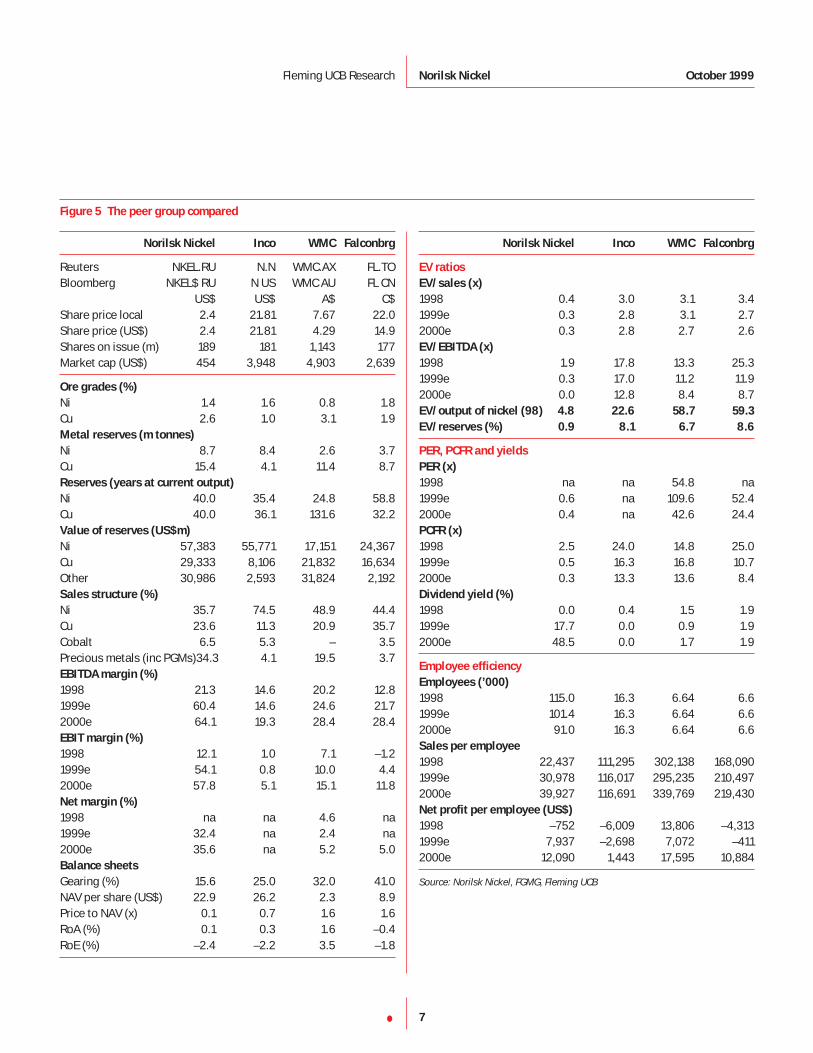
Peer group comparison
The wide discrepancies in Norilsk’s current valuation are furtherhighlighted when compared with its international peers. Althoughthe companies selected for comparison differ significantly by oregrades, production mix and operating environment, many analystscovering Norilsk Nickel resort to this kind of comparison. We havedecided to provide an extensive range of comparatives for fourmajor nickel producers with a combined nickel output of morethan 52% of the world production to highlight Norilsk’sattractions.
6•
Fleming UCB Research Norilsk Nickel October 1999
7•
Figure 5 The peer group compared
Fleming UCB Research Norilsk Nickel October 1999
Norilsk Nickel Inco WMC Falconbrg
Reuters NKEL.RU N.N WMC.AX FL.TOBloomberg NKEL$ RU N US WMC AU FL CN
US$ US$ A$ C$Share price local 2.4 21.81 7.67 22.0Share price (US$) 2.4 21.81 4.29 14.9Shares on issue (m) 189 181 1,143 177Market cap (US$) 454 3,948 4,903 2,639
Ore grades (%)
Ni 1.4 1.6 0.8 1.8Cu 2.6 1.0 3.1 1.9Metal reserves (m tonnes)
Ni 8.7 8.4 2.6 3.7Cu 15.4 4.1 11.4 8.7Reserves (years at current output)
Ni 40.0 35.4 24.8 58.8Cu 40.0 36.1 131.6 32.2Value of reserves (US$m)
Ni 57,383 55,771 17,151 24,367Cu 29,333 8,106 21,832 16,634Other 30,986 2,593 31,824 2,192Sales structure (%)
Ni 35.7 74.5 48.9 44.4Cu 23.6 11.3 20.9 35.7Cobalt 6.5 5.3 – 3.5Precious metals (inc PGMs)34.3 4.1 19.5 3.7EBITDA margin (%)
1998 21.3 14.6 20.2 12.81999e 60.4 14.6 24.6 21.72000e 64.1 19.3 28.4 28.4EBIT margin (%)
1998 12.1 1.0 7.1 –1.21999e 54.1 0.8 10.0 4.42000e 57.8 5.1 15.1 11.8Net margin (%)
1998 na na 4.6 na1999e 32.4 na 2.4 na2000e 35.6 na 5.2 5.0Balance sheets
Gearing (%) 15.6 25.0 32.0 41.0NAV per share (US$) 22.9 26.2 2.3 8.9Price to NAV (x) 0.1 0.7 1.6 1.6RoA (%) 0.1 0.3 1.6 –0.4RoE (%) –2.4 –2.2 3.5 –1.8
Norilsk Nickel Inco WMC Falconbrg
EV ratios
EV/sales (x)
1998 0.4 3.0 3.1 3.41999e 0.3 2.8 3.1 2.72000e 0.3 2.8 2.7 2.6EV/EBITDA (x)
1998 1.9 17.8 13.3 25.31999e 0.3 17.0 11.2 11.92000e 0.0 12.8 8.4 8.7EV/output of nickel (98) 4.8 22.6 58.7 59.3
EV/reserves (%) 0.9 8.1 6.7 8.6
PER, PCFR and yields
PER (x)
1998 na na 54.8 na1999e 0.6 na 109.6 52.42000e 0.4 na 42.6 24.4PCFR (x)
1998 2.5 24.0 14.8 25.01999e 0.5 16.3 16.8 10.72000e 0.3 13.3 13.6 8.4Dividend yield (%)
1998 0.0 0.4 1.5 1.91999e 17.7 0.0 0.9 1.92000e 48.5 0.0 1.7 1.9
Employee efficiency
Employees (’000)
1998 115.0 16.3 6.64 6.61999e 101.4 16.3 6.64 6.62000e 91.0 16.3 6.64 6.6Sales per employee
1998 22,437 111,295 302,138 168,0901999e 30,978 116,017 295,235 210,4972000e 39,927 116,691 339,769 219,430Net profit per employee (US$)
1998 –752 –6,009 13,806 –4,3131999e 7,937 –2,698 7,072 –4112000e 12,090 1,443 17,595 10,884
Source: Norilsk Nickel, FGMG, Fleming UCB
The company in briefMining and processing capacities
Norilsk Nickel is a fully integrated metal company which runsconsolidated nickel mining and metallurgical operations in northSiberia and on the Kola peninsula. The company is made up ofthree principal operating subsidiaries – Norilsk Combine and theSeveronickel and Pechenganickel complexes – as well as variousancillary operations, such as the Olenegorsk engineering plant andthe Gipronickel research institute. We believe that the continuingrestructuring process will result in the further split of Norilsk’smain subsidiaries into separate joint-stock companies, in order tocreate a more efficient management system, reduce administrativeoverheads and enhance the subdivisions’ performance.Unfortunately, radical improvement in Norilsk Nickel’sorganisational structure is difficult to achieve because of the needto finance the huge non-production infrastructure attached to thecompany.
Norilsk Combine (NGMK) forms the core of Norilsk Nickel’s miningoperations. It currently runs six underground mines and one openpit on the Taimyr peninsula in north Siberia, two ore-dressingplants, the Nadezhda nickel/copper smelter, a nickelsmelter/refinery, a copper smelter/refinery and numerousancillary facilities. It is the company’s largest operating unit andemploys more than 80,000 people.
Norilsk’s mining activities mainly rely on three Taimyr oredeposits, which account for more than 85% of the company’snickel reserves, 95% of its copper reserves, 75% of its cobaltreserves and all of its PGM reserves. In 1998, about 53% of oremined by the company originated from these three ore deposits.According to the company, ore reserves at Norilsk mines aresufficient for at least 40 years of operation at the current rates. Themine ore grades are much higher in Taimyr that in Kola – theaverage nickel content in Taimyr is about 2.35% and for copper itis 4.2%–4.5%. Furthermore, the Taimyr deposits contain a highproportion of platinum group metals – up to 30g/tonne, and over10g/tonne on average. The total annual mining capacity of NGMK’smines can be estimated at around 15m tpa, although, in practice,mine utilisation has never exceeded 70%–75% pa.
The Norilsk ore-dressing plant was built in 1948 and currently hasthe oldest and least efficient capacities in the group. The plant,with a capacity at just over 14m tpa, is mostly used for processingdisseminated copper/nickel ores and high-grade copper ores.Most of the high-grade copper-nickel ores are processed at themore modern Talnakh plant, which achieves the best levels ofmetals recovery among Norilsk Nickel’s plants and is capable ofprocessing as much as 10m tpa of ore.
Most of the nickel produced in Taimyr is smelted in the Nadezhdacopper/nickel plant – the best smelter in the group. Over half ofthe smelted nickel matte from Nadezhda is then shipped to theSeveronickel refinery and the rest is processed locally.
8•
Fleming UCB Research Norilsk Nickel October 1999
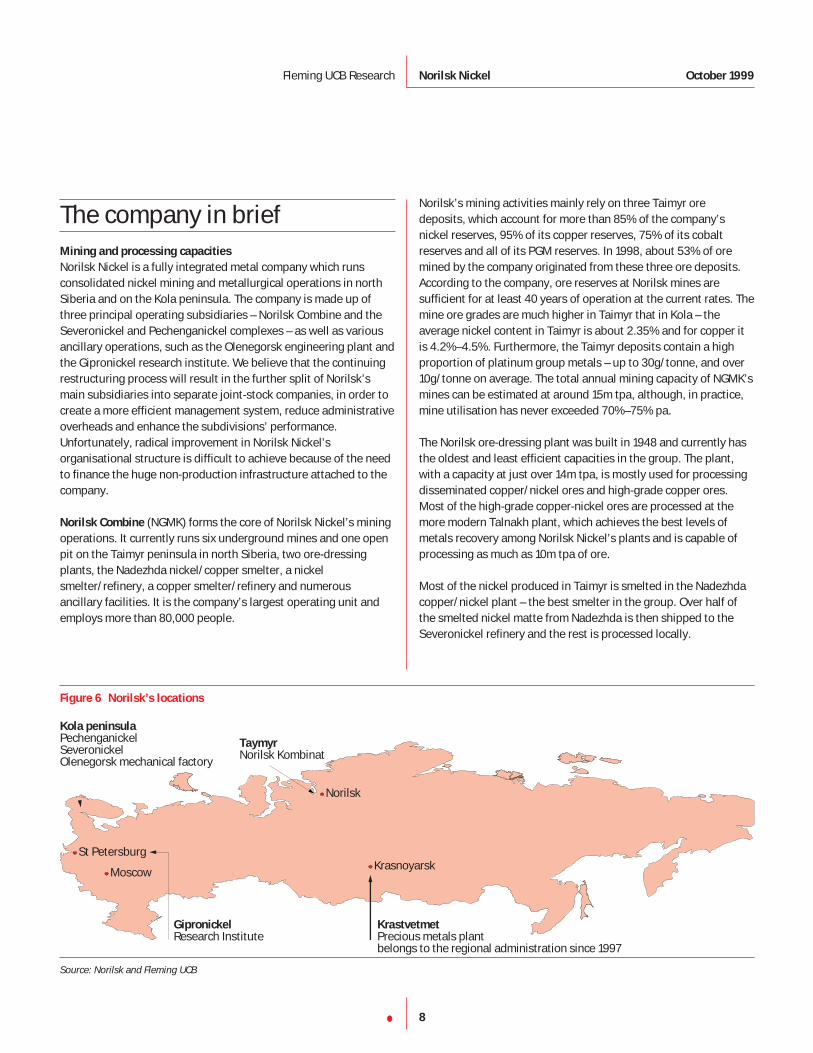
Moscow
St Petersburg
Norilsk
Krasnoyarsk
Kola peninsulaPechenganickelSeveronickelOlenegorsk mechanical factory
TaymyrNorilsk Kombinat
KrastvetmetPrecious metals plantbelongs to the regional administration since 1997
GipronickelResearch Institute
Figure 6 Norilsk’s locations
Source: Norilsk and Fleming UCB
Overall, NGMK is responsible for more than 50% of the company’snickel production; 85% of nickel is produced in cathode form andthe rest is nickel powder. The complex also produces cathodecopper (around 75% of total copper output) and cobalt in bothmetallic and powder forms, as well as concentrated PGM-richmaterial, tellurium, selenium and sulphur.
Pechenganickel Combine (PGMK) operates four mines, as well asan ore-dressing plant and a nickel smelter on the Kola peninsulanear Murmansk, and employs nearly 9,700 people. Total miningcapacity is well above 9m tpa, but the ores mined by Pechenga arelow grade, with an average nickel and copper content of 0.6% and0.3% respectively. Although most of the Kola mines are largelyexhausted, there is potential for new exploration and developmentas, according to recent studies, there are over 14 copper/nickeldeposits which are said to be sufficient for around 40–50 years ofmining. Norilsk is currently exploring the possibility of developingnew mines in the Pechenga and Monchegorsk regions.
Copper/nickel ores mined in Kola are processed at theMonchegorsk ore-dressing plant, which has an estimated capacityof 8m tpa, and achieves levels of metal recovery similar to those ofthe Talnakh plant. The concentrate is then processed by thePechenganickel smelter.
Severonickel’s nickel/copper/cobalt refining complex, with about10,000 employees, is also located in Kola. Around 90% of rawmaterials processed by the Severonickel refinery are received fromNGMK and PGMK; the rest is processed on a tolling basis (mainlyFinnish concentrate and secondary materials). Severonickel iscapable of producing as much as 140,000 tpa of nickel products(converter matte, electrolityic metal, carbonyl powders andconcentrates) but currently just over 70% of its capacity is utilised.In 1998, the nickel output at Severonickel was reduced by 5% andnickel production was increased by 6% at Norilsk Combine insteaddue to the increasing expense of shipping low-quality matte acrossthe Arctic.
For the same reason, the share of tolling at Severonickel is rising.In 1998, Severonickel signed a one-year tolling contract with ACIIndustries, under which ACI will supply nickel/cobalt refinery scrapand then market the nickel plate and cathode produced atSeveronickel. Norilsk Nickel plans to further reduce nickel outputat Severonickel in the future and focus on copper and cobaltproduction. The company intends to introduce new autogenousprocessing equipment in the copper production unit and to bring acopper sheet production unit onstream. Furthermore,management is investigating the feasibility of convertingSeveronickel’s smelting furnaces from the production of copper/nickel matte to ferrochromium. The chromite ore will comefrom the company’s own deposit at Sopcheozero, which iscurrently under development.
The harsh climate conditions cause regular disruptions toSeveronickel’s operations. The loading and shipments of NGMKproducts bound for refineries on the Kola peninsula ceases in Mayand June when the ice breaks up, and in October when water levelsare low after the summer. From October to May, shipments fromNorilsk’s Siberian units normally go ahead without interruptionwith the help of icebreakers and the Kola refineries’ built-up stocksof matte ahead of expected port shutdowns.
9•
Fleming UCB Research Norilsk Nickel October 1999
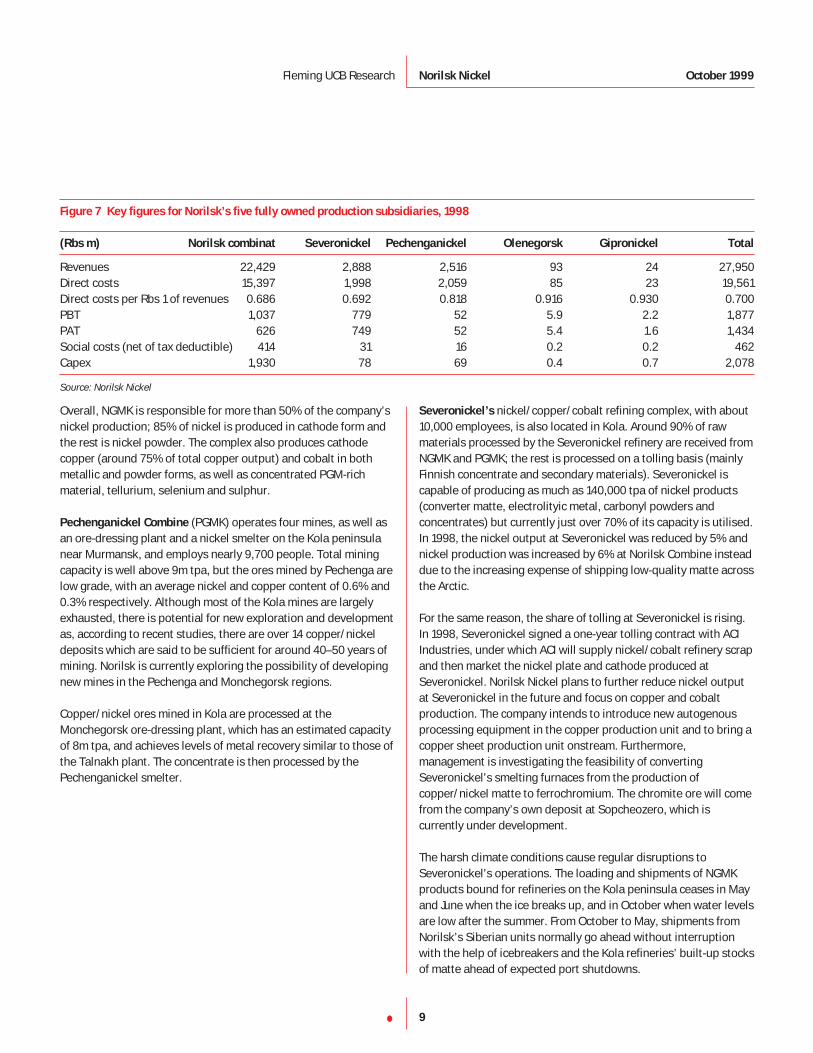
Figure 7 Key figures for Norilsk’s five fully owned production subsidiaries, 1998
(Rbs m) Norilsk combinat Severonickel Pechenganickel Olenegorsk Gipronickel Total
Revenues 22,429 2,888 2,516 93 24 27,950Direct costs 15,397 1,998 2,059 85 23 19,561Direct costs per Rbs 1 of revenues 0.686 0.692 0.818 0.916 0.930 0.700PBT 1,037 779 52 5.9 2.2 1,877PAT 626 749 52 5.4 1.6 1,434Social costs (net of tax deductible) 414 31 16 0.2 0.2 462Capex 1,930 78 69 0.4 0.7 2,078
Source: Norilsk Nickel
PGM processing
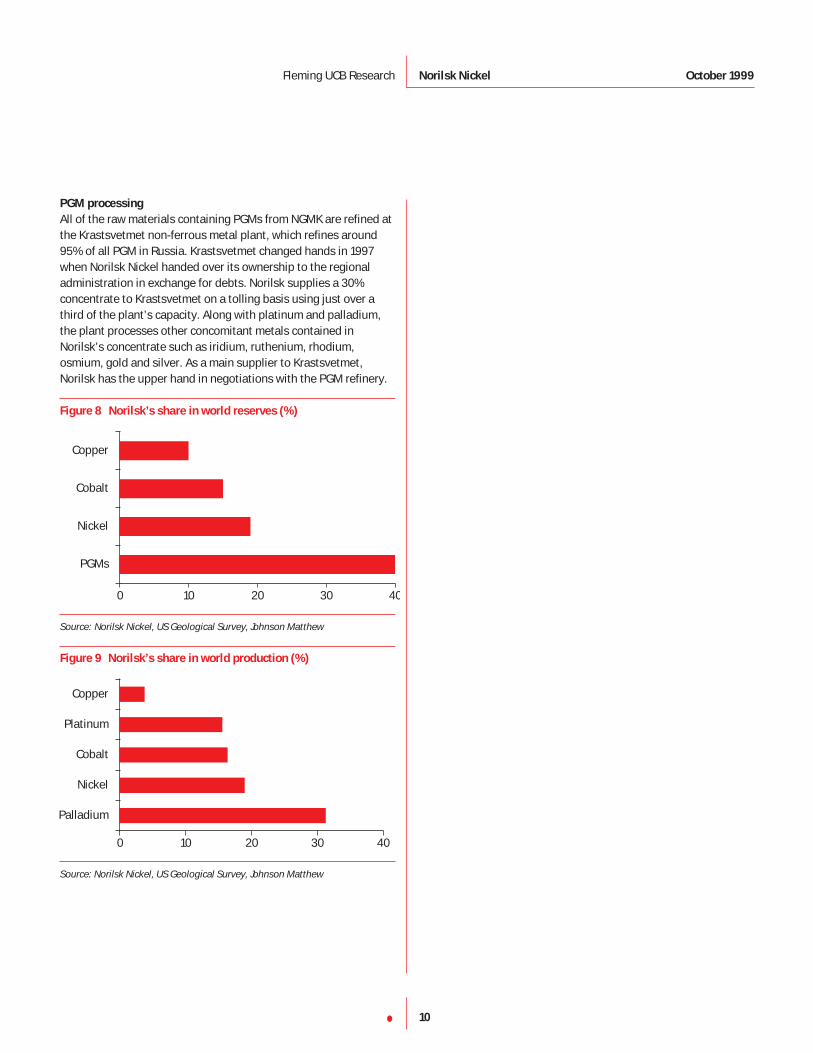
All of the raw materials containing PGMs from NGMK are refined atthe Krastsvetmet non-ferrous metal plant, which refines around95% of all PGM in Russia. Krastsvetmet changed hands in 1997when Norilsk Nickel handed over its ownership to the regionaladministration in exchange for debts. Norilsk supplies a 30%concentrate to Krastsvetmet on a tolling basis using just over athird of the plant’s capacity. Along with platinum and palladium,the plant processes other concomitant metals contained inNorilsk’s concentrate such as iridium, ruthenium, rhodium,osmium, gold and silver. As a main supplier to Krastsvetmet,Norilsk has the upper hand in negotiations with the PGM refinery.
Figure 8 Norilsk’s share in world reserves (%)
Source: Norilsk Nickel, US Geological Survey, Johnson Matthew
Figure 9 Norilsk’s share in world production (%)
Source: Norilsk Nickel, US Geological Survey, Johnson Matthew
Palladium
Nickel
Cobalt
Platinum
Copper
0 10 20 30 40
PGMs
Nickel
Cobalt
Copper
0 10 20 30 40
10•
Fleming UCB Research Norilsk Nickel October 1999
Sales and marketingDuring Russia’s difficult transitional years, many participants in
the global metal industry became used to surprises from Norilsk.
These shocks, such as fires, accidents, strikes, and energy
disruptions, generally had a positive influence on nickel prices
due to raised doubts about the company’s ability to supply nickel
to the export market. While nickel was under tremendous
pressure last year, most of the blame was placed on the Asian
crisis and the threat of new supply coming onstream from
Australia in 1999. The international mining fraternity continues
to underestimate Norilsk’s current position and full potential,
despite a 23.7% increase in nickel production in 1997 and a
significant increase in PGM output, which have easily vaulted the
company back into its position as the world’s leading nickel and
platinum group metals producer.
Sales by product
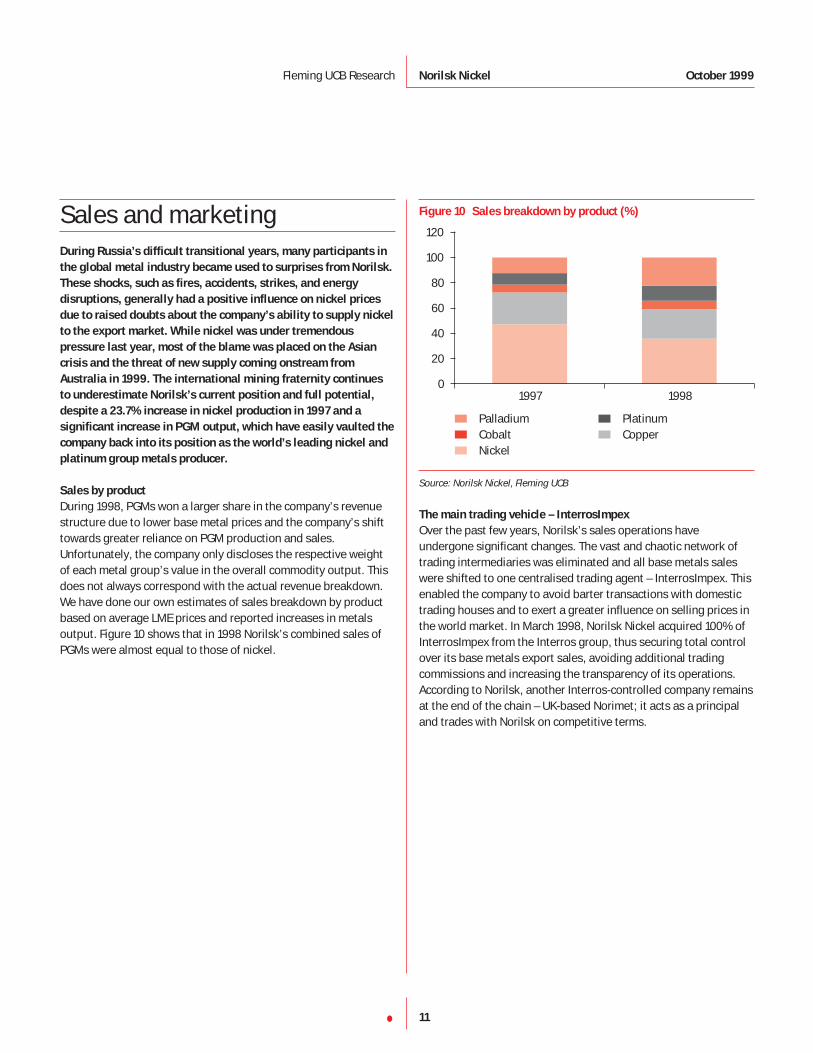
During 1998, PGMs won a larger share in the company’s revenuestructure due to lower base metal prices and the company’s shifttowards greater reliance on PGM production and sales.Unfortunately, the company only discloses the respective weightof each metal group’s value in the overall commodity output. Thisdoes not always correspond with the actual revenue breakdown.We have done our own estimates of sales breakdown by productbased on average LME prices and reported increases in metalsoutput. Figure 10 shows that in 1998 Norilsk’s combined sales ofPGMs were almost equal to those of nickel.
Figure 10 Sales breakdown by product (%)
Palladium PlatinumCobalt CopperNickel
Source: Norilsk Nickel, Fleming UCB
The main trading vehicle – InterrosImpex
Over the past few years, Norilsk’s sales operations haveundergone significant changes. The vast and chaotic network oftrading intermediaries was eliminated and all base metals saleswere shifted to one centralised trading agent – InterrosImpex. Thisenabled the company to avoid barter transactions with domestictrading houses and to exert a greater influence on selling prices inthe world market. In March 1998, Norilsk Nickel acquired 100% ofInterrosImpex from the Interros group, thus securing total controlover its base metals export sales, avoiding additional tradingcommissions and increasing the transparency of its operations.According to Norilsk, another Interros-controlled company remainsat the end of the chain – UK-based Norimet; it acts as a principaland trades with Norilsk on competitive terms.
1997 19980
20
40
60
80
100
120
11•
Fleming UCB Research Norilsk Nickel October 1999
Export is a priority
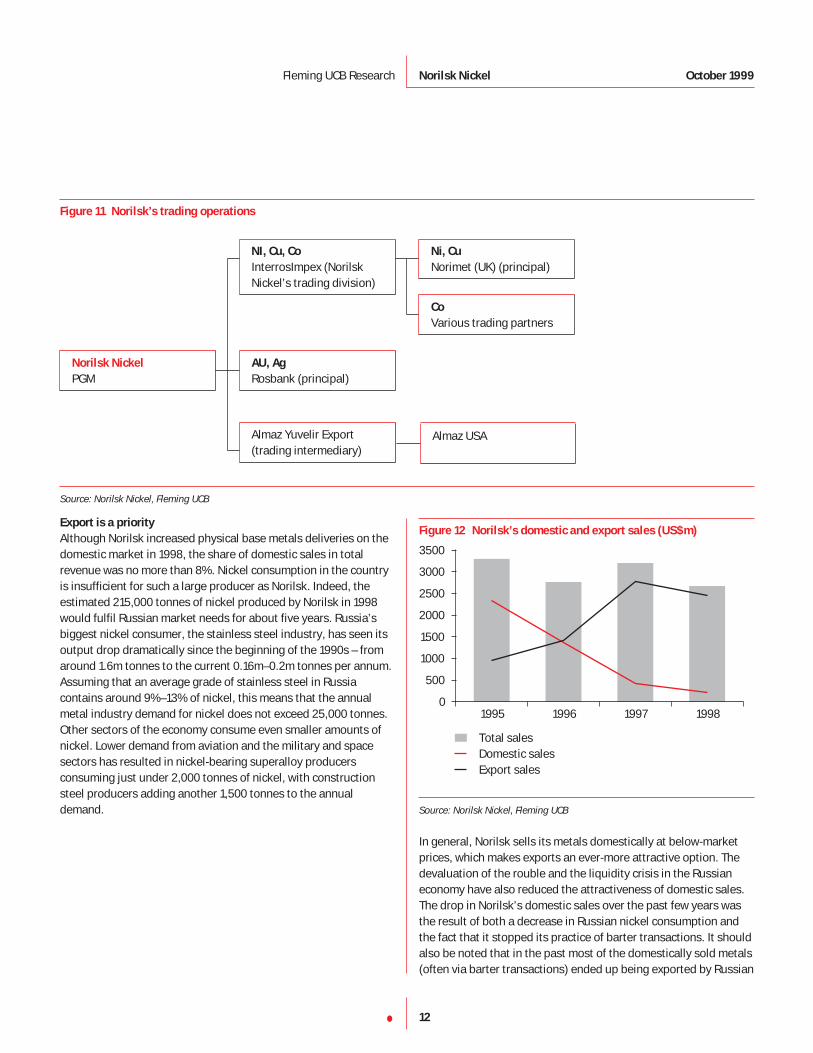
Although Norilsk increased physical base metals deliveries on thedomestic market in 1998, the share of domestic sales in totalrevenue was no more than 8%. Nickel consumption in the countryis insufficient for such a large producer as Norilsk. Indeed, theestimated 215,000 tonnes of nickel produced by Norilsk in 1998would fulfil Russian market needs for about five years. Russia’sbiggest nickel consumer, the stainless steel industry, has seen itsoutput drop dramatically since the beginning of the 1990s – fromaround 1.6m tonnes to the current 0.16m–0.2m tonnes per annum.Assuming that an average grade of stainless steel in Russiacontains around 9%–13% of nickel, this means that the annualmetal industry demand for nickel does not exceed 25,000 tonnes.Other sectors of the economy consume even smaller amounts ofnickel. Lower demand from aviation and the military and spacesectors has resulted in nickel-bearing superalloy producersconsuming just under 2,000 tonnes of nickel, with constructionsteel producers adding another 1,500 tonnes to the annualdemand.
Figure 12 Norilsk’s domestic and export sales (US$m)
Total sales Domestic salesExport sales
Source: Norilsk Nickel, Fleming UCB
In general, Norilsk sells its metals domestically at below-marketprices, which makes exports an ever-more attractive option. Thedevaluation of the rouble and the liquidity crisis in the Russianeconomy have also reduced the attractiveness of domestic sales.The drop in Norilsk’s domestic sales over the past few years wasthe result of both a decrease in Russian nickel consumption andthe fact that it stopped its practice of barter transactions. It shouldalso be noted that in the past most of the domestically sold metals(often via barter transactions) ended up being exported by Russian
1995 1996 1997 19980
500
1000
1500
2000
2500
3000
3500
12•
Fleming UCB Research Norilsk Nickel October 1999
Figure 11 Norilsk’s trading operations
NI, Cu, Co
InterrosImpex (NorilskNickel’s trading division)
Ni, Cu
Norimet (UK) (principal)
Co
Various trading partners
AU, Ag
Rosbank (principal)
Almaz Yuvelir Export(trading intermediary)
Almaz USA
Norilsk Nickel
PGM
Source: Norilsk Nickel, Fleming UCB
trading houses. As all sales are now centralised in InterrosImpex,the company has improved financial and inventory controls, aswell as cash collection.
Unfortunately, the current position of the company on the worldmetal market is undermined by huge amounts of nickel-bearingscrap metals export from Russia. According to metal industryexperts, the total stocks of nickel scrap on Russian territory can beestimated to be over 8m tonnes, which translates into nearly900,000 tonnes of nickel, almost five years of Norilsk’s output. Thecompany is demanding tougher government regulation, or at leastequality, as regards tax and customs regulations for Norilsk Nickeland exporters of nickel-bearing scrap metals.
An additional blow to Norilsk’s export sales is the introduction of a5% tax on non-ferrous and precious metals export in late April,which will cost Norilsk an estimated US$150m in 1999.(Interestingly, this tax is not levied on stainless steel scrap export.)Bearing in mind the current dire state of the state’s finances, thismeasure is to a certain extent justified, as it effectively taxesbenefits derived from the rouble devaluation. We should expectthis to increase in the future as Moscow’s appetite for exporterrevenues grows.
PGM sales
We estimate that in 1998 Norilsk produced roughly 3.5m oz ofPGMs, which made the company over US$900m in revenues. Toput this into context, Norilsk’s 1998 PGM production is almostequal to the estimated amount of gold which Russia produced in1998 (3.68m oz with a market value of around US$1bn), or, to putit in Western terms, it amounts to the volume of gold produced byBarrick Gold, the largest gold producer outside of South Africa.Given base metals price volatility, and the insatiable demand forpalladium by the environmental and electronics industries, PGM-related issues have provided the most significant andbeneficial restructuring effects. This has been accomplishedthrough three key steps: securing timely payments fromAlmazyuvelirexport, re-evaluating the company’s mining plan toachieve increased production of PGMs, and securing long-termpalladium export quotas from the government.
Citing Russia’s state secrets legislation, the company continues toplay poker with metal market participants, leaving traders to guessthe actual production figures and the likely sales pattern. This isespecially true for PGMs, as they are sold through the exclusiveexport agent Almazyuvelirexport which also sells PGMs centralbank reserves, making it difficult to know whose metal it is sellingand in what volumes.
The unpredictable pattern of Russian PGM sales and their impacton the market prices were clearly evident in 1998, when PGMdeliveries from Russia were particularly uneven. While no PGMswere shipped during 1q98, Norilsk was able to ship all of its first-half production in June 1998. Prices peaked in May, withpalladium prices soaring to an all-time high of US$417/oz, butRussian heavy selling caused spot rates to settle at aroundUS$300/oz for palladium and US$350/oz for platinum. A similartrend is continuing in 1999, with Norilsk delaying its shipments atthe beginning of the year pending approval of palladium exportquotas, and then shipping a large volume of metal in April aheadof the introduction of export tax. Norilsk recently announced thatone of its main objectives, in respect of PGM sales, is to stabilisethe pattern of deliveries and to coordinate its trading with theCentral Bank to reduce price volatility. This confirms thecompany’s intention to focus on long-term goals, rather thansimply to benefit from short-term price advantages.
Norilsk’s PGM supply to the world market is set to grow inimportance as the state’s stockpiles fall. Although Russia isthought to still have substantial palladium and platinum stocks,these are finite and eroding more rapidly than they can bereplaced. In the case of platinum, Russian exports from stockpileare not crucial to the market, and any possible future supply gapcan be closed by South African producers. The situation withpalladium, however, is completely different: while the CBR may beable to fulfil the market’s demand for another four or five years,Norilsk is the only obvious producer who can fill the gap once theCBR stocks are exhausted. Given the market’s appetite forpalladium, it seems likely that the prices will remain high in thelonger term. Norilsk, as the largest sole palladium producer in theworld, should benefit significantly from this monopoly.
13•
Fleming UCB Research Norilsk Nickel October 1999
RestructuringSince taking over day-to-day control of Norilsk, the new
management has faced tremendous challenges in its goal to
restructure the finances and operations of the company. These
challenges, inherited from central planning, include double
taxation, overstaffing and bureaucracy (secrecy and control),
each of which has helped divert investor attention away from the
vast treasure trove of reserves contained in the Norilsk mines.
Below, we outline the key steps in Norilsk’s restructuring
process.
Debt
The comprehensive debt restructuring at Norilsk was completedon 1 September 1997 and included offsets of Rbs 2.2bn and a 10-year, interest-free restructuring of Rbs 5.8bn. Using theprevailing exchange rate at the time, this translates into US$1.4bn0f government debt being restructured down to approximatelyUS$1bn, to be paid evenly over 10 years – a modest negotiationsuccess. This simple translation ignores the rouble devaluationand interest-free characteristics embedded in the restructuringagreements. After applying conservative exchange rateassumptions to fixed annual principal repayments of Rbs 580m,we estimate that the current value of Norilsk’s restructured budgetdebt is less than US$200m. We believe this turns a modestnegotiation success into something much more significant.
In 1998, the company continued optimisation of its credit portfolio,putting the emphasis on low-interest loans from abroad. (Intereston forex loans ranged from 8% to 14%.) According to the company,the cost of servicing rouble loans was reduced by more than two-thirds in US$ terms by the beginning of 1999. Short-termcredits were substantially reduced and some of them wereconverted to medium- and long-term liabilities. Overall, Norilsk’sshort-term debts to financial institutions were reduced during 1998by 37.2% on forex loans and by 19.7% on rouble loans.
PGM proceeds
Until 1 July 1997, Norilsk was forced by the state to deliver its PGMproduction to Gokhran. Rouble credits for delivered metals werereportedly calculated as a fraction of the prevailing internationalprice, while infrequent payments allowed the balance to be erodedaway by inflation. After July 1997, Norilsk gained partial controlover PGMs and ensured that it would receive full proceeds attimely intervals. While the control over its own production wasobviously a small victory over the influence of the state’sbureaucracy, Norilsk still had to contend with annual quotas andlicensing procedures, which in 1998 delayed the fruits of this
victory. At this stage, however, the main point for Norilsk was thatit had started to receive full proceeds related to the production ofPGMs. However, even annual quotas have now been scrapped anda new resolution was put in force by the government andAlmazyuvelirexport at the beginning of 1999, which sets palladiumsales quotas for 10 years instead of one year as previously.
From now on, Norilsk will benefit from a revenue stream which ismore diversified and from a mining plan which is readily adaptableto changing metal demand and pricing. The crucial point here isthat the company is now in a position to assess its entire resourcebase (why should it consider devoting resources to producingmetal it is not paid for?) and to produce according to the highestvalue/profitability per tonne of ore. Given the volatility of basemetal prices and record demand for PGMs, Norilsk should bemaking an effort to increase its PGM production. According toNorilsk’s public statements, this is exactly what the company isdoing: in 1998, the combined output of precious metals increasedby more than 16% and it has similar ambitious plans for PGMproduction this year.
On the other hand, the state’s desperate search for revenues maystill rock the boat and thwart Norilsk’s attempts to gain greatercontrol over its PGM production and sales. Previous decisionscould simply be reversed. However, the latest resolution grantingNorilsk 10 years’ palladium export quotas and a recent agreementwith the Central Bank to coordinate PGM export to stabilise marketprices, clearly indicate that the momentum towards liberalisingNorilsk’s PGM production and sales is still there. Although it wouldbe unwise to write off this risk altogether, indications are that it isminimal at this stage.
Employee reductions
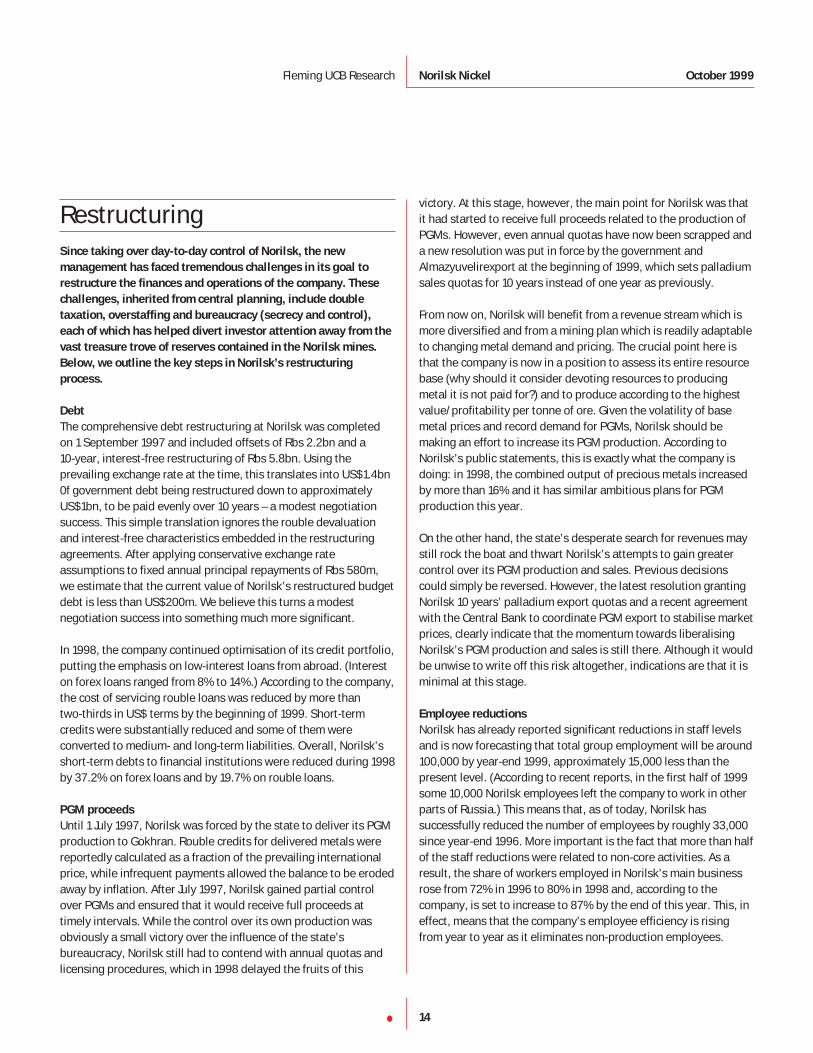
Norilsk has already reported significant reductions in staff levelsand is now forecasting that total group employment will be around100,000 by year-end 1999, approximately 15,000 less than thepresent level. (According to recent reports, in the first half of 1999some 10,000 Norilsk employees left the company to work in otherparts of Russia.) This means that, as of today, Norilsk hassuccessfully reduced the number of employees by roughly 33,000since year-end 1996. More important is the fact that more than halfof the staff reductions were related to non-core activities. As aresult, the share of workers employed in Norilsk’s main businessrose from 72% in 1996 to 80% in 1998 and, according to thecompany, is set to increase to 87% by the end of this year. This, ineffect, means that the company’s employee efficiency is risingfrom year to year as it eliminates non-production employees.
14•
Fleming UCB Research Norilsk Nickel October 1999
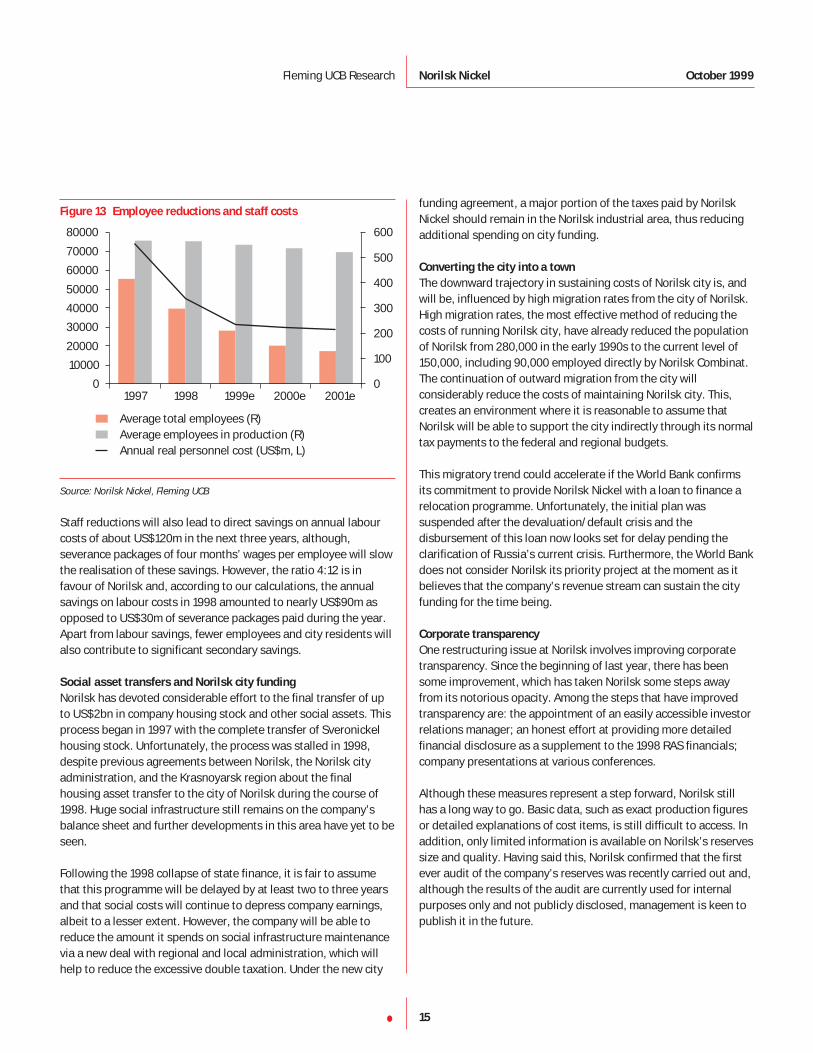
Figure 13 Employee reductions and staff costs
Average total employees (R)Average employees in production (R)Annual real personnel cost (US$m, L)
Source: Norilsk Nickel, Fleming UCB
Staff reductions will also lead to direct savings on annual labourcosts of about US$120m in the next three years, although,severance packages of four months’ wages per employee will slowthe realisation of these savings. However, the ratio 4:12 is infavour of Norilsk and, according to our calculations, the annualsavings on labour costs in 1998 amounted to nearly US$90m asopposed to US$30m of severance packages paid during the year.Apart from labour savings, fewer employees and city residents willalso contribute to significant secondary savings.
Social asset transfers and Norilsk city funding
Norilsk has devoted considerable effort to the final transfer of upto US$2bn in company housing stock and other social assets. Thisprocess began in 1997 with the complete transfer of Sveronickelhousing stock. Unfortunately, the process was stalled in 1998,despite previous agreements between Norilsk, the Norilsk cityadministration, and the Krasnoyarsk region about the finalhousing asset transfer to the city of Norilsk during the course of1998. Huge social infrastructure still remains on the company’sbalance sheet and further developments in this area have yet to beseen.
Following the 1998 collapse of state finance, it is fair to assumethat this programme will be delayed by at least two to three yearsand that social costs will continue to depress company earnings,albeit to a lesser extent. However, the company will be able toreduce the amount it spends on social infrastructure maintenancevia a new deal with regional and local administration, which willhelp to reduce the excessive double taxation. Under the new city
funding agreement, a major portion of the taxes paid by NorilskNickel should remain in the Norilsk industrial area, thus reducingadditional spending on city funding.
Converting the city into a town
The downward trajectory in sustaining costs of Norilsk city is, andwill be, influenced by high migration rates from the city of Norilsk.High migration rates, the most effective method of reducing thecosts of running Norilsk city, have already reduced the populationof Norilsk from 280,000 in the early 1990s to the current level of150,000, including 90,000 employed directly by Norilsk Combinat.The continuation of outward migration from the city willconsiderably reduce the costs of maintaining Norilsk city. This,creates an environment where it is reasonable to assume thatNorilsk will be able to support the city indirectly through its normaltax payments to the federal and regional budgets.
This migratory trend could accelerate if the World Bank confirmsits commitment to provide Norilsk Nickel with a loan to finance arelocation programme. Unfortunately, the initial plan wassuspended after the devaluation/default crisis and thedisbursement of this loan now looks set for delay pending theclarification of Russia’s current crisis. Furthermore, the World Bankdoes not consider Norilsk its priority project at the moment as itbelieves that the company’s revenue stream can sustain the cityfunding for the time being.
Corporate transparency
One restructuring issue at Norilsk involves improving corporatetransparency. Since the beginning of last year, there has beensome improvement, which has taken Norilsk some steps awayfrom its notorious opacity. Among the steps that have improvedtransparency are: the appointment of an easily accessible investorrelations manager; an honest effort at providing more detailedfinancial disclosure as a supplement to the 1998 RAS financials;company presentations at various conferences.
Although these measures represent a step forward, Norilsk stillhas a long way to go. Basic data, such as exact production figuresor detailed explanations of cost items, is still difficult to access. Inaddition, only limited information is available on Norilsk’s reservessize and quality. Having said this, Norilsk confirmed that the firstever audit of the company’s reserves was recently carried out and,although the results of the audit are currently used for internalpurposes only and not publicly disclosed, management is keen topublish it in the future.
1997 1998 1999e 2000e 2001e0
10000
20000
30000
40000
50000
60000
70000
80000
0
100
200
300
400
500
600
15•
Fleming UCB Research Norilsk Nickel October 1999
Operating and financial performance Based on the review of the 1998 operating performance, we
conclude that Norilsk’s operations are running smoothly. Given
the evidence of the company’s strengthening financial position
and the development of its longer-term industrial strategy, we
believe there is a strong case to support a continuation of
smooth, increasingly efficient operations, especially since the
company is currently amassing financing necessary to fund a
profound modernisation programme.
Ore mining and production
In 1998, Norilsk Nickel mined over 19.3m tonnes of ore, whichrepresents an increase in total mine production of nearly 8%.However, the increasing amount of mining does not necessarilyentail higher nickel production. Reserves are usually not uniformin grade, and some sections contain relatively high levels of PGMsand lower levels of nickel and copper. Disseminated ore in Talnakhdeposits contain only approximately 1% nickel/copper (versus~6.8% in the rich ore), but nearly 10g/tonne of PGMs.
Figure 14 Mining by mines (change YoY %)
PGMK minesNGMK mines
Source: Norilsk Nickel, Flemings UCB
In 1998, Norilsk mined 6.4% more ore at NGMK and 9.9% more oreat PGMK than the previous year. It should be noted, however, thatout of approximately 9,127,000 tonnes of ore mined at PGMK, only84% was sent to production and the rest, containing low metalslevel, was stockpiled. A greater emphasis was put on processingdisseminated ore from NGMK mines as it contains PGMs. In thepast, since Norilsk did not receive prompt or full payment for itsPGMs, the mining of disseminated reserves had to be justified bynickel and copper contents alone. In 1998, for the first time Norilskhas been given the opportunity to assess the real value of theminerals contained in disseminated ore and adapt its mining planto the changing metal market demand pattern. As a result, thecompany today is more responsive to fluctuating base andprecious metal prices.
Declining base metal prices were buffered by PGMs
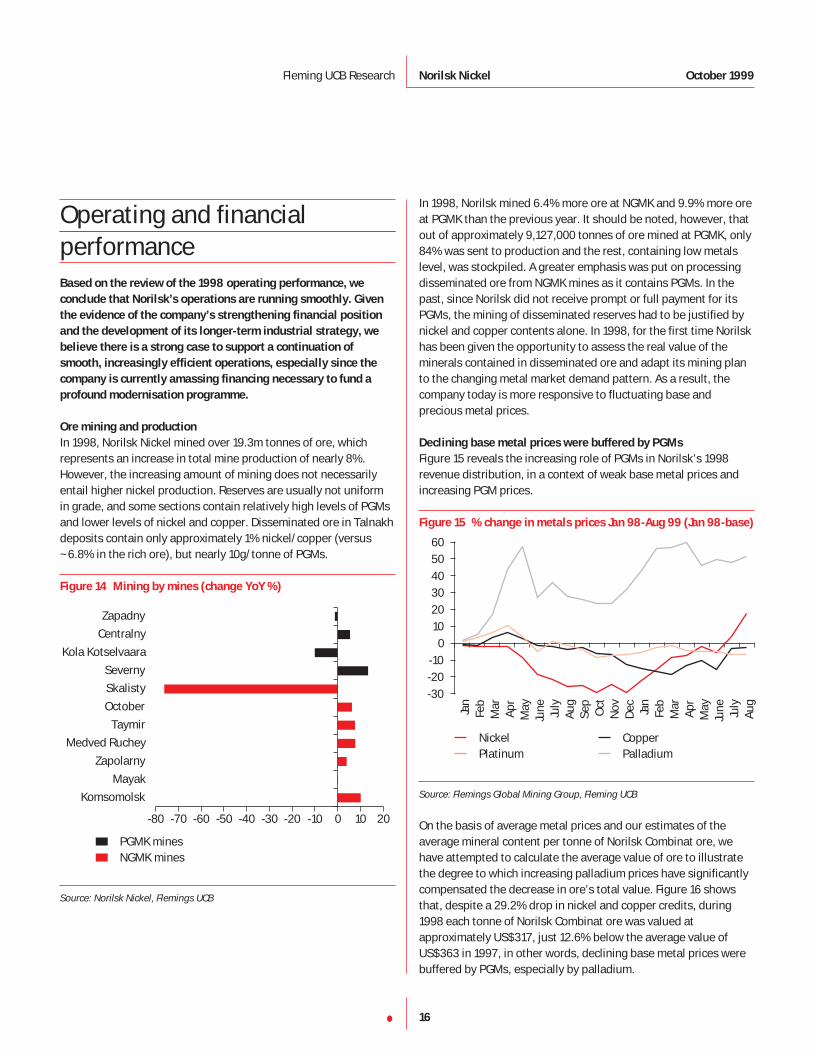
Figure 15 reveals the increasing role of PGMs in Norilsk’s 1998revenue distribution, in a context of weak base metal prices andincreasing PGM prices.
Figure 15 % change in metals prices Jan 98-Aug 99 (Jan 98-base)
Nickel CopperPlatinum Palladium
Source: Flemings Global Mining Group, Fleming UCB
On the basis of average metal prices and our estimates of theaverage mineral content per tonne of Norilsk Combinat ore, wehave attempted to calculate the average value of ore to illustratethe degree to which increasing palladium prices have significantlycompensated the decrease in ore’s total value. Figure 16 showsthat, despite a 29.2% drop in nickel and copper credits, during1998 each tonne of Norilsk Combinat ore was valued atapproximately US$317, just 12.6% below the average value ofUS$363 in 1997, in other words, declining base metal prices werebuffered by PGMs, especially by palladium.
Jan
Feb
Mar
Apr
May
June July
Aug
Sep
Oct
Nov
Dec Ja
nFe
bM
arA
prM
ayJu
ne July
Aug
-30-20-10
0102030405060
Komsomolsk
Mayak
Zapolarny
Medved Ruchey
Taymir
October
Skalisty
Severny
Kola Kotselvaara
Centralny
Zapadny
-80 -70 -60 -50 -40 -30 -20 -10 0 10 20
16•
Fleming UCB Research Norilsk Nickel October 1999
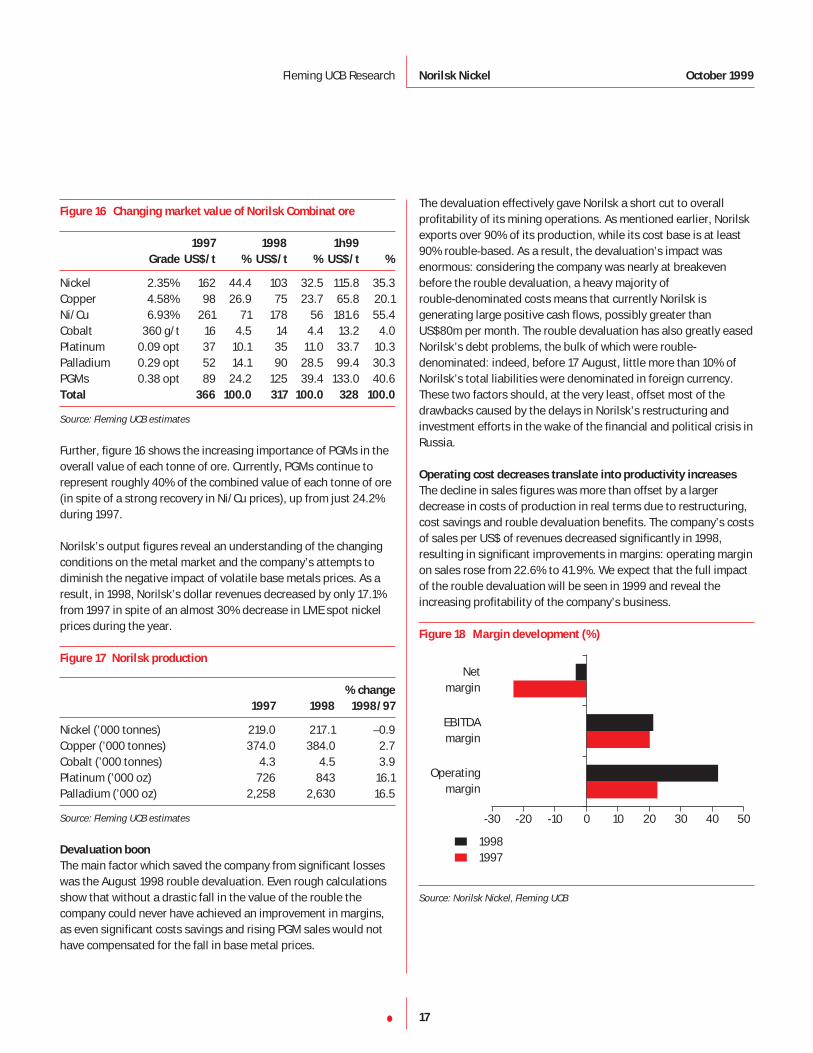
Figure 16 Changing market value of Norilsk Combinat ore
1997 1998 1h99
Grade US$/t % US$/t % US$/t %
Nickel 2.35% 162 44.4 103 32.5 115.8 35.3Copper 4.58% 98 26.9 75 23.7 65.8 20.1Ni/Cu 6.93% 261 71 178 56 181.6 55.4Cobalt 360 g/t 16 4.5 14 4.4 13.2 4.0Platinum 0.09 opt 37 10.1 35 11.0 33.7 10.3Palladium 0.29 opt 52 14.1 90 28.5 99.4 30.3PGMs 0.38 opt 89 24.2 125 39.4 133.0 40.6Total 366 100.0 317 100.0 328 100.0
Source: Fleming UCB estimates
Further, figure 16 shows the increasing importance of PGMs in theoverall value of each tonne of ore. Currently, PGMs continue torepresent roughly 40% of the combined value of each tonne of ore(in spite of a strong recovery in Ni/Cu prices), up from just 24.2%during 1997.
Norilsk’s output figures reveal an understanding of the changingconditions on the metal market and the company’s attempts todiminish the negative impact of volatile base metals prices. As aresult, in 1998, Norilsk’s dollar revenues decreased by only 17.1%from 1997 in spite of an almost 30% decrease in LME spot nickelprices during the year.
Figure 17 Norilsk production
% change
1997 1998 1998/97
Nickel (’000 tonnes) 219.0 217.1 –0.9Copper (’000 tonnes) 374.0 384.0 2.7Cobalt (’000 tonnes) 4.3 4.5 3.9Platinum (’000 oz) 726 843 16.1Palladium (’000 oz) 2,258 2,630 16.5
Source: Fleming UCB estimates
Devaluation boon
The main factor which saved the company from significant losseswas the August 1998 rouble devaluation. Even rough calculationsshow that without a drastic fall in the value of the rouble thecompany could never have achieved an improvement in margins,as even significant costs savings and rising PGM sales would nothave compensated for the fall in base metal prices.
The devaluation effectively gave Norilsk a short cut to overallprofitability of its mining operations. As mentioned earlier, Norilskexports over 90% of its production, while its cost base is at least90% rouble-based. As a result, the devaluation’s impact wasenormous: considering the company was nearly at breakevenbefore the rouble devaluation, a heavy majority of rouble-denominated costs means that currently Norilsk isgenerating large positive cash flows, possibly greater thanUS$80m per month. The rouble devaluation has also greatly easedNorilsk’s debt problems, the bulk of which were rouble-denominated: indeed, before 17 August, little more than 10% ofNorilsk’s total liabilities were denominated in foreign currency.These two factors should, at the very least, offset most of thedrawbacks caused by the delays in Norilsk’s restructuring andinvestment efforts in the wake of the financial and political crisis inRussia.
Operating cost decreases translate into productivity increases
The decline in sales figures was more than offset by a largerdecrease in costs of production in real terms due to restructuring,cost savings and rouble devaluation benefits. The company’s costsof sales per US$ of revenues decreased significantly in 1998,resulting in significant improvements in margins: operating marginon sales rose from 22.6% to 41.9%. We expect that the full impactof the rouble devaluation will be seen in 1999 and reveal theincreasing profitability of the company’s business.
Figure 18 Margin development (%)
19981997
Source: Norilsk Nickel, Fleming UCB
Operatingmargin
EBITDAmargin
Netmargin
-30 -20 -10 0 10 20 30 40 50
17•
Fleming UCB Research Norilsk Nickel October 1999
In 1998, the company successfully completed the purchase of asignificant stake in Norilsk Gazprom for around Rbs 571m. Thisone-off investment has already resulted in Rbs 462m savings onfuel costs (a 28% decrease). Furthermore, an improvedrelationship with the local electricity supplier, Taimyrenergo,meaning a substantial price discount for timely cash payments,has helped the company achieve a reduction of 17% in electricitycosts.
Further employee cuts and increased production already raisedproductivity by 50% in 1997–98, as measured by the production ofnickel equivalents (NEP) per production employee (from 5.4tonnes of NEP per employee in 1996 to 8.1 tonnes in 1998). Itshould be noted, however, that the market value of eachemployee’s output decreased in 1998 by 32.5%, reflecting adecrease in average realised nickel prices. (On the other hand, thereal average wage also fell by 30% during 1998.)
A significant reduction was achieved in operating costs per tonneof NEP which fell in real terms by more than 30%, from US$4,883in 1997 to US$3,338 last year. Moreover, these improvements areexpected to continue over the forecast period, resulting inoperating cost per tonne of NEP of US$2,496 by 2001, ie a 49%decline in real terms from 1997 (although it should be rememberedthat rouble devaluation accounts for approximately one-third ofthis productivity improvement).
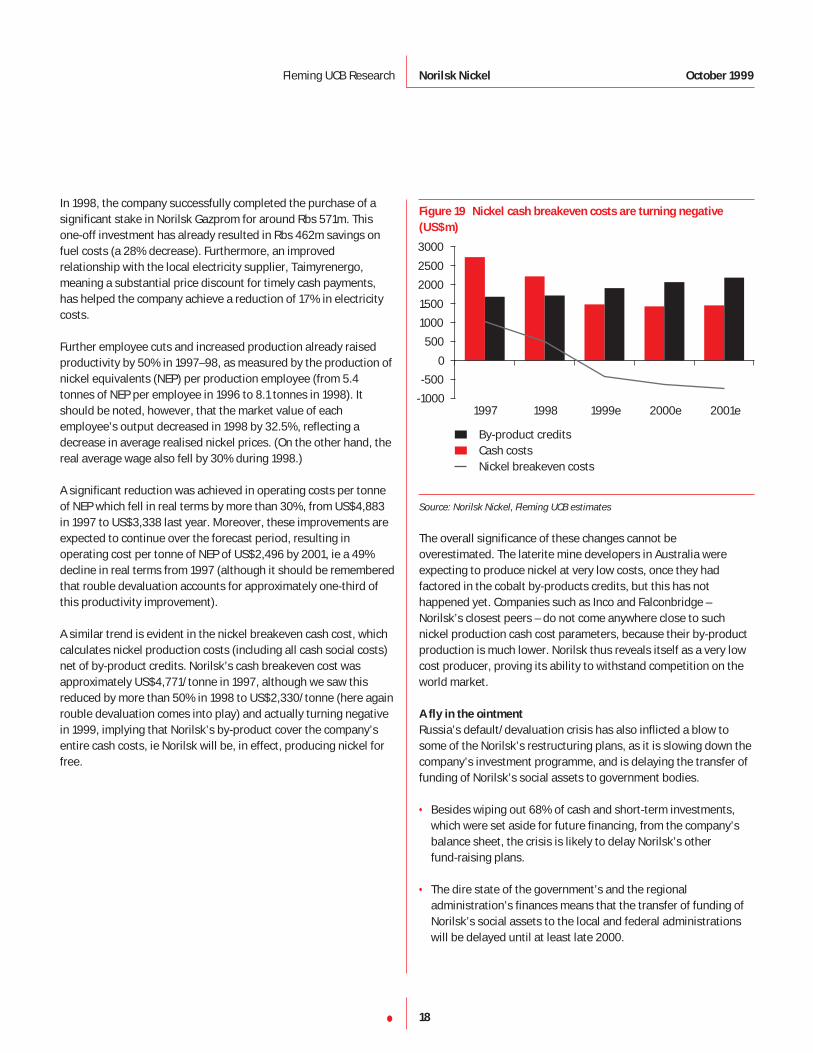
A similar trend is evident in the nickel breakeven cash cost, whichcalculates nickel production costs (including all cash social costs)net of by-product credits. Norilsk’s cash breakeven cost wasapproximately US$4,771/tonne in 1997, although we saw thisreduced by more than 50% in 1998 to US$2,330/tonne (here againrouble devaluation comes into play) and actually turning negativein 1999, implying that Norilsk’s by-product cover the company’sentire cash costs, ie Norilsk will be, in effect, producing nickel forfree.
Figure 19 Nickel cash breakeven costs are turning negative
(US$m)
By-product credits Cash costs Nickel breakeven costs
Source: Norilsk Nickel, Fleming UCB estimates
The overall significance of these changes cannot beoverestimated. The laterite mine developers in Australia wereexpecting to produce nickel at very low costs, once they hadfactored in the cobalt by-products credits, but this has nothappened yet. Companies such as Inco and Falconbridge –Norilsk’s closest peers – do not come anywhere close to suchnickel production cash cost parameters, because their by-productproduction is much lower. Norilsk thus reveals itself as a very lowcost producer, proving its ability to withstand competition on theworld market.
A fly in the ointment
Russia’s default/devaluation crisis has also inflicted a blow tosome of the Norilsk’s restructuring plans, as it is slowing down thecompany’s investment programme, and is delaying the transfer offunding of Norilsk’s social assets to government bodies.
• Besides wiping out 68% of cash and short-term investments,which were set aside for future financing, from the company’sbalance sheet, the crisis is likely to delay Norilsk’s other fund-raising plans.
• The dire state of the government’s and the regionaladministration’s finances means that the transfer of funding ofNorilsk’s social assets to the local and federal administrationswill be delayed until at least late 2000.
1997 1998 1999e 2000e 2001e-1000
-500
0
500
1000
1500
2000
2500
3000
18•
Fleming UCB Research Norilsk Nickel October 1999
• The US$500m programme funded by the World Bank aimed atrelocating 70,000 Norilsk employees has been delayed.
• The company wrote off more than Rbs 6bn in forex losses.Although there have been no detailed explanations of howthose losses occurred, we presume that the company used theloop hole in the Russian tax legislation to decrease its tax basethrough extensive forex charges.
However, it should be borne in mind that these negativedevelopments had been more than offset by the massive benefitsfrom the rouble devaluation.
Large non-deductible social costs drag earnings
A very real drag on Norilsk’s earnings comes in the form ofobligatory and other funds’ allocations. In 1997, these allocationsamounted to US$867m, although we expect that 70% of this figurecomes from asset transfers and did not represent direct socialasset-related expenditure, which amounted to US$257m. In 1998,the company did not achieve any reductions in socialinfrastructure maintenance, and non-deductible social costscontinued to be a significant burden, which turned Norilsk’sUS$178m after-tax profit into a US$86m loss. If it were not for thisadditional expenditure, Norilsk, with an after-tax profit margin ofnearly 7% in 1998, could achieve the best results among itsinternational peers.
Balance sheet: the changing landscape
During 1998, not only Norilsk’s income statement, but also itsbalance sheet, underwent noticeable changes. The mostsignificant changes were brought about, once again, by thedevaluation of the rouble and a result can only be clearly seenafter the translation of RAS accounts into US dollars. Below arebrief notes on the most significant of these changes:
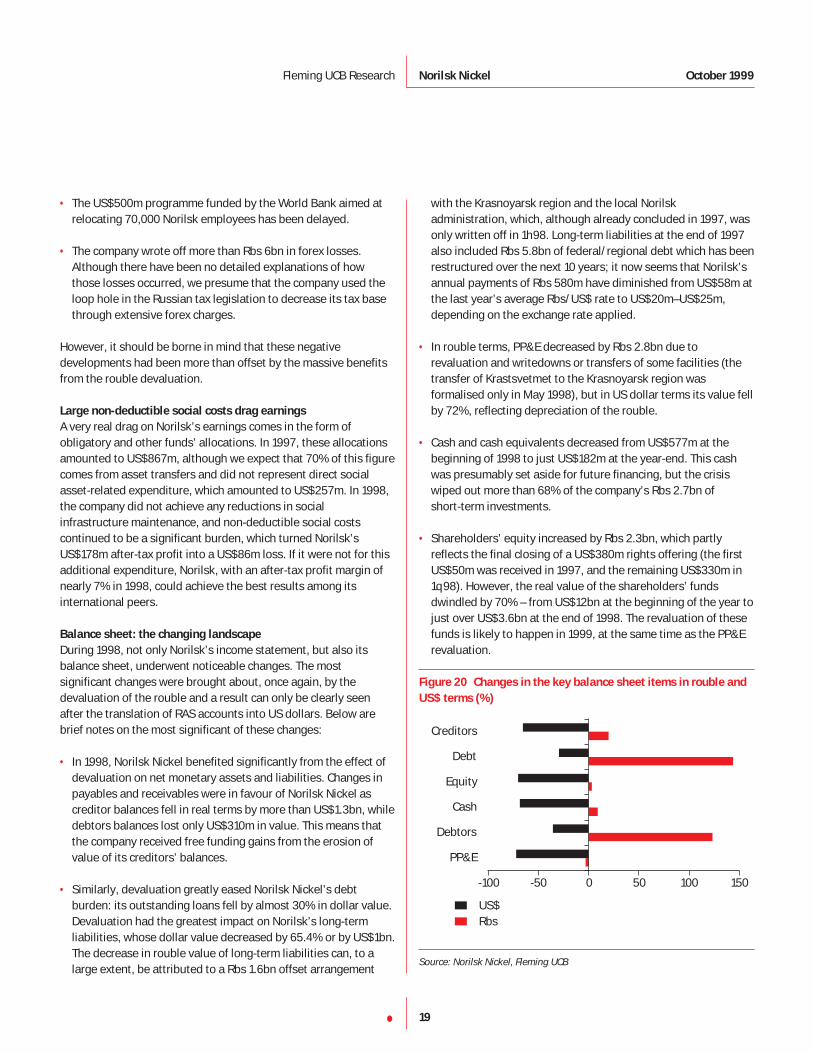
• In 1998, Norilsk Nickel benefited significantly from the effect ofdevaluation on net monetary assets and liabilities. Changes inpayables and receivables were in favour of Norilsk Nickel ascreditor balances fell in real terms by more than US$1.3bn, whiledebtors balances lost only US$310m in value. This means thatthe company received free funding gains from the erosion ofvalue of its creditors’ balances.
• Similarly, devaluation greatly eased Norilsk Nickel’s debtburden: its outstanding loans fell by almost 30% in dollar value.Devaluation had the greatest impact on Norilsk’s long-termliabilities, whose dollar value decreased by 65.4% or by US$1bn.The decrease in rouble value of long-term liabilities can, to alarge extent, be attributed to a Rbs 1.6bn offset arrangement
with the Krasnoyarsk region and the local Norilskadministration, which, although already concluded in 1997, wasonly written off in 1h98. Long-term liabilities at the end of 1997also included Rbs 5.8bn of federal/regional debt which has beenrestructured over the next 10 years; it now seems that Norilsk’sannual payments of Rbs 580m have diminished from US$58m atthe last year’s average Rbs/US$ rate to US$20m–US$25m,depending on the exchange rate applied.
• In rouble terms, PP&E decreased by Rbs 2.8bn due torevaluation and writedowns or transfers of some facilities (thetransfer of Krastsvetmet to the Krasnoyarsk region wasformalised only in May 1998), but in US dollar terms its value fellby 72%, reflecting depreciation of the rouble.
• Cash and cash equivalents decreased from US$577m at thebeginning of 1998 to just US$182m at the year-end. This cashwas presumably set aside for future financing, but the crisiswiped out more than 68% of the company’s Rbs 2.7bn of short-term investments.
• Shareholders’ equity increased by Rbs 2.3bn, which partlyreflects the final closing of a US$380m rights offering (the firstUS$50m was received in 1997, and the remaining US$330m in1q98). However, the real value of the shareholders’ fundsdwindled by 70% – from US$12bn at the beginning of the year tojust over US$3.6bn at the end of 1998. The revaluation of thesefunds is likely to happen in 1999, at the same time as the PP&Erevaluation.
Figure 20 Changes in the key balance sheet items in rouble and
US$ terms (%)
US$Rbs
Source: Norilsk Nickel, Fleming UCB
PP&E
Debtors
Cash
Equity
Debt
Creditors
-100 -50 0 50 100 150
19•
Fleming UCB Research Norilsk Nickel October 1999
1999 and beyond: review of earnings estimates
Our estimates for 1998–2001 show a CAGR of revenues of around15.6%, on a combination of a continuous shift towards higherproduction of PGMs and slight base metals production increases inthe context of a generally improving outlook for global metalmarkets. (It is worth noting that nickel is trading aboveUS$7,200/tonne at the moment and a further rise in base metalprices is expected before the year-end.) Revenues will be affectedby a 5% export tariff, which runs through our model over theforecast period, as it is more than likely that the government willcontinue to tap exporters’ revenues, especially in the run-up toelections.
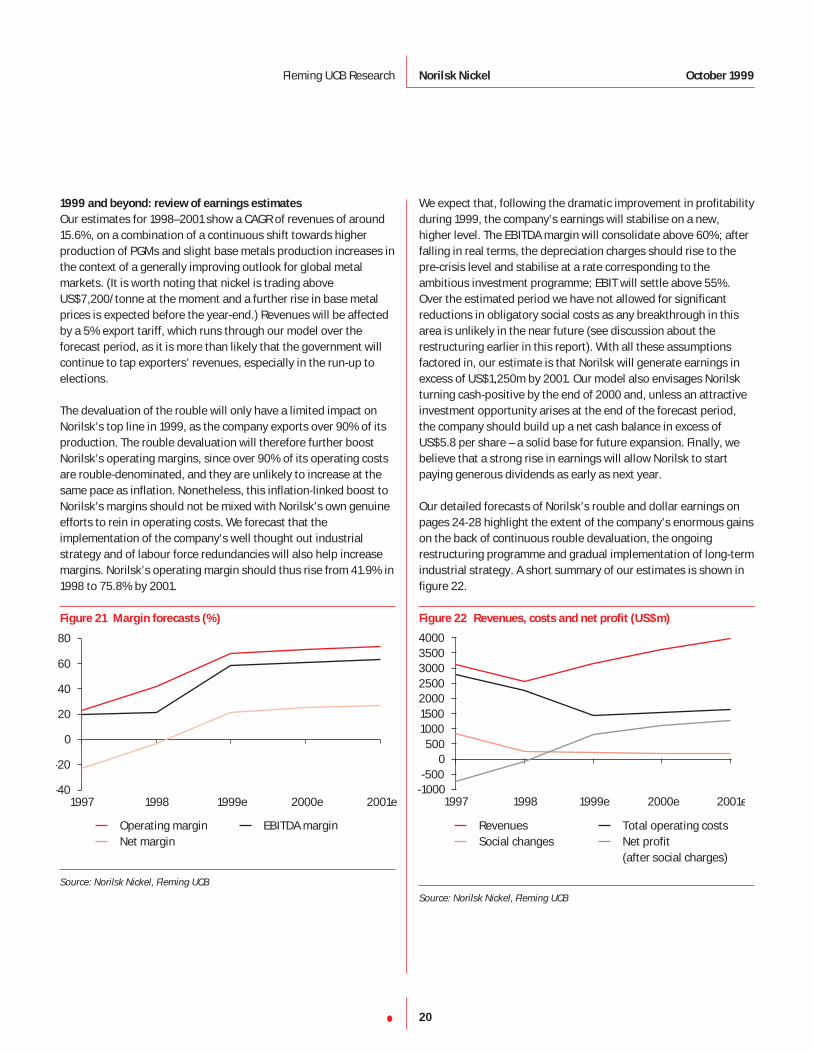
The devaluation of the rouble will only have a limited impact onNorilsk’s top line in 1999, as the company exports over 90% of itsproduction. The rouble devaluation will therefore further boostNorilsk’s operating margins, since over 90% of its operating costsare rouble-denominated, and they are unlikely to increase at thesame pace as inflation. Nonetheless, this inflation-linked boost toNorilsk’s margins should not be mixed with Norilsk’s own genuineefforts to rein in operating costs. We forecast that theimplementation of the company’s well thought out industrialstrategy and of labour force redundancies will also help increasemargins. Norilsk’s operating margin should thus rise from 41.9% in1998 to 75.8% by 2001.
Figure 21 Margin forecasts (%)
Operating margin EBITDA marginNet margin
Source: Norilsk Nickel, Fleming UCB
We expect that, following the dramatic improvement in profitabilityduring 1999, the company’s earnings will stabilise on a new,higher level. The EBITDA margin will consolidate above 60%; afterfalling in real terms, the depreciation charges should rise to thepre-crisis level and stabilise at a rate corresponding to theambitious investment programme; EBIT will settle above 55%.Over the estimated period we have not allowed for significantreductions in obligatory social costs as any breakthrough in thisarea is unlikely in the near future (see discussion about therestructuring earlier in this report). With all these assumptionsfactored in, our estimate is that Norilsk will generate earnings inexcess of US$1,250m by 2001. Our model also envisages Norilskturning cash-positive by the end of 2000 and, unless an attractiveinvestment opportunity arises at the end of the forecast period,the company should build up a net cash balance in excess ofUS$5.8 per share – a solid base for future expansion. Finally, webelieve that a strong rise in earnings will allow Norilsk to startpaying generous dividends as early as next year.
Our detailed forecasts of Norilsk’s rouble and dollar earnings onpages 24-28 highlight the extent of the company’s enormous gainson the back of continuous rouble devaluation, the ongoingrestructuring programme and gradual implementation of long-termindustrial strategy. A short summary of our estimates is shown infigure 22.
Figure 22 Revenues, costs and net profit (US$m)
Revenues Total operating costsSocial changes Net profit
(after social charges)
Source: Norilsk Nickel, Fleming UCB
1997 1998 1999e 2000e 2001e-1000-500
0500
1000150020002500300035004000
1997 1998 1999e 2000e 2001e-40
-20
0
20
40
60
80
20•
Fleming UCB Research Norilsk Nickel October 1999
Industrial strategy and investmentIn parallel with its restructuring programme, Norilsk has alsodevoted considerable attention to defining a long-term industrialstrategy, from which it has drawn a coherent investmentprogramme that balances volatile base metal prices and theurgent need to upgrade the company’s facilities. We believe thatthe company will focus on obtaining a higher level of productivityfrom its employees and facilities, thereby ensuring themaintenance of its global market share.
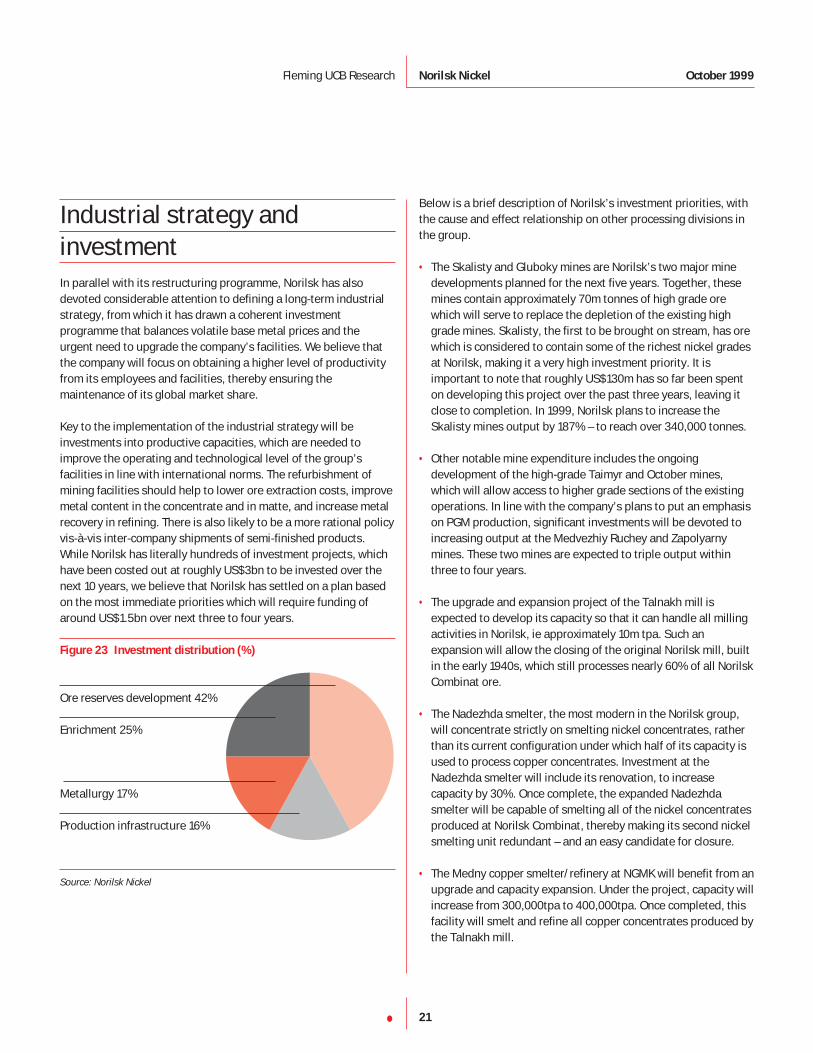
Key to the implementation of the industrial strategy will beinvestments into productive capacities, which are needed toimprove the operating and technological level of the group’sfacilities in line with international norms. The refurbishment ofmining facilities should help to lower ore extraction costs, improvemetal content in the concentrate and in matte, and increase metalrecovery in refining. There is also likely to be a more rational policyvis-à-vis inter-company shipments of semi-finished products.While Norilsk has literally hundreds of investment projects, whichhave been costed out at roughly US$3bn to be invested over thenext 10 years, we believe that Norilsk has settled on a plan basedon the most immediate priorities which will require funding ofaround US$1.5bn over next three to four years.
Figure 23 Investment distribution (%)
Ore reserves development 42%
Enrichment 25%
Metallurgy 17%
Production infrastructure 16%
Source: Norilsk Nickel
Below is a brief description of Norilsk’s investment priorities, withthe cause and effect relationship on other processing divisions inthe group.
• The Skalisty and Gluboky mines are Norilsk’s two major minedevelopments planned for the next five years. Together, thesemines contain approximately 70m tonnes of high grade orewhich will serve to replace the depletion of the existing highgrade mines. Skalisty, the first to be brought on stream, has orewhich is considered to contain some of the richest nickel gradesat Norilsk, making it a very high investment priority. It isimportant to note that roughly US$130m has so far been spenton developing this project over the past three years, leaving itclose to completion. In 1999, Norilsk plans to increase theSkalisty mines output by 187% – to reach over 340,000 tonnes.
• Other notable mine expenditure includes the ongoingdevelopment of the high-grade Taimyr and October mines,which will allow access to higher grade sections of the existingoperations. In line with the company’s plans to put an emphasison PGM production, significant investments will be devoted toincreasing output at the Medvezhiy Ruchey and Zapolyarnymines. These two mines are expected to triple output withinthree to four years.
• The upgrade and expansion project of the Talnakh mill isexpected to develop its capacity so that it can handle all millingactivities in Norilsk, ie approximately 10m tpa. Such anexpansion will allow the closing of the original Norilsk mill, builtin the early 1940s, which still processes nearly 60% of all NorilskCombinat ore.
• The Nadezhda smelter, the most modern in the Norilsk group,will concentrate strictly on smelting nickel concentrates, ratherthan its current configuration under which half of its capacity isused to process copper concentrates. Investment at theNadezhda smelter will include its renovation, to increasecapacity by 30%. Once complete, the expanded Nadezhdasmelter will be capable of smelting all of the nickel concentratesproduced at Norilsk Combinat, thereby making its second nickelsmelting unit redundant – and an easy candidate for closure.
• The Medny copper smelter/refinery at NGMK will benefit from anupgrade and capacity expansion. Under the project, capacity willincrease from 300,000tpa to 400,000tpa. Once completed, thisfacility will smelt and refine all copper concentrates produced bythe Talnakh mill.
21•
Fleming UCB Research Norilsk Nickel October 1999
• The company’s operations on the Kola peninsula have toundergo significant changes. Profitability at Severonickelremains low, first and foremost, because of the hightransportation costs of the raw materials supplied by NorilskCombinat. The company plans to refurbish the SeveronickelCombine and to focus its activities on copper and cobaltproduction. Furthermore, management is investigating thefeasibility of converting one ore-smelting furnace from theproduction of copper/nickel matte to ferrochromium. Thechromite ore would come from the company’s own deposit atSopcheozero.
• As a condition of the privatisation of the state’s 38% controllinginterest in Norilsk, the winning bidder was required tocontribute (on Norilsk’s behalf) US$300m for the developmentof the Pelyatkinskoe gas field. This investment is critical toensure that a long-term source of natural gas is available to theNorilsk Combinat.
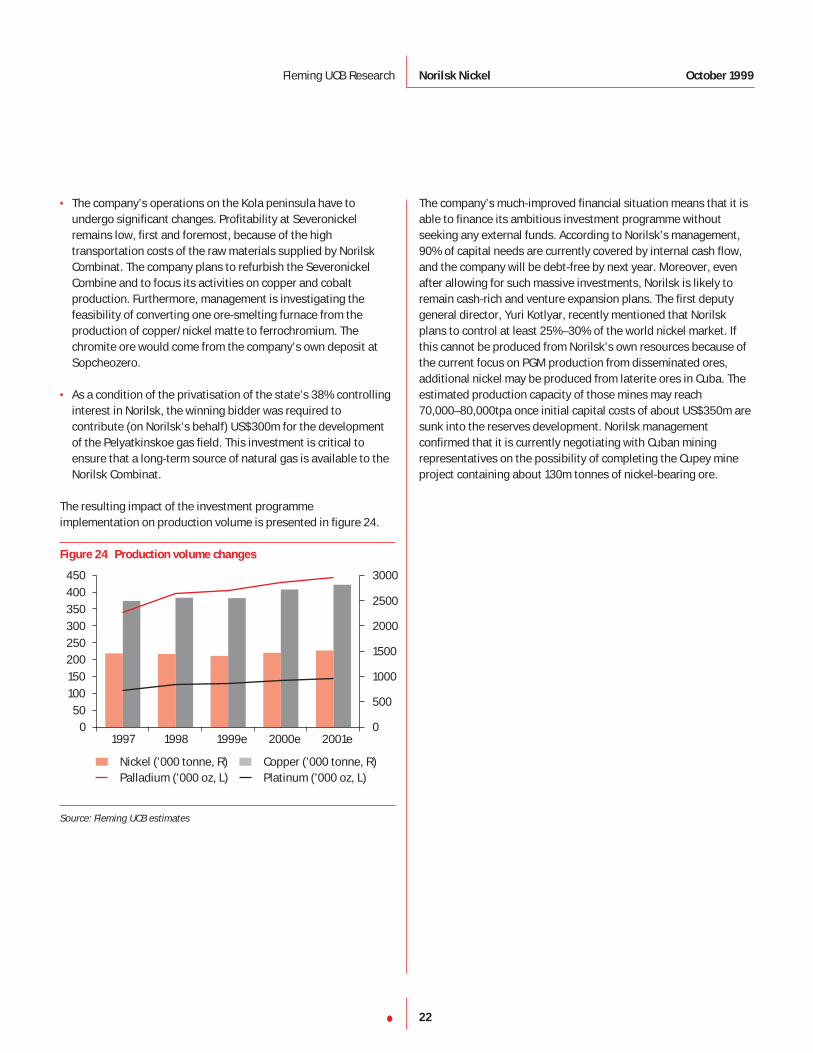
The resulting impact of the investment programmeimplementation on production volume is presented in figure 24.
Figure 24 Production volume changes
Nickel (’000 tonne, R) Copper (’000 tonne, R)Palladium (’000 oz, L) Platinum (’000 oz, L)
Source: Fleming UCB estimates
The company’s much-improved financial situation means that it isable to finance its ambitious investment programme withoutseeking any external funds. According to Norilsk’s management,90% of capital needs are currently covered by internal cash flow,and the company will be debt-free by next year. Moreover, evenafter allowing for such massive investments, Norilsk is likely toremain cash-rich and venture expansion plans. The first deputygeneral director, Yuri Kotlyar, recently mentioned that Norilskplans to control at least 25%–30% of the world nickel market. Ifthis cannot be produced from Norilsk’s own resources because ofthe current focus on PGM production from disseminated ores,additional nickel may be produced from laterite ores in Cuba. Theestimated production capacity of those mines may reach70,000–80,000tpa once initial capital costs of about US$350m aresunk into the reserves development. Norilsk managementconfirmed that it is currently negotiating with Cuban miningrepresentatives on the possibility of completing the Cupey mineproject containing about 130m tonnes of nickel-bearing ore.
1997 1998 1999e 2000e 2001e0
50100150200250300350400450
0
500
1000
1500
2000
2500
3000
22•
Fleming UCB Research Norilsk Nickel October 1999
Share structure and ownershipDevelopments of the share structure
Following the privatisation of the state’s controlling interest inAugust 1997, Norilsk planned and successfully executed a largenew rights issue of common shares. The combination of these twoevents has altered the balance of the share structure andstrengthened the Interros group’s controlling position. This in turnhas enabled the conversion of preferred shares. Finally, thecompany has taken all necessary steps to activate a Level 1 ADRprogramme, although the continuing turmoil in the financialmarkets is set to delay this.
Pre-rights issue, the Norilsk equity structure was divided into126m shares. Of these shares, 75% were common equity and 25%were preferred equity. In March 1998, the placement of 63mcommon shares at US$6.10 per share successfully raisedRbs 2,283m (US$392m at the time) for the company treasury, andtriggered a reduction of preferred shares in the equity structure to16%. Since very few of the company’s existing shareholdersexercised their pre-emptive rights to purchase an additional share,the Interros group was able to increase its interest in the companyfrom 38% to 54% of all shares issued.
With a controlling block assured, Interros, as the majorityshareholder, has allowed the simplification of the equity structureby permitting the long-awaited conversion of preferred shares. Theconversion, which was discussed at the company’s AGM in Junelast year, will be effected by a simple application procedure at theoption of each preferred shareholder. The first 13.7m preferredshares were converted in April 1999; future opportunity to convertwill take place either in April 2000, or when 5% of the initialnumber of prefs have been tendered for conversion. As the June1999 AGM decided not to pay dividends on preferred shares, theywere made voting for one year.
Norilsk Nickel and the Interros group
The overall negative market perception towards Russian FinancialIndustrial Groups, led by so-called ‘oligarkhs’ played a significantrole in stoking up investor fear of the stocks associated with them.However, the ownership of the Interros group has so far broughtonly positive developments to the company, and we have not yetseen any major threat to minority shareholders.
Interros, which controls Norilsk Nickel is by far the largestFinancial-Industrial Group in Russia, with interests spread over alarge number of companies in almost every sector of the Russianeconomy. The major holdings are the oil company Sidanko,aviation industry leader Perm Motors, NorthWest ShippingCompany and telecom holding Svyazinvest.
Although the holding has paid little or no attention in terms offurther developments to many of the constituents of its vastempire, Norilsk Nickel has not lacked attention from its parentcompany since it was acquired. The holding considers Norilsk tobe one of its most important long-term investments and, as such,it has subjected it to one of the most dynamic restructuringprocesses in Russia. The development of a long-term industrialstrategy also confirms the Interros group’s commitment; it willplay a significant role in increasing Norilsk Nickel’s transparencyin order to attract external investments.
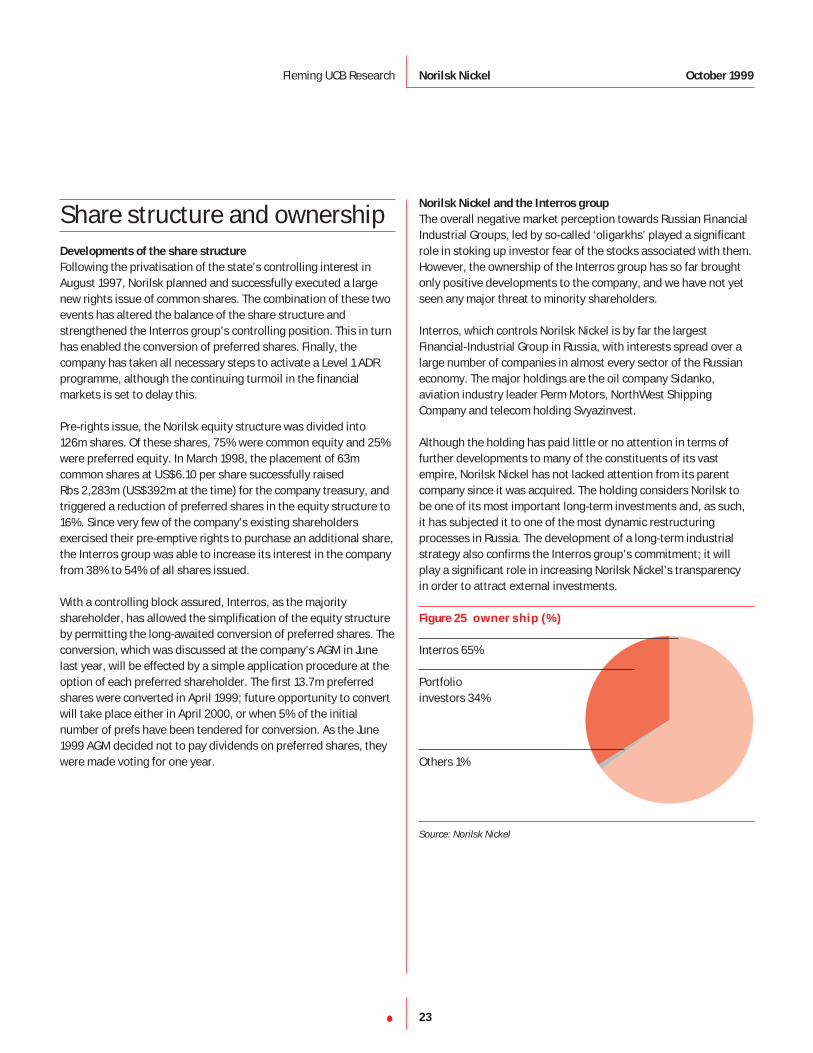
Figure 25 ownership (%)
Interros 65%
Portfolio investors 34%
Others 1%
Source: Norilsk Nickel
23•
Fleming UCB Research Norilsk Nickel October 1999
24•
Financial statements
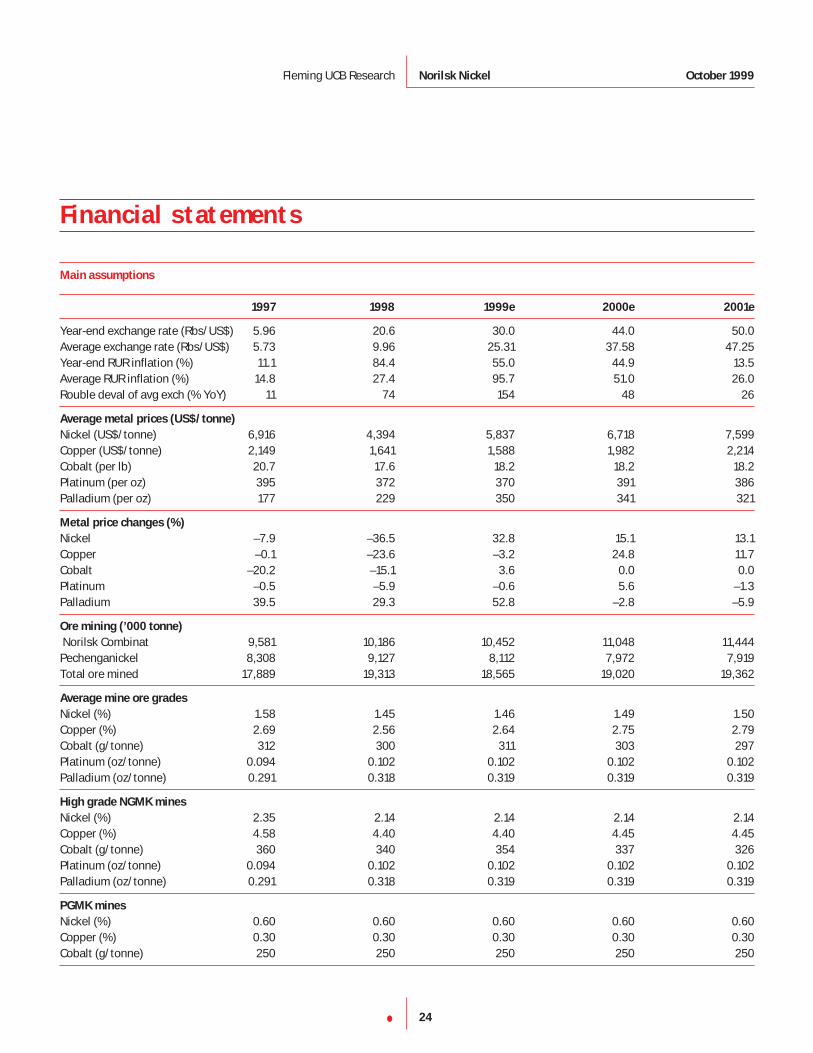
Main assumptions
1997 1998 1999e 2000e 2001e
Year-end exchange rate (Rbs/US$) 5.96 20.6 30.0 44.0 50.0Average exchange rate (Rbs/US$) 5.73 9.96 25.31 37.58 47.25Year-end RUR inflation (%) 11.1 84.4 55.0 44.9 13.5Average RUR inflation (%) 14.8 27.4 95.7 51.0 26.0Rouble deval of avg exch (% YoY) 11 74 154 48 26
Average metal prices (US$/tonne)
Nickel (US$/tonne) 6,916 4,394 5,837 6,718 7,599Copper (US$/tonne) 2,149 1,641 1,588 1,982 2,214Cobalt (per lb) 20.7 17.6 18.2 18.2 18.2Platinum (per oz) 395 372 370 391 386Palladium (per oz) 177 229 350 341 321
Metal price changes (%)
Nickel –7.9 –36.5 32.8 15.1 13.1Copper –0.1 –23.6 –3.2 24.8 11.7Cobalt –20.2 –15.1 3.6 0.0 0.0Platinum –0.5 –5.9 –0.6 5.6 –1.3Palladium 39.5 29.3 52.8 –2.8 –5.9
Ore mining (’000 tonne)
Norilsk Combinat 9,581 10,186 10,452 11,048 11,444 Pechenganickel 8,308 9,127 8,112 7,972 7,919 Total ore mined 17,889 19,313 18,565 19,020 19,362
Average mine ore grades
Nickel (%) 1.58 1.45 1.46 1.49 1.50Copper (%) 2.69 2.56 2.64 2.75 2.79Cobalt (g/tonne) 312 300 311 303 297Platinum (oz/tonne) 0.094 0.102 0.102 0.102 0.102Palladium (oz/tonne) 0.291 0.318 0.319 0.319 0.319
High grade NGMK mines
Nickel (%) 2.35 2.14 2.14 2.14 2.14Copper (%) 4.58 4.40 4.40 4.45 4.45Cobalt (g/tonne) 360 340 354 337 326 Platinum (oz/tonne) 0.094 0.102 0.102 0.102 0.102Palladium (oz/tonne) 0.291 0.318 0.319 0.319 0.319
PGMK mines
Nickel (%) 0.60 0.60 0.60 0.60 0.60Copper (%) 0.30 0.30 0.30 0.30 0.30Cobalt (g/tonne) 250 250 250 250 250
Fleming UCB Research Norilsk Nickel October 1999
25•
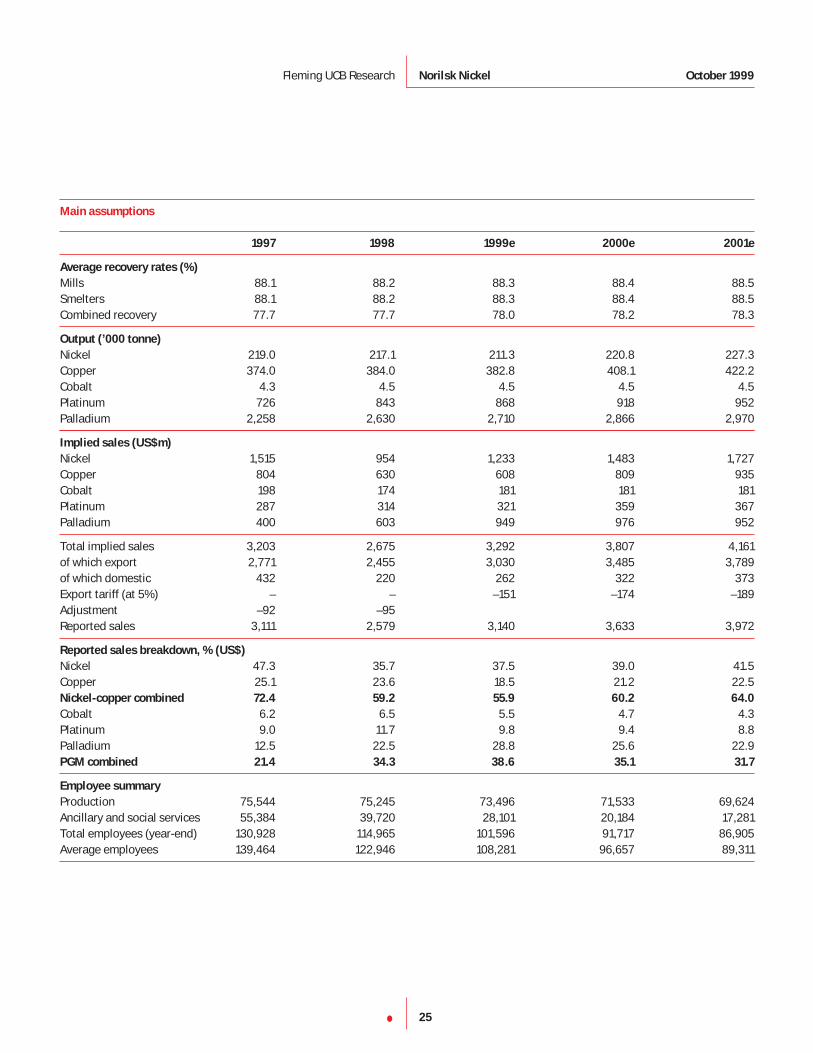
Main assumptions
1997 1998 1999e 2000e 2001e
Average recovery rates (%)
Mills 88.1 88.2 88.3 88.4 88.5Smelters 88.1 88.2 88.3 88.4 88.5Combined recovery 77.7 77.7 78.0 78.2 78.3
Output (’000 tonne)
Nickel 219.0 217.1 211.3 220.8 227.3Copper 374.0 384.0 382.8 408.1 422.2Cobalt 4.3 4.5 4.5 4.5 4.5Platinum 726 843 868 918 952Palladium 2,258 2,630 2,710 2,866 2,970
Implied sales (US$m)
Nickel 1,515 954 1,233 1,483 1,727Copper 804 630 608 809 935Cobalt 198 174 181 181 181Platinum 287 314 321 359 367Palladium 400 603 949 976 952
Total implied sales 3,203 2,675 3,292 3,807 4,161of which export 2,771 2,455 3,030 3,485 3,789of which domestic 432 220 262 322 373Export tariff (at 5%) – – –151 –174 –189Adjustment –92 –95Reported sales 3,111 2,579 3,140 3,633 3,972
Reported sales breakdown, % (US$)
Nickel 47.3 35.7 37.5 39.0 41.5Copper 25.1 23.6 18.5 21.2 22.5Nickel-copper combined 72.4 59.2 55.9 60.2 64.0
Cobalt 6.2 6.5 5.5 4.7 4.3Platinum 9.0 11.7 9.8 9.4 8.8Palladium 12.5 22.5 28.8 25.6 22.9PGM combined 21.4 34.3 38.6 35.1 31.7
Employee summary
Production 75,544 75,245 73,496 71,533 69,624Ancillary and social services 55,384 39,720 28,101 20,184 17,281Total employees (year-end) 130,928 114,965 101,596 91,717 86,905Average employees 139,464 122,946 108,281 96,657 89,311
Fleming UCB Research Norilsk Nickel October 1999
26•
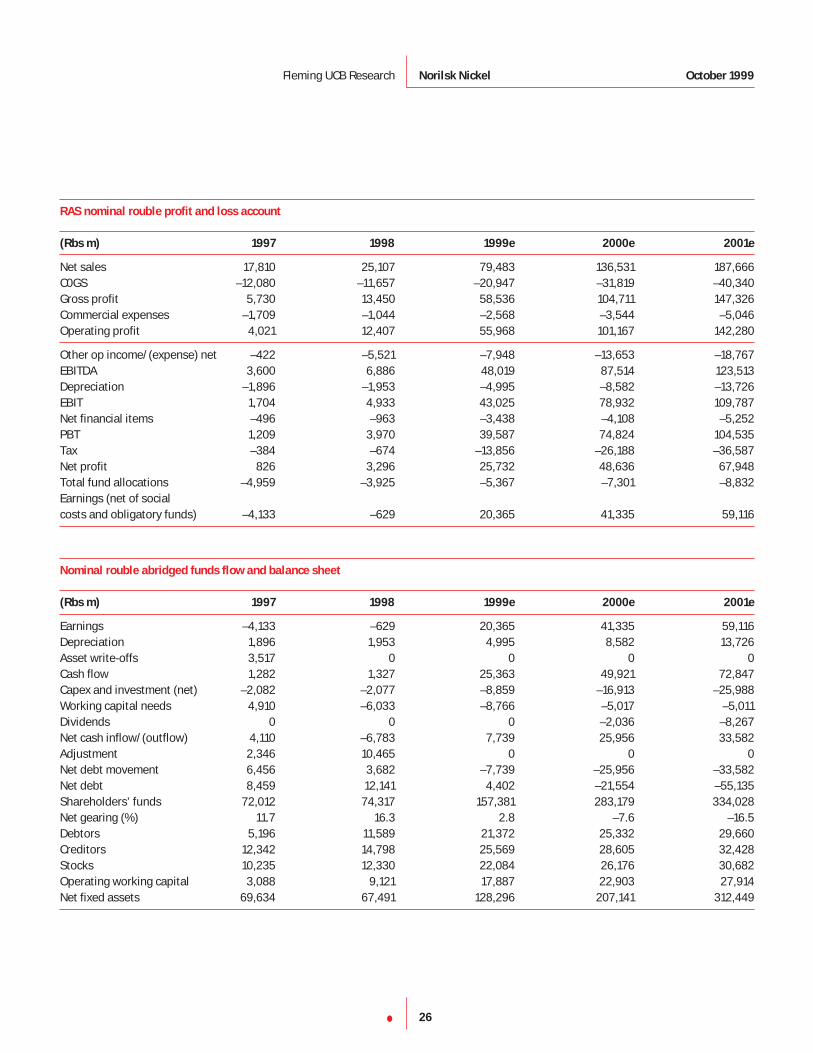
RAS nominal rouble profit and loss account
(Rbs m) 1997 1998 1999e 2000e 2001e
Net sales 17,810 25,107 79,483 136,531 187,666C0GS –12,080 –11,657 –20,947 –31,819 –40,340Gross profit 5,730 13,450 58,536 104,711 147,326Commercial expenses –1,709 –1,044 –2,568 –3,544 –5,046Operating profit 4,021 12,407 55,968 101,167 142,280
Other op income/(expense) net –422 –5,521 –7,948 –13,653 –18,767EBITDA 3,600 6,886 48,019 87,514 123,513Depreciation –1,896 –1,953 –4,995 –8,582 –13,726EBIT 1,704 4,933 43,025 78,932 109,787Net financial items –496 –963 –3,438 –4,108 –5,252PBT 1,209 3,970 39,587 74,824 104,535Tax –384 –674 –13,856 –26,188 –36,587Net profit 826 3,296 25,732 48,636 67,948Total fund allocations –4,959 –3,925 –5,367 –7,301 –8,832Earnings (net of social costs and obligatory funds) –4,133 –629 20,365 41,335 59,116
Nominal rouble abridged funds flow and balance sheet
(Rbs m) 1997 1998 1999e 2000e 2001e
Earnings –4,133 –629 20,365 41,335 59,116Depreciation 1,896 1,953 4,995 8,582 13,726Asset write-offs 3,517 0 0 0 0Cash flow 1,282 1,327 25,363 49,921 72,847Capex and investment (net) –2,082 –2,077 –8,859 –16,913 –25,988Working capital needs 4,910 –6,033 –8,766 –5,017 –5,011Dividends 0 0 0 –2,036 –8,267Net cash inflow/(outflow) 4,110 –6,783 7,739 25,956 33,582Adjustment 2,346 10,465 0 0 0Net debt movement 6,456 3,682 –7,739 –25,956 –33,582Net debt 8,459 12,141 4,402 –21,554 –55,135Shareholders’ funds 72,012 74,317 157,381 283,179 334,028Net gearing (%) 11.7 16.3 2.8 –7.6 –16.5Debtors 5,196 11,589 21,372 25,332 29,660Creditors 12,342 14,798 25,569 28,605 32,428Stocks 10,235 12,330 22,084 26,176 30,682Operating working capital 3,088 9,121 17,887 22,903 27,914Net fixed assets 69,634 67,491 128,296 207,141 312,449
Fleming UCB Research Norilsk Nickel October 1999
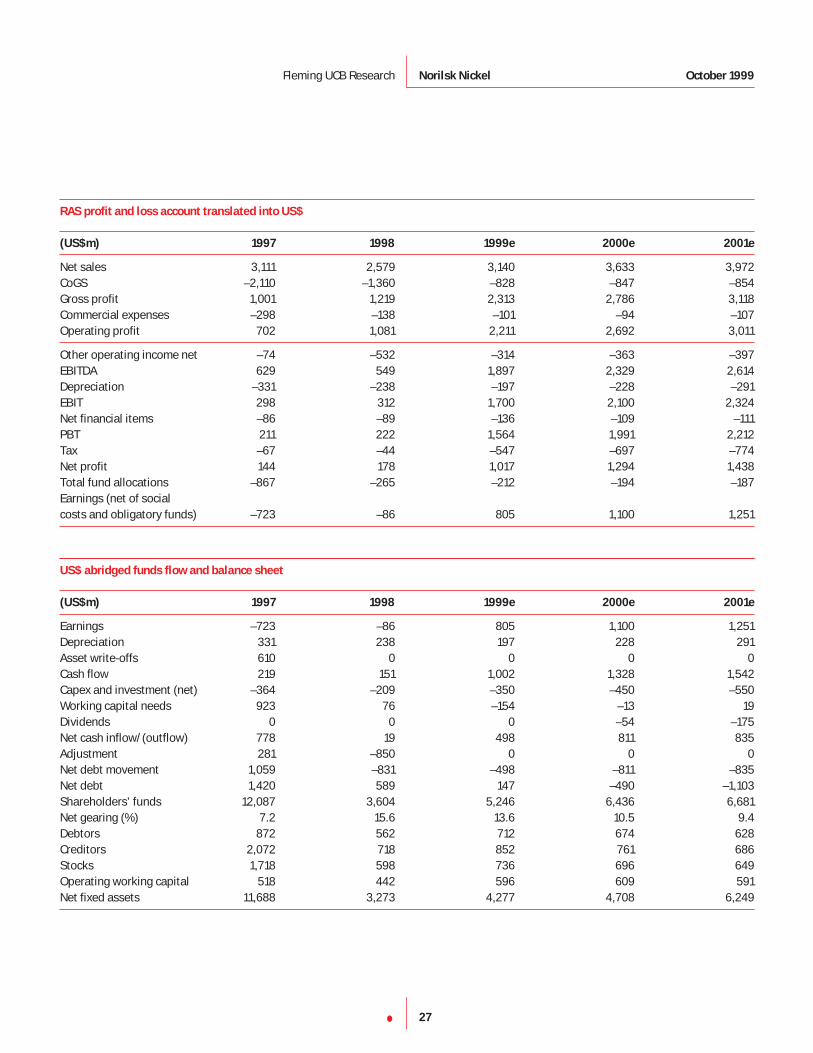
27•
RAS profit and loss account translated into US$
(US$m) 1997 1998 1999e 2000e 2001e
Net sales 3,111 2,579 3,140 3,633 3,972CoGS –2,110 –1,360 –828 –847 –854Gross profit 1,001 1,219 2,313 2,786 3,118Commercial expenses –298 –138 –101 –94 –107Operating profit 702 1,081 2,211 2,692 3,011
Other operating income net –74 –532 –314 –363 –397EBITDA 629 549 1,897 2,329 2,614Depreciation –331 –238 –197 –228 –291EBIT 298 312 1,700 2,100 2,324Net financial items –86 –89 –136 –109 –111PBT 211 222 1,564 1,991 2,212Tax –67 –44 –547 –697 –774Net profit 144 178 1,017 1,294 1,438Total fund allocations –867 –265 –212 –194 –187Earnings (net of social costs and obligatory funds) –723 –86 805 1,100 1,251
US$ abridged funds flow and balance sheet
(US$m) 1997 1998 1999e 2000e 2001e
Earnings –723 –86 805 1,100 1,251Depreciation 331 238 197 228 291Asset write-offs 610 0 0 0 0Cash flow 219 151 1,002 1,328 1,542Capex and investment (net) –364 –209 –350 –450 –550Working capital needs 923 76 –154 –13 19Dividends 0 0 0 –54 –175Net cash inflow/(outflow) 778 19 498 811 835Adjustment 281 –850 0 0 0Net debt movement 1,059 –831 –498 –811 –835Net debt 1,420 589 147 –490 –1,103Shareholders’ funds 12,087 3,604 5,246 6,436 6,681Net gearing (%) 7.2 15.6 13.6 10.5 9.4Debtors 872 562 712 674 628Creditors 2,072 718 852 761 686Stocks 1,718 598 736 696 649Operating working capital 518 442 596 609 591Net fixed assets 11,688 3,273 4,277 4,708 6,249
Fleming UCB Research Norilsk Nickel October 1999
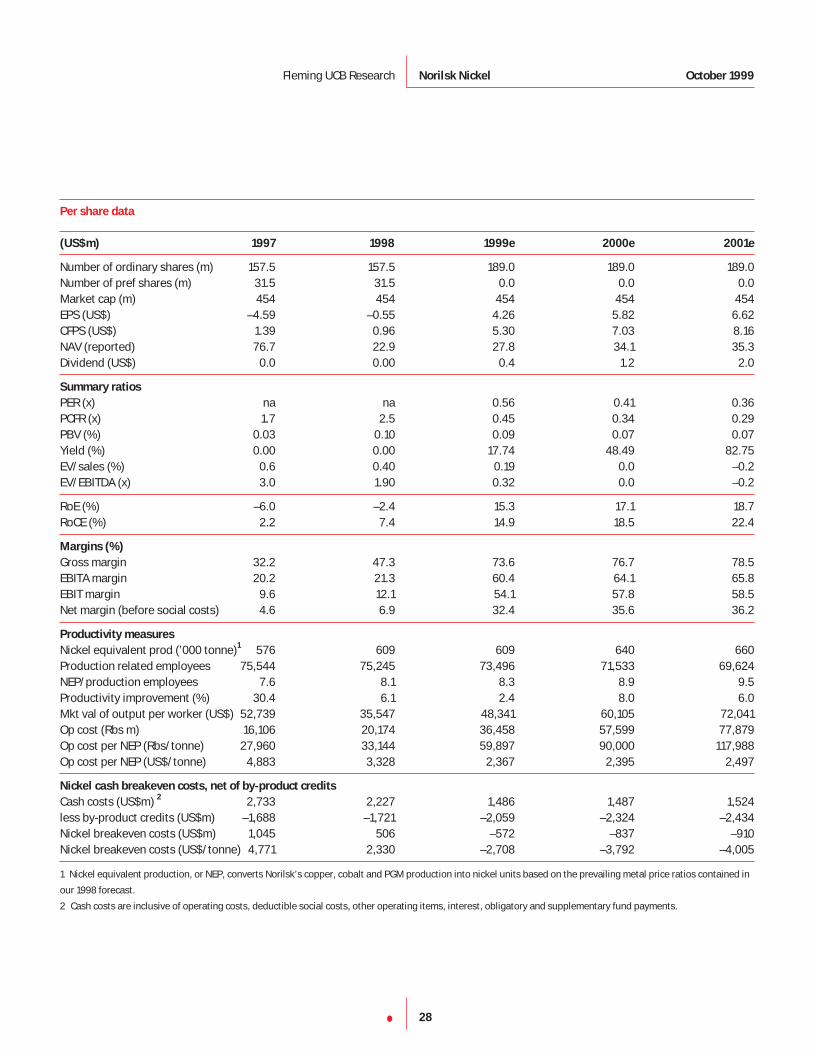
28•
Per share data
(US$m) 1997 1998 1999e 2000e 2001e
Number of ordinary shares (m) 157.5 157.5 189.0 189.0 189.0Number of pref shares (m) 31.5 31.5 0.0 0.0 0.0Market cap (m) 454 454 454 454 454EPS (US$) –4.59 –0.55 4.26 5.82 6.62CFPS (US$) 1.39 0.96 5.30 7.03 8.16NAV (reported) 76.7 22.9 27.8 34.1 35.3Dividend (US$) 0.0 0.00 0.4 1.2 2.0
Summary ratios
PER (x) na na 0.56 0.41 0.36PCFR (x) 1.7 2.5 0.45 0.34 0.29PBV (%) 0.03 0.10 0.09 0.07 0.07Yield (%) 0.00 0.00 17.74 48.49 82.75EV/sales (%) 0.6 0.40 0.19 0.0 –0.2EV/EBITDA (x) 3.0 1.90 0.32 0.0 –0.2
RoE (%) –6.0 –2.4 15.3 17.1 18.7RoCE (%) 2.2 7.4 14.9 18.5 22.4
Margins (%)
Gross margin 32.2 47.3 73.6 76.7 78.5EBITA margin 20.2 21.3 60.4 64.1 65.8EBIT margin 9.6 12.1 54.1 57.8 58.5Net margin (before social costs) 4.6 6.9 32.4 35.6 36.2
Productivity measures
Nickel equivalent prod (’000 tonne)1 576 609 609 640 660Production related employees 75,544 75,245 73,496 71,533 69,624NEP/production employees 7.6 8.1 8.3 8.9 9.5Productivity improvement (%) 30.4 6.1 2.4 8.0 6.0Mkt val of output per worker (US$) 52,739 35,547 48,341 60,105 72,041Op cost (Rbs m) 16,106 20,174 36,458 57,599 77,879Op cost per NEP (Rbs/tonne) 27,960 33,144 59,897 90,000 117,988Op cost per NEP (US$/tonne) 4,883 3,328 2,367 2,395 2,497
Nickel cash breakeven costs, net of by-product credits
Cash costs (US$m) 2 2,733 2,227 1,486 1,487 1,524less by-product credits (US$m) –1,688 –1,721 –2,059 –2,324 –2,434Nickel breakeven costs (US$m) 1,045 506 –572 –837 –910Nickel breakeven costs (US$/tonne) 4,771 2,330 –2,708 –3,792 –4,005
1 Nickel equivalent production, or NEP, converts Norilsk’s copper, cobalt and PGM production into nickel units based on the prevailing metal price ratios contained in
our 1998 forecast.
2 Cash costs are inclusive of operating costs, deductible social costs, other operating items, interest, obligatory and supplementary fund payments.
Fleming UCB Research Norilsk Nickel October 1999
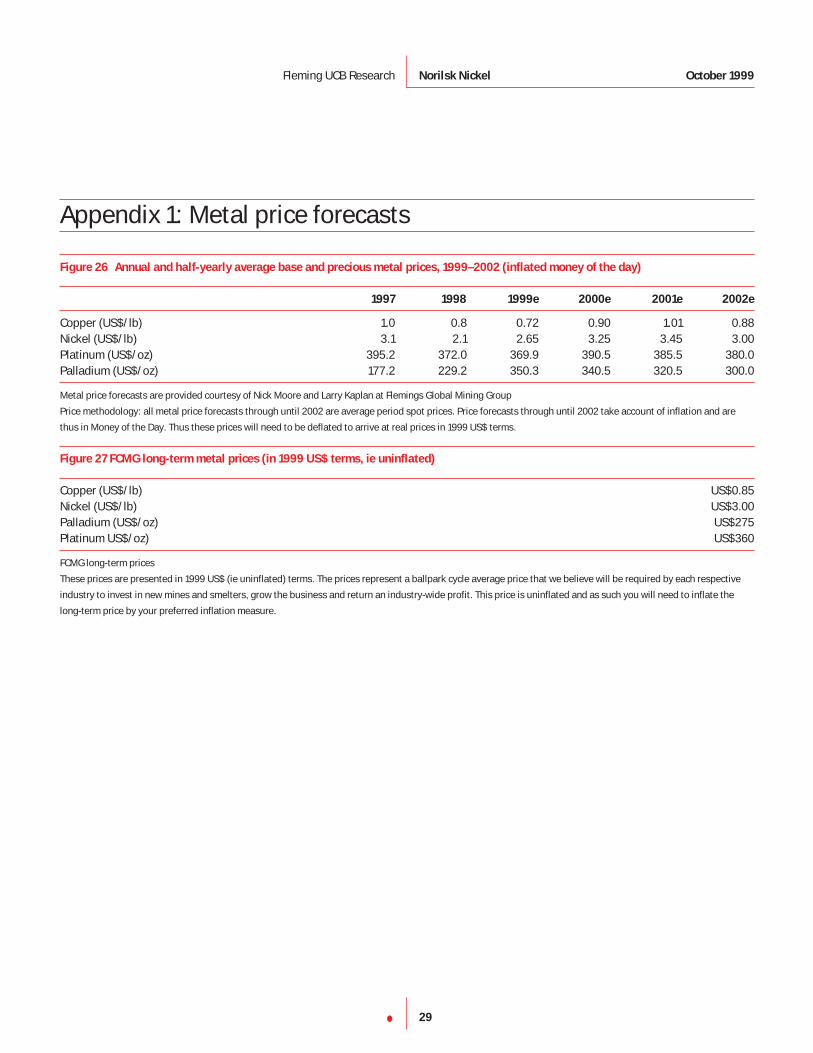
29•
Appendix 1: Metal price forecasts
Figure 26 Annual and half-yearly average base and precious metal prices, 1999–2002 (inflated money of the day)
1997 1998 1999e 2000e 2001e 2002e
Copper (US$/lb) 1.0 0.8 0.72 0.90 1.01 0.88Nickel (US$/lb) 3.1 2.1 2.65 3.25 3.45 3.00Platinum (US$/oz) 395.2 372.0 369.9 390.5 385.5 380.0Palladium (US$/oz) 177.2 229.2 350.3 340.5 320.5 300.0
Metal price forecasts are provided courtesy of Nick Moore and Larry Kaplan at Flemings Global Mining Group
Price methodology: all metal price forecasts through until 2002 are average period spot prices. Price forecasts through until 2002 take account of inflation and are
thus in Money of the Day. Thus these prices will need to be deflated to arrive at real prices in 1999 US$ terms.
Figure 27 FCMG long-term metal prices (in 1999 US$ terms, ie uninflated)
Copper (US$/lb) US$0.85Nickel (US$/lb) US$3.00Palladium (US$/oz) US$275Platinum US$/oz) US$360
FCMG long-term prices
These prices are presented in 1999 US$ (ie uninflated) terms. The prices represent a ballpark cycle average price that we believe will be required by each respective
industry to invest in new mines and smelters, grow the business and return an industry-wide profit. This price is uninflated and as such you will need to inflate the
long-term price by your preferred inflation measure.
Fleming UCB Research Norilsk Nickel October 1999
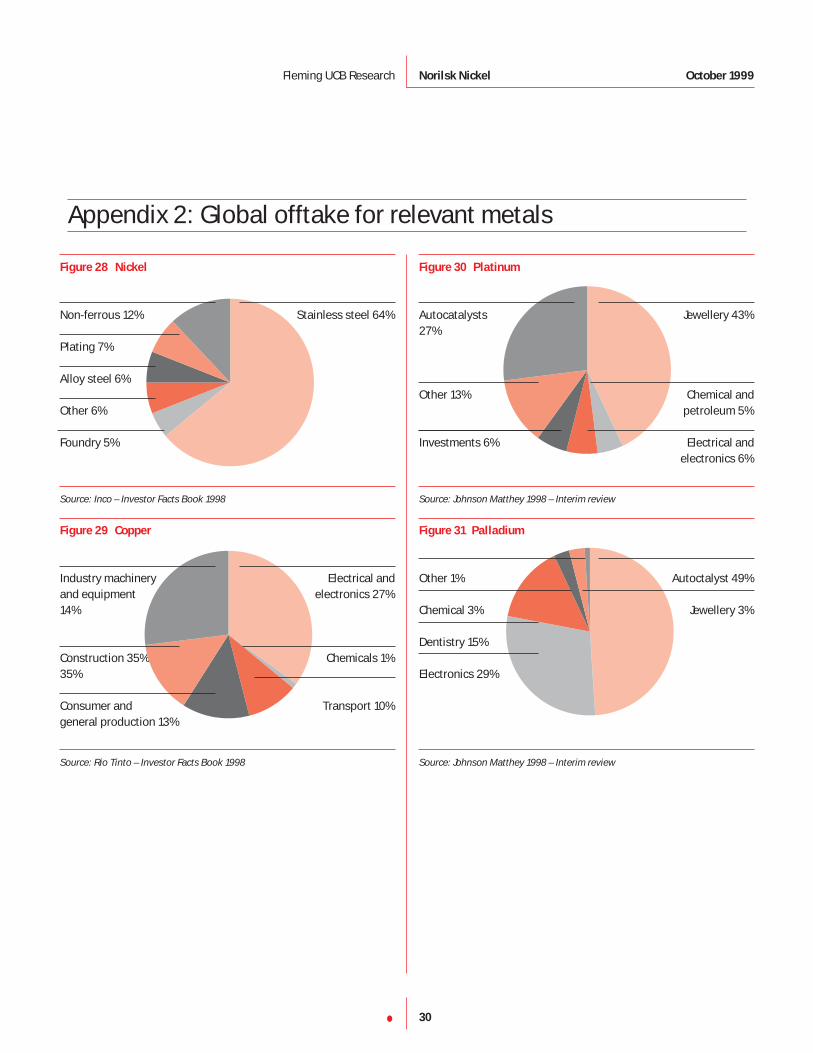
Figure 28 Nickel
Non-ferrous 12% Stainless steel 64%
Plating 7%
Alloy steel 6%
Other 6%
Foundry 5%
Source: Inco – Investor Facts Book 1998
Figure 29 Copper
Industry machinery Electrical andand equipment electronics 27%14%
Construction 35% Chemicals 1%35%
Consumer and Transport 10%general production 13%
Source: Rio Tinto – Investor Facts Book 1998
Figure 30 Platinum
Autocatalysts Jewellery 43%27%
Other 13% Chemical andpetroleum 5%
Investments 6% Electrical andelectronics 6%
Source: Johnson Matthey 1998 – Interim review
Figure 31 Palladium
Other 1% Autoctalyst 49%
Chemical 3% Jewellery 3%
Dentistry 15%
Electronics 29%
Source: Johnson Matthey 1998 – Interim review
30•
Fleming UCB Research Norilsk Nickel October 1999
Appendix 2: Global offtake for relevant metals
31•
Fleming UCB Research Norilsk Nickel October 1999
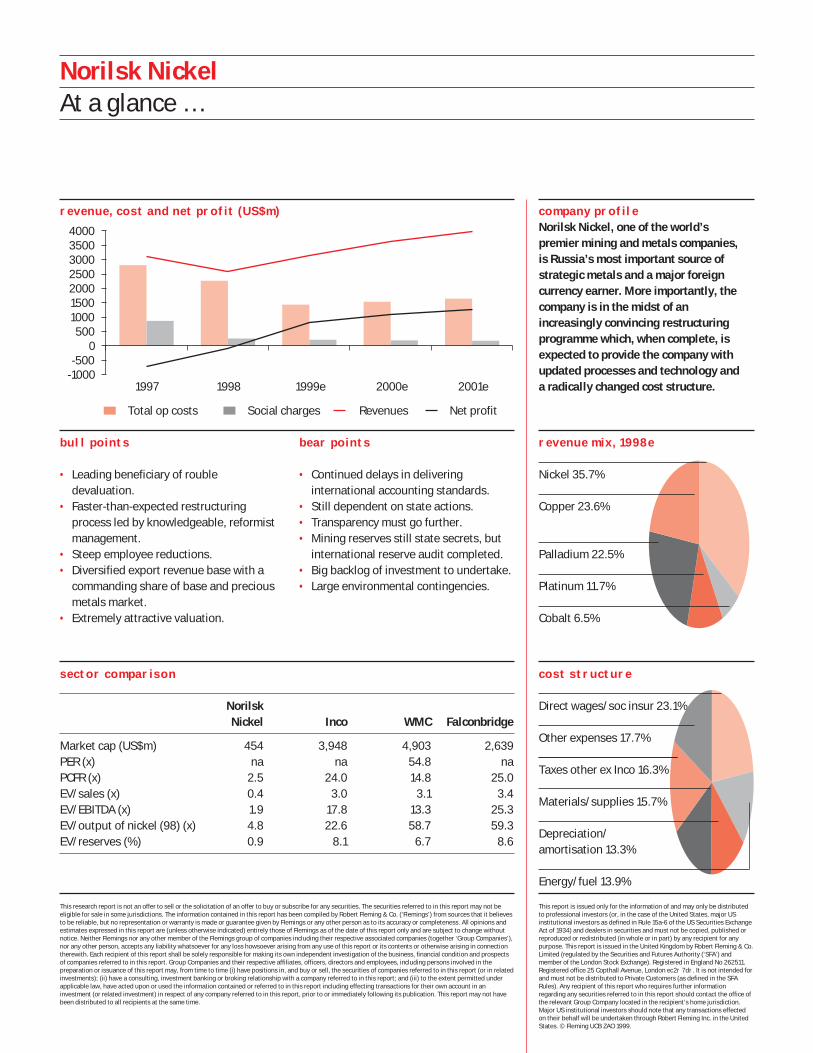
This research report is not an offer to sell or the solicitation of an offer to buy or subscribe for any securities. The securities referred to in this report may not beeligible for sale in some jurisdictions. The information contained in this report has been compiled by Robert Fleming & Co. (‘Flemings’) from sources that it believesto be reliable, but no representation or warranty is made or guarantee given by Flemings or any other person as to its accuracy or completeness. All opinions andestimates expressed in this report are (unless otherwise indicated) entirely those of Flemings as of the date of this report only and are subject to change withoutnotice. Neither Flemings nor any other member of the Flemings group of companies including their respective associated companies (together ‘Group Companies’),nor any other person, accepts any liability whatsoever for any loss howsoever arising from any use of this report or its contents or otherwise arising in connectiontherewith. Each recipient of this report shall be solely responsible for making its own independent investigation of the business, financial condition and prospectsof companies referred to in this report. Group Companies and their respective affiliates, officers, directors and employees, including persons involved in thepreparation or issuance of this report may, from time to time (i) have positions in, and buy or sell, the securities of companies referred to in this report (or in relatedinvestments); (ii) have a consulting, investment banking or broking relationship with a company referred to in this report; and (iii) to the extent permitted underapplicable law, have acted upon or used the information contained or referred to in this report including effecting transactions for their own account in aninvestment (or related investment) in respect of any company referred to in this report, prior to or immediately following its publication. This report may not havebeen distributed to all recipients at the same time.
This report is issued only for the information of and may only be distributedto professional investors (or, in the case of the United States, major USinstitutional investors as defined in Rule 15a-6 of the US Securities ExchangeAct of 1934) and dealers in securities and must not be copied, published orreproduced or redistributed (in whole or in part) by any recipient for anypurpose. This report is issued in the United Kingdom by Robert Fleming & Co.Limited (regulated by the Securities and Futures Authority (‘SFA’) andmember of the London Stock Exchange). Registered in England No 262511.Registered office 25 Copthall Avenue, London ec2r 7dr. It is not intended forand must not be distributed to Private Customers (as defined in the SFARules). Any recipient of this report who requires further informationregarding any securities referred to in this report should contact the office ofthe relevant Group Company located in the recipient’s home jurisdiction.Major US institutional investors should note that any transactions effectedon their behalf will be undertaken through Robert Fleming Inc. in the UnitedStates. © Fleming UCB ZAO 1999.
bull points
• Leading beneficiary of roubledevaluation.
• Faster-than-expected restructuringprocess led by knowledgeable, reformistmanagement.
• Steep employee reductions.• Diversified export revenue base with a
commanding share of base and preciousmetals market.
• Extremely attractive valuation.
bear points
• Continued delays in deliveringinternational accounting standards.
• Still dependent on state actions.• Transparency must go further.• Mining reserves still state secrets, but
international reserve audit completed. • Big backlog of investment to undertake.• Large environmental contingencies.
cost structure
Direct wages/soc insur 23.1%
Other expenses 17.7%
Taxes other ex Inco 16.3%
Materials/supplies 15.7%
Depreciation/ amortisation 13.3%
Energy/fuel 13.9%
sector comparison
Norilsk
Nickel Inco WMC Falconbridge
Market cap (US$m) 454 3,948 4,903 2,639PER (x) na na 54.8 naPCFR (x) 2.5 24.0 14.8 25.0EV/sales (x) 0.4 3.0 3.1 3.4EV/EBITDA (x) 1.9 17.8 13.3 25.3EV/output of nickel (98) (x) 4.8 22.6 58.7 59.3EV/reserves (%) 0.9 8.1 6.7 8.6
revenue, cost and net profit (US$m)
revenue mix, 1998e
Nickel 35.7%
Copper 23.6%
Palladium 22.5%
Platinum 11.7%
Cobalt 6.5%
Norilsk NickelAt a glance …
company profileNorilsk Nickel, one of the world’s
premier mining and metals companies,
is Russia’s most important source of
strategic metals and a major foreign
currency earner. More importantly, the
company is in the midst of an
increasingly convincing restructuring
programme which, when complete, is
expected to provide the company with
updated processes and technology and
a radically changed cost structure. 1997 1998 1999e 2000e 2001e-1000-500
0500
1000150020002500300035004000
Total op costs Social charges Revenues Net profit


![I :@ f COIQBOQ # ]8A AY:8FO6 ]:collegecirculars.unipune.ac.in/sites/documents/NSS...I :@ f COIQBOQ # ]8A AY:8FO6 ]: ¿]8 AO ¿O/OB * OB * A #];* OCT PY7Q #JA:](https://img.pdfslide.net/doc/110x75/5fb194dcda39141ce24fd47a/i-f-coiqboq-8a-ay8fo6-i-f-coiqboq-8a-ay8fo6-8-ao-oob.jpg)