Embed Size (px)
Citation preview
Goals• Develop models to relate “stream health”
to land use change and climate change• Parameterize models using data from study sites,
past work, and newly proposed experiments
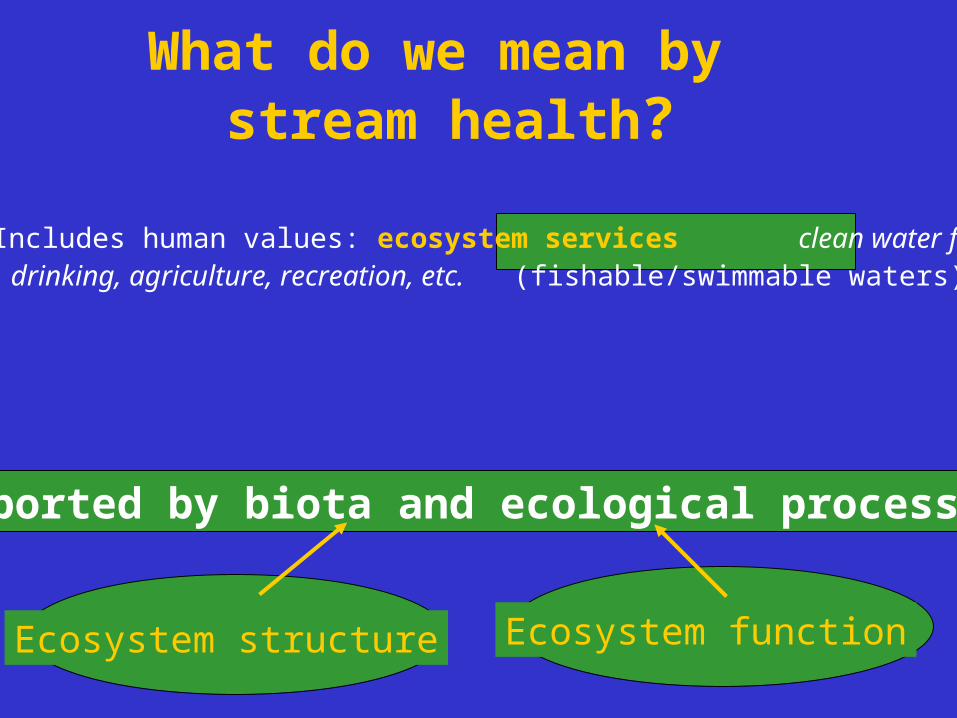
What do we mean by stream health?
Includes human values: ecosystem services clean water for drinking, agriculture, recreation, etc. (fishable/swimmable waters)
supported by biota and ecological processes
Ecosystem structure Ecosystem function
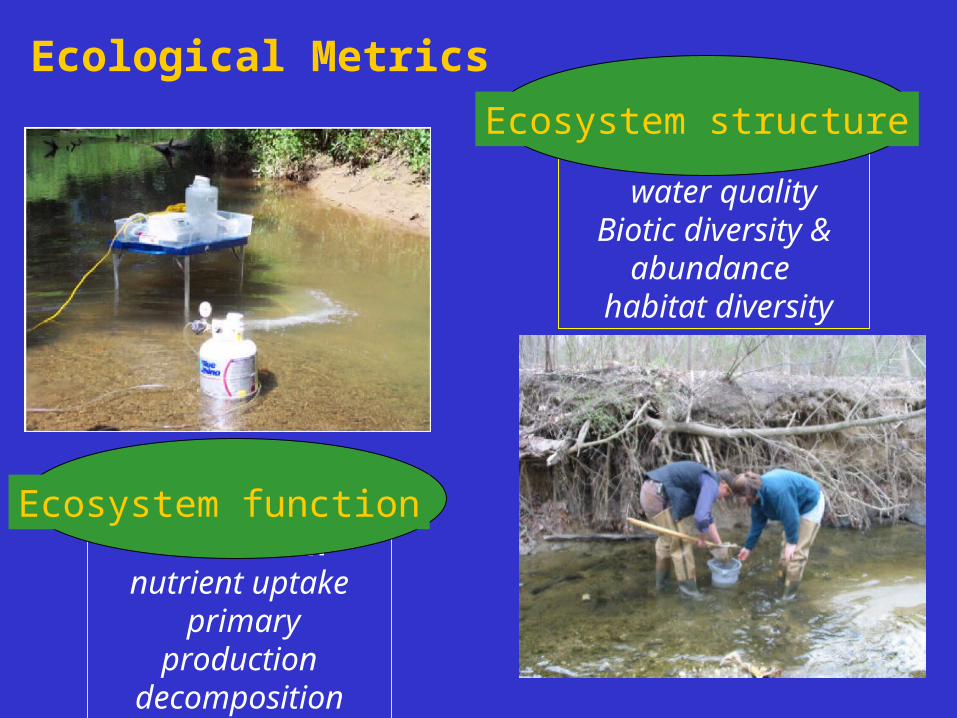
Structure water quality
Biotic diversity & abundance
habitat diversity
Ecological Metrics
Function nutrient uptake
primary productiondecomposition
Ecosystem structure
Ecosystem function
0
5
10
15
20re
ach
up
take
/ flu
x
nwb pb hr cc
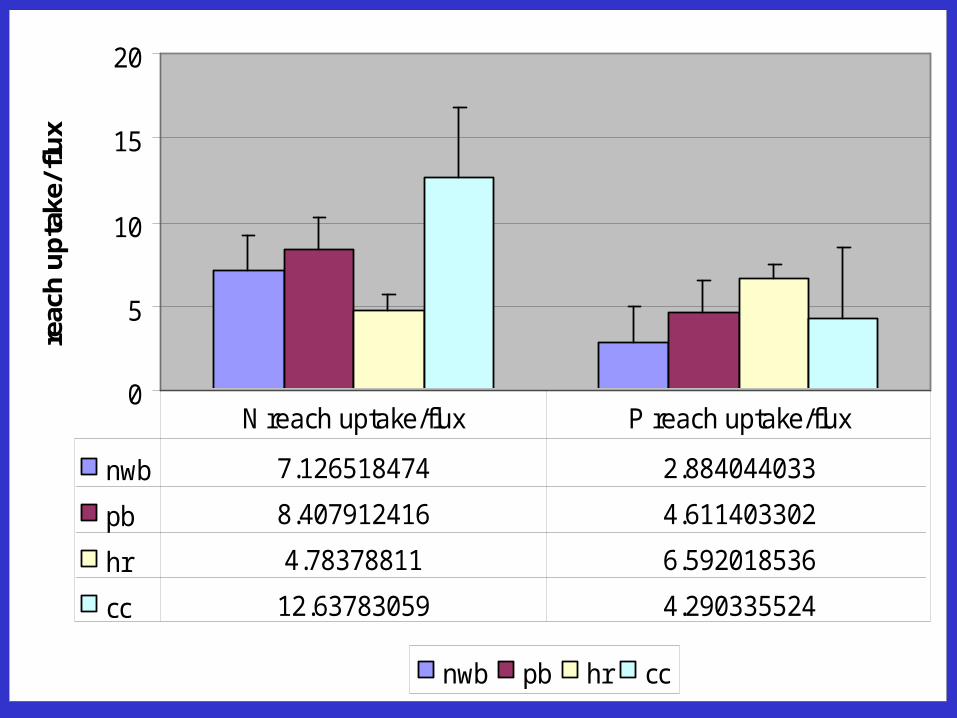
nwb 7.126518474 2.884044033
pb 8.407912416 4.611403302
hr 4.78378811 6.592018536
cc 12.63783059 4.290335524
N reach uptake/flux P reach uptake/flux
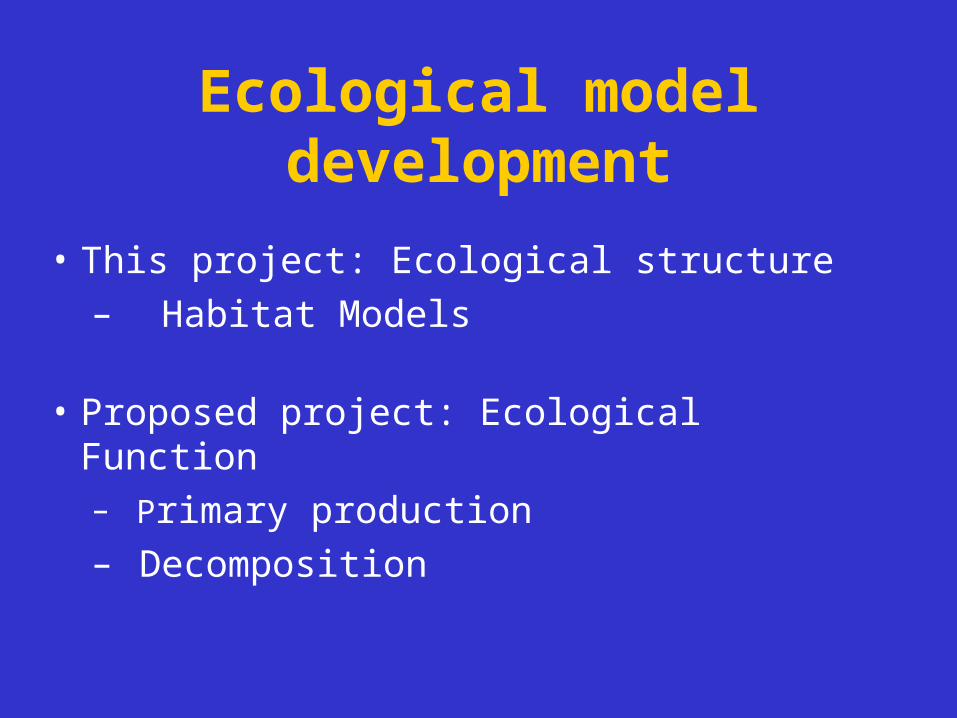
Ecological model development
• This project: Ecological structure
– Habitat Models
• Proposed project: Ecological Function– Primary production
– Decomposition
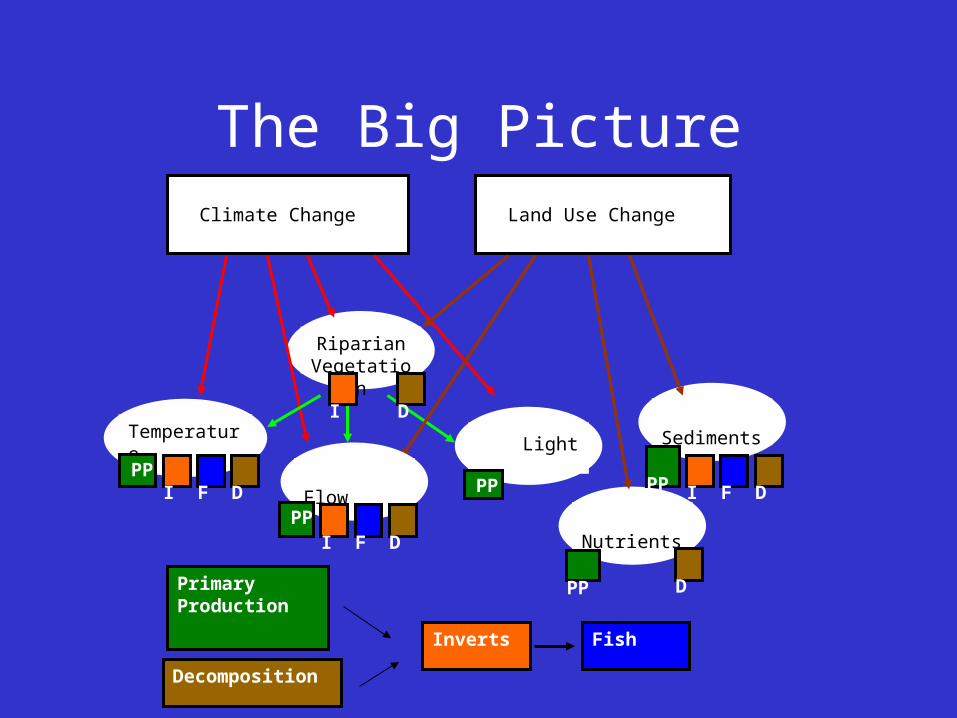
Primary Production
Inverts Fish
Decomposition
Riparian Vegetation
Sediments
Nutrients
LightTemperature
Climate Change Land Use Change
Light
Flow PP I F D
PP I F D
PP
PP D
PP I F D
I D
The Big Picture
Three Modelling Tasks
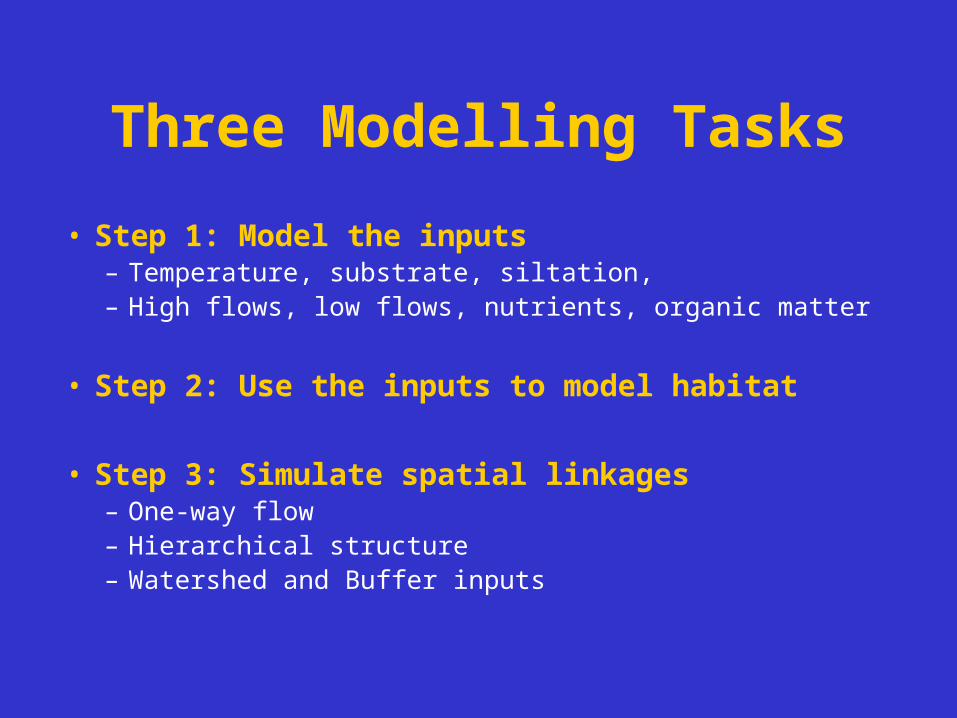
• Step 1: Model the inputs– Temperature, substrate, siltation, – High flows, low flows, nutrients, organic matter
• Step 2: Use the inputs to model habitat
• Step 3: Simulate spatial linkages– One-way flow– Hierarchical structure– Watershed and Buffer inputs
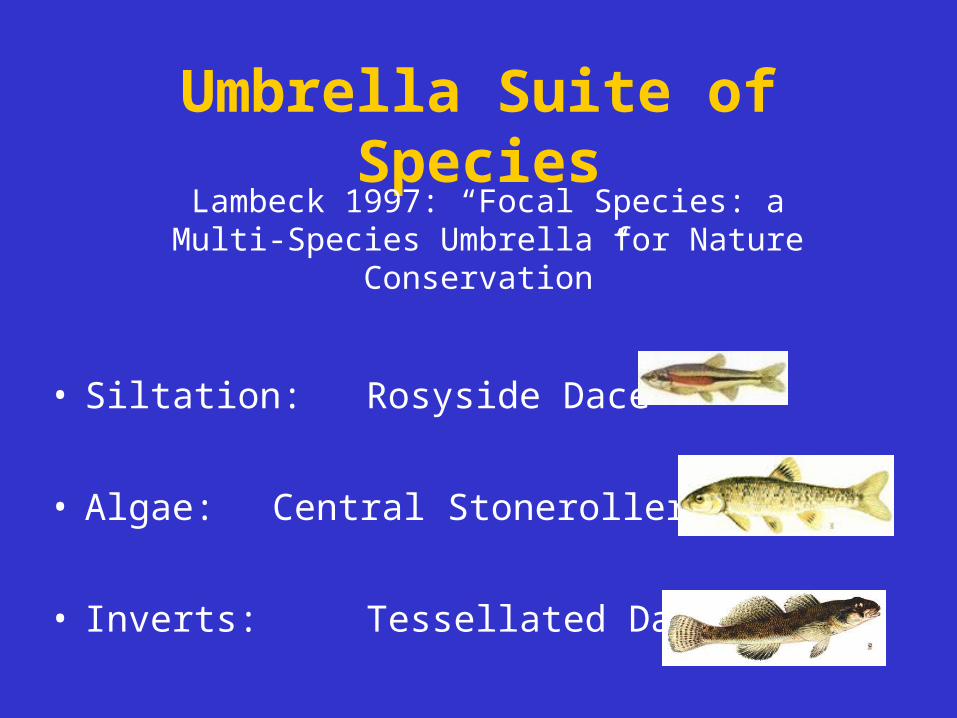
Umbrella Suite of Species
• Siltation: Rosyside Dace
• Algae: Central Stoneroller
• Inverts: Tessellated Darter
Lambeck 1997: “Focal Species: a Multi-Species Umbrella for Nature Conservation”
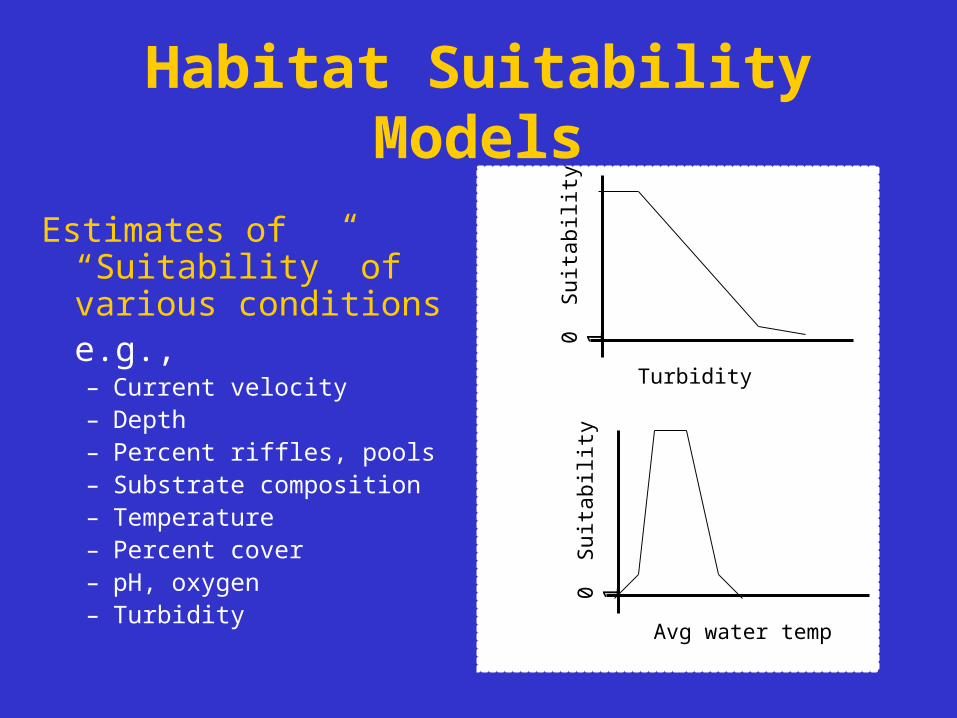
Habitat Suitability Models
Turbidity
0 Suit
abili
ty 1
Estimates of “Suitability” of various conditionse.g., – Current velocity – Depth– Percent riffles, pools– Substrate composition– Temperature – Percent cover– pH, oxygen– Turbidity
0 Suit
abili
ty 1
Avg water temp
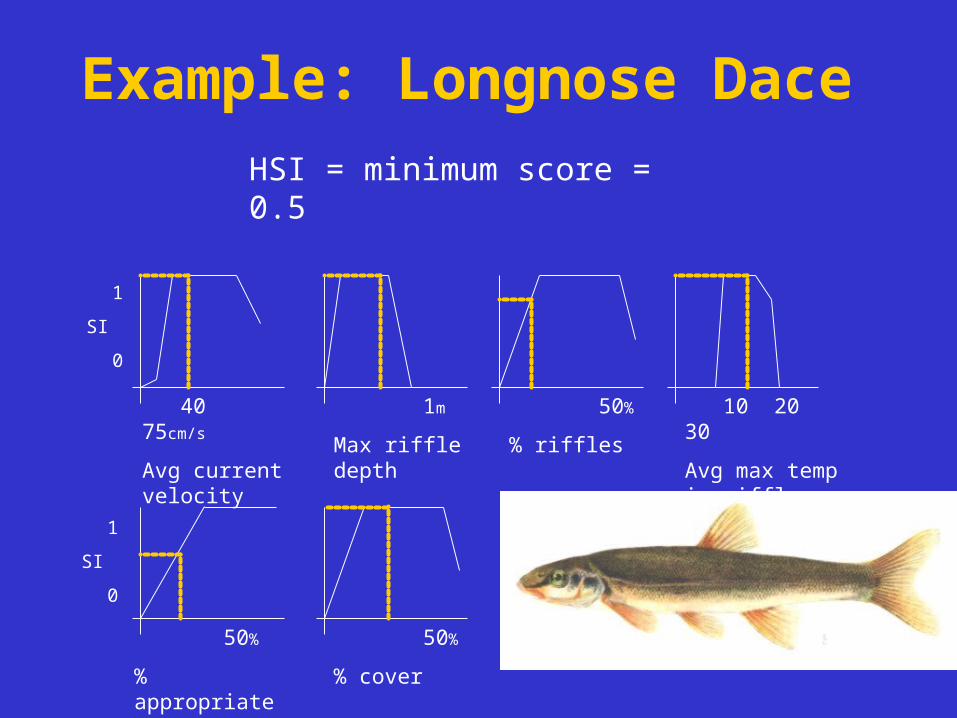
Example: Longnose Dace
40 75cm/s
Avg current velocity
1m
Max riffle depth
50%
% riffles
10 20 30
Avg max temp in riffles
50%
% appropriate substrate
50%
% cover
HSI = minimum score = 0.5
1
SI
0
1
SI
0
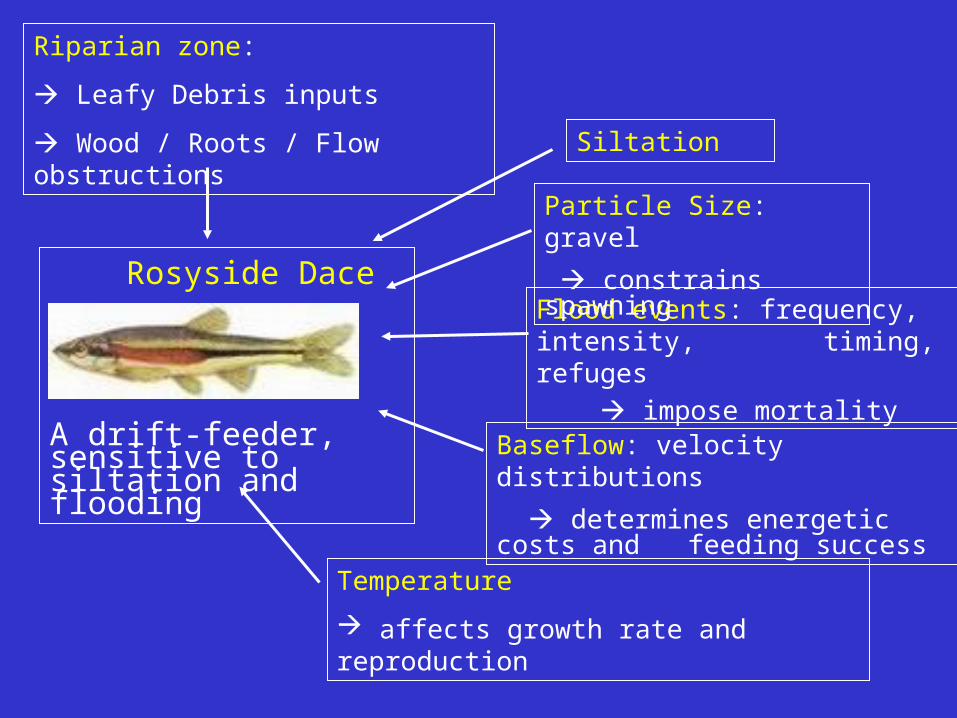
Siltation
Flood events: frequency, intensity, timing, refuges
impose mortality
Particle Size: gravel
constrains spawning
Baseflow: velocity distributions
determines energetic costs and feeding success
Temperature
affects growth rate and reproduction
Riparian zone:
Leafy Debris inputs
Wood / Roots / Flow obstructions
Rosyside Dace
A drift-feeder, sensitive to siltation and flooding
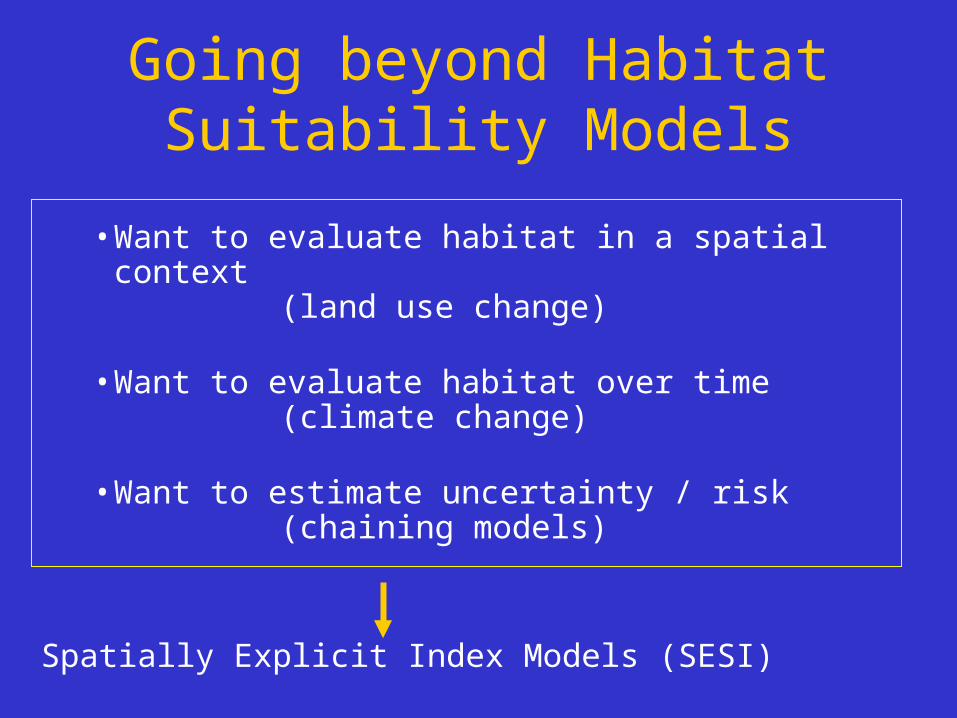
Going beyond Habitat Suitability Models
• Want to evaluate habitat in a spatial context (land use change)
• Want to evaluate habitat over time (climate change)
• Want to estimate uncertainty / risk(chaining models)
Spatially Explicit Index Models (SESI)
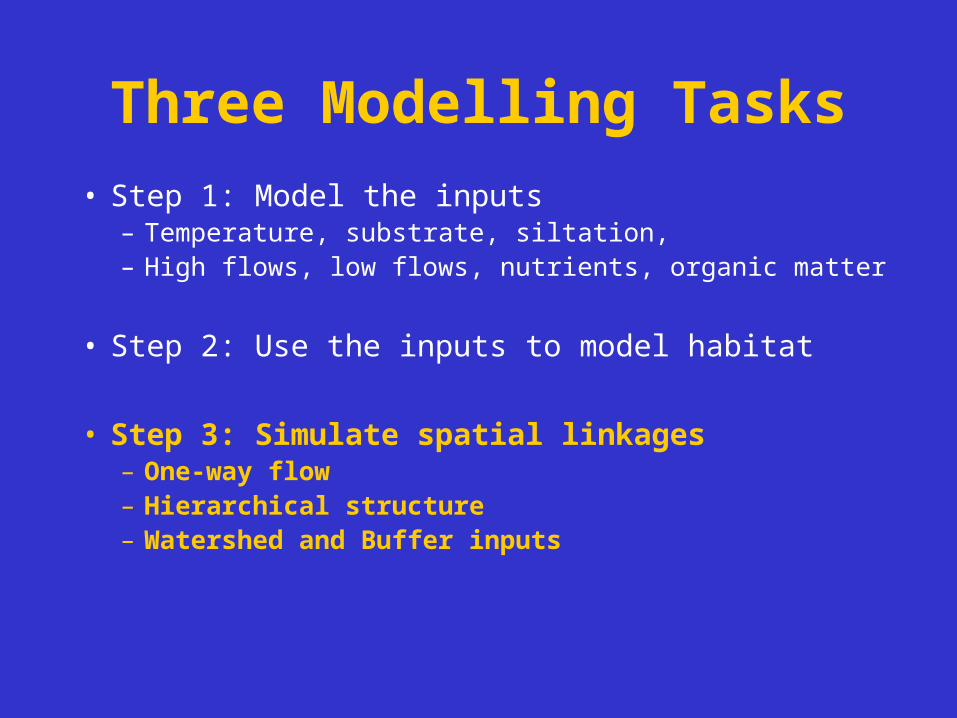
Three Modelling Tasks
• Step 1: Model the inputs– Temperature, substrate, siltation, – High flows, low flows, nutrients, organic matter
• Step 2: Use the inputs to model habitat
• Step 3: Simulate spatial linkages– One-way flow– Hierarchical structure– Watershed and Buffer inputs
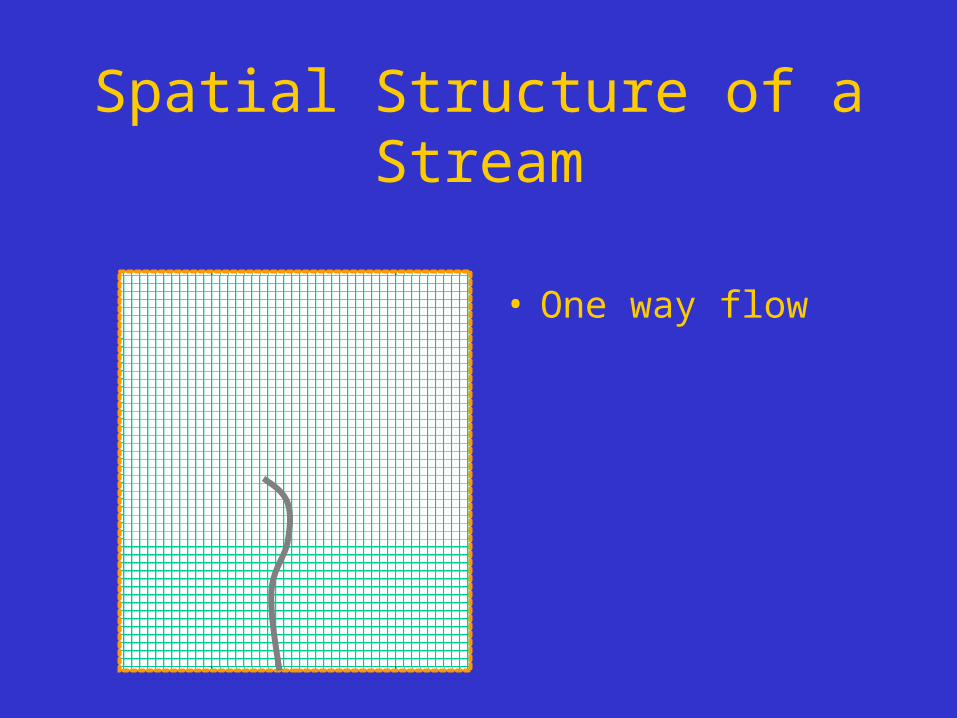
Spatial Structure of a Stream
• One way flow

Spatial Structure of a Stream
• One way flow
• Hierarchical structure
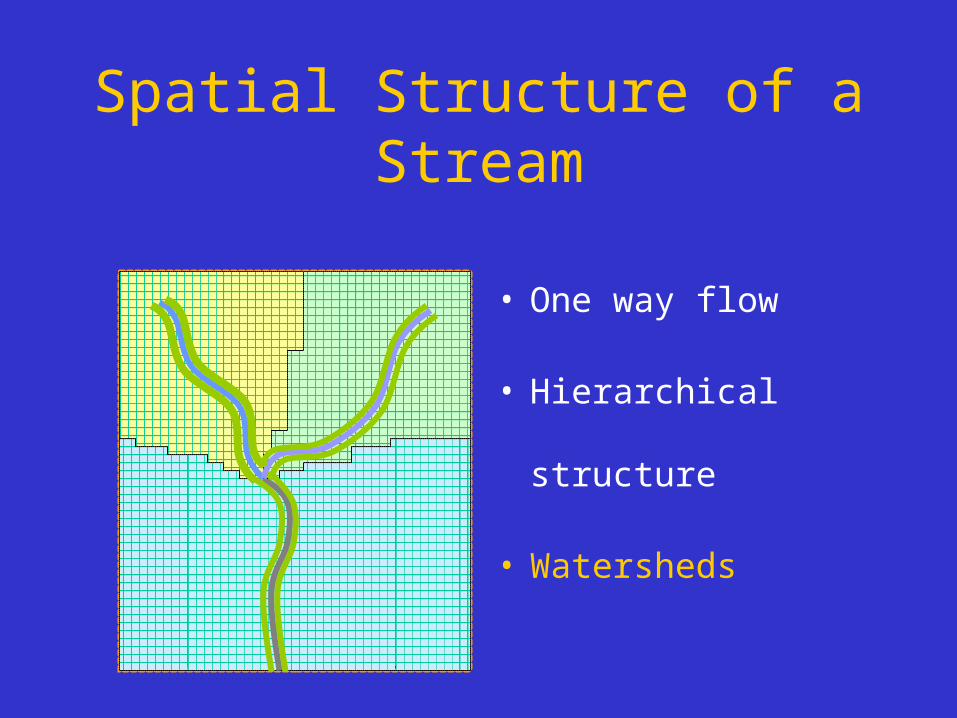
Spatial Structure of a Stream
• One way flow
• Hierarchical structure
• Watersheds
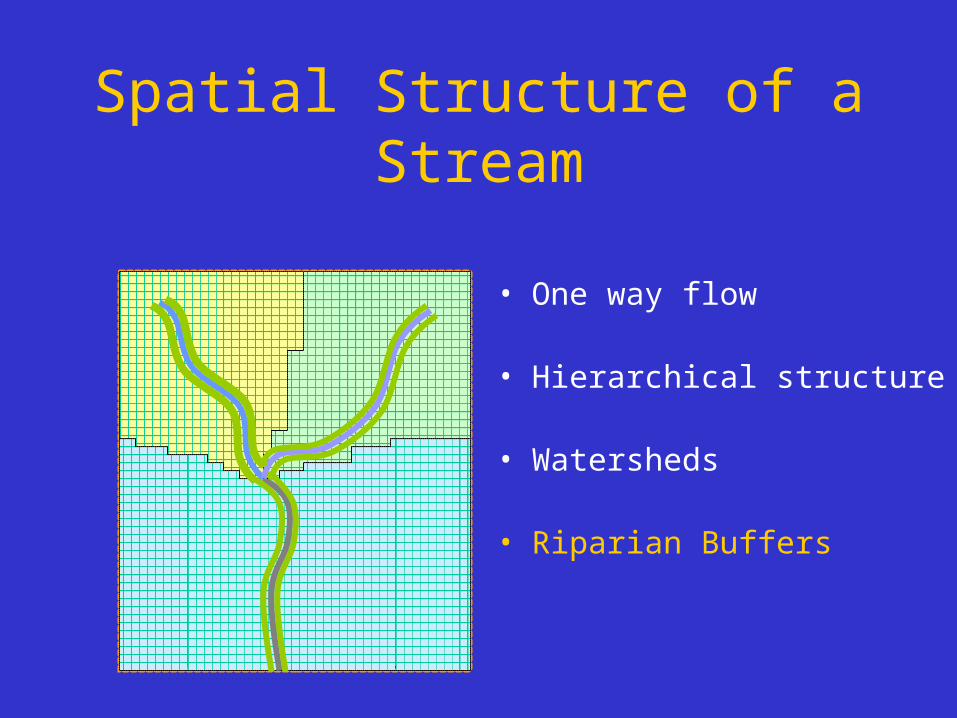
Spatial Structure of a Stream
• One way flow
• Hierarchical structure
• Watersheds
• Riparian Buffers
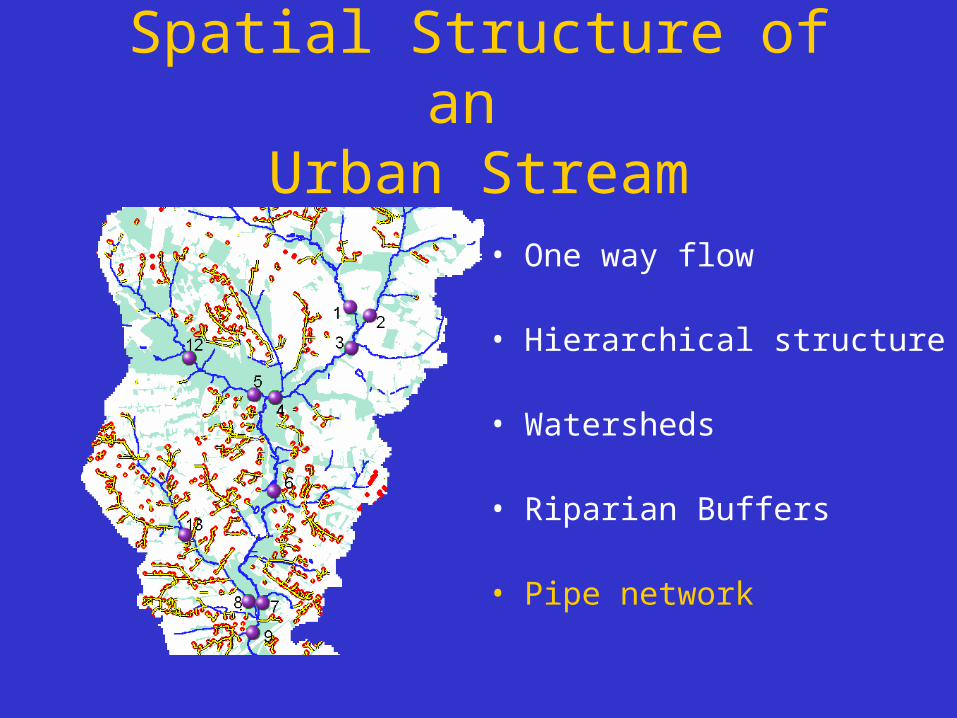
Spatial Structure of an Urban Stream
• One way flow
• Hierarchical structure
• Watersheds
• Riparian Buffers
• Pipe network