Embed Size (px)
Citation preview

Going Beyond Beta in Bonds: The Need for Active Management
Presenter:
MIHIR WORAH CIO Asset Allocation & Managing Director PIMCO

Your Global Investment Authority
Mihir Worah
November 5, 2015
Pacific Investment Management
Company LLC, 650 Newport Center
Drive, Newport Beach, CA 92660,
949.720.6000
For investment professional use only

pg 3 Your Global Investment Authority
176% 88% 63% 33% 31% 53% 136% 26% 314% -20%
Cumulative returns: Mar '09–Sep '15
Since the financial crisis, most asset classes have
experienced exceptionally strong returns
As of 30 September 2015
SOURCE: Bloomberg, PIMCO
* Global developed bonds, ex-U.S. hedged
U.S. equities: S&P 500 Index; Developed int’l equities: MSCI EAFE Net Dividend Index (USD Unhedged); EM Equities: MSCI Emerging Markets Index; U.S. core fixed income:
Barclays U.S. Aggregate Index; Global bonds (H): JPMorgan GBI Global ex-US USD Hedged; Global IG: Barclays Global Agg Credit (USD Hedged); Global HY: MLX
DevelMarkHighYieldConstr(USD Hedged); EM local bonds: JPMorgan Government Bond Index- Emerging Markets Global Diversified Index (Unhedged); REITS: Dow Jones
U.S. Select REIT Total Return Index; Diversified commodities: Bloomberg Commodity Index Total Return
Refer to Appendix for additional investment strategy and risk information.
18%
11%8%
5% 4%7%
15%
4%
26%
-3%-5%
0%
5%
10%
15%
20%
25%
30%
U.S.
equities
Developed
int'l
equities
EM
equities
U.S. core
fixed
income
Global
bonds
(H)*
Global
IG
Global
HY
EM local
bonds
REITs Diversified
commodities
Annualized asset class returns: Mar '09–Sep '15

pg 4 Your Global Investment Authority
Lower discount rates fueled asset returns and
supported higher valuations
Real
policy
rate
Inflation
premium
Term
premium
Credit
risk
premium
Equity
risk
premium
Sovereign
Credit
Equity
For Illustrative Purposes Only
SOURCE: PIMCO
Refer to Appendix for additional investment strategy and risk information.
Fair
Value
Discoun
t Rate

pg 5 Your Global Investment Authority
PIMCO’s capital market assumptions
(10-year, nominal)
Capital_Securities_outlook_01 As of 30 September 2015
SOURCE: PIMCO
Hypothetical example for illustrative purposes only.
* Return estimates are derived from an internal process based on a combination of methods: pulling together historical data, valuation metrics and qualitative
inputs based on PIMCO’s secular views
U.S. cash – Citi 3-Month Treasury Bill Index; U.S. core bonds – Barclays U.S. Aggregate Index; global bonds (USD-hedged) – Barclays Global Aggregate ex USD Index; U.S. high yield –
Barclays U.S. High Yield Index; U.S. equities – S&P 500 Index; European equities (USD-hedged) – MSCI Europe Index; Japanese equities (USD-hedged) – MSCI Japan Index; EM cash
(unhedged) – J.P. Morgan ELMI + Unhedged Index; EM sovereign bonds (unhedged) – J.P. Morgan GBI-EM Global Index; EM corporates (unhedged) – J.P. Morgan CEMBI Diversified Index;
EM equities (unhedged) – MSCI Emerging Markets Index; TIPS (U.S. Treasury Inflation-Protected Securities) – Barclays U.S. TIPS Index; commodities – Bloomberg Commodity TR Index;
REITs (real estate investment trusts) – Dow Jones U.S. REIT Index; hedge funds – Dow Jones Credit Suisse Hedge Fund Index; Private equity – Cambridge Associates U.S. Private Equity
Index; infrastructure – Macquarie Global Infrastructure Index.
Refer to Appendix for additional forecast, hypothetical example, outlook , and return assumption information.
Fixed Income sectors
1.62.5
1.8
4.5
5.6
4.55.3
7.5
5.3
2.4
5.0
7.3
0123456789
10
Cash U.S. Core
Bonds
Global Bonds
(USD
Hedged)
U.S. High
Yield
EM
Sovereign
Bonds
(Unhedged)
U.S. Equities European
Equities
(USD
Hedged)
EM Equities
(unhedged)
REITs Commodities Hedge
Funds
Private EquityEst
imate
d r
etu
rns
(%)
PIMCO's capital market assumptions* (10 year)
pg 6 Your Global Investment Authority
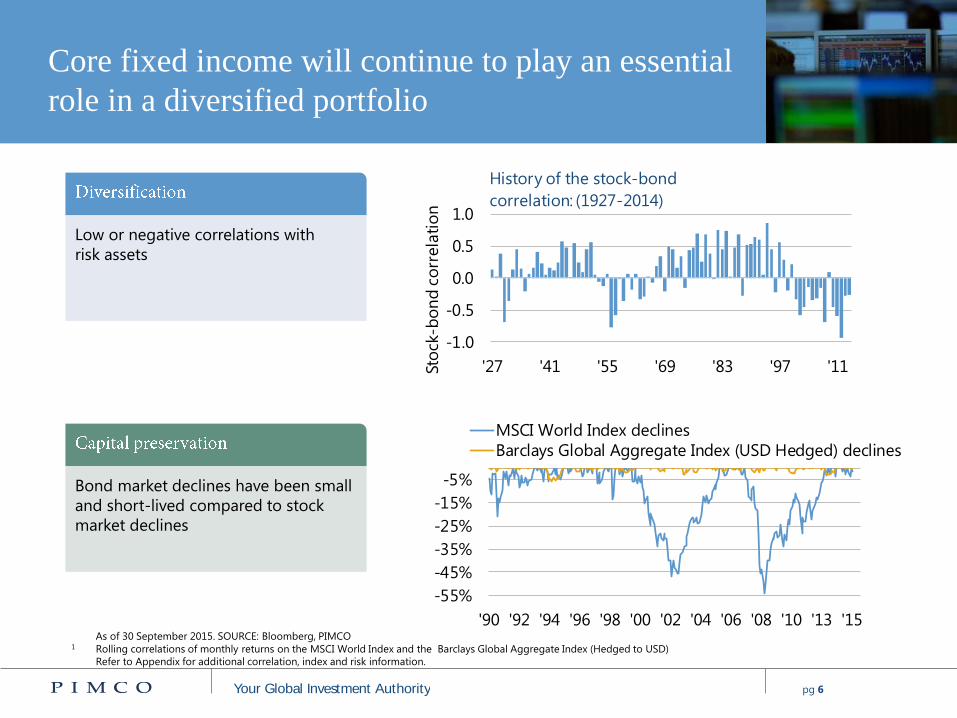
Core fixed income will continue to play an essential
role in a diversified portfolio
As of 30 September 2015. SOURCE: Bloomberg, PIMCO 1 Rolling correlations of monthly returns on the MSCI World Index and the Barclays Global Aggregate Index (Hedged to USD)
Refer to Appendix for additional correlation, index and risk information.
Low or negative correlations with
risk assets
Bond market declines have been small
and short-lived compared to stock
market declines
-1.0
-0.5
0.0
0.5
1.0
'27 '41 '55 '69 '83 '97 '11Sto
ck-b
on
d c
orr
ela
tio
n
History of the stock-bond
correlation: (1927-2014)
-55%
-45%
-35%
-25%
-15%
-5%
'90 '92 '94 '96 '98 '00 '02 '04 '06 '08 '10 '13 '15
MSCI World Index declines
Barclays Global Aggregate Index (USD Hedged) declines
pg 7 Your Global Investment Authority
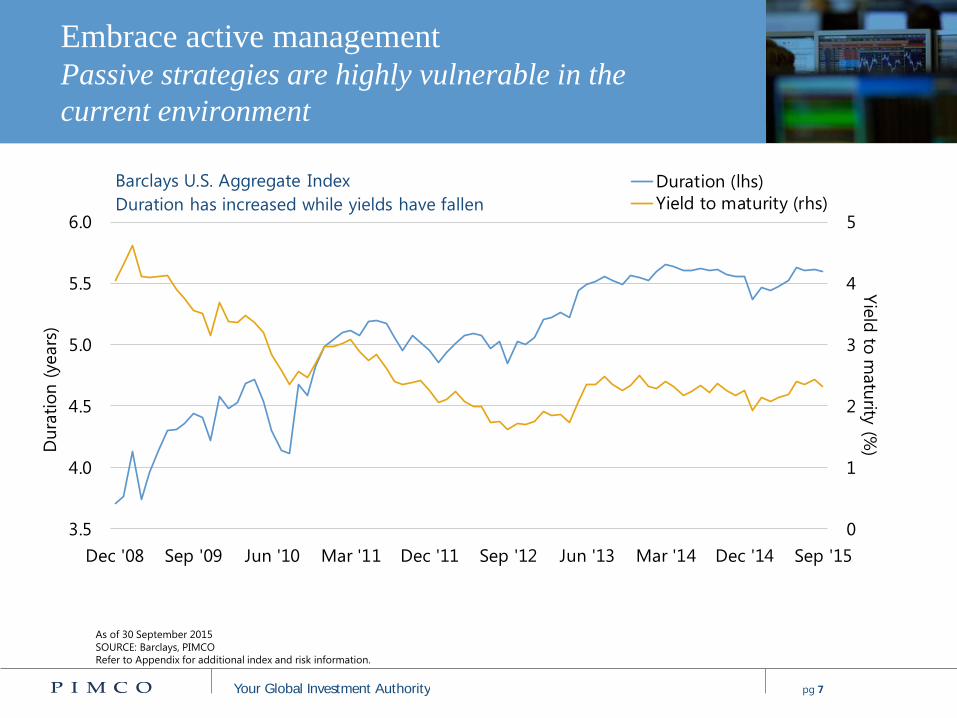
Embrace active management Passive strategies are highly vulnerable in the
current environment
As of 30 September 2015
SOURCE: Barclays, PIMCO
Refer to Appendix for additional index and risk information.
0
1
2
3
4
5
3.5
4.0
4.5
5.0
5.5
6.0
Dec '08 Sep '09 Jun '10 Mar '11 Dec '11 Sep '12 Jun '13 Mar '14 Dec '14 Sep '15
Yie
ld to
matu
rity (%
)Du
rati
on
(years
)
Barclays U.S. Aggregate Index
Duration has increased while yields have fallen
Duration (lhs)
Yield to maturity (rhs)

pg 8 Your Global Investment Authority
The high interest rates of the 70s and 80s, not today’s low yields, were the aberration
Long-term history of sovereign bond yields
0
2
4
6
8
10
12
14
16
1713 1763 1813 1863 1913 1963 2013
Yie
ld (
%)
Three centuries of long-term yields in the U.K.
2014
As of 30 September 2014
SOURCE: Bank of England

pg 9 Your Global Investment Authority
The New Neutral® We expect rates to be lower for longer
2cs_asset_allocation_outlook_01
As of 30 September 2015
Refer to Appendix for additional outlook information.
-0.5
0.0
0.5
1.0
1.5
2.0
2.5
3.0
3.5
4.0
4.5
5.0
'06 '07 '08 '09 '10 '11 '12 '13 '14 '15 '16
Perc
en
t (%
)
U.S. real yield, 5y5y forward U.S. 5Y5Y real yield
"Old Neutral"
"New Neutral"Long-term average real policy rate
New Neutral expected real policy rate
Fair value
range for
5y5y real
yield

pg 10 Your Global Investment Authority
PIMCO’s cyclical outlook
PIMCO forecast as of 22 September 2015
BRIM is Brazil, Russia, India and Mexico
Real GDP and inflation projections reflect the midpoints of PIMCO’s forecasts for the four quarters ending Q3 2016
Refer to Appendix for additional forecast and outlook information.
U.S.
2.50%
2.00%
GDP
Inflation
BRIM
5.50%
2.50% GDP
Inflation
EUROZONE
1.25%
1.75% GDP
Inflation
U.K.
2.50%
1.50%
GDP
Inflation
CHINA
6.00%
2.00%
GDP
Inflation
JAPAN
1.50%
1.25%
GDP
Inflation
3cs_intl_outlook_01c

pg 11 Your Global Investment Authority
Oil prices likely to stabilize in 2016
U.S. production growth is at inflection point; if not for increases in OPEC supply, global
balances would have been much tighter today
OECD demand growth is the strongest in a decade, led by the U.S. and Europe
– China demand growth has also been robust
Swing in OECD demand growth has
boosted the world demand growth
OECD
demand Non-OECD
demand OECD
5y mo. avg.
Non-OECD
5y mo. avg.
3,000
2,500
2,000
1,500
1,000
500
0
-500
-1,000
-1,500
-2,000
-2,500
As of 30 September 2015
SOURCE: EIA, Bloomberg
Barr
els
per
day (
tho
usa
nd
s)
3
4
5
6
7
8
9
10
'04 '05 '06 '07 '08 '09 '10 '11 '12 '13 '14 '15
Millio
n b
arr
els
per
day
U.S. crude oil production flattening
Total
6-period moving average
pg 12 Your Global Investment Authority
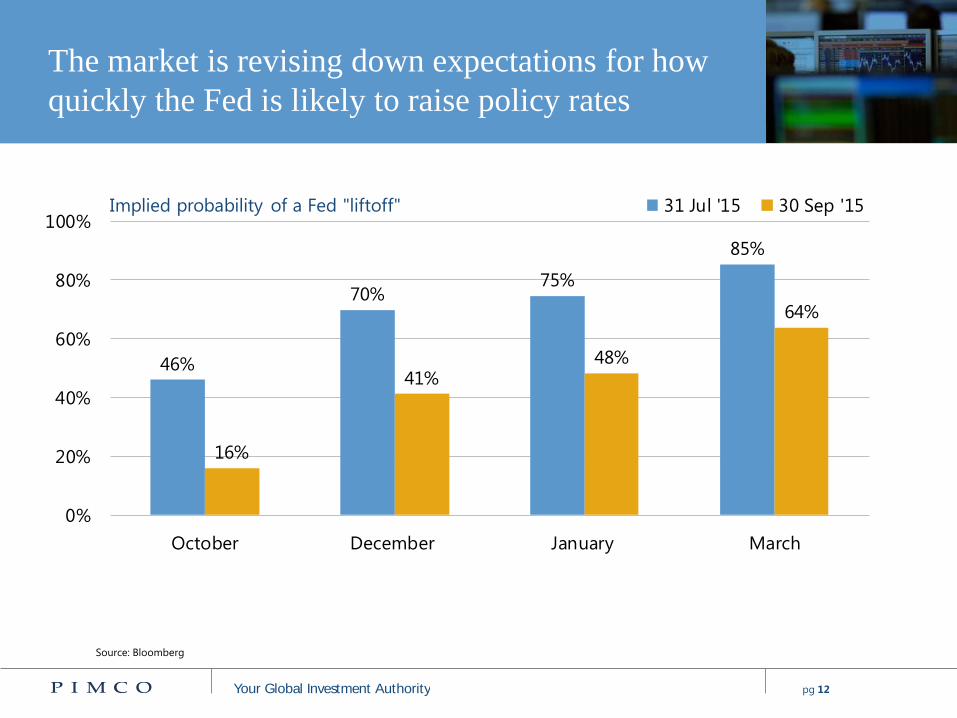
The market is revising down expectations for how
quickly the Fed is likely to raise policy rates
Source: Bloomberg
46%
70%75%
85%
16%
41%48%
64%
0%
20%
40%
60%
80%
100%
October December January March
Implied probability of a Fed "liftoff" 31 Jul '15 30 Sep '15

pg 13 Your Global Investment Authority
U.S. TIPS offer value as high quality alternative
in portfolio
As of 30 September 2015
SOURCE: Bloomberg
BEI: Defined as the difference between the nominal yield on a fixed-rate investment and the real yield (fixed spread) on an inflation-linked investment of similar maturity
and credit quality
3cs_income_review_26
0
2
4
6
8
10
12
'45 '50 '55 '60 '65 '70 '75 '80 '85 '90 '95 '00 '05 '10 '15
Rate
(%
)
Monthly rolling five year inflation
vs. current five year breakeven inflation Five year rolling inflation Five year BEI
(Current 5-year U.S. breakeven inflation 1.1%)
pg 14 Your Global Investment Authority
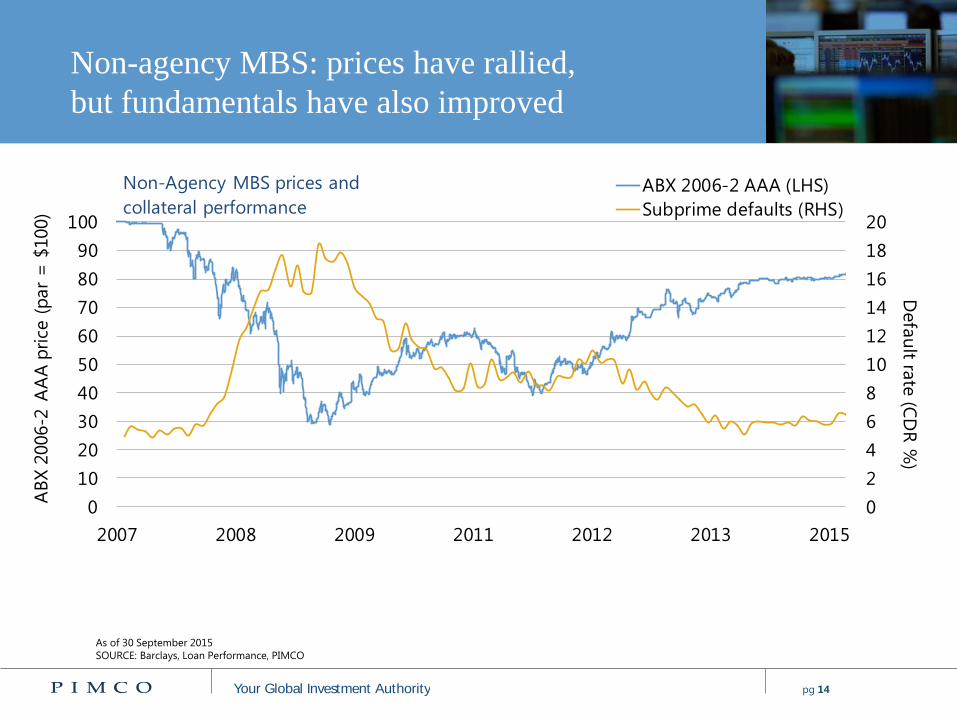
Non-agency MBS: prices have rallied,
but fundamentals have also improved
Copy of income_review_37
As of 30 September 2015
SOURCE: Barclays, Loan Performance, PIMCO
3cs_income_review_23
0
2
4
6
8
10
12
14
16
18
20
0
10
20
30
40
50
60
70
80
90
100
2007 2008 2009 2011 2012 2013 2015
Defa
ult ra
te (C
DR
%)
AB
X 2
006-2
AA
A p
rice (
par
= $
100)
Non-Agency MBS prices and
collateral performance
ABX 2006-2 AAA (LHS)
Subprime defaults (RHS)
pg 15 Your Global Investment Authority
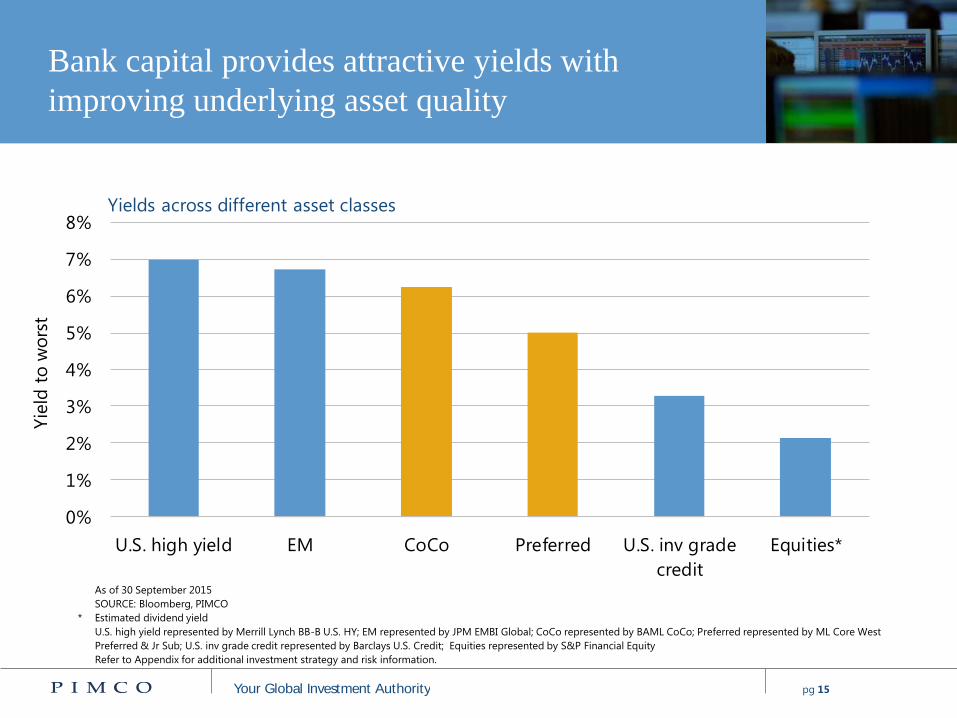
Bank capital provides attractive yields with
improving underlying asset quality
Capital_Securities_Review_11_US
As of 30 September 2015
SOURCE: Bloomberg, PIMCO
* Estimated dividend yield
U.S. high yield represented by Merrill Lynch BB-B U.S. HY; EM represented by JPM EMBI Global; CoCo represented by BAML CoCo; Preferred represented by ML Core West
Preferred & Jr Sub; U.S. inv grade credit represented by Barclays U.S. Credit; Equities represented by S&P Financial Equity
Refer to Appendix for additional investment strategy and risk information.
0%
1%
2%
3%
4%
5%
6%
7%
8%
U.S. high yield EM CoCo Preferred U.S. inv grade
credit
Equities*
Yie
ld t
o w
ors
t
Yields across different asset classes
pg 16 Your Global Investment Authority
Summary
1cs_TR_attrib_01_700
We face a “New Neutral” world defined by lower rates and higher
valuations, which leads to lower prospective returns
Despite low yields, and potentially rising rates, core fixed income retains
an essential role within the context of a multi-asset portfolio
Recent developments across bond markets increases the need for active
management
Investors can still generate attractive risk-adjusted return in the bond
markets by broadening the opportunity set

pg 17 Your Global Investment Authority
Appendix
Past performance is not a guarantee or a reliable indicator of future results.
CORRELATION
The correlation of various indexes or securities against one another or against inflation is based upon data over a certain time period. These correlations may vary substantially
in the future or over different time periods that can result in greater volatility.
CREDIT QUALITY
The credit quality of a particular security or group of securities does not ensure the stability or safety of the overall portfolio.
FORECAST
Forecasts, estimates and certain information contained herein are based upon proprietary research and should not be considered as investment advice or a recommendation of
any particular security, strategy or investment product. There is no guarantee that results will be achieved.
HYPOTHETICAL EXAMPLE
No representation is being made that any account, product, or strategy will or is likely to achieve profits, losses, or results similar to those shown. Hypothetical or simulated
performance results have several inherent limitations. Unlike an actual performance record, simulated results do not represent actual performance and are generally prepared
with the benefit of hindsight. There are frequently sharp differences between simulated performance results and the actual results subsequently achieved by any particular
account, product, or strategy. In addition, since trades have not actually been executed, simulated results cannot account for the impact of certain market risks such as lack of
liquidity. There are numerous other factors related to the markets in general or the implementation of any specific investment strategy, which cannot be fully accounted for in
the preparation of simulated results and all of which can adversely affect actual results.
INVESTMENT STRATEGY
There is no guarantee that these investment strategies will work under all market conditions or are suitable for all investors and each investor should evaluate their ability to
invest long-term, especially during periods of downturn in the market. No representation is being made that any account, product, or strategy will or is likely to achieve profits,
losses, or results similar to those shown.
OUTLOOK
Statements concerning financial market trends or portfolio strategies are based on current market conditions, which will fluctuate. There is no guarantee that these investment
strategies will work under all market conditions or are suitable for all investors and each investor should evaluate their ability to invest for the long term, especially during
periods of downturn in the market. Outlook and strategies are subject to change without notice.
RETURN ASSUMPTION
Return assumptions are for illustrative purposes only and are not a prediction or a projection of return. Return assumption is an estimate of what investments may earn on
average over the long term. Actual returns may be higher or lower than those shown and may vary substantially over shorter time periods.
asset_allocation_appendix

pg 18 Your Global Investment Authority
Appendix
RISK
Investing in the bond market is subject to risks, including market, interest rate, issuer, credit, inflation risk, and liquidity risk. The value of most bonds and bond strategies are
impacted by changes in interest rates. Bonds and bond strategies with longer durations tend to be more sensitive and volatile than those with shorter durations; bond prices
generally fall as interest rates rise, and the current low interest rate environment increases this risk. Current reductions in bond counterparty capacity may contribute to decreased
market liquidity and increased price volatility. Bond investments may be worth more or less than the original cost when redeemed. Equities may decline in value due to both real and
perceived general market, economic and industry conditions. Mortgage- and asset-backed securities may be sensitive to changes in interest rates, subject to early repayment risk,
and while generally supported by a government, government-agency or private guarantor, there is no assurance that the guarantor will meet its obligations. Investing in foreign-
denominated and/or -domiciled securities may involve heightened risk due to currency fluctuations, and economic and political risks, which may be enhanced in emerging
markets. Inflation-linked bonds (ILBs) issued by the various governments around the world are fixed-income securities whose principal value is periodically adjusted according to
the rate of inflation. Repayment upon maturity of the original principal as adjusted for inflation is guaranteed by the government that issues them. Neither the current market value
of inflation-indexed bonds nor the value a portfolio that invests in ILBs is guaranteed, and either or both may fluctuate. ILBs decline in value when real interest rates rise. In certain
interest rate environments, such as when real interest rates are rising faster than nominal interest rates, ILBs may experience greater losses than other fixed income securities with
similar durations. Commodities contain heightened risk, including market, political, regulatory and natural conditions, and may not be suitable for all investors. Currency rates may
fluctuate significantly over short periods of time and may reduce the returns of a portfolio. All investments contain risk and may lose value.
This material contains the current opinions of the manager and such opinions are subject to change without notice. This material has been distributed for informational purposes only
and should not be considered as investment advice or a recommendation of any particular security, strategy or investment product. Information contained herein has been obtained
from sources believed to be reliable, but not guaranteed. No part of this material may be reproduced in any form, or referred to in any other publication, without express written
permission. Pacific Investment Management Company LLC, 650 Newport Center Drive, Newport Beach, CA 92660, 800.387.4626. ©2015, PIMCO.
It is not possible to invest directly in an unmanaged index.

Going Beyond Beta in Bonds: The Need for Active
Management Q&A

Thank You