Embed Size (px)
Citation preview

Annual Report 2018Kintetsu World Express, Inc.Year Ended March 31, 2018Global Logistics Partner
Going to the Next Phase !

Corporate PhilosophyContribute to the development of a global community through
logistics services – by creating new values,
sustaining the environment and collaborating with our clients,
shareholders and employees.
VisionA superior business partner supporting customers’ strategic
objectives and activities by providing comprehensive innovative
supply chain solutions
Guide to Buttons
Move Back to Previous Page
Move Forward to Next Page
Search PDF Content
Go to Contents Page
Expectations and ForecastsThis annual report contains statements about our expectations and forecasts regarding plans, strategies, and business results related to the future of Kintetsu World Express, Inc. (KWE). These statements reflect our expectations based on personal beliefs and assumptions that were determined in light of information that was available at the time the report was prepared. There are innumerable risk factors and uncertainties that could affect the future, including economic trends, competition in the logistics industry, market conditions, fuel prices, exchange rates, and tax or other regulatory system considerations.Please be well advised that because of these risk factors, actual results may differ from our expectations.
Contents02 Going to the Next Phase!
05 Foundation for Creating New Value
07 Top Message
14 Report by Six Segments
20 ESG Section
32 Management’s Discussion and Analysis
37 Financial Highlights
38 Financial Statements
56 Investor Information

Kintetsu World Express Annual Report 2018 02Going to theNext Phase!
Thorough Reinforcement of Our Forwarding Business — Air Freight
Medium-Term Management Plan “Going to the Next Phase!”—Thorough Reinforcement of Our Forwarding Business — Air Freight
KWE handled 580,000 tons of air freight exports —
the highest tonnage in its corporate history. This
success was a result of the entire company pouring
all its might into priority measures aimed at expanding
handling volumes: reinforcement of the freight
forwarding business, expansion of transactions with
global companies, and the promotion of commodity-
specific sales strategies.
In the fiscal year
through March
2019, we intend
to keep steadily
implementing these
strategies to meet the
requirements of our
valued customers.
New Records for Handling Volumes
’14/3 ’15/3 ’16/3 ’17/3 ’18/3
Volume (1,000tons)
Air Freight (Export)
424478 457 495
Record High 580

Kintetsu World Express Annual Report 2018 03Going to theNext Phase!
KWE’s sea freight exports also achieved record-
high handling volume of 660,000 TEUs. The target
of 700,000 TEUs that we set as a slogan has come
well within our reach, and we expect to achieve it
in March 2019. After we clear that hurdle, we will
continue to strive for further expansion of handling
volumes while working to improve our operational
framework and boost efficiency.
278
’11/3 ’12/3 ’13/3 ’14/3 ’15/3 ’16/3 ’17/3 ’18/3 ’19/3(Target)
290 304362 396
463556
663 700Volume (1,000TEUs)
Sea Freight (Export)
Medium-Term Management Plan “Going to the Next Phase!”—Thorough Reinforcement of Our Forwarding Business — Sea Freight
700,000 TEUs – Now an Achievable Target
Thorough Reinforcement of Our Forwarding Business — Sea Freight

Kintetsu World Express Annual Report 2018 04Going to theNext Phase!
Medium-Term Management Plan “Going to the Next Phase!”—Set to Bear the Group’s Strengths — KWE & APLL
KWE has been expanding collaboration with
APLL, which we acquired in 2015. In addition to
expansion of both air and sea freight business
with global companies, we are promoting the
integration of sea freight procurement and
mutual use of existing facilities. We will continue
to steadily foster a
cooperative climate,
making full use of
respective strengths
and expanding our
business as a unified
corporate group.
Further Collaborations
Set to Bear the Group’s Strengths — KWE & APLL

Kintetsu World Express Annual Report 2018 05Foundation for Creating
New Value
Foundation for Creating New Value —Outline of 6 Segments—
Foundation for Creating New Value —Outline of 6 Segments—
Other
JapanKintetsu World Express, Inc.Kintetsu Logistics Systems, Inc.Kintetsu Transtech, Inc.Kintetsu Cosmos, Inc.Kintetsu World Express Sales, Inc.Kintetsu World Express Shikoku, Inc.Kintetsu Panasonic Trading Service Co., Ltd.plus 3 other companies
APL Logistics GroupAPL Logistics Ltdplus 71 other companies
Europe, Middle East & AfricaKintetsu World Express (U.K.) Ltd.Kintetsu World Express (Deutschland) GmbHKintetsu World Express (France) S.A.S.Kintetsu World Express (Benelux) B.V.Kintetsu World Express (RUS), Inc. LLC.Kintetsu World Express (Ireland) Ltd.Kintetsu World Express South Africa (Pty) Ltd.Kintetsu World Express (Switzerland) Ltd.Kintetsu World Express (Italia) S.R.L.Kintetsu World Express (Sweden) ABKintetsu World Express (Middle East) FZEKintetsu World Express (Czech) s.r.o.Kintetsu World Express (Saudi Arabia) Ltd.plus 3 other companies
The AmericasKintetsu World Express (U.S.A.), Inc.Kintetsu World Express (Canada) Inc.World Wide Customs Brokers Ltd.Kintetsu World Express Mexico, S.A. de C.V.KWE do Brasil Servicos Logisticos Ltda.
Kintetsu Global I.T., Inc.KWE Reinsurance, Inc.East Asia & Oceania
Kintetsu World Express (HK) Ltd.Kintetsu World Express (Taiwan), Inc.Kintetsu World Express (Australia) Pty Ltd.Kintetsu World Express (Korea), Inc.Kintetsu World Express (China) Co., Ltd.Beijing Kintetsu World Express Co., Ltd.Kintetsu World Express (Xiamen) Co., Ltd.Kintetsu Logistics (Shenzhen) Co., Ltd.Shanghai Kintetsu Logistics Co., Ltd.Dalian Kintetsu Logistics Co., Ltd.Suzhou Kintetsu Logistics Co., Ltd.Kintetsu Logistics (Xiamen) Co., Ltd.Yantai Kintetsu Logistics Co., Ltd.Xi’an Kintetsu Logistics Co., Ltd.Kintetsu World Express (Guangzhou) Ltd.Trans Global Logistics Group Ltd.plus 9 other companies
Southeast AsiaKWE-Kintetsu World Express (S) Pte Ltd.Kintetsu World Express (Malaysia) Sdn. Bhd.Kintetsu Logistics (M) Sdn. Bhd.KWE-Kintetsu World Express (Thailand) Co., Ltd.Kintetsu Logistics (Thailand) Co., Ltd.Kintetsu World Express (India) Pvt. Ltd.Gati-Kintetsu Express Pvt. Ltd.PT. Kintetsu World Express IndonesiaPT. Kintetsu Logistics IndonesiaKintetsu World Express (Vietnam), Inc.Kintetsu Logistics (Vietnam), Inc.Kintetsu World Express (Philippines) Inc.Kintetsu World Express (Clark) Inc.Kintetsu Logistics (Philippines) Inc.Kintetsu World Express (Cambodia) Co., Ltd.plus 2 other companies
’17/3
1,357
623
’18/3
Operating Income (Millions of yen)
’17/3
2,9853,257
’18/3
Operating Income (Millions of yen)
’17/3
-3,353
-1,986
’18/3
Operating Loss(Millions of yen)
’17/3
4,440
6,189
’18/3
Operating Income (Millions of yen)
’17/3
4,9695,634
’18/3
Operating Income (Millions of yen)
’17/3
2,486
3,582
’18/3
Operating Income (Millions of yen)

Kintetsu World Express Annual Report 2018 06
Air Freight Other Operations
LogisticsSea Freight
Foundation for Creating New Value
Foundation for Creating New Value —Our Services—
Main Services•Air freight forwarding •Trucking for pick-up and delivery •Customs brokerage•Customized packaging •Installation of precision machinery
Items to handle•Electronics components & products •Automotive parts and components •Healthcare products •Chemical products •Machinery and its parts •Apparel •Aircraft components •Alcoholic beverages, etc.
Main Services•Sea freight forwarding (FCL,LCL) •Container drayage •Trucking for pick-up and delivery •Customs brokerage •Buyer’s consolidation •PO Management
Items to handle•Electronics components & products •Automotive parts and components •Plant equipment •Machinery and its parts •Chemical products •Equipment for events •General merchandise and retail goods, etc.
Main Services•Contract Logistics
PO Management/Inventory control management/Cross-dock operation/Assembly works/Call center functions/Product inspection/VMI (Vendor Managed Inventory), etc.
•Logistics consulting •Transportation via truck, trailer, and rail •Auto-related Logistics (transportation of finished vehicles, auto parts)
Items to handle•Industrial products and components •Automotive products •Healthcare products •Chemical products •Retail goods •Consumer goods, etc.
Main Services•Domestic air freight forwarding•Customized packaging, transport, and installation of precision machinery
•Temporary staffing, primarily for logistics and trading businesses
•Transport of art objects and other materials for events and exhibitions
•Hand carry service
’17/3
’18/3193,354
155,486Net Sales (Millions of yen)
’17/3
’18/3155,803
134,991Net Sales (Millions of yen)
’17/3
’18/3168,060
151,680Net Sales (Millions of yen)
’17/3
’18/335,978
32,172Net Sales (Millions of yen)
Foundation for Creating New Value —Our Services—

Kintetsu World Express Annual Report 2018 07Top Message
A Definitive Stride
Top Message

Kintetsu World Express Annual Report 2018 08Top Message
A Definitive Stride toward Our Next Growth Phase
The KWE Group posted record-high net sales and operating income for the fiscal year ended
March 2018, representing a definitive stride in the direction of our next growth phase. In light of
these results, we revised upward the targets for the final year of our Medium-Term Management
Plan “Going to the Next Phase!” We also renewed our determination to strengthen our
foundation to support further evolution and sustainable growth, with an eye toward our next
Medium-Term Management Plan.
Our slogan for successful competition in the global market is “700,000 tons of air freight
and 700,000 TEUs of sea freight”. The substantial growth that we achieved in the fiscal year
ended March 2018 brought the target within reach, but clearly raised some challenges we
must resolve in order to handle cargo volumes on an unprecedented scale. We will strive to
quickly achieve “700,000 tons and 700,000 TEUs” by strengthening workforce and operational
functions to allow further increases in handling volumes.
Going forward, the Group aims to be a true Global Logistics Partner by focusing on further
expansion of collaborative projects, and reinforcing management systems while KWE and APLL
continue to refine their strengths within their respective domains.
Your continued support and patronage would be sincerely appreciated.
Nobutoshi ToriiPresident & CEO

Kintetsu World Express Annual Report 2018 09Top Message
Summary of Medium-Term Management Plan Second Year Results
Amid strong transport demand, measures to
increase volumes bore fruit
The fiscal year ended March 2018 was the sec-
ond year of the Medium-Term Management Plan
“Going to the Next Phase!”, and the entire Group
worked to achieve the most important goal of
increasing handling volumes. As a result, air
freight exports increased by 17.0% year-on-year
to 580,000 tons, and sea freight exports grew by
19.3% to 660,000 TEUs, thanks in part to strong
transport demand. We expect to achieve our sea
freight target of 700,000 TEUs in the fiscal year
through March 2019, and will strive to quickly
achieve our air freight volume target of 700,000
tons.
Achieved record-high net sales and operating
income, and improved operating margin
Boosted by solid growth in handling volumes,
all six segments posted 10-25% increases in net
sales. In addition, thanks to the acquisition of
APLL in 2015, Group-wide net sales exceeded
500 billion yen for the first time in the Group’s
history. We also posted a record-high operating
income thanks to profit increases in every seg-
ment except Europe, Middle East & Africa. Oper-
ating margin improved by 0.4 percentage points
due to such factors as robust import businesses
in Japan and the U.S., and reductions in selling,
general and administrative expenses that cov-
ered the increased freight costs.
The next challenge for growth is strengthen-
ing our systems
Amid the sharp increase in handling volumes,
we have recognized some new challenges. It be-
came clear that in order to maintain and improve
service quality while further expanding freight
volumes, we will need to bolster our workforce,
strengthen operational functions, and improve IT
systems. Therefore, we will set these actions as
priority measures for the final year of our current
Medium-Term Management Plan as well as for
the next Medium-Term Management Plan.
We will focus on boosting handling volumes while addressing issues that have emerged along the way.
Outline of Medium-Term Management Plan
Vision
“Going to the Next Phase !”
Net Sales: 585 billion yen Operating Income: 19.2 billion yen
Slogan
Target by March 2019 (Revised on May 11, 2018)
A superior business partner supporting customers’ strategic objectives and activities by providing comprehensive
innovative supply chain solutions
Toward Air Freight export 700,000 tons/Sea Freight export 700,000 TEUs
Key Strategies
Core Competences
Become an industry leader providing comprehensive services
Improve productivity by leveraging corporate capabilities
Actively respond to customers’ logistics needs at production locations and consumer markets
Maximize efficient utilization of
corporate resources
Strengthen corporate risk management capabilities
Heighten quality of operational
performance

Kintetsu World Express Annual Report 2018 10Top Message
Business Environment
Steady transport demand is expected to con-
tinue, especially in the electronics field
The electronics market consists mainly of
semiconductors and electronic components.
Although growth in demand related to smart-
phones is said to be slowing, there is growing
demand for data servers and sensors due to
the expansion of the Artificial Intelligence (AI)
and Internet of Things (IoT) markets, and for all
types of industrial equipment and power semi-
conductors used in automobiles. As a result, we
anticipate solid transport demand in this sector
for the foreseeable future. In the automotive
market, we expect further expansion of transport
demand due to new trends like electric vehicles
and automated (self-driving) systems, as well as
increasing motorization in emerging markets.
We foresee steady growth in demand for trans-
port of items related to the healthcare, retail, and
consumer markets as the global population in-
creases and the world’s economies grow. In or-
der to move closer to the “Next Phase” in which
KWE is recognized as a global player, the Group
will continue to fully utilize upside potential by
strengthening our management system in order
to further boost handling volumes while refining
the strengths of KWE’s forwarding business and
APLL’s logistics business.
Responding to rising costs
In order to achieve the performance targets for
the final year of our current Medium-Term Man-
agement Plan ―targets that we have revised
in May 2018 ― we must also respond flexibly
to downside risks. In light of expectations that
freight costs will increase or stabilize at high lev-
els, we will take steps to minimize the impact of
such changes, e.g. reflecting increased costs as
pass-through pricing adjustments, strengthening
ties with carriers, and improving consolidation
efficiency.
We will continue to fully utilize the upside potential that brisk transport demand presents, while minimizing the impact of rising freight costs and other downside risks.

Kintetsu World Express Annual Report 2018 11Top Message
Priority Measures for the Final Year of the Medium-Term Management Plan
Boosting volume of Trans-Pacific East Bound
(TPEB) business from Asia to the Americas
We will continue to focus on expanding handling
volume between Asia and the Americas, where
the world’s largest freight volume travels. In the
fiscal year ended March 2018, both air and sea
freight volumes in this lane expanded by more
than 20% year-on-year, prompting us to begin
intra-Asia transport for major U.S. retail cus-
tomers in cooperation with APLL. In the fiscal
year through March 2019, we plan to focus on
strengthening ties with air and sea carriers and
implement other initiatives aimed at expanding
this business to include shipments from Asia to
the U.S.
Business expansion among non-Japanese
“Corporate Accounts”
Since KWE’s aim is to be a Global Logistics Part-
ner, we are concentrating on expanding busi-
ness with global accounts outside of Japan. In
the fiscal year ended March 2018, such custom-
ers accounted for 24% of air freight forwarding
and more than 16% of our sea freight forwarding
business. Moreover, until now, most transactions
with non-Japanese multinationals involved Japan
as the origin or destination, but as a result of
concentrated efforts to win business that does
not pass through Japan, the volume of this type
of cargo has begun to gradually increase. By
continuing to strengthen our systems, we intend
to keep expanding our business with global ac-
counts.
Promotion of sales strategy by commodity
In the electronics field, we intend to boost
volumes by steadily winning more business
transporting semiconductors and electronic
components. Going forward, we will solidify that
business as a growth driver and ensure that we
maintain the high quality of KWE Group services.
In the automotive field, we plan to pick up busi-
ness amid continued strong transport demand. In
addition, we will definitely take advantage of new
business opportunities associated with vehicle
technology changes such as electric vehicles and
automated driving, and find ways to realize syner-
gistic benefits with electronics-related transport.
In addition to attaining our final-year targets, we will work to strengthen our foundation to support further evolution, with an eye toward our next Medium-Term Management Plan.
0
100
200
300
400
500
600
700
0
5
10
15
20
25
30
35
(Billions of yen)
Net Sales
¥13.0billion
¥15.0billion
¥17.5billion
¥18.0billion
¥19.2billion
¥4.4billion
ROE3.7%
ROE5.9%
ROE5.5%
ROE4.7%
ROE7.1%
¥5.5billion
¥7.0billion
¥7.2billion
¥8.7billion
¥474.3billion
¥525.0billion
Revised on November 9, 2017
Revised on May 11, 2018
¥553.1billion
¥568.0billion
¥585.0billion
Operating IncomeNet Income Attributableto Owners of the Parent
(Billions of yen)
1st year (’17/3)
(Results) PreviousRevised Plan
(Results) (Revised Plan)
2nd year (’18/3)
3rd year (’19/3)
( ) PreviousRevised Plan( )
Medium-Term Management PlanResults and Numerical Targets

Kintetsu World Express Annual Report 2018 12Top Message
In recent years we have gradually been
achieving positive results in our business with
non-Japanese healthcare corporate accounts,
and our focus will be on expanding that busi-
ness.
In the retail and consumer goods fields, we
will strive to further expand handling volumes by
leveraging the results of our collaboration with
APLL, which is a strong player in this field.
Getting ready to handle 700,000 tons and
700,000 TEUs
As mentioned above, we have come within
reach of our targets of handling 700,000 tons of
air freight and 700,000 TEUs of sea freight, and
we are currently working on various measures
aimed at quickly achieving the targets. How-
ever, given that the Group aspires to compete
successfully in the global market and achieve
further evolution and sustainable growth, these
targets are no more than temporar y stop-
ping points. As soon as we achieve 700,000
tons/700,000 TEUs, we will aim for 800,000
tons/800,000 TEUs and then 1 million tons/1
million TEUs. Based on this medium- to long-
term perspective, we plan to include in our next
Medium-Term Management Plan specific priori-
ty measures focused on boosting our workforce
and improving our systems.
Other priority measures
In addition to the initiatives described above, in
the final year of our Medium-Term Management
Plan we will lay the groundwork for sustainable
growth by continuing efforts to improve our
earnings, strengthening group governance for
optimal group management, and optimally devel-
oping and allocating human resources.
Collaboration and integration with APLL
Collaboration with APLL progressed more than
ever in the fiscal year ended March 2018 thanks
to increases in air freight business involving ma-
jor retailers, both Japan-bound and intra-Asia,
and to increased warehouse-related business in
Canada and Singapore. In the fiscal year through
March 2019, we will set higher targets and con-
centrate on further collaboration through joint
sales efforts. With regard to sea freight forward-
ing, we are promoting integration of KWE’s and
APLL’s sea freight procurement operations,
centered around the Group Procurement Center
that we established in November 2017, in order
to optimize group-wide sea freight business and
improve earning power.
Weight (tons) Volume (TEUs)
495,947
‘17/3(Result)
‘18/3(Result)
‘19/3(Plan)
‘17/3(Results)
‘18/3(Results)
‘19/3(Plan)
556,639
663,915700,000
580,228600,000
700,000
Aim to achieve in FY ending March 2019
Air Freight (Export) Sea Freight (Export)
APLLKWE
443,791
112,848
554,639
109,275
580,000
120,000
De�nite targets: 700,000 tons air freight/700,000 TEUs sea freight
Target Target
Air and Sea/Volume Targets

Kintetsu World Express Annual Report 2018 13Top Message
Message from William Villalon, President, APL Logistics
PresidentWilliam VillalonA Good Year
Having completed my first full year as APL Logistics President, I am proud of our 2017 performance.Our results exhibited considerable improvement. Net sales grew 10.9% to 194.8 bil-lion yen, and it is worthwhile to note that the company not only reversed a two-year decline in profitability but also approximated budget expectations. We maintained our strategy of focusing on innovative and customer-centric solutions in our core verticals, and made clear steps to strengthen our support infrastructure. In 2017, we successfully transited our support functions away from its legacy systems and also set up our very own Global Shared Services support capability in Chongqing, China to optimize back office operations such as billing and invoicing. In spite of uncertain business conditions, our collective effort in instilling service excellence and imbuing cost discipline across the entire organization has allowed the company to realize both commercial growth and improved profitability.
Collaboration and IntegrationIn 2017 we also expanded our collaboration and integration initiatives with KWE. Our joint efforts resulted in 1) numerous commercial wins for our core verticals (Automo-tive, Consumer, Industrials, Retail), and 2) integration of operations for efficiencies. Select examples include:
• Joint airfreight win for a leading U.S. apparel retailer, in the Transpacific lane
• Joint warehousing implementation for a leading U.S. tire manufacturer in North America and Saudi Arabia, and a leading U.S. consumer goods company in Canada
• Joint drayage win for a leading U.S. apparel retailer in Japan
• Integrated warehousing facil-ities in Singapore
• Pooled data centers in the United States
KWE and APLL have also jointly established a Group Procure-ment Center in Hong Kong, combining our competencies and know-how to maximize sea freight procurement opportunities and carrier rela-tions. This center will optimize the Group’s sea freight operations, and further enhance the support to our commercial team in increasing the volumes for the entire Group.
The Road AheadOur mid-term plan envisions a phased restoration to historical levels of profitability and thereafter to exceed them. The company has achieved a solid foundation in 2017, from which we look forward to expanding and investing in 2018 and beyond. With mounting global trade tensions and related geopolitical volatility, the same uncertainty will in-crease demand for end-to-end supply chain services and solutions. We must therefore position ourselves as the go-to supply chain solutions provider in our core verticals and balance our cost discipline with an emphasis on profitable growth. Looking forward, we will further innovate and optimize our capabilities through partnerships and active yield management respectively. We are also investing in sus-tainability and technology enhancements as it is apparent that both will play larger roles in our relevancy to key customer markets. Recognizing that our people have been, and will continue to be, the driving force of our company, we will also continue to step up our talent development efforts for a stronger leadership bench and a robust, agile, and motivated workforce. While these commitments represent a noteworthy financial investment in the near term, we are confident that it will enable us to deliver even greater value and growth for our share-holders in the longer term. In closing, I would like to thank everyone at APLL for their exceptional effort in 2017. APLL has a rich legacy and extraordinary potential and I remain excited and grateful to guide the organization to reach its full potential.
Saudi Arabia
Singapore
Japan
Canada
the U.S.
Cases for Collaborations with KWE

Kintetsu World Express Annual Report 2018 14Report by
Six Segments
Japan
Japan
Freight MovementsFiscal year through March 2018
Exports Imports
Air freight Up 10.2%*1
Up 13.5%*2
Sea freight Up 16.3%*3
Up 11.6%*2
As the control tower, leading the way to a stronger management baseAs the core of the Group, KWE Japan will demonstrate leadership by guiding the entire Group toward building and strengthening its management base to compete successfully with global players toward achieving our Medium-Term Management Plan targets. In the fiscal year through March 2019, we will focus on the measures outlined below.
For the Benefit of the Entire Group; (1) Air and sea freight volume growth
(2) Sales strategy by commodity
(3) Offshore business traffics
(4) Flexible logistics services that meet customer needs
Bolster Foundation of Operation Systems(1) Enhance workforce
(2) Construct IT systems that can improve efficiency
(3) Quality and efficiency improvement of operations
(4) Continued efforts to improve earnings
Enhance Global Administrative Functions
(1) Group governance and group-wide risk management systems
(2) Personnel training for developing global human resources and their optimal placement
22.5%127.807
Billions of yen
’18/3 Net Sales
*1 based on weight *2 based on number of shipments *3 based on TEUs (Twenty-foot Equivalent Units)
01
02
03
Kintetsu World Express Annual Report 2018 15
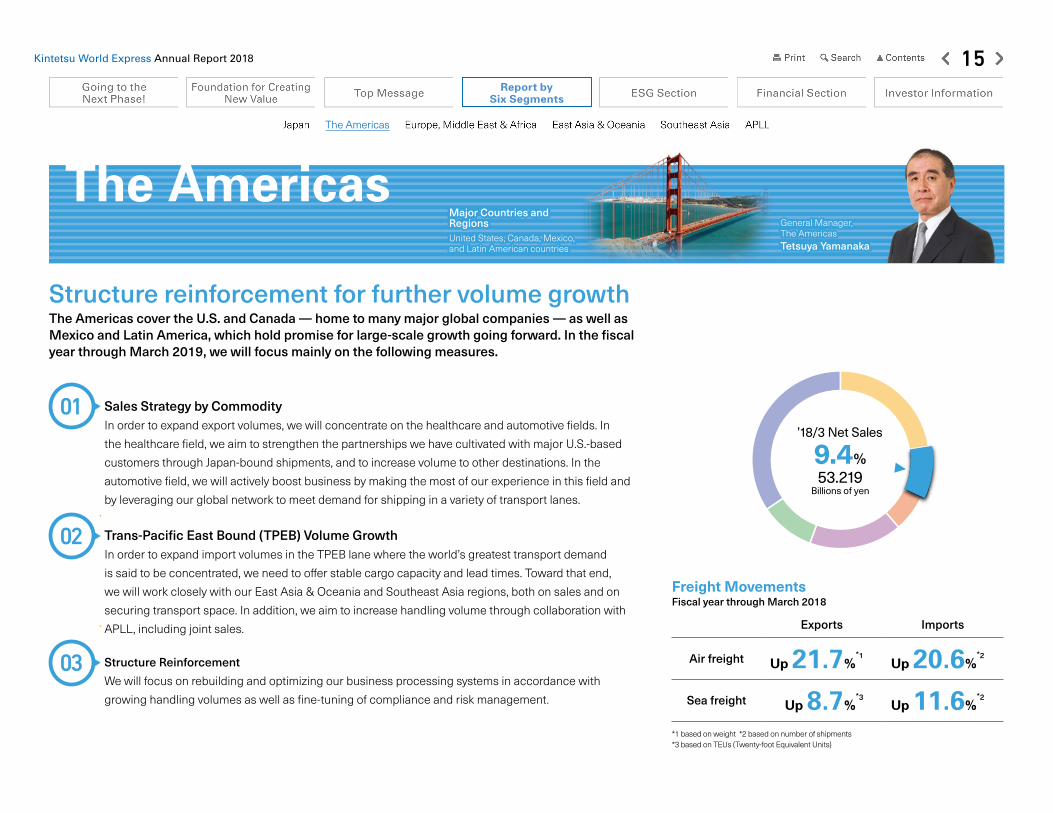
The Americas
Freight MovementsFiscal year through March 2018
Exports Imports
Air freight Up 21.7%*1
Up 20.6%*2
Sea freight Up 8.7%*3
Up 11.6%*2
Sales Strategy by Commodity In order to expand export volumes, we will concentrate on the healthcare and automotive fields. In
the healthcare field, we aim to strengthen the partnerships we have cultivated with major U.S.-based
customers through Japan-bound shipments, and to increase volume to other destinations. In the
automotive field, we will actively boost business by making the most of our experience in this field and
by leveraging our global network to meet demand for shipping in a variety of transport lanes.
Trans-Pacific East Bound (TPEB) Volume GrowthIn order to expand import volumes in the TPEB lane where the world’s greatest transport demand
is said to be concentrated, we need to offer stable cargo capacity and lead times. Toward that end,
we will work closely with our East Asia & Oceania and Southeast Asia regions, both on sales and on
securing transport space. In addition, we aim to increase handling volume through collaboration with
APLL, including joint sales.
Structure Reinforcement
We will focus on rebuilding and optimizing our business processing systems in accordance with
growing handling volumes as well as fine-tuning of compliance and risk management.
9.4%53.219
Billions of yen
’18/3 Net Sales
*1 based on weight *2 based on number of shipments *3 based on TEUs (Twenty-foot Equivalent Units)
01
02
03
Report bySix Segments
Major Countries and RegionsUnited States, Canada, Mexico, and Latin American countries
General Manager, The AmericasTetsuya Yamanaka
Structure reinforcement for further volume growthThe Americas cover the U.S. and Canada ― home to many major global companies ― as well as Mexico and Latin America, which hold promise for large-scale growth going forward. In the fiscal year through March 2019, we will focus mainly on the following measures.
The Americas

Kintetsu World Express Annual Report 2018 16Report by
Six Segments
Europe, Middle East & Africa
Freight MovementsFiscal year through March 2018
Exports Imports
Air freight Up 19.0%*1
Up 5.9%*2
Sea freight Up 5.6%*3
Up 18.3%*2
Volume Increase by Each Subsidiary as a Key Player Our focus will be on Western Europe to/from Asia and to/from the U.S. as priority lanes. Our goal is
to increase handling volumes, with Germany, Benelux, the U.K., France, and Italy taking leading roles.
Our subsidiaries in the Middle East, South Africa, and Russia are also important bases for the Group
that will contribute to business expansion.
Develop Commodity-specific Sales ActivitiesWe will promote sales activities that are tailored to each commodity. With our deep expertise in these
industries, we aim to further increase handling of healthcare, automotive and industrial equipment,
where volumes have grown in recent years.
Expand Air Freight Volume by Enhancing Gateway Services
We will develop air freight forwarding services using Amsterdam, Frankfurt, and Brussels as gateways.
Collection of cargoes from all over the European continent and consolidating them through these
gateways to major international airports affords advantages including better space utilization through
multiple countries, improved cargo security, later cut-off times at carriers, shorter handling times,
damage prevention, and off-loading prevention. We leverage these advantages to increase our
handling volumes. *1 based on weight *2 based on number of shipments *3 based on TEUs (Twenty-foot Equivalent Units)
01
02
03
General Manager, Europe, Middle East & AfricaShin Ogawa
Major Countries and RegionsThe United Kingdom, Germany, France, Italy, the Netherlands, Belgium, Switzerland, Ireland, and other European countries; Russia, African and Middle Eastern countries
6.8%38.636
Billions of yen
’18/3 Net Sales
Take maximum advantage of this region’s special strengthsIn Europe, Middle East & Africa, we aim to increase the entire Group’s handling volume by making the most of our specialties and strengths in this region. Our volume increase strategy for the fiscal year through March 2019 is as follows.
Europe, Middle East & Africa

Kintetsu World Express Annual Report 2018 17Report by
Six Segments
East Asia & Oceania
Freight MovementsFiscal year through March 2018
Exports Imports
Air freight Up 24.4%*1
Up 7.0%*2
Sea freight Up 30.1%*3
Up 11.9%*2
New Sales Organization We have established a new centralized sales organization in South China to develop and promote
cross-regional services instead of our previous corporate focus in Hong Kong, Shenzhen, and
Guangzhou.
Logistics InnovationAs part of our innovation strategy, we have recently started a pilot scheme using robots for parts
handling in a customer warehouse. In addition, we plan to introduce robotic process automation
(RPA) in our forwarding operation to improve accuracy and efficiency.
Business Innovation
Our business innovation strategy will drive standardization and efficiency through improved IT
solutions. This will allow us to provide improved customer service, better productivity and higher sales
while handling increased cargo volume.
*1 based on weight *2 based on number of shipments *3 based on TEUs (Twenty-foot Equivalent Units)
01
02
03
16.9%96.131
Billions of yen
’18/3 Net Sales
Major Countries and RegionsHong Kong, China, South Korea, Taiwan, and Australia General Manager,
East Asia & OceaniaMakoto Saito
Focus on cutting costs by increasing handling volumes and implementing business innovationIn the fiscal year through March 2019, we aim to expand commodities handled to further increase freight volume. Organizational and operational initiatives in the following areas will improve our performance and productivity.
East Asia & Oceania

Kintetsu World Express Annual Report 2018 18Report by
Six Segments
Southeast Asia
Freight MovementsFiscal year through March 2018
Exports Imports
Air freight Up 12.8%*1
Up 8.0%*2
Sea freight Up 38.3%*3
Up 17.5%*2
Increase Trans-Pacific East Bound (TPEB) Volume Like the East Asia & Oceania, we will help expand the Group’s overall volume by serving as a major
driving force for increasing both air and sea freight volumes in the Trans-Pacific East Bound (TPEB).
We will continue to promote our North America-bound Bangkok Gateway Program based on stable
provision of cargo space and high-quality services throughout the year. At the same time, we plan to
develop similar services for the Europe-bound market.
Focus on Offshore Business TrafficsIn recent years, Japanese companies have generated increasing demand for transport entirely outside
of Japan, with shipments often originating from Southeast Asia. We will continue to work actively to
accommodate that demand.
Expand Business with Global Accounts
In 2017 we made significant progress toward expanding our air freight forwarding business with
major retailers shipping from Southeast Asia, collaborating with APLL. We expect further expansion
in 2018 and plan to develop networks in South Asia including Bangladesh and Sri Lanka, where retail
business is brisk.*1 based on weight *2 based on number of shipments *3 based on TEUs (Twenty-foot Equivalent Units)
01
02
03
9.7%54.716
Billions of yen
’18/3 Net Sales
Maintain and accelerate growth as a driving force for volume expansionIn recent years, Southeast Asia has achieved the greatest growth among the Group. In order to maintain and accelerate that growth, in the fiscal year through March 2019 we will work on the following measures.
Major Countries and RegionsSingapore, Malaysia, Thailand, India, Indonesia, Vietnam, the Philippines, and Cambodia
General Manager, Southeast AsiaYasuhiro Kaneda
Southeast Asia

Kintetsu World Express Annual Report 2018 19Report by
Six Segments
APLL
Vertical Expertise • Automotive: Grow finished vehicle distribution business in emerging markets, and further expand
value-added services in developed markets
• Consumer & Industrials: Leverage network opportunities, and focus on in-country distribution
• Retail: Increase focus on origin management and distribution services, and develop capabilities
around demand and sustainability planning
Portfolio Optimization• Rebalance capital allocation decisions for optimized returns
• Review existing book of business for yield improvement opportunities
• Increase market differentiation through specialized solutions selling, supported by supply chain
engineering
KWE Collaboration
• Systemize cross-selling with KWE, across geographies and business units
• Fully implement joint sea freight procurement efforts
• Further expand scale efficiencies, especially those related to Information Technology and Global
Support Services
01
02
03
34.3%194.860Billions of yen
’18/3 Net Sales
Innovative customer-centric solutions, delivered with operational excellenceLeveraging its deep expertise and the combined network of the group, APL Logistics is focused on delivering supply chain solutions in the Automotive, Consumer, Industrials, and Retail verticals across key origin and destination markets. Our key policies for the fiscal year through March 2019 are as follows:
General Manager, APLLKazuhisa Kawamura
APLL

Kintetsu World Express Annual Report 2018 20ESG Section
KWE Group Environmental Protection PolicyBased on its corporate philosophy, the KWE Group has established the following policies in order to do our best to conserve limited natural resources and protect the global environment and to contribute to global society through our logistics services.
1 Work to prevent environmental pollution and to continuously improve our actions
2 Comply with the environmental protection-related laws, regulations, and requirements of each country in which we operate, and take initiatives even beyond what is required
3 Establish the following as KWE’s priority goals for environmental management relative to our business activities:
• Reduce/Control greenhouse gas emissions- Reduce/Control electric power consumption- Reduce/Control emissions from vehicles and equipment
• Reduce waste and promote recycling4 Prevent environmental pollution through cooperation
with business partners, suppliers, and affiliates
5 Make all KWE Group employees aware of our environmental protection policies, and communicate them to the public as well
Based on these policies, we will make ongoing efforts to minimize, monitor, and improve the environmental impact of our business activities. As part of these efforts, we acquired certification under the ISO 14001 Environmental Management System at eight group companies (15 facilities).
Relationship with CustomersThe KWE Group seeks to increase customer satisfaction through aggressive efforts to maintain and improve quality. We are working to improve the quality of operations and services through Quality Management System (QMS) activities, based on the KWE Group Quality Control Policy. Specifically, for various quality-related standards, our 28 group companies are certified under the ISO 9001: 2008 quality management system, 15 group companies have acquired Authorized Economic Operator (AEO) certification, one group company is certified under the ISO 13485: 2016 medical devices -- quality management systems, six group companies have acquired Good Distribution Practice (GDP) certification, and 21 facilities have acquired Transported Asset Protection Association (TAPA) certification. We have also conducted Web-based customer
Environment Social
ISO 14001certification ISO 9001 certification
Environment Social

Kintetsu World Express Annual Report 2018 21ESG Section
satisfaction surveys in an effort to place the greatest priority on our customers.
Relationship with EmployeesThe KWE Group believes that providing an environment that allows all employees to demonstrate their maximum potential will contribute to the further growth and development of the Group. To this end, we are working to create an environment that respects each and every employee and fosters a high level of creativity and humanity. We provide education and training programs to cultivate professional employees and encourage the
development of personnel well suited for their positions based on one-to-one work training for new employees, on-the-job training for newly joined employees, and other training according to seniority. We have an overseas training program that each year sends many younger employees in Japan to work at overseas group companies. We hold our Business Leader Program to provide executive training to selected employees. Our employee evaluation system does not look solely at performance, but places emphasis on how much employees demonstrate their individual capabilities to produce maximum results. To deepen communication between management and employees even further, we regularly hold a “Sunshine Meeting” in which board members and executives visit various workplaces and speak directly with employees.
DiversityTo promote diversity, we do not tolerate discrimination in any form, whether by race, ethnicity, nationality, gender, or disability, and we provide equal opportunities for everyone to play an active role. We have launched personnel exchanges between various countries to allow employees who work at a local subsidiary in one country to take on the major challenge of working in another
country. Going forward, we plan to accumulate data on personnel who work at local subsidiaries in each country and assign personnel beyond the framework of individual companies. Additionally, KWE Japan prepared a three-year action plan starting in the fiscal year ended March 2017 in response to the Act on the Promotion of Women’s Participation and Advancement in the Workplace coming into force in Japan. KWE is pursuing a variety of initiatives with the objective of raising the percentage of female employees to 30% of its overall workforce. We have set our goal to assign at least five female employees with positions, work at overseas subsidiaries and have achieved 60% as of July 2018.
Safety InitiativesConcerning safety initiatives, we are taking specific actions at our various business facilities. Our Hong Kong, Philippine, and Taiwanese subsidiaries acquired certification to the OHSAS 18001 occupational health and safety management system, and the Thai subsidiary is conducting safe driving courses led by the safety committee. Additionally, domestic group company Kintetsu Transtech, Inc. is holding regular safety training, including a general safety promotion meeting that is held twice yearly and targets all employees.
GDP certification
AEO Japan logo
Social

Kintetsu World Express Annual Report 2018 22ESG Section
Social Contribution ActivitiesThe KWE Group undertakes social contribution activities in support of environmental protection, public welfare, culture, and other areas. It held a total of 38 events at 14 subsidiaries in the fiscal year ended March 2018, including internships for local university students at the Taiwanese subsidiary and cultural activities with children at the Philippine subsidiary in cooperation with a local non-profit organization.
Taiwanese subsidiaryKintetsu World Express (Taiwan), Inc. provides internship opportunities to allow local university students to gain experience in actual logistics operations. Students acquire practical skills by using the knowledge they have learned during three years of university study
while working at a KWE logistics facility in their fourth academic year. Students are responsible for freight receipt and dispatch, packaging, and other operations under the guidance of KWE staff at a warehouse near Taiwan Taoyuan International Airport. We hope these opportunities will spark an interest in our business and help cultivate human resources who may contribute in the logistics industry in the future.
Philippine subsidiaryKintetsu World Express (Philippines) Inc. (hereinafter “KWEPH”) employees donated to Children’s Joy Foundation, Inc. (hereinafter “CJFI”), orphanage, during the KWEPH Children’s Day celebration. Seven years ago, a group of KWEPH employees organized a Christmas gift-giving for CJFI. In return, CJFI offered to participate in KWEPH’s annual Children’s Christmas Party, where CJFI
children sing songs and play various musical instruments. KWEPH’s Children’s Christmas Party is an annual event organized by the HR Department and attended by KWEPH employees’ children who are younger than 10 years old. Around 150 children, including children from CJFI, normally are invited to the event. After the party, the children go around the different departments collecting their gifts while employees show their work environment.
Taoyuan FTZ Terminal (Taiwan) KWEPH’s Children’s Christmas Party
Social
Kintetsu World Express Annual Report 2018 23ESG Section
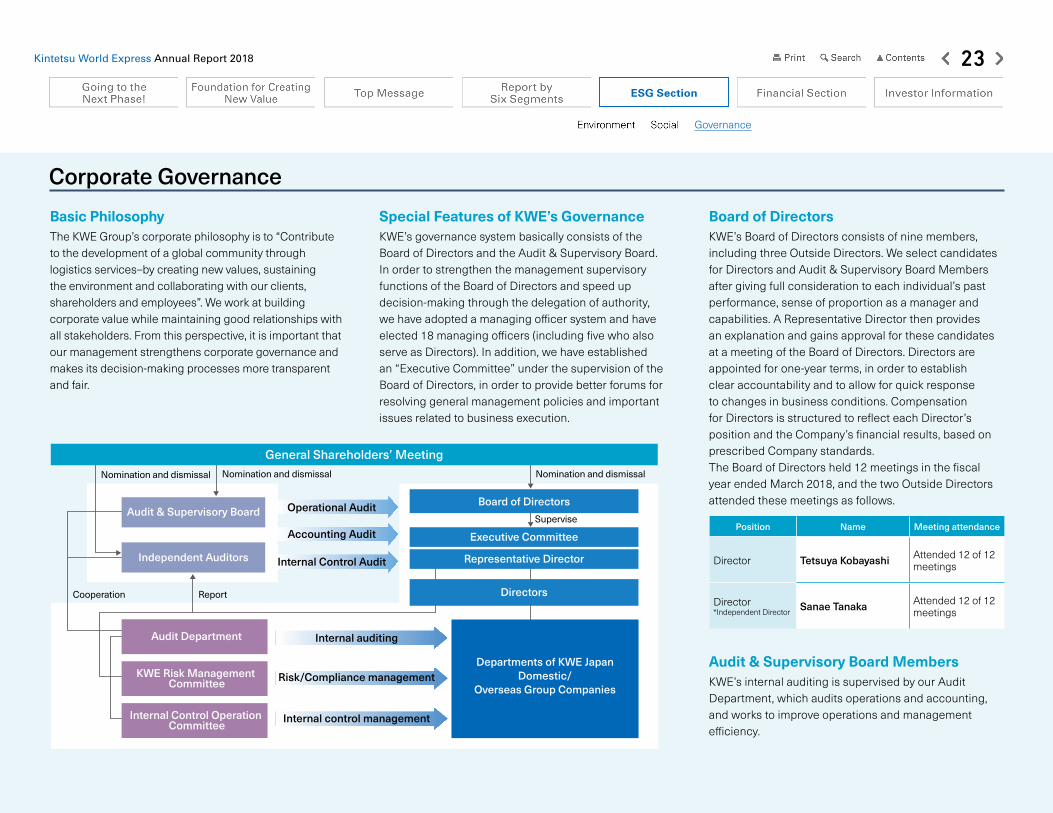
Corporate Governance
Basic PhilosophyThe KWE Group’s corporate philosophy is to “Contribute to the development of a global community through logistics services–by creating new values, sustaining the environment and collaborating with our clients, shareholders and employees”. We work at building corporate value while maintaining good relationships with all stakeholders. From this perspective, it is important that our management strengthens corporate governance and makes its decision-making processes more transparent and fair.
Special Features of KWE’s GovernanceKWE’s governance system basically consists of the Board of Directors and the Audit & Supervisory Board. In order to strengthen the management supervisory functions of the Board of Directors and speed up decision-making through the delegation of authority, we have adopted a managing officer system and have elected 18 managing officers (including five who also serve as Directors). In addition, we have established an “Executive Committee” under the supervision of the Board of Directors, in order to provide better forums for resolving general management policies and important issues related to business execution.
Board of DirectorsKWE’s Board of Directors consists of nine members, including three Outside Directors. We select candidates for Directors and Audit & Supervisory Board Members after giving full consideration to each individual’s past performance, sense of proportion as a manager and capabilities. A Representative Director then provides an explanation and gains approval for these candidates at a meeting of the Board of Directors. Directors are appointed for one-year terms, in order to establish clear accountability and to allow for quick response to changes in business conditions. Compensation for Directors is structured to reflect each Director’s position and the Company’s financial results, based on prescribed Company standards.The Board of Directors held 12 meetings in the fiscal year ended March 2018, and the two Outside Directors attended these meetings as follows.
Audit & Supervisory Board MembersKWE’s internal auditing is supervised by our Audit Department, which audits operations and accounting, and works to improve operations and management efficiency.
Departments of KWE JapanDomestic/
Overseas Group Companies
Supervise
Nomination and dismissalNomination and dismissalNomination and dismissal
General Shareholders’ Meeting
Independent Auditors
Audit & Supervisory BoardBoard of Directors
Internal Control Operation Committee
Executive Committee
Representative Director
Directors
Operational Audit
Internal auditing
Risk/Compliance management
Internal control management
Accounting Audit
Internal Control Audit
Audit Department
KWE Risk Management Committee
ReportCooperation
Position Name Meeting attendance
Director Tetsuya Kobayashi Attended 12 of 12 meetings
Director *Independent Director Sanae Tanaka Attended 12 of 12
meetings
Governance

Kintetsu World Express Annual Report 2018 24ESG Section
Each of our four Audit & Supervisory Board Members (including two Outside Audit & Supervisory Board Members) conducts audits according to auditing plans determined by the Audit & Supervisory Board. The system allows for adequate supervision of Directors’ job execution, with important documents being turned over to Audit & Supervisory Board Members and the standing Audit & Supervisory Board Members attending important meetings such as the Executive Committee. As a rule, the Board meets once a month. In addition to determining basic policies regarding auditing, etc., board members report to each other the findings of their daily auditing activities and exchange views. We established the Audit & Supervisory Board Members’ Office to support clerical work related to the Audit & Supervisory Board and the Board Members’ work, and it operates in close coordination with the Audit Department. We have also established the functions that enable the Board Members to demand whatever reports they require from Directors, managing officers, or employees, and to investigate the status of business and assets at KWE Group companies at any time. KWE’s accounting auditor is KPMG AZSA LLC. Audits were conducted thoroughly throughout the fiscal term, and we have created an environment that facilitates auditing. Our Audit Department, the Audit & Supervisory Board, and accounting auditor meet regularly to coordinate their annual schedules and report on operations. They cooperate closely by exchanging information as necessary. The Audit & Supervisory Board held 10 meetings in
the fiscal year ended March 2018, and the two Outside Audit & Supervisory Board Members attended these meetings as follows.
Outside Directors and Outside Audit & Supervisory Board MembersOutside Director Tetsuya Kobayashi is a Chairman of the Board at Kintetsu Group Holdings Co., Ltd. We think Mr. Kobayashi is qualified to serve as an Outside Director, regardless of the status of independence, for the reasons cited on Page 26 under “Reasons for selection of Directors and Audit & Supervisory Board Members”. KWE has three independent officers—Sanae Tanaka, Jun Yanai, and Yusuke Kawasaki. None of these three individuals come from a KWE affiliated company, a major shareholder, or a major business partner, and because they are Outside Directors or Audit & Supervisory Board Members with a high level of independence to avoid the risk of conflicts of interest with general shareholders, we designate them as independent officers based on provisions of the Tokyo Stock Exchange and notify the exchange of this designation.
Outside Director Jun Yanai is a Corporate Advisor at Mitsubishi Corporation. Mitsubishi and KWE have business relations that include freight forwarding, but the amounts of these transactions are minor (less than 1%). Outside Audit & Supervisory Board Member Yoshihiro Yasumoto is a Director, Senior Managing Executive
Position Name Meeting attendance
Audit & Supervisory Board Member * Independent Officer
Yusuke Kawasaki Attended 10 of 10 meetings
Audit & Supervisory Board Member Yoshihiro Yasumoto Attended 10 of 10
meetings
Career summary of three independent officers
Sanae Tanaka
Apr. 1989 Registered as attorney
Sep. 1991 Representative, Sanae Tanaka Law Office (current position)
Jun. 2015 Director at Kintetsu World Express, Inc. (current position)
Jun Yanai
Apr. 1973 Joined Mitsubishi Corporation
Apr. 2004 Executive Officer at the company
Apr. 2008 Executive Vice President at the company
Apr. 2013 Senior Executive Vice President at the company
Jun. 2013 Member of the Board, Senior Executive Vice President at the company
Jun. 2016 Corporate Advisor at the company (current position)
Jun. 2018 Director at Kintetsu World Express, Inc. (current position)
Yusuke Kawasaki
Oct. 1984 Joined Asahi & Co. (currently KPMG AZSA LLC)
Jun. 2010 Representative Partner, KPMG AZSA LLC (retired Jun. 2016)
Jul. 2016 Head, Yusuke Kawasaki C.P.A. Office (current position)
Jun. 2017 Audit & Supervisory Board Member at Kintetsu World Express, Inc. (current position)
Governance

Kintetsu World Express Annual Report 2018 25ESG Section
Officer at Kintetsu Group Holdings Co., Ltd. Kintetsu Group Holdings is the primary shareholder of KWE with a 44.11% stake, but there is no particular business relations between KWE and Kintetsu Group Holdings, and our Outside Directors and Outside Audit & Supervisory Board Member have no particular vested interests in KWE. KWE judges an Outside Director or Outside Audit & Supervisory Board Member to be independent when he or she does not fall under any of the criteria set forth below.
1. An executive of KWE and its affiliated companies (hereinafter referred to as the “KWE Group”), including a person who performed in this capacity at KWE within the past ten years.
2. A party to whom the KWE Group is a major business partner, or an executive of such party (including a party to whom the KWE
Group was previously a major business partner, or a person who was an executive of such party within the past five years).
3. A party who is a major business partner of the KWE Group (a company whose total amount of transactions with the KWE Group exceeded 1% of the consolidated net sales of either company in the most recent fiscal year), or an executive of such party.
4. A major shareholder (person or party) of KWE who directly or indirectly holds 10% or more of KWE’s total voting rights, or an executive of such party.
5. A party who receives a large amount of donations equal to 10 million yen or more per annum from the KWE Group, or an executive of such party.
6. A consultant, certified public accountant or other accountant, or an attorney or other legal professional who receives a large
amount of monetary consideration or other property benefits totaling 10 million yen or more per annum from the KWE Group in addition to his or her officer compensation (in cases where the party receiving property is an organization such as a legal entity or an association, or a person belonging to such organization).
7. A person belonging to an audit firm that carries out statutory audits of the KWE Group, including a person who has carried out audit services as an employee of such audit corporation for KWE or a subsidiary of KWE within the past five years.
8. A spouse or a relative within the second degree of kinship of a person listed below:•An officer or an employee of KWE; or•A person to whom any of criteria 2 through 7 above applies.
Reasons for selection of Directors and Audit & Supervisory Board MembersDirectors (Based on the information as of June 19, 2018)
Reasons for selection
Kazuyasu UedaChairman of the Board
As Senior Executive Vice President of Kintetsu Group Holdings Co., Ltd., a major shareholder of the Company, Mr. Kazuyasu Ueda has a wealth of experience, achievements, and insights. Currently, he serves as chairman of the Board and possesses knowledge regarding the overall management.
Nobutoshi ToriiPresident & CEO
Mr. Nobutoshi Torii possesses a wealth of experience, achievements, and insights in the sales field of the Company. He is currently leading the management as President & CEO. He has worked to expand the Group's business and increase its corporate value, and thus possesses knowledge regarding the overall management of the Company.
Joji TomiyamaDirectorExecutive Vice President
Mr. Joji Tomiyama possesses a wealth of experience, achievements, and insights in the sales field of the Company, as well as possesses knowledge regarding the overall management of the Company through experience as a President of an overseas subsidiary and is currently presiding over Information Technology and the APLL Group.
Keisuke HirataDirectorManaging Executive Officer
Mr. Keisuke Hirata possesses a wealth of experience, achievements, and insights in the sales field of the Company, as well as possesses knowledge regarding the overall management of the Company through experience as a President of an overseas subsidiary. Furthermore, he is currently presiding over Sales and Marketing.
Katsufumi TakahashiDirectorManaging Officer
Mr. Katsufumi Takahashi possesses a wealth of experience and achievements in the sales field of the Company. He became General Manager, General Affairs Department, is currently presiding over Planning & General Affairs, and thus possesses knowledge regarding the overall management of the Company.
Kiyoyuki HirosawaDirectorManaging Officer
Mr. Kiyoyuki Hirosawa possesses a wealth of experience and achievements in the sales field of the Company. He became Audit & Supervisory Board Member, is currently presiding over Human Resource, Accounting and Finance, and Audit, and thus possesses knowledge regarding the overall management of the Company.
Governance

Kintetsu World Express Annual Report 2018 26ESG Section
Outside Directors (Based on the information as of June 19, 2018)
Independent Officer Significant concurrent positions Reasons for selection
Tetsuya Kobayashi Chairman of the Board, Kintetsu Group Holdings Co., Ltd.Chairman of the Board, KNT-CT Holdings Co., Ltd.Chairman of the Board, Kintetsu Department Store Co., Ltd.Director, Mie Kotsu Group Holdings, Inc.Director, Kin-Ei Corp.Director, The Kansai Electric Power Company, Incorporated
Having served as President of Kintetsu Group Holdings, a major shareholder of the Company, Mr. Tetsuya Kobayashi has a wealth of experience and broad insights and has served to strengthen the management supervisory functions of the Company, as well as given advice on management decision-making from a wide range of perspectives.
Sanae Tanaka〇
Representative, Sanae Tanaka Law OfficeDirector, Noevir Holdings Co., Ltd.Director, PILOT CORPORATIONDirector, Shochiku Co., Ltd.
Although Ms. Sanae Tanaka has not been directly involved in corporate management, she possesses specialized insights and a wealth of experience as an attorney-at-law, and she has been strengthening the management supervisory functions of the Company from an independent standpoint and providing opinions on management decisions from diversified viewpoints.
Jun Yanai〇
Corporate Advisor, Mitsubishi CorporationDirector, INPEX CORPORATION
Having served as Senior Executive Vice President of Mitsubishi Corporation, Mr. Jun Yanai has a wealth of experience, achievements, and insights regarding global business management. The Company believes that he has the capability to strengthen the management supervisory functions of the Company from an independent standpoint.
Standing Audit & Supervisory Board Members
Independent Officer Significant concurrent positions Reasons for selection
Takashi Sakai Subsequent to attaining a wealth of experience and achievements in the sales field of the Company, Mr. Takashi Sakai serves as the person responsible for customs compliance, and since he is well versed in laws and regulations and business laws, etc., related to the Company’s business and possesses a wealth of operational experience.
Katsumi Watanabe Mr. Katsumi Watanabe possesses a wealth of experience and achievements in the Accounting and Finance Divisions of the Company and its subsidiaries, and also possesses knowledge regarding the overall management of the Company through being responsible for the Audit Department of the Company.
Outside Audit & Supervisory Board Members
Independent Officer Significant concurrent positions Reasons for selection
Yusuke Kawasaki〇
Head, Yusuke Kawasaki C.P.A. OfficeAudit & Supervisory Board Member, KNT-CT Holdings Co., Ltd.
Mr. Yusuke Kawasaki possesses a wealth of experience, achievements, and insights as a certified public accountant. The Company believes that he has the capability to strengthen the audit structure of the Company.
Yoshihiro Yasumoto Director, Senior Managing Executive Officer, Kintetsu Group Holdings Co., Ltd.Audit & Supervisory Board Member, Mie Kotsu Group Holdings, Inc.Audit & Supervisory Board Member, Kin-Ei Corp.
Having worked in the Accounting and Finance Department of Kintetsu Group Holdings Co., Ltd., a major shareholder of the Company, Mr. Yoshihiro Yasumoto has a wealth of experience, achievements, and insights. The Company believes that he has the capability to strengthen the management supervisory functions of the Company.
Governance

Kintetsu World Express Annual Report 2018 27ESG Section
Executive Committee KWE’s Executive Committee is composed of standing Directors and Audit & Supervisory Board Members, managing officers, division managers, and other relevant personnel. The committee meets twice monthly under the supervision of the Board of Directors, and it serves as a forum to resolve important matters related to overall management policies and business execution.
Director and Audit & Supervisory Board Member CompensationKWE policy stipulates that Director compensation is allocated within the range resolved at the General Shareholders’ Meeting. Such compensation is divided into monthly and performance-based compensation. The amount of compensation is decided based on amounts prescribed in internal regulations, KWE ’s performance, economic conditions and other matters, and how well Directors contribute individually to the performance of KWE. In the year ended March 2018, we paid a total of ¥290 million to 18 Directors (including nine Directors who retired and one Director who passed away and retired), including ¥16 million to four Outside Directors. KWE determines Audit & Supervisory Board Members compensation based on discussions with the Audit & Supervisory Board. In the fiscal year ended March 2018, we paid a total of ¥52 million to eight Audit & Supervisory Board Members (including one Audit & Supervisory Board Member who resigned and three Audit & Supervisory Board Members who retired), including ¥11 million to the five Outside Audit & Supervisory Board Members.
Compliance KWE clearly states that it will comply with and respect laws, regulations, and ethical standards in its Corporate Philosophy, KWE Group Corporate Guidelines and KWE Group Code of Conduct, which provide a foundation for the activities of officers and employees of KWE Group companies. We have outlined a basic approach to business execution in the KWE Group Compliance Basic Policy, which shows a basic stance on corporate behavior. To promote rigorous compliance management, we have appointed a Chief of Compliance (Director) and clarified compliance responsibilities according to each position, based in part on the KWE Group Compliance Rules. We have established a Committee chaired by the Chief of Compliance to promote corporate behavior that complies with laws, regulations, and corporate ethics. We have prepared a whistle-blower system to aid in the early detection and correction of violations of laws, regulations, and corporate ethics, and to protect whistle-blowers from prejudicial treatment. Group companies have prepared compliance manuals and regularly conduct compliance training and auditing.
Risk Management KWE has established the KWE Group Risk Management Basic Policy to facilitate integrated and ongoing risk management on a global basis. We have appointed a Chief of Risk Management (Director) and clarified risk management responsibilities according to each position, based in part on the KWE Group Risk Management Rules. We have established a Risk Management Committee chaired by the Chief of Risk Management to help identify risks that face group companies from a company-wide perspective and
take appropriate action. We have also created a crisis plan, which includes the KWE Group Crisis Management Rules, to prepare for emergency situations that could emerge suddenly and seriously impact our business operations.
Investor RelationsKWE has established an IR Group within the Planning and General Affairs Department. In order to make our management more transparent, we disclose information about the status of our business through our website and other means, and actively work at maintaining good relations with shareholders and investors. We appropriately disclose financial and business information in our financial statements, business results presentations, annual reports, data books, and other materials. We disclose on our website monthly air freight volume for KWE and the overall industry in Japan. We also disclose quarterly overseas air freight volume for KWE. In addition, the Company strives to help investors understand its businesses by providing informational videos on the website that clarify its operations and by providing segment information. To a reasonable extent, KWE places importance on responding proactively to the dialogue had with shareholders, investors, and analysts. We hold business results presentations twice yearly for full-year and interim results (May and November) in order to explain our business performance and policies to institutional investors and analysts. In addition, we participate in small meetings, IR conferences and telephone conferences at the request of securities companies. We also hold briefings for individual investors irregularly to provide an opportunity to communicate with these investors.
Governance

Kintetsu World Express Annual Report 2018 28ESG Section
Disclosure Based on Principles of Corporate Governance Code* *Note: This annual report outlines KWE’s response to the Corporate Governance Code prior to the code’s revision in June 2018. Our response to the revised Corporate Governance Code will be posted in our website.
[Principle 1.4: Cross-Shareholdings]1. Cross-Shareholdings Policy Investments in cross-shareholdings are aimed at
maintaining and strengthening business alliances and transactions, and are made when they will help maintain and improve the corporate value of the KWE Group.
2. Criteria for Exercising Voting Rights KWE will exercise its voting rights and make decisions
for or against proposals from the standpoint of whether the company issuing the proposal is making appropriate decisions which will help increase its corporate value over the medium to long term, and improve the corporate value of the KWE Group as a whole.
[Principle 1.7: Related Party Transactions]Directors’ competing transactions and transactions between Directors and KWE (conflict-of-interest transactions) are required to be resolved by the Board of Directors. Also, unusual transactions must be audited by standing Audit & Supervisory Board Members before being carried out.
[Principle 3.1: Full Disclosure](i) KWE’s corporate philosophy, management strategy and
management plan (the Medium-Term Management Plan) are disclosed on KWE’s website and in its financial results
briefing materials and other IR materials.• Corporate philosophy https://www.kwe.co.jp/en/about-contents/philosophies• Management strategy and management plan (the Medium-Term Management Plan)
https://www.kwe.co.jp/en/ir-contents/strategy(ii) KWE’s perspective on corporate governance is disclosed
on KWE’s website and in corporate governance reports, securities reports and the Annual Report.• KWE’s perspective on corporate governance https://www.kwe.co.jp/en/about-contents/governance
(iii) KWE’s method for determining Director compensation: Please see the Director and Audit & Supervisory Board
Member Compensation section on Page 27.(iv) KWE’s method for nominating executive leadership,
Director and Audit & Supervisory Board Member: Please see the Board of Directors section on Page 23.(v) KWE discloses the individual selection reasons for its
Director candidates in the Reference Documents for the 49th Ordinary General Meeting of Shareholders. Details are listed in the Notice of Convocation of the 49th Ordinary General Meeting of Shareholders, which can be downloaded from our website at the following URL.https://www.kwe.co.jp/wp-content/uploads/2018/05/en_stockholder49.pdf
[Supplementary Principle 4.1.1]KWE has established Board of Directors Regulations and matters to be deliberated on and decided at Board of Directors’ meetings are set in accordance with laws and regulations. KWE has also established Organization and Duties Authority Regulations, which clarify the scope of
actions which can be executed by management.
[Principle 4.8: Effective Use of Independent Outside Directors][Principle 4.9: Independence Standards and Qualification for Independent Outside Directors]Please see the Board of Directors section on Page 23 and the Outside Directors and Outside Audit & Supervisory Board Members section on Page 24.
[Supplementary Principle 4.11.1]Please see the Board of Directors section on Page 23.
[Supplementary Principle 4.11.2]Information about Directors and Audit & Supervisory Board Members who serve concurrently as officers at other listed companies is provided in the Notice of Convocation of the 49th Ordinary General Meeting of Shareholders, which can be downloaded from our website at the following URL.https://www.kwe.co.jp/wp-content/uploads/2018/05/en_stockholder49.pdf
[Supplementary Principle 4.11.3]KWE receives feedback and advice from Outside Directors on the analysis and evaluation of how effectively the Board of Directors is performing. We started evaluating the effectiveness of the overall Board of Directors with reference to the individual evaluations of each Director in 2016.
[Supplementary Principle 4.14.2]From the fiscal year ended March 2018, in addition to conducting seminars for officers on the Companies Act and laws and regulations relating to the business activities
Governance

Kintetsu World Express Annual Report 2018 29ESG Section
of KWE, standing Directors and Audit & Supervisory Board Members undergo continuous governance training to ensure that they are able to effectively perform their roles and fulfill the responsibilities expected of them as persons involved in important governance bodies. For newly appointed Directors and Audit & Supervisory Board Members, training will be given so they can acquire the necessary knowledge and are equipped to handle the responsibilities they have as Directors and Audit & Supervisory Board Members, including those related to KWE’s business, financial affairs, and organization. Upon invitation from KWE, Outside Directors and Audit & Supervisory Board Members will visit various facilities and have training to attain the necessary information on the industry in which KWE is involved, KWE’s history, business profile, financial affairs, strategies, organization, etc.
[Principle 5.1: Policy for Constructive Dialogue with Shareholders]Please see the Investor Relations section on Page 27.
Reasons for Non-compliance with the Principles of the Corporate Governance Code [Supplementary Principle 1.2.4]KWE has decided against introducing the Electronic Voting Platform as shareholders accounting for approximately 90% of total voting rights have exercised their right to vote in recent years. KWE provides convocation notices of General Shareholder’s Meetings in English from 2016.
[Supplementary Principle 1.2.5]
While KWE considers shareholders with voting rights recorded in the shareholder register as of the record date eligible to exercise voting rights, it does not permit institutional investors to vote on behalf of trust banks or other institutions.
[Supplementary Principle 4.2.1]Director and Audit & Supervisory Board Member compensation is determined based on the method described in the Director and Audit & Supervisory Board Member Compensation section on Page 27, and we will consider the possibility of introducing treasury stock-based compensation and stock options.
[Supplementary Principle 4.10.1]Although KWE has not established optional advisory committees, explanations regarding Director Candidates are given to Independent Outside Directors and opinions are sought from them before Board of Directors’ meetings where proposals to appoint officers are considered. KWE will keep studying the establishment of a Nominating and Compensation Committee.
Governance

Kintetsu World Express Annual Report 2018 30ESG Section
Messages from Independent Directors
I will suggest better ways to leverage human resources and maximize corporate value.
I will make use of my global experience to support value creation of KWE.
KWE achieved record-high handling volume and profits in the fiscal year ended March 2018. We are moving toward our slogan of “700,000 tons of air freight and 700,000 TEUs of sea freight”, which initially seemed too challenging, and all KWE Group employees are united in the goal and I recognize that achievements to date demonstrate the power of teamwork and each individual employee. Going forward, I believe the ability to utilize human resources to maximize output as an organization will become increasingly important, in addition to expanding staff and improving operational systems, for maintaining service quality befitting the KWE Group while continuing to expand handling volume. I intend to make good use of the experience I have cultivated over many years through my work as an attorney and through my interactions with many different corporations, individuals, and organizations. I will suggest better ways to enable effective support for leveraging human resources and maximizing the corporate value of the KWE Group.
I am very pleased to have joined the management of KWE as a global company following my appointment as an independent officer at the 49th Ordinary General Meeting of Shareholders held in June 2018. I have been involved in energy-related business, mainly crude oil and petroleum trade and oil field development, at a major general trading company. I have consistently worked to add value from a global perspective amid daily changes in the balance of supply and demand and trends in prices, and I feel a sense of affinity toward KWE’s logistics business. Additionally, given that energy-related business ensures a stable supply of energy in Japan and that international logistics serve as the bloodstream of the global economy, I believe both share the essential quality of playing a crucial role in society. I endeavor to support KWE’s value creation from the standpoint of an independent officer and to recommend ways to increase corporate value from a compliance standpoint as one area of expertise.
Sanae Tanaka Jun Yanai
Governance

Kintetsu World Express Annual Report 2018 31ESG Section
Management
Joji TomiyamaDirectorExecutive Vice President
Keisuke HirataDirectorManaging Executive Officer
Katsufumi TakahashiDirectorManaging Officer
Nobutoshi ToriiPresident and Chief Executive Officer
Kiyoyuki HirosawaDirector Managing Officer
Tetsuya KobayashiOutside Director
Jun YanaiOutside Director
Sanae TanakaOutside Director
Kazuyasu UedaChairman of the Board
Governance
Kintetsu World Express Annual Report 2018 32
Management’s Discussion and Analysis
Financial Section
Management’s Discussion and Analysis
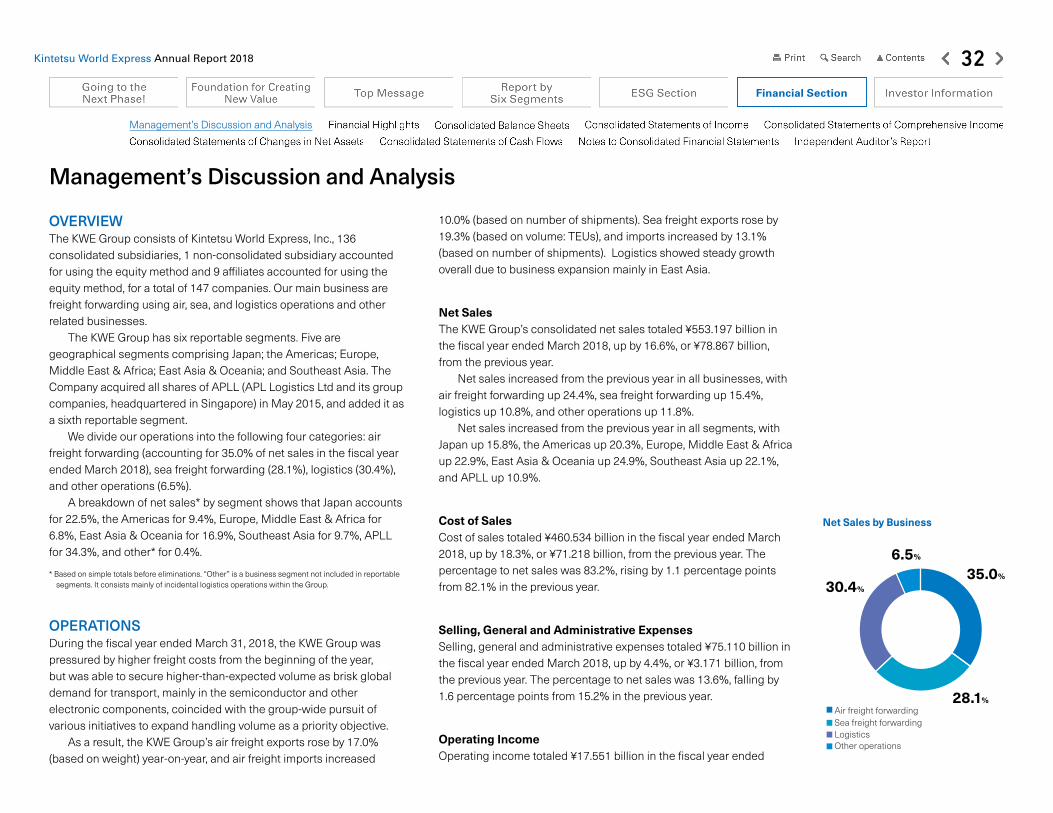
OVERVIEWThe KWE Group consists of Kintetsu World Express, Inc., 136 consolidated subsidiaries, 1 non-consolidated subsidiary accounted for using the equity method and 9 affiliates accounted for using the equity method, for a total of 147 companies. Our main business are freight forwarding using air, sea, and logistics operations and other related businesses. The KWE Group has six reportable segments. Five are geographical segments comprising Japan; the Americas; Europe, Middle East & Africa; East Asia & Oceania; and Southeast Asia. The Company acquired all shares of APLL (APL Logistics Ltd and its group companies, headquartered in Singapore) in May 2015, and added it as a sixth reportable segment. We divide our operations into the following four categories: air freight forwarding (accounting for 35.0% of net sales in the fiscal year ended March 2018), sea freight forwarding (28.1%), logistics (30.4%), and other operations (6.5%). A breakdown of net sales* by segment shows that Japan accounts for 22.5%, the Americas for 9.4%, Europe, Middle East & Africa for 6.8%, East Asia & Oceania for 16.9%, Southeast Asia for 9.7%, APLL for 34.3%, and other* for 0.4%.
* Based on simple totals before eliminations. “Other” is a business segment not included in reportable segments. It consists mainly of incidental logistics operations within the Group.
OPERATIONSDuring the fiscal year ended March 31, 2018, the KWE Group was pressured by higher freight costs from the beginning of the year, but was able to secure higher-than-expected volume as brisk global demand for transport, mainly in the semiconductor and other electronic components, coincided with the group-wide pursuit of various initiatives to expand handling volume as a priority objective. As a result, the KWE Group’s air freight exports rose by 17.0% (based on weight) year-on-year, and air freight imports increased
10.0% (based on number of shipments). Sea freight exports rose by 19.3% (based on volume: TEUs), and imports increased by 13.1% (based on number of shipments). Logistics showed steady growth overall due to business expansion mainly in East Asia.
Net SalesThe KWE Group’s consolidated net sales totaled ¥553.197 billion in the fiscal year ended March 2018, up by 16.6%, or ¥78.867 billion, from the previous year. Net sales increased from the previous year in all businesses, with air freight forwarding up 24.4%, sea freight forwarding up 15.4%, logistics up 10.8%, and other operations up 11.8%. Net sales increased from the previous year in all segments, with Japan up 15.8%, the Americas up 20.3%, Europe, Middle East & Africa up 22.9%, East Asia & Oceania up 24.9%, Southeast Asia up 22.1%, and APLL up 10.9%.
Cost of SalesCost of sales totaled ¥460.534 billion in the fiscal year ended March 2018, up by 18.3%, or ¥71.218 billion, from the previous year. The percentage to net sales was 83.2%, rising by 1.1 percentage points from 82.1% in the previous year.
Selling, General and Administrative ExpensesSelling, general and administrative expenses totaled ¥75.110 billion in the fiscal year ended March 2018, up by 4.4%, or ¥3.171 billion, from the previous year. The percentage to net sales was 13.6%, falling by 1.6 percentage points from 15.2% in the previous year.
Operating IncomeOperating income totaled ¥17.551 billion in the fiscal year ended
Net Sales by Business
Air freight forwarding
LogisticsOther operations
35.0%
28.1%
30.4%
6.5%
Sea freight forwarding

Kintetsu World Express Annual Report 2018 33
March 2018, up by 34.2%, or ¥4.476 billion, from the previous year. The operating margin was 3.2%, rising by 0.4 percentage points from 2.8% in the previous year. Cost of sales to net sales increased by 1.1 percentage points from the previous year, but selling, general, and administrative expenses to net sales improved by decreasing by 1.6 percentage points from the previous year.
Other Income (Expenses)Other net expenses totaled ¥0.671 billion in the fiscal year ended March 2018, expanding from net expenses of ¥0.588 billion in the previous year. Main positive factors included a decrease in equity in losses of affiliates, net of ¥0.666 billion from the previous year and completing the recording of loss on arbitration ruling, provision for loss on litigation, and loss on litigation in the previous year. However, key negative factors included a decrease in foreign currency exchange gain, net of ¥0.693 billion, an increase in impairment loss of ¥0.120 billion, and the recording of provision of allowance for doubtful accounts and loss on liquidation of subsidiaries.
Income before Income TaxesIncome before income taxes totaled ¥16.879 billion in the fiscal year ended March 2018, up by 35.2%, or ¥4.393 billion, from the previous year.
Income TaxesIncome taxes totaled ¥8.498 billion in the fiscal year ended March 2018, up by 21.7%, or ¥1.516 billion, from the previous year. The effective tax rate was 50.3%, down from 55.9% in the previous year.
Net Income Attributable to Owners of the Parent, Net Income per Share, Return on EquityNet income attributable to owners of the parent rose by 56.1% from the previous year to ¥7.002 billion in the fiscal year ended March
2018. As a result, net income per share increased to ¥97.26, up from ¥62.33 in the previous year. ROE increased to 5.9% from 3.7% in the previous year.
OUTLOOK FOR THE YEAR THROUGH MARCH 2019In the fiscal year ending March 2019, we expect continued robust transport demand, especially for semiconductors and other electronic components, and automotive-related products, supported by technological innovations including IoT and AI. However, we also expect headwinds from freight costs rising and staying high, the emergence of geopolitical risks, and concerns about foreign currency fluctuations. In this environment, the KWE Group will implement priority measures for the final year of the Medium-Term Management Plan, “Going to the Next Phase!”, which started in the fiscal year ended March 2017. These measures comprise (1) Volume expansion of TPEB (Trans-Pacific East Bound) business, (2) Business expansion among Non-Japanese “Corporate Accounts”, (3) Promotion of sales strategy by commodity, (4) Corporate system optimization to achieve 700,000 tons/700,000 TEU, (5) Continued efforts to improve earnings, (6) Strengthening of group governance for optimal group management, and (7) Development of human resources and their optimal placement. Based on these measures, the Group will push further ahead with various initiatives to expand volume with a view toward future growth and will reinforce its business base in pursuit of sustainable growth. We revised upward our earnings forecasts for the fiscal year ending March 2019 in light of the financial results for the fiscal year ended March 2018 and the recent business environment. We forecast net sales to grow by 5.7% from the fiscal year ended March 2018 to ¥585.000 billion, operating income to rise by 9.4% to ¥19.200 billion, and net income attributable to owners of the parent to increase by 24.2% to ¥8.700 billion.
Operating Gross Profit Margin
Net Sales
Net Sales by Segment
0’14/3 ’15/3 ’16/3 ’17/3 ’18/3
20(%)
15
10
5
0
5
10
15
20
0’14/3 ’15/3 ’16/3 ’17/3 ’18/3
600(Billions of yen)
400
200
0
200
400
600
JapanThe AmericasEurope, Middle East & Africa
Southeast Asia APLLOther
East Asia & OceaniaElimination or Unallocated
-100’13/3 ’14/3 ’15/3 ’16/3 ’17/3
500(Billions of yen)
400
300
200
100
0
JapanThe AmericasEurope, Middle East & Africa
Southeast Asia APLLOther
East Asia & OceaniaElimination or Unallocated
-100
0
’14/3 ’15/3 ’16/3 ’17/3 ’18/3
600
400
(Billions of yen)
200
0
100
200
300
400
500
600
-100
0
100
200
300
400
500
600
Management’s Discussion and Analysis
Financial Section

Kintetsu World Express Annual Report 2018 34
SEGMENT TRENDS BY REGIONFor a breakdown of segment trends, please refer to the Report by Six Segments on pages 14 to 19.
FINANCIAL POSITIONThe KWE Group’s total assets as of March 31, 2018 increased by ¥11.028 billion from the previous year to ¥390.273 billion. Current assets were ¥194.440 billion, up by 9.2%, or ¥16.339 billion from the previous year, mainly due to increases in notes accounts receivable-trade of ¥14.481 billion and cash and time deposits of ¥2.556 billion. Total non-current assets were ¥195.832 billion, down by 2.6%, or ¥5.310 billion from the previous year, mainly due to a decrease in total intangible assets of ¥6.720 billion primarily resulting from amortization of goodwill, despite increases in property and equipment of ¥0.639 billion and in investments and other assets of ¥0.770 billion primarily resulting from accounting for using the equity method. Total liabilities were ¥261.284 billion, up ¥8.056 billion from the previous year. Current liabilities increased by 18.2%, or ¥18.964 billion, to ¥123.414 billion, mainly due to increases in notes and accounts payable–trade of ¥10.564 billion, in short-term debt of ¥5.805 billion, and in current portion of long-term debt of ¥4.779 billion. Long-term liabilities decreased by 7.3%, or ¥10.907 billion to ¥137.869 billion, mainly due to a decrease in long-term debt of ¥10.585 billion including the aforementioned reclassification into short-term debt. Net assets were ¥128.988 billion, up by 2.4%, or ¥2.972 billion, from ¥126.016 billion in the previous year, mainly due to an increase in retained earnings of ¥5.130 billion resulting from recording net income attributable to owners of the parent of ¥7.002 billion and cash dividends paid of ¥1.871 billion, despite a decrease in foreign currency translation adjustments of ¥2.517 billion as a result of a stronger yen compared to March 31, 2017. The equity ratio at the end of the fiscal
year was 30.7%, almost unchanged from 30.9% at the end of the previous year.
LIQUIDITY AND CAPITAL RESOURCESNet cash provided by operating activities totaled ¥15.063 billion in the fiscal year ended March 2018, up by 3.2%, or ¥0.473 billion, from ¥14.589 billion in the previous year. This mainly reflected cash inflows due to income before income taxes of ¥16.879 billion, depreciation and amortization of ¥11.674 billion, and an increase in notes and accounts payable of ¥7.931 billion, and cash outflows due to an increase in notes and accounts receivable of ¥14.494 billion, and income taxes paid of ¥8.473 billion. Net cash used in investing activities totaled ¥10.030 billion in the fiscal year ended March 2018, up ¥4.687 billion from ¥5.342 billion in the previous year. This mainly reflected cash outflows due to payments for purchase of property and equipment of ¥5.192 billion and payments for purchase of intangible assets of ¥4.332 billion. Net cash used in financing activities amounted to ¥2.754 billion in the fiscal year ended March 2018, down ¥2.902 billion from ¥5.657 billion in the previous year. This mainly reflected cash inflows due to net increase in short-term debt of ¥6.024 billion, and cash outflows due to payments for long-term debt of ¥5.825 billion, payments of cash dividends of ¥1.871 billion, and payments of cash dividends to non-controlling interests of ¥0.976 billion. As a result of the above, cash and cash equivalents totaled ¥67.856 billion as of March 31, 2018, up by 3.6%, or ¥2.349 billion, from ¥65.506 billion as of March 31, 2017.
Operating Margin
SGA Expenses to Net Sales
Operating Income
0’14/3 ’15/3 ’16/3 ’17/3 ’18/3
6.0(%)
4.0
2.0
0
1
2
3
4
5
6
0’14/3 ’15/3 ’16/3 ’17/3 ’18/3
20(%)
15
10
5
0
5
10
15
20
0’14/3 ’15/3 ’16/3 ’17/3 ’18/3
20.0(Billions of yen)
15.0
10.0
5.0
0
5
10
15
20
Management’s Discussion and Analysis
Financial Section

Kintetsu World Express Annual Report 2018 35
BASIC POLICY ON THE DISTRIBUTION OF PROFITSThe KWE Group will secure internal reserves to bolster its financial position and prepare for the future business expansion in Japan and overseas giving full consideration to strengthen its business base, as well as focusing on maintaining stable dividends. We paid a full-year dividend of ¥26 per share in the fiscal year ended March 2018, unchanged from the previous year. The dividend payout ratio was 26.7%, down 15.0 percentage points from 41.7% in the previous year, due to net income attributable to owners of the parent improving sharply from the previous year. We forecast a full-year dividend of ¥26 in the fiscal year ending March 2019, a dividend payout ratio of 21.5%.
DISCLOSURE OF RISKSIGNIFICANT RISK FACTORS WITH POTENTIAL TO IMPACT OPERATING RESULTS
The followings are the major risk factors that the Group recognizes as having the potential to affect our performance and financial condition.
1. Economic conditionsThe Group’s performance and financial condition is affected by global economic trends and shipping demands of our customers. Our performance and financial condition could also be affected in the event of a global economic crisis, natural disaster, pandemic, terrorist attack, or other social disruption.
2. Exchange rate fluctuationsAs the Group conducts global operations, fluctuations in foreign exchange rates in any of these regions could affect our performance and financial condition. We use foreign exchange forward contracts
to avoid the risk of fluctuations in foreign exchange rates in relation to foreign currency denominated receivables and payables and to foreign currency denominated scheduled transactions. Our policy is to execute and manage forward contracts according to internal company rules, to not enter into contracts with terms of more than one year in principle, and to not engage in speculative dealings or highly leveraged transactions.
3. Fluctuations in fuel pricesThe Group maintains close relationships with transport companies, including air and sea carriers, and works to expand channels, given that a surge in fuel prices could affect freight costs. However, unforeseen circumstances could impact our performance.
4. Fluctuations in freight costsThe Group requests that customers bear any cost increases resulting from higher freight costs at air and sea carriers. However, the inability to pass costs on selling prices for some reason could impact our performance.
5. M&A, capital and business alliancesThe Group acquires other companies and forms capital and business alliances with other companies in order to increase its competitiveness to achieve further growth. We acquired APL Logistics Ltd (including its consolidated subsidiaries), which operates a global logistics business, in May 2015. Our performance and financial condition could be affected if it incurs impairment losses on goodwill in the event of earnings at an acquired company falling short of expectations at the time of the acquisition, or a determination that expected results cannot be achieved due to changes in the business environment, competitive conditions, or other factors.
Net Assets and Equity Ratio
ROE
Total Assets
Net Assets (left)Equity Ratio (right)
0’14/3 ’15/3 ’16/3 ’17/3 ’18/3
150(Billions of yen)
100
50
0
90(%)
60
30
0
30
60
90
0
50
100
150
0’14/3 ’15/3 ’16/3 ’17/3 ’18/3
15(%)
10
5
0
5
10
15
0’14/3 ’15/3 ’16/3 ’17/3 ’18/3
400(Billions of yen)
300
200
100
0
100
200
300
400
Management’s Discussion and Analysis
Financial Section

Kintetsu World Express Annual Report 2018 36
6. Financial covenantsThe Group’s major loan agreements with financial institutions include financial covenants. A breach of these covenants could adversely affect our operation, performance and financial condition.
7. Legal regulationsThe Group’s business activities are affected by the various legal regulations enacted in each country with respect to transport, warehouse storage management, and other operations. These consist mainly of social regulations (to ensure safety) and legal regulations governing transport operations. It is possible that changes to existing regulations could cause a temporary spike in capital spending, which could affect our performance. It is also possible that inadequate compliance or serious violation of various regulations could affect our performance and brand image, including sanctions restricting business activities or monetary penalties.
8. Litigation and disputesThe Group could face various forms of lawsuits or other actions related to our business activities, and depending on the content and outcome of these actions, it could impact our performance and financial condition.
9. Transport accidentsThe Group takes the utmost care as we develop our international logistics business, based on accumulated know-how as a freight forwarder. Nevertheless, our performance could be affected in the event of a transport accident occurring, for example, due to an unpredictable disaster.
10. Storage and security at logistics facilitiesThe Group provides services at our logistics facilities globally, and we take all steps necessary to ensure the storage and security. However, our performance could be affected by a natural disaster, war, terrorist attack, or other events.
11. Customer data management / information leaksThe Group systematically manages customer and freight movement information through our intra-Group information network. We perform regular audits and inspections to ensure that there are no information leaks. In addition, in accordance with Japan’s Act on the Protection of Personal Information, we instituted a company-wide policy regarding the safeguarding of personal information, and we strive to make every employee familiar with it. Nevertheless, in the unlikely event that for some reason customer information should be leaked to an outside party, the resulting loss of trust in the Company could affect our performance.
12. Information system securityThe Group uses integrated computer systems group-wide and manages much of its global operations with IT systems. We strive to ensure that these information systems operate reliably by using a redundant structure of data centers and network connections, and have hardware and software safeguards against unauthorized access and viruses. Nevertheless, our performance could be adversely affected if these information systems temporarily malfunction as a result of unforeseen virus, hacker attacks or blackouts, etc.
Cash Flows
Operating activitiesInvesting activitiesFinancing activities
Effect of exchange rate fluctuationsNet increase in cash and cash equivalents
-20
20(Billions of yen)
10
0
-10
-20
-10
0
10
20
Management’s Discussion and Analysis
Financial Section

Kintetsu World Express Annual Report 2018 37
Financial Highlights
Financial Section
Millions of yen Thousands ofU.S. dollars*2
2011 2012 2013 2014 2015 2016 2017 2018 2018Results of Operation (Millions of yen)
Net sales ¥ 267,688 ¥ 264,403 ¥ 247,977 ¥ 281,505 ¥ 327,192 ¥ 420,252 ¥ 474,330 ¥ 553,197 $ 5,207,050Operating income 11,898 13,824 13,295 13,742 16,563 15,356 13,075 17,551 165,201Income before income taxes 12,676 14,954 14,170 14,916 16,372 17,847 12,486 16,879 158,876Net income attributable to owners of the parent 7,880 9,545 9,134 9,417 10,489 9,773 4,487 7,002 65,907
Financial Position (Millions of yen)Total assets ¥ 120,280 ¥ 125,437 ¥ 140,116 ¥ 167,966 ¥ 194,553 ¥ 385,902 ¥ 379,244 ¥ 390,273 $ 3,673,503Property and equipment 32,764 31,661 32,512 35,988 39,831 45,944 46,109 46,749 440,032Interest-bearing debt 14,676 14,469 14,562 15,078 15,734 166,187 166,260 166,429 1,566,538Long-term liabilities 6,633 6,885 3,659 9,291 11,093 152,296 148,777 137,869 1,297,712Total liabilities 48,963 47,356 47,919 56,735 64,865 250,703 253,228 261,284 2,459,375Net assets 71,317 78,080 92,197 111,231 129,687 135,199 126,016 128,988 1,214,118
Cash Flows (Millions of yen)Net cash provided by (used in) operating activities ¥ 9,843 ¥ 11,118 ¥ 8,855 ¥ 10,756 ¥ 9,457 ¥ 20,143 ¥ 14,589 ¥ 15,063 $ 141,782Net cash provided by (used in) investing activities 779 (3,820) (8,044) (5,016) (10,870) (147,207) (5,342) (10,030) (94,408)Net cash provided by (used in) financing activities (2,703) (1,396) (1,785) (1,864) (1,424) 144,744 ((5,657) (2,754) (25,922)Cash and cash equivalents at end of year 30,966 36,096 38,271 47,963 48,700 63,903 65,506 67,856 638,704Capital expenditures for property and equipment (cash basis) 1,465 1,549 1,625 3,776 4,889 5,735 3,762 5,192 48,870Depreciation and amortization 2,998 2,659 2,536 2,615 2,806 7,236 10,729 11,674 109,883
Per Share Data (Yen)*1
Net income ¥ 109.46 ¥ 132.58 ¥ 126.86 ¥ 130.80 ¥ 145.68 ¥ 135.74 ¥ 62.33 ¥ 97.26 $ 0.91Cash dividends 15.00 17.50 18.50 20.00 23.00 26.00 26.00 26.00 0.24Net assets 962.95 1,056.84 1,250.56 1,504.84 1,750.16 1,741.44 1,627.84 1,662.72 15.65
Management Indicators Operating margin (%) 4.4 5.2 5.4 4.9 5.1 3.7 2.8 3.2Return on equity (%) 11.7 13.1 11.0 9.5 9.0 7.9 3.7 5.9Current ratio (Times) 1.8 2.1 2.1 2.4 2.4 1.8 1.7 1.6Debt-to-equity (Times) 0.2 0.2 0.2 0.1 0.1 1.3 1.4 1.4Number of employees (consolidated) 9,238 9,671 10,047 10,219 10,680 17,311 18,159 18,140
Financial Highlights Kintetsu World Express, Inc. and Consolidated Subsidiaries / For years ended March 31
*1 The Company conducted a stock split at a ratio of 1:2 of common stock on October 1, 2015. Per share data is calculated based on the assumption that the stock split was conducted on April 1, 2010.*2 U.S. dollars is included solely for the convenience of readers outside Japan, using the prevailing exchange rate at March 31, 2018 which is ¥106.24 to U.S.$1.
Medium-Term Management Plan“Going to the Next Phase!”
April 2016 - March 2019

Kintetsu World Express Annual Report 2018 38
ASSETS LIABILITIES AND NET ASSETS
Thousands of U.S. dollars
(Note 1)
Thousands of U.S. dollars
(Note 1)
Millions of yen
Millions of yen2018 20182017 20172018 2018
See accompanying notes. See accompanying notes.
Current assets: Cash and time deposits (Notes 3, 5 and 13) Notes and accounts receivable-trade (Notes 5 and 13) Less: Allowance for doubtful accounts Marketable securities (Notes 4 and 13) Deferred tax assets (Note 10) Other current assets Total current assets
Property and equipment: Land Buildings and structures Machinery and equipment Leased assets Others
Less: Accumulated depreciation Total property and equipment
Intangible assets: Goodwill (Note 15) Customer-related intangible assets Other intangible assets Total intangible assets
Investments and other assets: Investments in: (Notes 4 and 13) Affiliates Others Long-term loans receivable (Note 13) Net defined benefit asset (Note 9) Deferred tax assets (Note 10) Other investments (Note 5) Less: Allowance for doubtful accounts Total investments and other assets
Total assets (Note 15)
Current liabilities: Notes and accounts payable-trade (Notes 5 and 13) Short-term debt (Notes 5, 8 and 13) Current portion of long-term debt (Notes 8, 13 and 14) Lease obligations (Note 8) Income taxes payable (Notes 10 and 13) Deferred tax liabilities (Note 10) Accrued bonuses to employees Accrued bonuses to directors and corporate auditors Provision for loss on litigation Other current liabilities Total current liabilities
Long-term liabilities: Long-term debt (Notes 8, 13 and 14) Lease obligations (Note 8) Net defined benefit liability (Note 9) Deferred tax liabilities (Note 10) Other long-term liabilities Total long-term liabilities
Net assets (Note 11):Shareholders’ equity: Common stock Authorized 240,000,000 shares Issued 72,000,000 shares Capital surplus Retained earnings Treasury stock Total shareholders’ equity
Accumulated other comprehensive income Unrealized gains (losses) on available-for-sale securities Foreign currency translation adjustments Remeasurements of defined benefit plans Total accumulated other comprehensive income
Non-controlling interests in consolidated subsidiaries
Total net assets
Total liabilities and net assets
$ 685,542 1,035,438 (19,747) 24,077 8,659 96,225 1,830,195
132,548 372,260 52,804 15,013 220,754 793,401 (353,360) 440,032
617,338 330,751 193,919 1,142,018
136,069 54,329 – – 11,972 59,403 (545) 261,238
$ 3,673,503
$ 485,899 295,764 99,792 1,967 36,398 3,445 43,448 2,353 – 192,545 1,161,652
1,163,883 5,111 27,080 85,551 16,067 1,297,712
67,921 38,441 1,056,739 (28) 1,163,074
17,818 (49,585) (4,499) (36,266)
87,311 1,214,118
$ 3,673,503
¥ 70,275 95,523 (1,189) 3,278 893 9,319 178,101
14,181 39,113 5,275 1,329 19,904 79,804 (33,694) 46,109
71,925 38,349 17,774 128,049
13,978 5,583 52 6 1,147 6,274 (58) 26,983
¥ 379,244
¥ 41,057 25,617 5,822 157 3,823 286 4,405 369 230 22,680 104,450
134,237 425 2,520 9,561 2,032 148,777
7,216 4,018 107,137 (3) 118,367
1,754 (2,751) (170) (1,167)
8,815
126,016
¥ 379,244
¥ 72,832 110,005 (2,098) 2,558 920 10,223 194,440
14,082 39,549 5,610 1,595 23,453 84,291 (37,541) 46,749
65,586 35,139 20,602 121,328
14,456 5,772 – – 1,272 6,311 (58) 27,754
¥ 390,273
¥ 51,622 31,422 10,602 209 3,867 366 4,616 250 – 20,456 123,414
123,651 543 2,877 9,089 1,707 137,869
7,216 4,084 112,268 (3) 123,565
1,893 (5,268) (478) (3,853)
9,276
128,988
¥ 390,273
Consolidated Balance Sheets Kintetsu World Express, Inc. and SubsidiariesAs of March 31, 2018 and 2017
Consolidated Balance Sheets
Financial Section

Kintetsu World Express Annual Report 2018 39
Consolidated Statements of Income Consolidated Statements of Comprehensive IncomeKintetsu World Express, Inc. and SubsidiariesFor the years ended March 31, 2018 and 2017
Kintetsu World Express, Inc. and SubsidiariesFor the years ended March 31, 2018 and 2017
Thousands of U.S. dollars
(Note 1)
Thousands of U.S. dollars
(Note 1)
Millions of yen
Millions of yen2018 20182017 20172018 2018
See accompanying notes.
Net sales (Note 15)Cost of sales Operating gross profit
Selling, general and administrative expenses (Notes 15 and 16) Operating income (Note 15)Other income (expenses): Interest and dividend income Interest expenses Foreign currency exchange gain, net Equity in earnings (losses) of affiliates, net (Note 15) Subsidy income Gain on sales of fixed assets Reversal of impairment losses Settlement received Impairment loss (Notes 7 and 15) Loss on disposal of fixed assets Loss on liquidation of subsidiaries (Note 17) Provision of allowance for doubtful accounts Loss on litigation Provision for loss on litigation Loss on arbitration ruling Others, net (Notes 4, 15 and 17)
Income before income taxesIncome taxes (Note 10): Current Deferred
Net income
Net income attributable to non-controlling interests
Net income attributable to owners of the parent
Net income
Other comprehensive income (Note 18): Unrealized gains (losses) on available-for-sale securities Deferred gains (losses) on hedges Foreign currency translation adjustments Remeasurements of defined benefit pension plans Share of other comprehensive income of entities accounted for using equity method Total other comprehensive income
Comprehensive income
Comprehensive income attributable to Owners of the parent Non-controlling interests
$ 5,207,050 4,334,845 872,195
706,984 165,201
5,769 (9,591) 1,835 (1,967) 1,129 5,346 884 4,951 (1,647) (18) (4,301) (9,591) – – – 875 (6,315) 158,876
83,170 (3,181) 79,988
78,887
12,970
$ 65,907
$ 78,887
1,298 – (27,268) (2,870)
3,830 (25,009)
$ 53,878
$ 40,625 13,243
¥ 474,330 389,316 85,014
71,939 13,075
540 (913) 888 (875) 160 137 – 431 (55) (51) – – (36) (227) (747) 160 (588) 12,486
7,396 (414) 6,982
5,504
1,017
¥ 4,487
¥ 5,504
416 4 (7,804) 121
(1,261) (8,524)
¥ (3,020)
¥ (3,664) 644
¥ 553,197 460,534 92,662
75,110 17,551
613 (1,019) 195 (209) 120 568 94 526 (175) (2) (457) (1,019) – – – 93 (671) 16,879
8,836 (338) 8,498
8,381
1,378
¥ 7,002
¥ 8,381
138 – (2,897) (305)
407 (2,657)
¥ 5,724
¥ 4,316 1,407
See accompanying notes.
Consolidated Statements of Income Consolidated Statements of Comprehensive Income
Financial Section

Kintetsu World Express Annual Report 2018 40
Consolidated Statements of Changes in Net Assets Kintetsu World Express, Inc. and SubsidiariesFor the years ended March 31, 2018 and 2017
Common stock
Common stock
Capitalsurplus
Capitalsurplus
Retained earnings
Retained earnings
Treasurystock
Treasurystock
Total shareholders’
equity
Total shareholders’
equity
Unrealized gains (losses)
on available-for-sale securities
Unrealized gains (losses)
on available-for-sale securities
Foreigncurrency
translationadjustments
Foreigncurrency
translationadjustments
Deferred gains (losses) on
hedges
Deferred gains (losses) on
hedges
Remeasurementsof defined
benefit plans
Remeasurementsof defined
benefit plans
Total accumulated other
comprehensiveincome
Total accumulated other
comprehensiveincome
Non-controlling interests
in consolidated subsidiaries
Non-controlling interests
in consolidated subsidiaries
Total netassets
Total netassets
Number of shares of
common stock(thousands)
Number of shares of
common stock(thousands)
Shareholders’ equity
Shareholders’ equity
Millions of yen
Thousands of U.S. dollars (Note 1)
Accumulated other comprehensive income
Accumulated other comprehensive income
Balance at April 1, 2016Cash dividends paidNet income attributable to owners of the parentPurchase of treasury stockAdjustment due to change in the fiscal period of consolidated subsidiariesChange in equity of parent related to transaction with non-controlling shareholdersNet changes in items other than shareholders’ equityBalance at April 1, 2017Cash dividends paidNet income attributable to owners of the parentCapital increase of consolidated subsidiariesNet changes in items other than shareholders’ equityBalance at March 31, 2018
Balance at April 1, 2017Cash dividends paidNet income attributable to owners of the parentCapital increase of consolidated subsidiariesNet changes in items other than shareholders’ equityBalance at March 31, 2018
¥ 135,199 (1,871)
4,487 (0)
1,250
(275)
(12,773)¥ 126,016 (1,871)
7,002
(66)
(2,224)¥ 128,988
$ 1,186,144 (17,611)
65,907
621
(20,933)$ 1,214,118
¥ 9,819 –
– –
–
–
(1,003)¥ 8,815 –
–
–
461 ¥ 9,276
$ 82,972 –
–
–
4,339 $ 87,311
¥ 10,602 –
– –
–
–
(11,769)¥ (1,167) –
–
–
(2,686)¥ (3,853)
$ (10,984) –
–
–
(25,282)$ (36,266)
¥ (205) –
– –
–
–
34 ¥ (170) –
–
–
(307)¥ (478)
$ (1,600) –
–
–
(2,889)$ (4,499)
¥ 9,473 –
– –
–
–
(12,225)¥ (2,751) –
–
–
(2,517)¥ (5,268)
$ (25,894) –
–
–
(23,691)$ (49,585)
¥ (4) –
– –
–
–
4 ¥ – –
–
–
– ¥ –
$ – –
–
–
– $ –
¥ 1,338 –
– –
–
–
416 ¥ 1,754 –
–
–
138 ¥ 1,893
$ 16,509 –
–
– 1,298 $ 17,818
¥ 114,777 (1,871)
4,487 (0)
1,250
(275)
– ¥ 118,367 (1,871)
7,002
66
– ¥ 123,565
$ 1,114,147 (17,611)
65,907
621
– $ 1,163,074
¥ (3) –
– (0)
–
–
– ¥ (3) –
–
–
– ¥ (3)
$ (28) –
–
–
–$ (28)
¥ 103,271 (1,871)
4,487 –
1,250
–
– ¥ 107,137 (1,871)
7,002
–
–¥ 112,268
$ 1,008,443 (17,611)
65,907
–
– $ 1,056,739
¥ 4,293 –
– –
–
(275)
–¥ 4,018 –
–
66
– ¥ 4,084
$ 37,820 –
–
621
– $ 38,441
¥ 7,216 –
– –
–
–
– ¥ 7,216 –
–
–
– ¥ 7,216
$ 67,921 –
–
–
– $ 67,921
72,000 – – –
–
– – 72,000 –
–
–
– 72,000
72,000 –
–
–
– 72,000
See accompanying notes.
See accompanying notes.
Consolidated Statements of Changes in Net Assets
Financial Section

Kintetsu World Express Annual Report 2018 41
Consolidated Statements of Cash Flows Kintetsu World Express, Inc. and SubsidiariesFor the years ended March 31, 2018 and 2017
Thousands of U.S. dollars
(Note 1)
Thousands of U.S. dollars
(Note 1)
Millions of yen
Millions of yen2018 20182017 20172018 2018
CASH FLOWS FROM OPERATING ACTIVITIES: Income before income taxes
Adjustments to reconcile net income before income taxes to net cash provided by operating activities: Depreciation and amortization Impairment loss Reversal of impairment losses Increase (Decrease) in accrued bonuses to employees Increase (Decrease) in accrued bonuses to directors and corporate auditors Increase (Decrease) in net defined benefit liability Increase (Decrease) in provision for loss on litigation Interest and dividend income Interest expense Equity in losses (earnings) of affiliates Loss (gain) on liquidation of subsidiaries Settlement received Loss on litigation Loss on arbitration ruling Changes in assets and liabilities: (Increase) Decrease in notes and accounts receivable Increase (Decrease) in notes and accounts payable (Increase) Decrease in other assets Increase (Decrease) in other liabilities Others, net Subtotal Interest and cash dividend received Interest paid Income taxes paid Settlement package received Payments for loss on litigation Payment for loss on arbitration rulingNet cash provided by (used in) operating activities
CASH FLOWS FROM INVESTING ACTIVITIES: Payments for time deposit Proceeds from withdrawal of time deposit Payments for purchases of securities Proceeds from sales of securities Payments for purchases of property and equipment Payments for purchases of intangible assets Proceeds from sales of property and equipment Proceeds from loans receivable Payments for loans receivable Proceeds from purchase of shares of subsidiaries resulting in change in scope of consolidation Others, netNet cash provided by (used in) investing activities
CASH FLOWS FROM FINANCING ACTIVITIES: Net increase (decrease) in short-term debt Proceeds from share issuance to non-controlling shareholders Payments of capital lease obligations Proceeds from long-term debt Payments for long-term debt Payments of cash dividends Payments of cash dividends to non-controlling interests Others, netNet cash provided by (used in) financing activitiesEffect of exchange rate fluctuations on cash and cash equivalentsNet increase (decrease) in cash and cash equivalentsCash and cash equivalents at beginning of yearIncrease (Decrease) in cash and cash equivalents resulting from change in the fiscal period of consolidated subsidiariesCash and cash equivalents at end of year (Note 3)
$ 158,876
109,883 1,647 (884) 2,419
(1,082) (988) (2,136) (5,769) 9,591 1,967 4,301 (4,951) – –
(136,426) 74,651 913 621 15,154 227,814 7,699 (9,629) (79,753) 4,951 (2,221) (7,059) 141,782
(59,017) 56,607 (28,237) 33,537 (48,870) (40,775) 6,108 2,870 (14,156)
– (2,475) (94,408)
56,701 734 (1,684) – (54,828) (17,611) (9,186) (28) (25,922)
658 22,110 616,585
–$ 638,704
¥ 12,486
10,729 55 – 526
130 (29) 227 (540) 913 875 – (431) 36 747
(10,668) 4,385 (601) (40) 1,228 20,032 800 (911) (5,726) 431 (36) – 14,589
(6,642) 7,401 (3,991) 3,179 (3,762) (1,955) 448 28 (0)
243 (291) (5,342)
(4,849) – (201) 3,000 (1,046) (1,872) (687) (0) (5,657) (1,418) 2,172 63,903
(569)¥ 65,506
¥ 16,879
11,674 175 (94) 257
(115) (105) (227) (613) 1,019 209 457 (526) – –
(14,494) 7,931 97 66 1,610 24,203 818 (1,023) (8,473) 526 (236) (750) 15,063
(6,270) 6,014 (3,000) 3,563 (5,192) (4,332) 649 305 (1,504) – (263) (10,030)
6,024 78 (179) – (5,825) (1,871) (976) (3) (2,754)
70 2,349 65,506
–¥ 67,856
See accompanying notes.
See accompanying notes.
Consolidated Statements of Cash Flows
Financial Section

Kintetsu World Express Annual Report 2018 42
Notes to Consolidated Financial Statements Kintetsu World Express, Inc. and SubsidiariesFor the years ended March 31, 2018 and 2017
The accompanying consolidated financial statements of Kintetsu World Express, Inc. (The “Company”) and its consolidated subsidiaries have been prepared in accordance with the provisions set forth in the Financial Instruments and Exchange Law and its related accounting regulations, and in conformity with accounting principles generally accepted in Japan (“Japanese GAAP”), which are different in certain aspects as to application and disclosure requirements from International Financial Reporting Standards (”IFRS”).
The accounts of overseas consolidated subsidiaries are based on their accounting records maintained in conformity with generally accepted accounting principles. In accordance with the accounting standard, “Revised Practical Solution on Unification of Accounting Policies Applied to Foreign Subsidiaries for the Consolidated Financial Statements (issued by the Accounting Standards Board of Japan (“ASBJ”) on March 26, 2015)”, certain differences between Japanese GAAP and those in overseas are adjusted in the consolidation process. The accompanying
consolidated financial statements have been reformatted and translated into English with some expanded descriptions from the consolidated financial statements of the Company provided in accordance with Japanese GAAP and filed with the appropriate Local Finance Bureau of the Ministry of Finance as required by the Financial Instruments and Exchange Law. Certain supplementary information included in the statutory Japanese language consolidated financial statements is not presented in the accompanying consolidated financial statements.
All Japanese yen figures have been rounded down to million yen. The translation of the Japanese yen amounts into U.S. dollars is rounded down to thousand dollars and is included solely for the convenience of readers outside Japan, using the prevailing exchange rate at March 31, 2018 which is ¥106.24 to U.S. $1. The convenience translations should not be construed as representations of possible future amounts, converted into U.S. dollars at this or any other rate of exchange.
Certain prior year amounts have been reclassified to conform to the year 2018 presentation.
exceeds 3 months hence financial statements based on preliminary closing date of December 31 is used. Necessary adjustments have been made in the consolidation process to address material transactions that occurred between closing dates different to the Company.
(5) Cash and Cash Equivalents In preparing the consolidated statements of cash flows, cash on hand, readily-available deposits and short term highly liquid investments with maturities not exceeding three months at the time of purchase are considered to be cash and cash equivalents.
(6) SecuritiesIn applying Japanese GAAP, securities are classified as (a) securities held for trading purposes, (b) debt securities intended to be held to maturity (hereafter, “held-to-maturity debt securities”), (c) equity securities issued by subsidiaries and affiliated companies, and (d) all other securities that are not classified in any of the above categories (hereafter, “available-for-sale securities”).
The Group does not hold any security defined as securities held for trading purposes, as of March 31, 2018 and 2017. Held-to-maturity debt securities are stated at amortized cost. Available-for-sale securities with market value are stated at market value. Unrealized gains and losses on these securities are reported, net of applicable income taxes, as a separate component of accumulated other comprehensive income in net assets. Realized gains and losses on sales of such securities are computed using weighted-average cost. Other securities that do not have market value are stated at weighted-average cost. If the market value of available-for-sale securities declines significantly, such securities are stated at market value and the difference between market value and the carrying amounts is recognized as loss in the period of the decline.
(7) Allowance for Doubtful Accounts The Company and domestic consolidated subsidiaries adopted the policy of providing the allowance for doubtful accounts using the actual rate of bad debt losses experienced in the past for the receivable other than those, for which allowance is provided based on individual evaluation of their possibility of collection.
The allowance for doubtful accounts held by overseas consolidated subsidiaries represents the amount deemed necessary to cover possible losses.
(1) Scope of ConsolidationThe Consolidated financial statements include the accounts of the Company and 136 subsidiaries for the year ended March 31, 2018. At March 31, 2017 the Company had 136 subsidiaries and consolidated all of them.
The Company and the consolidated subsidiaries are together referred to as the “Group” hereinafter.
(2) Consolidation and EliminationFor the purposes of preparing the consolidated financial statements, all significant intercompany transactions, account balances and unrealized profits are eliminated, and the portion thereof attributable to non-controlling interests charged to net income attributable to non-controlling interests.
In the elimination of investments in subsidiaries, the assets and liabilities of the subsidiaries, including the portion attributable to non-controlling interests, are evaluated using the fair value at the time the Company acquired control of the respective subsidiaries.
(8) Property and Equipment excluding Leased AssetsProperty and equipment are stated at cost and have been depreciated over the estimated useful lives of the respective assets on the straight-line method. The range of useful lives is principally as follows: Buildings and Structures ............. 5-50 yearsMachinery and equipment ......... 2-15 yearsOthers ................................................... 1-15 years
(9) Intangible Assets excluding Leased AssetsAmortization of intangible assets is computed using the straight-line method. Software for internal use is amortized on the straight-line method over their useful lives (primarily 5-10 years). Goodwill and negative goodwill which was accounted on or before March 31, 2010 are amortized on the straight-line method primarily over 20 years. Immaterial goodwill is amortized as incurred. Customer-related intangible assets and Trademark rights which were identified in business combination are amortized on the straight-line method over their useful lives of 20 years.
(10) Leased Assets under Finance Lease without Transfer of OwnershipAssets used under finance lease arrangements are capitalized. Depreciation for Leased Assets is amortized on the straight-line method with their residual values being zero over their leased periods used as the number of years for useful lives.
(11) Accounting for Impairment of Long-lived Assets The Group reviews their long-lived assets for impairment whenever changes in circumstance indicate the carrying amount of an asset or asset group may not be recoverable. An impairment loss would be recognized if the carrying amount of an asset or asset group exceeds the sum of the undiscounted future cash flows expected to result from the continued use and eventual disposition of the asset or asset group. The impairment loss would be measured as the amount by which the carrying amount of the asset exceeds its recoverable amount, which is the higher of the discounted cash flows from the continued use and eventual disposition of the asset or the net selling price at disposition.
(12) Accrued Bonuses to EmployeesBonuses to employees are provided for the portion of relevant to the current year of the estimated amount of bonus payments.
(3) Investments in Non-consolidated Subsidiaries and Affiliates
The Company has 1 non-consolidated subsidiary accounted for using the equity method because its impact on the consolidated financial statements is of low importance.
At March 31, 2018, 1 non-consolidated subsidiary and 9 affiliates, of which the Company has the ability to exercise significant influence over operating and financial policies, are accounted for by the equity method. At March 31, 2017, 1 non-consolidated subsidiary and 9 affiliates were accounted for by the equity method.
(4) Accounting PeriodThe Company’s accounting period begins each year on April 1 and ends the following year on March 31.The fiscal year end of APL Logistics Ltd and its 70 consolidated subsidiaries is the last Friday of December of each year.
The difference between the fiscal year end of the Company and that of APL Logistics and its subsidiaries
Note 1:
Note 2:
Basis of Presenting the Consolidated Financial Statements
Summary of Significant Accounting Policies
Notes to Consolidated Financial Statements
Financial Section

Kintetsu World Express Annual Report 2018 43
(13) Accrued Bonuses to Directors and Corporate AuditorsBonuses to directors and corporate auditors are provided for the portion relevant to the current year of the estimated amount of bonus payments.
(14) Accounting for Retirement BenefitsThe Group adopts the accounting standard for employees’ severance and retirement benefits, under which allowance and expenses for severance and pension benefits are determined based on the amounts obtained by actuarial calculations.
The Company and certain consolidated subsidiaries have a defined benefit pension plan while certain overseas subsidiaries have either a defined benefit pension plan or a defined contribution pension plan.
Under such conditions, the Group adopts following policies about the Accounting for Retirement Benefits.
a) The calculation method of the retirement benefit obligation
The retirement benefit obligation amount to be amortized in the period of the year ended March 31, 2018 is calculated under benefit formula bases.
b) Actuarial gains and losses and past service costs The past service cost is amortized on the straight- line method over the period of 13 years.
Actuarial gains and losses are amortized evenly commencing from the following fiscal year on the straight-line method over the period prescribed by the average of the estimated remaining service period of 13 years.
c) The simplified method for the retirement benefit obligation
Some consolidated subsidiaries calculate the amounts of net defined benefit liability and retirement benefit cost by utilizing the simplified method that the estimated severance amount for all employees at the year-end is deemed as the retirement benefit obligation for the year.
(15) Foreign Currency Transactions All short-term and long-term monetary receivables and payables denominated in foreign currencies are translated into Japanese yen at the exchange rates at the year-end date. The foreign exchange gains and losses from transactions are recognized in the consolidated statements of income and the consolidated statements of comprehensive income to the extent that they are not hedged by forward exchange contracts.
The evaluation of hedge effectiveness is based on a comparison between the cumulative fluctuations in rates or fluctuation of cash flows on hedged object and hedging instruments. The evaluation of hedge effectiveness for interest and currency swaps is omitted as they meet the requirements of integral accounting.
(20) Per Share Information Net income per share of common stock is computed based upon the weighted-average number of shares outstanding during the year. Diluted earnings per share of common stock for the years ended March 31, 2018 and 2017 are not presented since the Company had no securities with dilutive effect. Cash dividends per share presented in the consolidated statements of income represent dividends declared as applicable to the respective year, including dividends paid after the end of the year.
(21) Standards and Guidance Issued but Not Yet AdoptedThe following guidance were issued but not yet adopted. ·“Implementation Guidance on Tax Effect Accounting” (ASBJ Guidance No. 28, February 16, 2018 (hereinafter, “Guidance No. 28”))
·“Implementation Guidance on Recoverability of Deferred Tax Assets” (ASBJ Guidance No. 26 (revised 2018), February 16, 2018 (hereinafter, “Guidance No. 26”))
a) OverviewThe above guidance was revised in regard to the treatments for taxable temporary differences for investments in subsidiaries within the context of non-consolidated financial statements, and to clarify the treatments in determining recoverability of deferred tax assets in a company which was categorized as ‘Type1’ according to the guidance.
(16) Foreign Currency Financial Statements The balance sheet accounts of foreign consolidated subsidiaries and affiliates are translated into Japanese yen at current exchange rates prevailing at the relevant balance sheet date except for equity, which is translated at the historical rates. Revenue and expense accounts of the foreign consolidated subsidiaries and affiliates are translated into Japanese yen at the average exchange rates. The differences arising from such translations were shown as “Foreign currency translation adjustments” and “Non-controlling interests in consolidated subsidiaries” in separate components of equity.
(17) Income TaxesIncome taxes consist of corporation, inhabitant and enterprise taxes. The provision for income taxes is computed based on the pretax income of each of the Company and its consolidated subsidiaries with certain adjustments required for tax purposes. The Company and its consolidated subsidiaries recognize tax effects of temporary differences between the carrying amounts of assets and liabilities for tax purposes and financial reporting purposes, together with the assessment of the recoverability of deferred tax assets.
The asset and liability approach is used to recognize deferred tax assets and liabilities for the expected future tax consequences of temporary timing differences between the carrying amounts of assets and liabilities for financial reporting purposes and the amounts used for income tax purposes.
(18) DerivativesThe Group uses derivative financial instruments to manage their exposure to fluctuations in foreign currency exchange and interest rates. Derivative financial instruments are stated at fair value and changes in their fair values are recognized as gains or losses.
(19) Hedging ActivitiesFor derivatives used for hedging purposes, gains or losses on derivatives are deferred until the period in which the hedged transactions are recognized. Interest rate and currency swaps, which qualify for hedge accounting and meet specific matching criteria, are not measured at fair value. The net payment and receipt under the swap agreements are instead recognized and included in interest expense, and hedged items denominated in a foreign currency are translated at the contracted rate (integral accounting).
The following summarizes hedging derivative financial instruments used by the Group.
b) Effective dateEffective from the beginning of the fiscal year ending March 31, 2019.
c) Effects of the application of the standardsThe Company and its consolidated domestic subsidiaries are currently in the process of determining the effects of these new standards on the consolidated financial statements.
·“Accounting Standard for Revenue Recognition” (ASBJ Standard No. 29, March 30, 2018)
·“Implementation Guidance on Accounting Standard for Revenue Recognition” (ASBJ Guidance No. 30, March 30, 2018)
a) OverviewA comprehensive revenue recognition model where revenue is recognized by applying the following five steps:Step 1: Identify the contract(s) with a customerStep 2: Identify the performance obligations in the contractStep 3: Determine the transaction priceStep 4: Allocate the transaction price to the performance obligations in the contractStep 5: Recognize revenue when (or as) the entity satisfies a performance obligation
b) Effective dateEffective from the beginning of the fiscal year ending March 31, 2022.
c) Effects of the implementation of the standardsThe Company and its consolidated domestic subsidiaries are currently in the process of determining the effects of these new standards on the consolidated financial statements.
(22) Changes in PresentationConsolidated statements of cash flowsPrior to April 1, 2017, “Payment for purchase of intangible assets” was included in “Other” in the cash flows from investing activities section of the consolidated statements of cash flows. Since during this fiscal year ended March 31, 2018, the materiality of the amount increased, such amount was disclosed separately in the cash flows from investing activities section of the consolidated statements of cash flows. The amount included in “Other” for the year ended March 31, 2017 was ¥(1,955) million.
Interest and currency swaps
Hedging instruments
Forward foreign exchange contracts
Long-term debt denominated in foreign currency
Hedged object
Foreign currency scheduled transactions
Notes to Consolidated Financial Statements
Financial Section

Kintetsu World Express Annual Report 2018 44
2. Assets and liabilities of newly consolidated subsidiaries by acquisition For the year ended March 31, 2017 The following is the summary of assets acquired and liabilities assumed through the acquisition of shares in India Infrastructure and Logistics Private Limited for the year ended March 31, 2017, related acquisition cost and net proceeds:
For the year ended March 31, 2018No such transaction noted in current fiscal year.
3. Significant non-cash transactionsThe amounts of assets and obligations related to finance lease transactions that were newly recorded in the current fiscal year ended March 31, 2018 and the fiscal year ended March 31, 2017 are ¥344 million ($3,237 thousand) and ¥150 million, respectively.
Millions of yen2017
Current assets Non-current assets GoodwillCurrent liabilitiesNon-current liabilitiesNon-controlling interestsForeign currency translation adjustmentsAcquisition cost Cash and cash equivalents of newly consolidated subsidiariesDebt equivalent to the shares Proceeds for the acquisition
¥ 1,458 2,325 2,703 (1,868) (45) 0 0 4,572 (243) (4,572) ¥ 243
Available-for-sale securities, at March 31, 2017:
Millions of yen
DifferenceAcquisitioncostBook value
Securities with book value exceeding acquisition costsSecurities with book value not exceeding acquisition costs Total
¥ 2,468
(9)¥ 2,459
¥ 2,657
3,362 ¥ 6,019
¥ 5,126
3,353 ¥ 8,479
The following tables summarized acquisition costs, book values and fair values of securities with available fair values at March 31, 2018 and 2017:
Held-to-maturity debt securities, at March 31, 2018: NoneHeld-to-maturity debt securities, at March 31, 2017: None
Note 4: Securities
Available-for-sale securities, at March 31, 2018:
Millions of yen Thousands of U.S. dollars
DifferenceAcquisitioncostBook valueDifferenceAcquisition
costBook value
Securities with book value exceeding acquisition costsSecurities with book value not exceeding acquisition costs Total
$ 25,527
(640)$ 24,887
$ 18,618
31,287 $ 49,915
$ 44,154
30,647 $ 74,802
¥ 2,712
(68)¥ 2,644
¥ 1,978
3,324 ¥ 5,303
¥ 4,691
3,256 ¥ 7,947
Available-for-sale securities sold during the years ended March 31, 2018 and 2017:Thousands of
U.S. dollarsMillions of yen20182018 2017
Sales proceedsGain on salesLoss on sales
$ 254 0 –
¥ 281 19 –
¥ 27 0 –
Available-for-sale securities
1. At March 31, 2018 and 2017, assets pledged as collateral for secured liabilities were as follows:
Note 5: Pledged Assets and Secured Liabilities
Thousands of U.S. dollarsMillions of yen
20182018 2017Cash and time depositsNotes and accounts receivable-tradeOther investments Total
$ 1,044 45,811 56 $ 46,922
¥ 22 3,894 – ¥ 3,917
¥ 111 4,867 6 ¥ 4,985
Assets pledged as collateral
2. At March 31, 2018 and 2017, liabilities related to these assets pledged as collateral were as follows:
Thousands of U.S. dollarsMillions of yen
20182018 2017Notes and accounts payable-tradeShort-term debt Total
$ 0 30,026 $ 30,035
¥ 5 2,905 ¥ 2,910
¥ 0 3,190 ¥ 3,191
Secured liabilities
Notes to Consolidated Financial Statements
1. Reconciliations of cash and cash equivalents to the amounts presented in the accompanying consolidated balance sheets were as follows:
Note 3: Consolidated Statements of Cash Flows
Thousands of U.S. dollars
Millions of yen
201820172018Cash and time deposits Time deposits with maturities exceeding three monthsCash and cash equivalents
$ 685,542 (46,837)$ 638,704
¥ 70,275 (4,768) ¥65,506
¥ 72,832 (4,976)¥ 67,856
Financial Section

Kintetsu World Express Annual Report 2018 45
3. Annual maturities of long-term debt including lease obligations at March 31, 2018 are as follows:
4. Financial covenantsAs of March 31, 2018The Company’s long-term debt (including current portion of long-term debt) from bank of ¥125,000 million ($1,176,581 thousand) includes financial covenants, with which the Company is in compliance as follows: (a)Maintain the amount of shareholders’ equity recorded on the Company’s consolidated balance sheets as of the end
of each fiscal year at not less than 75% of the total shareholders’ equity recorded on the Company’s consolidated balance sheets as of the end of the previous fiscal year or the fiscal year ended March 31, 2015.
(b)As of the end of each fiscal year, the Company shall not recognize ordinary losses as recorded in its consolidated statements of income for two consecutive periods.
(c)Maintain net debt equity ratio on the Company's consolidated balance sheets as of the end of each fiscal year at less than three times.
As of March 31, 2017The Company's long-term debt from bank of ¥130,000 million includes financial covenants, with which the Company is in compliance as follows: (a)Maintain the amount of shareholders’ equity recorded on the Company’s consolidated balance sheets as of the
end of each fiscal year at not less than 75% of the total shareholders’ equity recorded on the Company’s consolidated balance sheets as of the end of the previous fiscal year or the fiscal year ended March 31, 2015.
(b) As of the end of each fiscal year, the Company shall not recognize ordinary losses as recorded in its consolidated statements of income for two consecutive periods.
(c) Maintain net debt equity ratio on the Company’s consolidated balance sheets as of the end of each fiscal year at less than three times.
At March 31, 2018 and 2017, guarantees were as follows:
1. Defined benefit pension plans(1) Changes in retirement benefit obligations except pension plans applying simplified method
Note 9: Accounting for Retirement Benefits
Thousands of U.S. dollarsMillions of yen
20182018 2017Borrowing from financial institution by non-consolidated subsidiary accounted for using equity method Total
$ – $ –
¥ 718 ¥ 718
¥ – ¥ –
1. Short-term debt consists principally of borrowings from banks. The weighted average interest rate of short-term debt as of March 31, 2018 and 2017 are 2.3% and 1.8%, respectively.
2. Long-term debt including lease obligations at March 31, 2018 and 2017 consists of the following:
Note 8: Short-term Debt and Long-term Debt
Thousands of U.S. dollarsMillions of yen
20182018 2017Long-term debt from banks and other financial institutions due 2016 to 2026, with average interest of 0.4% for 2018 and 2017 UnsecuredLess: Portion due within one yearLong-term debt, less current portion
$ 1,270,764 (101,760)$ 1,169,004
¥ 140,643 (5,980)¥ 134,663
¥ 135,006 (10,811)¥ 124,195
Guarantees
Year ending March 31
Thousands of U.S. dollarsMillions of yen
20182018 2017Balance at beginning of year, as previously reportedIncrease due to business combinationService costInterest costActuarial differences incurred during the yearBenefits paidPast service costsEffect of change in accounting periodIncrease due to change from the simplified method to the principle methodOtherBalance at end of year
$ 132,850 – 8,923 1,618 4,047 (10,033) (367) – 7,501 254 $ 144,813
¥ 14,134 10 788 169 (117) (878) – 34 – (29)¥ 14,114
¥ 14,114 – 948 172 430 (1,066) (39) – 797 27 ¥ 15,385
Impairment loss for the year ended March 31, 2018The Group primarily classifies its assets by management accounting unit and reviewed its long-lived assets for impairment and recognized an impairment loss of ¥175 million ($1,647 thousand) as other expenses.
1) The impairment loss was recognized on goodwill of India Infrastructure and Logistics Private Limited in India (APLL Segment), and the Group reduced the book value of these assets by ¥25 million ($235 thousand) to their recoverable amount because it is no longer foreseen to generate revenues that was expected at share acquisition. The recoverable amount was measured by value in use calculated by discounting future cash flows at a discount rate of 15.0%.
2) The impairment loss was recognized on the idle tangible assets of Japan Segment, and the Group reduced the book value of these assets by ¥150 million ($1,411 thousand), of which ¥137 million
($1,289 thousand) was allocated to land, and ¥12 million ($112 thousand) to building and structures etc. The recoverable amount was measured by the net selling price valued by outside real estate appraiser.
Impairment loss for the year ended March 31, 2017The Group primarily classifies its assets by management accounting unit and reviewed its long-lived assets for impairment and recognized an impairment loss of ¥55 million as other expenses.
The impairment loss was recognized on goodwill of India Infrastructure and Logistics Private Limited in India (APLL Segment), and the Group reduced the book value of these assets to their recoverable amount because it is no longer foreseen to generate revenues that was expected at share acquisition. The recoverable amount was measured by value in use calculated by discounting future cash flows at a discount rate of 14.0%.
Note 6:
Note 7:
Contingent Liabilities
Impairment Loss
Thousands of U.S. dollars
Millions of yen
2020202120222023 and thereafter Total
$ 99,990 284,563 124,171 660,259 $ 1,169,004
¥ 10,623 30,232 13,192 70,146 ¥ 124,195
Notes to Consolidated Financial Statements
Financial Section

Kintetsu World Express Annual Report 2018 46
Notes:1. Plan asset consists of retirement benefit trust set to the defined benefit pension plan which accounted for 0.4% and
0.6% of the plan assets as of March 31, 2018 and 2017 respectively. 2. Alternative investments are mainly investments on hedge funds.
(b) Method of determining the long-term expected rate of return on plan assets Long-term expected rate of return on plan assets is determined considering the long-term rates of return which are currently expected and expected in the future from the variety of assets portfolio components.
(4) Reconciliation of retirement benefit obligations and plan assets with net defined benefit liability and asset on the consolidated balance sheet (including the Companies applying simplified method)
(5) The components of retirement benefit costs
Thousands of U.S. dollars
Thousands of U.S. dollars
Millions of yen
Millions of yen
2018
2018
2018
2018
2017
2017
Funded retirement benefit obligationsPlan assets
Unfunded projected benefit obligationsNet liability (asset) on the consolidated balance sheetNet defined benefit liability Net defined benefit assetNet amount of liability (asset) on the consolidated balance sheet
Service costInterest costExpected return on plan assetsAmortization on actuarial gains and lossesAmortization on prior service costRetirement benefit cost with simplified methodNet retirement benefit costs of defined benefit pension plan
$ 140,446 (135,730) 4,706 22,364 $ 27,080 27,080 –$ 27,080
$ 8,010 1,618 (3,812) 103 (357) 4,066 $ 9,638
¥ 14,427 (14,214) 212 2,301 ¥ 2,513 2,520 (6)¥ 2,513
¥ 691 169 (398) (14) 0 428 ¥ 877
¥ 14,921 (14,420) 500 2,376 ¥ 2,877 2,877 –¥ 2,877
¥ 851 172 (405) 11 (38) 432 ¥ 1,024
(6) Other comprehensive income on remeasurements of defined benefit pension plans, before tax
Thousands of U.S. dollarsMillions of yen
20182018 2017Past service costsActuarial differencesTotal
$ 0 (4,150)$ (4,141)
¥ 0 173 ¥ (174)
¥ 0 (441)¥ (440)
(7) Remeasurements of defined benefit pension plans in accumulated other comprehensive income, before tax
Thousands of U.S. dollarsMillions of yen
20182018 2017Unrecognized past service costsUnrecognized actuarial differencesTotal
$ 18 6,824 $ 6,852
¥ 3 283 ¥ 287
¥ 2 725 ¥ 728
(8) Plan assets
20172018BondsEquity securitiesCash and time depositsLife insurance company accountAlternative investmentsOtherTotal
36.9%23.2%
8.6%3.7%
27.2%0.4%
100.0%
40.7%21.2%
7.6%3.7%
26.2%0.6%
100.0%
(a) Components of plan assets
(2) Changes in plan assets except pension plans applying simplified method
Thousands of U.S. dollarsMillions of yen
20182018 2017Balance at beginning of yearIncrease due to business combinationExpected return on plan assetsActuarial differences incurred during the yearContributions paid by the employerContributions paid by the employeeBenefits paidEffect of change in accounting periodOtherBalance at end of year
$ 127,532 – 3,812 (207) 6,221 903 (9,902) – 9 $ 128,379
¥ 13,423 5 398 71 550 97 (868) (114) (14)¥ 13,549
¥ 13,549 – 405 (22) 661 96 (1,052) – 1 ¥ 13,639
(3) Changes in retirement benefit obligations applying simplified method
Thousands of U.S. dollarsMillions of yen
20182018 2017Balance at beginning of yearRetirement benefit costsBenefits paidContributions paid by the employerEffect of change in accounting periodDecrease due to change from the simplified method to the principle methodOtherBalance at end of year
$ 18,345 4,066 (1,553) (2,748) – (7,501) 47 $ 10,655
¥ 1,832 428 (128) (214) 30 – 0 ¥ 1,949
¥ 1,949 432 (165) (292) – (797) 5 ¥ 1,132
Notes to Consolidated Financial Statements
Financial Section
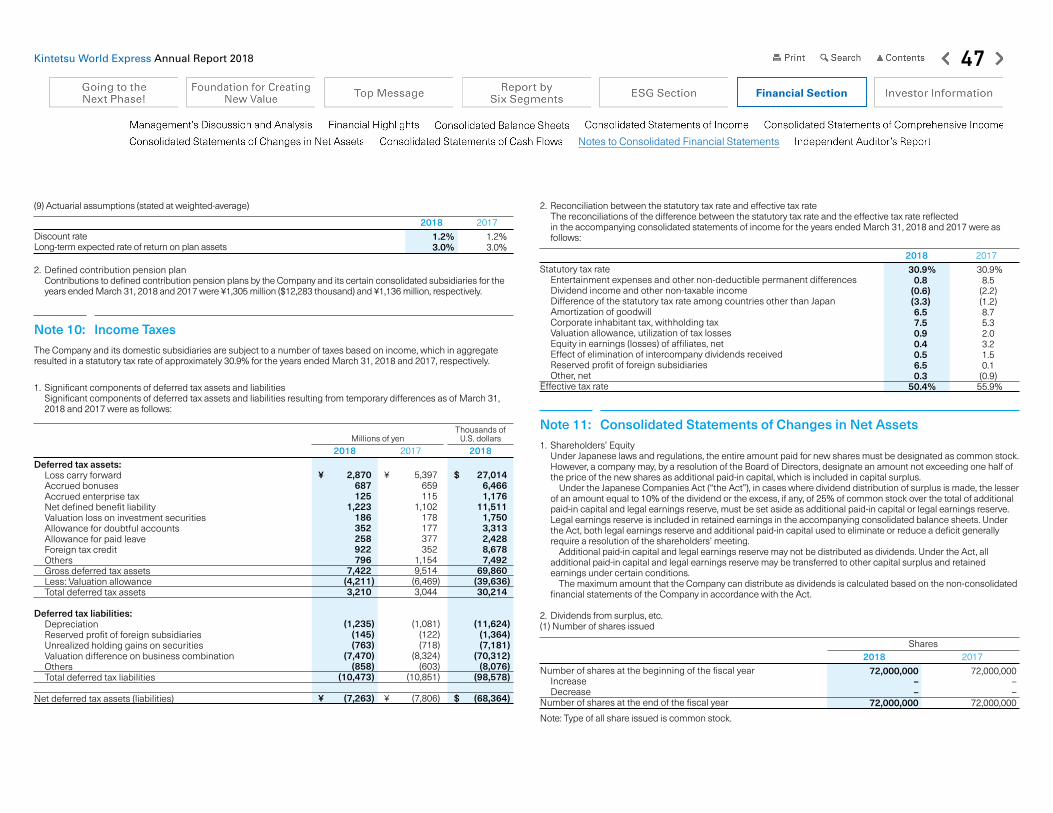
Kintetsu World Express Annual Report 2018 47
1. Shareholders’ EquityUnder Japanese laws and regulations, the entire amount paid for new shares must be designated as common stock. However, a company may, by a resolution of the Board of Directors, designate an amount not exceeding one half of the price of the new shares as additional paid-in capital, which is included in capital surplus. Under the Japanese Companies Act (“the Act”), in cases where dividend distribution of surplus is made, the lesser of an amount equal to 10% of the dividend or the excess, if any, of 25% of common stock over the total of additional paid-in capital and legal earnings reserve, must be set aside as additional paid-in capital or legal earnings reserve. Legal earnings reserve is included in retained earnings in the accompanying consolidated balance sheets. Under the Act, both legal earnings reserve and additional paid-in capital used to eliminate or reduce a deficit generally require a resolution of the shareholders’ meeting. Additional paid-in capital and legal earnings reserve may not be distributed as dividends. Under the Act, all additional paid-in capital and legal earnings reserve may be transferred to other capital surplus and retained earnings under certain conditions. The maximum amount that the Company can distribute as dividends is calculated based on the non-consolidated financial statements of the Company in accordance with the Act.
2. Dividends from surplus, etc.(1) Number of shares issued
Note 11: Consolidated Statements of Changes in Net Assets
2. Reconciliation between the statutory tax rate and effective tax rate The reconciliations of the difference between the statutory tax rate and the effective tax rate reflected in the accompanying consolidated statements of income for the years ended March 31, 2018 and 2017 were as follows:
Note: Type of all share issued is common stock.
Thousands of U.S. dollars
Millions of yen
20182017
2017
2017
2018
2018
2018Shares
Deferred tax assets: Loss carry forward Accrued bonuses Accrued enterprise tax Net defined benefit liability Valuation loss on investment securities Allowance for doubtful accounts Allowance for paid leave Foreign tax credit Others Gross deferred tax assets Less: Valuation allowance Total deferred tax assets Deferred tax liabilities: Depreciation Reserved profit of foreign subsidiaries Unrealized holding gains on securities Valuation difference on business combination Others Total deferred tax liabilities Net deferred tax assets (liabilities)
Statutory tax rate Entertainment expenses and other non-deductible permanent differences Dividend income and other non-taxable income Difference of the statutory tax rate among countries other than Japan Amortization of goodwill Corporate inhabitant tax, withholding tax Valuation allowance, utilization of tax losses Equity in earnings (losses) of affiliates, net Effect of elimination of intercompany dividends received Reserved profit of foreign subsidiaries Other, netEffective tax rate
Number of shares at the beginning of the fiscal year Increase DecreaseNumber of shares at the end of the fiscal year
$ 27,014 6,466 1,176 11,511 1,750 3,313 2,428 8,678 7,492 69,860 (39,636) 30,214
(11,624) (1,364) (7,181) (70,312) (8,076) (98,578)
$ (68,364)
¥ 5,397 659 115 1,102 178 177 377 352 1,154 9,514 (6,469) 3,044
(1,081) (122) (718) (8,324) (603) (10,851)
¥ (7,806)
30.9% 8.5 (2.2) (1.2) 8.7 5.3 2.0 3.2 1.5 0.1 (0.9) 55.9%
¥ 2,870 687 125 1,223 186 352 258 922 796 7,422 (4,211) 3,210
(1,235) (145) (763) (7,470) (858) (10,473)
¥ (7,263)
30.9% 0.8 (0.6) (3.3) 6.5 7.5 0.9 0.4 0.5 6.5 0.3 50.4%
72,000,000 – – 72,000,000
72,000,000 – – 72,000,000
1. Significant components of deferred tax assets and liabilities Significant components of deferred tax assets and liabilities resulting from temporary differences as of March 31, 2018 and 2017 were as follows:
(9) Actuarial assumptions (stated at weighted-average)
20172018Discount rateLong-term expected rate of return on plan assets
1.2%3.0%
1.2%3.0%
2. Defined contribution pension plan Contributions to defined contribution pension plans by the Company and its certain consolidated subsidiaries for the years ended March 31, 2018 and 2017 were ¥1,305 million ($12,283 thousand) and ¥1,136 million, respectively.
The Company and its domestic subsidiaries are subject to a number of taxes based on income, which in aggregate resulted in a statutory tax rate of approximately 30.9% for the years ended March 31, 2018 and 2017, respectively.
Note 10: Income Taxes
Notes to Consolidated Financial Statements
Financial Section

Kintetsu World Express Annual Report 2018 48
Year ended March 31, 2018
Ordinary general meeting of shareholders held on June 27, 2017 Board of Directors’ meeting held on November 9, 2017Year ended March 31, 2017
Ordinary general meeting of shareholders held on June 21, 2016 Board of Directors’ meeting held on November 8, 2016
internal customer credit management rule and regularly screens customers’ credit status. Investment securities are held-to-maturity debt securities, high credit rating debt securities and shares of companies with which the Group has operational relationships and they are exposed to stock market fluctuation risks. To control the risks, the Group are continuously monitoring the investees’ financial position and the market values. Credit risk arising from held-to-maturity debt securities and high credit rating debt securities is minimal. Maturities of notes and accounts payable-trade are mostly within one year. Among loans payable, short-term debts are mainly for financing related to business
Note 13: Financial Instruments1. Qualitative information on financial instruments(1) Group policy for financial instruments
The Group limits the use of financial instruments for fund management purposes to short term bank deposit, high credit rating debt securities and to loans from banks for financing. Utilizing derivative is not for speculative purposes but to manage financial risks as described in detail below.
(2) Details of financial instruments used and the exposures to risks and policies and processes for managing the risksNotes and accounts receivable-trade are exposed to credit risk of customers. To minimize the credit risk, the Group performs due date controls and balance controls for each customer in accordance with
(2) Number of treasury stock shares
(3) Items related to dividends(a) Dividend paid
Notes: 1. Type of all share issued is common stock.2. The 55 shares increase of treasury stock shares for the fiscal year ended March 31, 2017 is due to the purchase of
shares less than standard unit.
Notes: 1. Type of all share issued is common stock.2. Source of dividends is retained earnings.
Notes: 1. Type of all share issued is common stock.2. Source of dividends is retained earnings.
(b) Dividends with a record date during the years ended March 31, 2018 and 2017 but an effective date subsequent to the following fiscal year.
20172018Shares
Number of shares at the beginning of the fiscal year Increase DecreaseNumber of shares at the end of the fiscal year
2,364 – – 2,364
$ 0.15 0.09
$ 0.15
¥ 16.00
10.00
¥ 16.00
10.00
¥ 16.00
¥ 16.00
$ 10,833 6,767
$ 10,833
¥ 1,151
719
¥ 1,151
719
¥ 1,151
¥ 1,151
2,309 (Note 2) 55 – 2,364
Thousands of U.S. dollars
Thousands of U.S. dollars
U.S. dollars
U.S. dollars
Millions of yen
Millions of yen
Yen
Yen
Record date
Record date
Effective date
Effective date
Dividend paidResolutions
Dividend paidResolutions
Dividend per share
Dividend per share
Year ended March 31, 2018
Ordinary general meeting of shareholders held on June 19, 2018Year ended March 31, 2017
Ordinary general meeting of shareholders held on June 27, 2017
June 28, 2017
December 8, 2017
June 22, 2016
December 9, 2016
June 20, 2018
June 28, 2017
March 31, 2017
September 30, 2017
March 31, 2016
September 30, 2016
March 31,2018
March 31, 2017
Lease obligations under non-cancellable operating leases for the years ended March 31, 2018 and 2017 were as follows:
Note 12: Accounting for Leases
Thousands of U.S. dollarsMillions of yen
20182018 2017
Payments due within one yearPayments due after one yearTotal
$ 82,172 169,719 $ 251,901
¥ 8,424 19,753 ¥ 28,178
¥ 8,730 18,031 ¥ 26,762
Notes to Consolidated Financial Statements
Financial Section

Kintetsu World Express Annual Report 2018 49
Notes: 1. Fair value measurement of financial instruments
Assets(1) Cash and time deposits and (2) Notes and
accounts receivable-tradeThe relevant book values are used because the settlement periods of the above items are short in nature and their fair values are approximate to their book values.
(3) Marketable securities and (4) Investment securitiesThe fair value equals quoted market price or price provided by financial institutions.
Liabilities(5) Notes and accounts payable-trade, (6) Short-term
debt and (7) Income taxes payableThe relevant book values are used because the settlement periods of the above items are short in
Millions of yen Thousands of U.S. dollarsOver five
yearsOne to
five yearsOne year
or lessOver five
yearsOne to
five yearsOne year
or less
Assets(1) Cash and time deposits(2) Notes and accounts receivable-
trade(3) Marketable securities Available-for-sale securities Other securities with maturity date (corporate bonds) Other securities with maturity date (government securities) Total
$ – –
–
– $ –
$ – –
320
263 $ 592
$ 685,542 1,035,438
23,861
207 $ 1,745,058
¥ – –
–
–¥ –
¥ – –
34
28 ¥ 63
¥ 72,832 110,005
2,535
22 ¥185,395
As for foreign exchange forward contracts, it is executed and controlled under the Group’s internal rules and regulations. The credit risk of derivative transactions is deemed to be very low because the Group only conducts transactions with financial institutions with high credit ratings.
2. Fair value of financial instrumentsThe carrying amounts on the consolidated balance sheets, fair value, and differences as of March 31, 2018 were as follows. Moreover, financial instruments, for which it is extremely difficult to measure the fair value, are not included. (See Note 2)
transactions and long-term debts are mainly for financing related to capital investments andmergers and acquisitions. Those payables and debts are exposed to liquidity risk at time of settlement. However, the Group reduces that risk by having each company review its financing plans periodically and by controlling the liquidity position. As for derivative transactions, the Group enters into foreign exchange forward contracts to hedge foreign exchange risk associated with certain receivables and payables, and scheduled transactions denominated in foreign currencies. Also the Group enters into interest rate and currency swap contracts to manage interest and currency exposures on debt from financial institutions.
(*)Derivative assets and liabilities are presented on net basis. Net liabilities are disclosed in brackets.
Millions of yen Thousands of U.S. dollars
DifferenceFair valueBook valueDifferenceFair valueBook value
Assets:(1) Cash and time deposits (2) Notes and accounts receivable-trade(3) Marketable securities
Available-for-sale securities(4) Investment securities
Equity securitiesOther securities
TotalLiabilities:(5) Notes and accounts payable-trade(6) Short-term debt(7) Income taxes payable(8) Long-term debt (including current
portion of long-term debt) TotalDerivative transactions(*):(1) Hedge accounting is not applied(2) Hedge accounting is applied Total
$ – –
–
(42,112) – $ (42,112)
$ – – –
56 $ 56
$ – –$ –
$ 685,542 1,035,438
24,077
22,976 50,724 $ 1,818,768
$ 485,899 295,764 36,398
1,263,733 $ 2,081,814
$ (18) – $ (18)
$ 685,542 1,035,438
24,077
65,097 50,724 $ 1,860,890
$ 485,899 295,764 36,398
1,263,676 $ 2,081,758
$ (18) – $ (18)
¥ – –
–
(4,474) –¥ (4,474)
¥ – – –
6 ¥ 6
¥ – – ¥ –
¥ 72,832 110,005
2,558
2,441 5,389 ¥ 193,226
¥ 51,622 31,422 3,867
134,259 ¥ 221,172
¥ (2) –¥ (2)
¥ 72,832 110,005
2,558
6,916 5,389 ¥ 197,701
¥ 51,622 31,422 3,867
134,253 ¥ 221,166
¥ (2) – ¥ (2)
nature and their fair values are approximate to their book values.
(8) Long-term debt (including current portion of long-term debt)Long-term debt (including those in foreign currencies) consists of interest rate and currency swaps, which meet the specific matching criteria of integral accounting. The fair value is computed by discounting the aggregate value of the principal and interest, together with the interest rate and currency swaps, using the interest rate that would be assumed if a similar loan agreement was entered.
Derivative transactionsThe fair value information for derivatives is included in Note 14.
2. Financial instruments whose fair value cannot be reliably determinedInvestments in equity instruments that do not have a quoted market price in an active market as of March 31, 2018 were as follows:
Notes:1. These investments are not included in Assets (4)
Investment securities.2. Certain unlisted security was impaired and valuation loss
on investment security of ¥149 million ($1,402 thousand) was recorded for the year ended March 31, 2018.
3. The redemption schedule for monetary claim and debt securities with maturity dates subsequent to the consolidated balance sheet is as follows:
Thousands of U.S. dollars
Millions of yen
Book value
Investments in affiliatesInvestments in others
$ 70,971 3,595
¥ 7,540 382
Notes to Consolidated Financial Statements
Financial Section

Kintetsu World Express Annual Report 2018 50
Note: Fair value is based on information provided by financial institutions at the end of fiscal year.
Millions of yen Thousands of U.S. dollars
Unrealized gain (loss)Fair value
Contract amounts due within one year
Unrealized gain (loss)Fair value
Contract amounts due within one year
Over-the-counter transactions Foreign currency forward contracts to Purchase U.S. dollar Purchase euro Purchase British pound Purchase Thai baht Purchase Swiss franc Purchase Hong Kong dollar Purchase Swedish krona
$ (9) (0) 0 (0) (0) (0) (0)$ (18)
$ (9) (0) 0 (0) (0) (0) (0)$ (18)
$ 7,473 2,927 414 404 188 160 18 $ 11,615
¥ (1) (0) 0 (0) (0) (0) (0)¥ (2)
¥ (1) (0) 0 (0) (0) (0) (0)¥ (2)
¥ 794 311 44 43 20 17 2 ¥ 1,234
2. Derivative transactions to which hedge accounting was applied as of March 31, 2018
[Interest and Currency related]
Note: Currency and interest rate swaps which qualify for hedge accounting and meet specific criteria are not remeasured at market value but the differential paid or received under the swap agreement is recognized and included in interest expense of the long-term debt.
Hedged items and hedge accounting method
Millions of yen Thousands of U.S. dollars
Fair valueContract
amounts due over one year
Contract amountsFair value
Contract amounts due over one year
Contract amounts
Hedged items: Long-term debt and interest Hedge accounting method: Integral accounting for interest rate and currency swaps Currency and interest rate swaps to Floating-rate receipt, fixed-rate payment Receipt in U.S. dollars, payment in yen
Note $ 564,759 $ 621,234 Note ¥ 60,000 ¥ 66,000
1. Derivative transactions to which hedge accounting was not applied as of March 31, 2018
[Currency related]
Note 14: Derivatives
Notes to Consolidated Financial Statements
1. Overview of reportable segmentsReportable segments of the Group are components of an entity for which separate financial information is available and such information is evaluated regularly by the Board of Directors in deciding how to allocate resources and in assessing performance.
The Company and its consolidated subsidiaries consist of 6 reportable segments namely “Japan”, “The Americas”, “Europe, Middle East & Africa”, “East Asia & Oceania”, “Southeast Asia” and “APLL”.
2. Services of each reportable segments “Japan” , “The Americas”, “Europe, Middle East & Africa”, “East Asia & Oceania” and “Southeast Asia” segments perform business activities mainly in Air freight forwarding, Sea freight forwarding and Logistics (Warehouse operation) services. “APLL” segment provides services related to Logistics (Truck and Rail transportation and Warehouse operation) and Sea freight forwarding.
3. Calculation for net sales, segment income or loss, assets and other of reportable segmentsAccounting practice for reportable segments is the same as the practice described in Note 1 “Basis of Presenting the Consolidated Financial Statements”.
Income of reportable segments is stated on the basis of operating income. Inter-segment sales or transfer are based on market price to be used under general business conditions.
4. Net sales, segment income or loss, assets and others of reportable segmentsThe segment information of the Companies for the years ended March 31, 2018 and 2017 are presented below:
Note 15: Segment Information
Financial Section
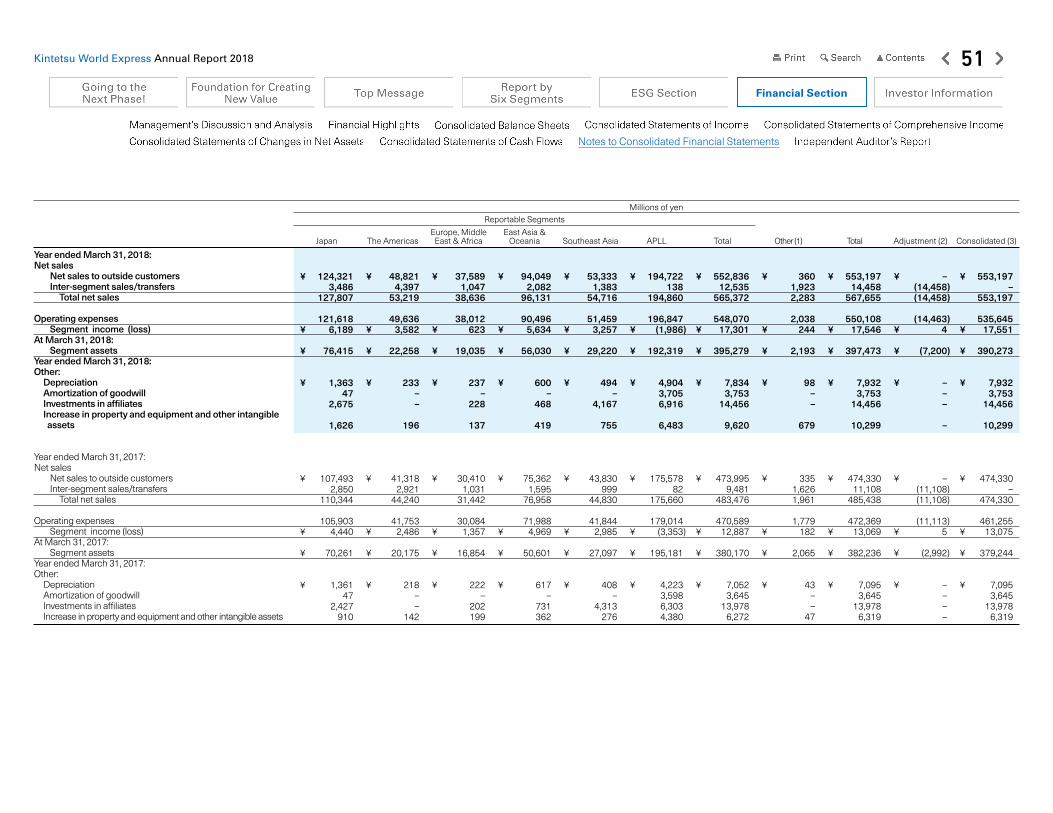
Kintetsu World Express Annual Report 2018 51
Japan The AmericasEurope, Middle
East & AfricaEast Asia &
Oceania Southeast Asia APLL Total Other (1) Total Adjustment (2) Consolidated (3)
Reportable SegmentsMillions of yen
Year ended March 31, 2018:Net sales Net sales to outside customers Inter-segment sales/transfers Total net sales
Operating expenses Segment income (loss)At March 31, 2018: Segment assetsYear ended March 31, 2018:Other: Depreciation Amortization of goodwill Investments in affiliates Increase in property and equipment and other intangible assets
Year ended March 31, 2017:Net sales Net sales to outside customers Inter-segment sales/transfers Total net sales
Operating expenses Segment income (loss)At March 31, 2017: Segment assetsYear ended March 31, 2017:Other: Depreciation Amortization of goodwill Investments in affiliates Increase in property and equipment and other intangible assets
¥ – (14,458) (14,458)
(14,463)¥ 4
¥ (7,200)
¥ – – –
–
¥ – (11,108) (11,108)
(11,113)¥ 5
¥ (2,992)
¥ – – – –
¥ 553,197 – 553,197
535,645 ¥ 17,551
¥ 390,273
¥ 7,932 3,753 14,456
10,299
¥ 474,330 – 474,330
461,255 ¥ 13,075
¥ 379,244
¥ 7,095 3,645 13,978 6,319
¥ 553,197 14,458 567,655
550,108 ¥ 17,546
¥ 397,473
¥ 7,932 3,753 14,456
10,299
¥ 474,330 11,108 485,438
472,369 ¥ 13,069
¥ 382,236
¥ 7,095 3,645 13,978 6,319
¥ 360 1,923 2,283
2,038 ¥ 244
¥ 2,193
¥ 98 – –
679
¥ 335 1,626 1,961
1,779 ¥ 182
¥ 2,065
¥ 43 – – 47
¥ 552,836 12,535 565,372
548,070 ¥ 17,301
¥ 395,279
¥ 7,834 3,753 14,456
9,620
¥ 473,995 9,481 483,476
470,589 ¥ 12,887
¥ 380,170
¥ 7,052 3,645 13,978 6,272
¥ 53,333 1,383 54,716
51,459 ¥ 3,257
¥ 29,220
¥ 494 – 4,167
755
¥ 43,830 999 44,830
41,844 ¥ 2,985
¥ 27,097
¥ 408 – 4,313 276
¥ 194,722 138 194,860
196,847 ¥ (1,986)
¥ 192,319
¥ 4,904 3,705 6,916
6,483
¥ 175,578 82 175,660
179,014 ¥ (3,353)
¥ 195,181
¥ 4,223 3,598 6,303 4,380
¥ 94,049 2,082 96,131
90,496 ¥ 5,634
¥ 56,030
¥ 600 – 468
419
¥ 75,362 1,595 76,958
71,988 ¥ 4,969
¥ 50,601
¥ 617 – 731 362
¥ 37,589 1,047 38,636
38,012 ¥ 623
¥ 19,035
¥ 237 – 228
137
¥ 30,410 1,031 31,442
30,084 ¥ 1,357
¥ 16,854
¥ 222 – 202 199
¥ 48,821 4,397 53,219
49,636 ¥ 3,582
¥ 22,258
¥ 233 – –
196
¥ 41,318 2,921 44,240
41,753 ¥ 2,486
¥ 20,175
¥ 218 – – 142
¥ 124,321 3,486 127,807
121,618 ¥ 6,189
¥ 76,415
¥ 1,363 47 2,675
1,626
¥ 107,493 2,850 110,344
105,903 ¥ 4,440
¥ 70,261
¥ 1,361 47 2,427 910
Notes to Consolidated Financial Statements
Financial Section

Kintetsu World Express Annual Report 2018 52
Note: Amounts are classified by country or geographic where service is rendered.
6. Net sales classified by Country or Geographic areaNet sales classified by country or geographic area for the years ended March 31, 2018 and 2017 are presented below:
7. Property and equipment classified by Country or Geographic areaProperty and equipment classified by country or geographic area for the years ended March 31, 2018 and 2017 are presented below:Thousands of
U.S. dollars Thousands of U.S. dollars
Millions of yenMillions of yen2018
20182018
20182017
2017Net sales classified by Country or Geographic area: Japan North America United States Others Asia and Oceania China Others Europe Latin America Others
Property and equipment classified by Country or Geographic area: Japan North America United States Others Asia and Oceania China Others Europe Latin America Others
$ 1,170,651
1,411,106 106,410
883,010 980,289 436,634 143,439 75,470 $ 5,207,050
$ 240,860
36,925 20,434
23,766 103,435 3,482 6,193 4,894 $ 440,032
¥ 107,552
104,870 9,047
77,911 88,406 39,559 39,647 7,335 ¥ 474,330
¥ 25,752
3,283 2,283
2,758 10,427 382 670 552 ¥ 46,109
Notes:1. “Other” is segment which is not included in reportable
segments and provides incidental logistics related services within the Group.
2. “Adjustment” includes:Segment income of ¥4 million ($37 thousand) and ¥5 million for the years ended March 31, 2018 and 2017, respectively represents elimination of inter-segment transactions.
Segment assets of ¥(7,200) million ($(67,771) thousand) and ¥(2,992) million at March 31, 2018 and 2017 respectively consist of elimination of inter-segment transactions of ¥(14,932) million ($(140,549) thousand) and ¥(11,918) million at March 31, 2018 and 2017 respectively and surplus fund (cash and time deposit) of the Company of ¥7,732 million ($72,778 thousand) and ¥8,926 million, which are not allocated to each segment at March 31, 2018 and 2017 respectively.
3. Segment income is adjusted with operating income in the consolidated statements of income.
5. Net sales by ServiceNet sales by Service for the years ended March 31, 2018 and 2017 are presented below:
Thousands of U.S. dollarsMillions of yen
20182018 2017Net sales by Service: Air freight forwarding Sea freight forwarding Logistics Others
$ 1,819,973
1,466,519 1,581,890 338,648 $ 5,207,050
¥ 155,486
134,991 151,680 32,172 ¥ 474,330
¥ 193,354
155,803 168,060 35,978 ¥ 553,197
¥ 124,370
149,916 11,305
93,811 104,146 46,388 15,239 8,018 ¥ 553,197
¥ 25,589
3,923 2,171
2,525 10,989 370 658 520 ¥ 46,749
Japan The AmericasEurope, Middle
East & AfricaEast Asia &
Oceania Southeast Asia APLL Total Other Total Adjustment Consolidated
Reportable SegmentsThousands of U.S. dollars
Year ended March 31, 2018:Net sales Net sales to outside customers Inter-segment sales/transfers Total net sales
Operating expenses Segment income (loss)At March 31, 2018: Segment assetsYear ended March 31, 2018:Other: Depreciation Amortization of goodwill Investments in affiliates Increase in property and equipment and other intangible assets
$ – (136,088) (136,088)
(136,135)$ 37
$ (67,771)
$ – – –
–
$ 5,207,050 – 5,207,050
5,041,839 $ 165,201
$ 3,673,503
$ 74,661 35,325 136,069
96,940
$ 5,207,050 136,088 5,343,138
5,177,974 $ 165,154
$ 3,741,274
$ 74,661 35,325 136,069
96,940
$ 3,388 18,100 21,489
19,182 $ 2,296
$ 20,641
$ 922 – –
6,391
$ 5,203,652 117,987 5,321,649
5,158,791 $ 162,848
$ 3,720,623
$ 73,738 35,325 136,069
90,549
$ 502,004 13,017 515,022
484,365 $ 30,657
$ 275,037
$ 4,649 – 39,222
7,106
$ 1,832,850 1,298 1,834,149
1,852,852 $ (18,693)
$ 1,810,231
$ 46,159 34,873 65,097
61,022
$ 885,250 19,597 904,847
851,807 $ 53,030
$ 527,390
$ 5,647 – 4,405
3,943
$ 353,812 9,855 363,667
357,793 $ 5,864
$ 179,169
$ 2,230 – 2,146
1,289
$ 459,535 41,387 500,931
467,206 $ 33,716
$ 209,506
$ 2,193 – –
1,844
$ 1,170,190 32,812 1,203,002
1,144,747 $ 58,254
$ 719,267
$ 12,829 442 25,178
15,304
Notes to Consolidated Financial Statements
Financial Section

Kintetsu World Express Annual Report 2018 53
TotalOtherAPLL TotalSoutheast
Asia East Asia &
Oceania
Europe, Middle East
& AfricaThe
AmericasJapan
Reportable SegmentsThousands of U.S. dollars
Year ended March 31, 2018 Goodwill Amortization of goodwill Balance of goodwill Negative goodwill Amortization of negative goodwill Balance of negative goodwill
$ 35,325 618,458
103
1,120
$ –
–
–
–
$ 34,873 611,314
–
–
$ 35,325
618,458
103
1,120
$ –
–
103
1,120
$ –
–
–
–
$ –
–
–
–
$ –
–
–
–
$ 442
7,134
–
–
Total
Total
Other
Other
APLL
APLL
Total
Total
Southeast Asia
Southeast Asia
East Asia &Oceania
East Asia &Oceania
Europe, Middle East
& Africa
Europe, Middle East
& Africa
The Americas
The Americas
Japan
Japan
Reportable Segments
Reportable Segments
Millions of yen
Thousands of U.S. dollars
Year endedMarch 31, 2018 Impairment loss of non-current assetsYear ended March 31, 2017 Impairment loss of non-current assets
Year endedMarch 31, 2018 Impairment loss of non-current assets
¥ 736
¥ 1,110
$ 6,927
¥ –
¥ –
$ –
¥ 435
¥ 55
$ 4,094
¥ 736
¥ 1,110
$ 6,927
¥ –
¥ –
$ –
¥ 149
¥ 1,054
$ 1,402
¥ –
¥ –
$ –
¥ –
¥ –
$ –
¥ 150
¥ –
$ 1,411
TotalOtherAPLL TotalSoutheast
Asia East Asia &
Oceania
Europe, Middle East
& AfricaThe
AmericasJapan
Reportable SegmentsMillions of yen
Year ended March 31, 2018 Goodwill Amortization of goodwill Balance of goodwill Negative goodwill Amortization of negative goodwill Balance of negative goodwillYear ended March 31, 2017 Goodwill Amortization of goodwill Balance of goodwill Negative goodwill Amortization of negative goodwill Balance of negative goodwill
¥ 3,753
65,705
11
119
¥ 3,645
72,055
11
130
¥ –
–
–
–
¥ –
–
–
–
¥ 3,705
64,946
–
–
¥ 3,598
71,249
–
–
¥ 3,753
65,705
11
119
¥ 3,645
72,055
11
130
¥ –
–
11
119
¥ –
–
11
130
¥ –
–
–
–
¥ –
–
–
–
¥ –
–
–
–
¥ –
–
–
–
¥ –
–
–
–
¥ –
–
–
–
¥ 47
758
–
–
¥ 47
806
–
–
9. Information on amortization of goodwill and balance of goodwill of reportable segmentsAmortization of goodwill and the balance of goodwill by reportable segments for the years ended March 31, 2018 and 2017 are presented below:
8. Information regarding impairment loss of long-lived assets of reportable segmentsImpairment loss of non-current assets by reportable segments for the years ended March 31, 2018 and 2017 are presented below:
Notes: 1. East Asia & Oceania segment recognized impairment loss for goodwill associated with a non-consolidated subsidiary
accounted for using equity method and recorded it in equity in earnings (losses) of affiliates, net.2. The impairment loss that APLL segment recognized includes the loss on goodwill of ¥410 million ($3,859 thousand)
caused by the resolution of liquidation of its consolidated subsidiaries and the loss is presented as loss on liquidation of subsidiaries.
Notes to Consolidated Financial Statements
Financial Section

Kintetsu World Express Annual Report 2018 54
The components of other comprehensive income for the years ended March 31, 2018 and 2017 were as follows:
Note 18: Consolidated Statements of Comprehensive Income
Thousands of U.S. dollars
Millions of yen
201820172018Unrealized gains (losses) on available-for-sale securities Increase (Decrease) during the year Reclassification Subtotal, before tax Tax (expense) or benefit Subtotal, net of tax
Deferred gains or losses on hedges Increase (Decrease) during the year Reclassification Subtotal, before tax Tax (expense) or benefit Subtotal, net of tax
Foreign currency translation adjustments Increase (Decrease) during the year Reclassification Subtotal, before tax Tax (expense) or benefit Subtotal, net of tax
Remeasurements of defined benefit plans Increase (Decrease) during the year Reclassification Subtotal, before tax Tax (expense) or benefit Subtotal, net of tax
Share of other comprehensive income of associates accounted for using equity method Increase (Decrease) during the year Reclassification SubtotalTotal other comprehensive income
$ 1,731 0 1,731 (423) 1,298
– – – – –
(27,268) – (27,268) – (27,268)
(4,254) 112 (4,141) 1,261 (2,870)
3,887 (47) 3,830 $ (25,009)
¥ 591 (18) 573 (156) 416
11 (7) 4 (0) 4
(7,804) – (7,804) – (7,804)
188 (13) 174 (53) 121
(1,085) (176) (1,261)¥ (8,524)
¥ 184 0 184 (45) 138
– – – – –
(2,897) – (2,897) – (2,897)
(452) 12 (440) 134 (305)
413 (5) 407 ¥ (2,657)
Selling, general and administrative expenses during the years ended March 31, 2018 and 2017 were summarized as follows:
Note 16: Selling, General and Administrative Expenses
Thousands of U.S. dollars
Millions of yen
201820172018Personnel expensesFacility expensesOffice expensesDepreciationAmortization of goodwillOthersTotal
$ 437,264 87,434 37,688 47,072 35,325 62,170 $ 706,984
¥ 42,910 8,068 4,071 4,406 3,645 8,835 ¥ 71,939
¥ 46,455 9,289 4,004 5,001 3,753 6,605 ¥ 75,110
Other income (expenses) includes loss on liquidation of subsidiaries as a result of the resolution of liquidation of its consolidated subsidiary, APL Logistics/CFR AD Holdings, LLC. The amount consists of loss on goodwill of ¥410 million ($3,859 thousand) and loss on disposal of fixed assets of ¥47 million ($442 thousand).
Others, net during the years ended March 31, 2018 and 2017 were summarized as follows :
Note 17: Other Income (Expenses)
Thousands of U.S. dollars
Millions of yen
201820172018Amortization of negative goodwillOther, net
$ 103 771 $ 875
¥ 11 149 ¥ 160
¥ 11 82 ¥ 93
Notes to Consolidated Financial Statements
Financial Section

Kintetsu World Express Annual Report 2018 55
Thousands of U.S. dollars
Millions of yen
201820172018Net income attributable to owners of the parent Net income not attributable to common shareholders Net income attributable to common shareholders
$ 65,907 – $ 65,907
¥ 4,487 – ¥ 4,487
¥ 7,002 – ¥ 7,002
Notes: 1. Diluted net income per share for the years ended March 31, 2018 and 2017 are omitted, because the Company has no
dilutive shares.2. Basis for calculation of earnings per share for the years ended March 31, 2018 and 2017 were as follows:
20172018Shares
Weighted-average number of shares of common stock outstanding 71,997,636 71,997,672
None
Note 20: Subsequent Events
Net assets per share as of March 31, 2018 and 2017 and net income per share for the years ended March 31, 2018 and 2017 were summarized as follows:
Note 19: Amounts Per Share
U.S. dollars
Yen201820172018
Net assets per share Earnings per share
$ 15.65 0.91
¥ 1,627.84 62.33
¥ 1,662.72 97.26
Notes to Consolidated Financial Statements Independent Auditor’s Report
Financial Section

Kintetsu World Express Annual Report 2018 56Investor Information
(As of March 31, 2018)
(As of March 31, 2018) Head Office: Shinagawa Intercity TowerA-24Fl. 2-15-1 Konan, Minato-ku, Tokyo 108-6024, Japan Tel: +81-3-6863-6440
Established: January 1970
Paid-in Capital ¥ 7,216 million
Number of Common Stocks Authorized 240,000,000 shares Issued and outstanding 72,000,000 shares
General Shareholders’ Meeting: Held every June in Tokyo, Japan.
Shareholder Register Administrator: Mitsubishi UFJ Trust and Banking Corporation
Number of Employees: 18,140 (worldwide)
Investor Relations: Shinagawa Intercity TowerA-24Fl. 2-15-1 Konan, Minato-ku, Tokyo 108-6024, Japan Tel: +81-3-6863-6443 / Fax: +81-3-5462-8501
Website Address: https://www.kwe.com
Major Shareholders
Stock Price
Shareholder Number of shares held % of shares held
Kintetsu Group Holdings Co., Ltd. 31,755,800 44.11%
Mitsui O.S.K. Lines, Ltd. 3,599,000 5.00%
Japan Trustee Services Bank, Ltd. (Trust Account 9) 2,826,000 3.93%
Japan Trustee Services Bank, Ltd. (Trust Account) 2,698,900 3.75%
NORTHERN TRUST CO. (AVFC) RE HSD00 2,319,400 3.22%
Hokko Daiwa Taxi Co., Ltd. 1,875,000 2.60%
The Master Trust Bank of Japan, Ltd. (Trust Account) 1,742,500 2.42%
NORTHERN TRUST CO. (AVFC) RE HCR00 1,145,200 1.59%
National Mutual Insurance Federation of Agricultural Cooperatives 1,051,400 1.46%
JUNIPER 949,400 1.32%
0’17/4 ’17/10 ’18/3
1,000
500
1,500
2,500
3,000
2,000
(Yen)
Investor Information

Global Logistics Partner
Shinagawa Intercity TowerA-24Fl., 2-15-1 Konan, Minato-ku, Tokyo 108-6024, JapanTel: +81-3-6863-6443 Fax: +81-3-5462-8501https://www.kwe.com
Printed in Japan
Kintetsu World Express ANNUAL REPORT 2018