Embed Size (px)
Citation preview
Gold and Gold Alloy Reference Materials
for XRF Analysis
WiesJaw Stankiewicz and Barbara BoJibrzuch
Institute ofNon-Ferrous Metals, ul Sowinskiego 5, 44-101 Cliwice, Poland
and Milosz Marczak
Polish State Mint SA, ul Pereca 21, 00-958 fiUlrsaw, Poland
A method for the production of a series of certified gold reference materials is presented. These referencematerials are intended for use in the analysis of the elemental composition of gold alloys using a nondestructive X-Ray Florescence (XRF) spectrometry method. The chemical composition of the referencematerials covers the complete range of conventional coloured and white carat gold jewellery alloys. The XRFmethod based on this series of reference materials produces analytical results which are comparable withthose obtained when using traditional chemical methods of analysis.
Described herein are the results of a project designed todevelop certified gold and gold alloy referencematerials which was undertaken by the Polish StateMint and the Polish Institute of Non-Ferrous Metals(1). The reference materials are suitable for nondestructive testing and particularly for calibration ofwavelength (WD XRF) and energy-dispersive (EDXRF) spectrometers. They are particularly useful forthe elemental analysis of the compositions of variousgrades of gold (from 8 to 24 carat) and gold alloys(jewellery, electronic, dental, coinage, etc).
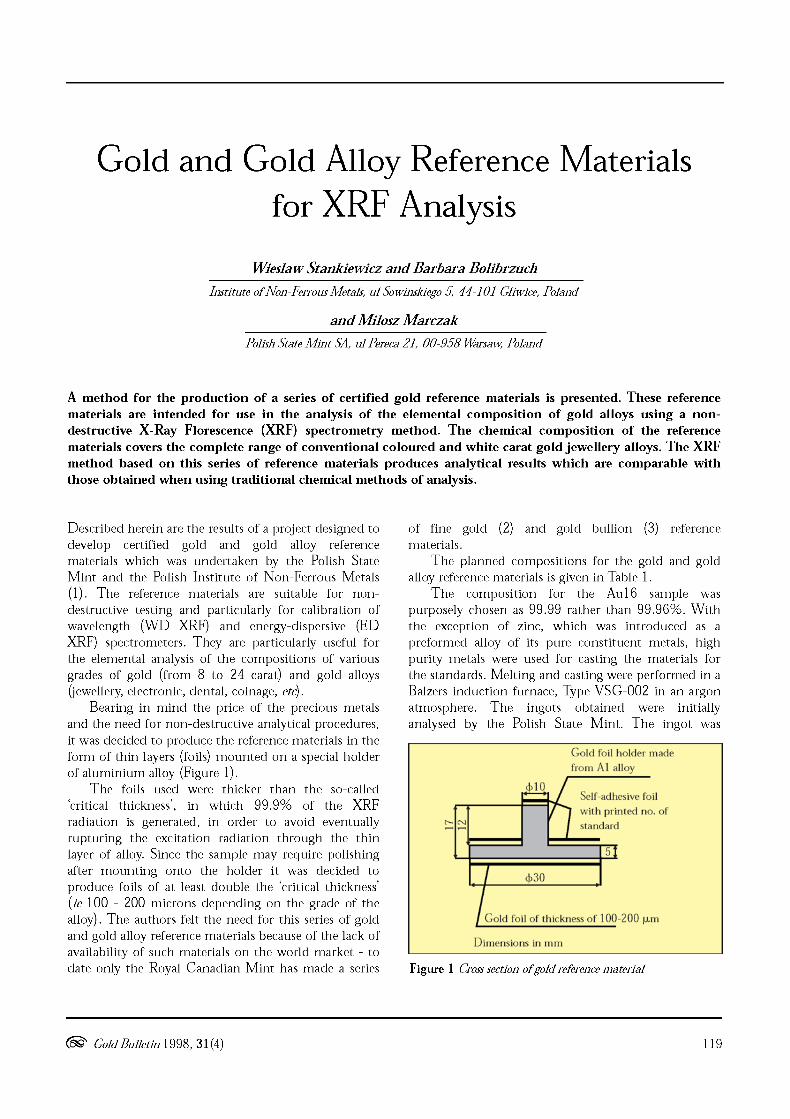
Bearing in mind the price of the precious metalsand the need for non-destructive analytical procedures,it was decided to produce the reference materials in theform of thin layers (foils) mounted on a special holderof aluminium alloy (Figure 1).
The foils used were thicker than the so-called'critical thickness', in which 99.9% of the XRFradiation is generated, in order to avoid eventuallyrupturing the excitation radiation through the thinlayer of alloy. Since the sample may require polishingafter mounting onto the holder it was decided toproduce foils of at least double the 'critical thickness'(ie 100 - 200 microns depending on the grade of thealloy). The authors felt the need for this series of goldand gold alloy reference materials because of the lack ofavailability of such materials on the world market - todate only the Royal Canadian Mint has made a series
(fiiJ' Cold Bulletin 1998, 31(4)
of fine gold (2) and gold bullion (3) referencematerials.
The planned compositions for the gold and goldalloy reference materials is given in Table 1.
The composition for the Au 16 sample waspurposely chosen as 99.99 rather than 99.96%. Withthe exception of zinc, which was introduced as apreformed alloy of its pure constituent metals, highpurity metals were used for casting the materials forthe standards. Melting and casting were performed in aBalzers induction furnace, Type VSG-002 in an argonatmosphere. The ingots obtained were initiallyanalysed by the Polish State Mint. The ingot was
Gold foil holder made
from AI alloy
Self-adhesive foil
with printed no. of
standard
</> 30
Gold foil o f th ickn ess o f 100 -200 IJ-m
Dimensions in IIUIl
Figure 1 Crosssection ofgold referencematerial
119

Table 1 Planned compositions for gold andgold alloy reference materials
Sample Au% Ag% Cu% Pd% Zn% Ni%No
Au 1 33.3 66.7
Au 2 33.3 44.7 22.0
Au 3 37.0 10.5 20.0 32.5
Au 4 37.0 20.0 10.5 32.5
Au 5 37.0 25.0 23.5 5.5 9.0
Au 6 50.0 12.5 12.5 25.0
Au 7 57.8 27.7 14.5
Au8 57.8 7.5 11.5 8.7 14.5
Au 9 57.8 15.2 10.0 17.0
Aul0 75.0 9.5 2.5 13.0
Au 11 75.0 10.0 15.0
Au1 2 75.0 25.0
Au13 91.7 3.0 5.3
Au14 96.0 4.0
Au1 5 98.6 1.4
Au1 6 99.99
annealed in a SOLO 322 strip furnace in a protectiveatmosphere made from cracked ammonia, peeled on aplaning machine to a thickness of 12mm and thengradually rolled until the required thickness had beenachieved. Discs of diameter 30mm were cut from thestrips using a die punch on a screw press. The samplescould be used for certification after removal of surfaceimpurities from both sides.
The chemical analysis of gold and its alloys is alabour-intensive process because the sample dissolvesonly slowly and in a complex fashion. If applied to acompleted product it will cause damage, and speed ofacquisition of the result is frequently important.
The touchstone method, traditionally recognizedas the best non-destructive technique to use has a lot offaults, including low accuracy, necessity to possess acomplete set of needles, a priori acquaintance ofqualitative composition and a high dependence onsubjective factors.
Each non-destructive method requires possessionof adequate reference materials and some use workingstandards for some types of materials, but themaximum possible accuracy is obtained when thelargest number of standards is available.
120
DEVELOPMENT ANDPRODUCTION OF REFERENCEMATERIALS
A schematic diagram of the method used to produce thegold and gold alloys is given in Figure 2. The objectivewas to enable the maximum number of popular gradesof gold to be analysed in the most efficient manner andalso to include the possibility of analysing other gradesof gold. Increased levels of non-homogenity for themore complex alloys and very strong matrix effects werealso taken into account, together with the individualneeds of the most important producers. This led to theplan represented in Table 1.
The standards Au3-Au12 have been selected from thelist of gold jewellery and coinage alloy grades currentlymade worldwide. Aul, Au2 and Au15 were selected fromthe Polish Standardization and Measures Daily No 9,March 5th 1974. Au13 (American gold) and Au14 (ducatgold) were added following individual requests from goldproducers, following our enquiries.
Preliminary homogeneity evaluations were carriedout using a PW1404 Philips XRF Spectrometer. The
(00' Cold Bulletin 1998, 31(4)

Figure 2 Schematic diagram ofdevelopment andproduction of
gold andgold alloys referencematerials
distribution of concentrations of all the alloyingconstituents (Au, Ag, Pu, Cu, Zn and Ni) weredetermined by measurements taken from both sides ofeach disk using ASTM E826-81 and the chemicalcomposition of the materials used. Correlation betweenthe planned and measured compositions allowedprogression to successive stages of development andproduction.
A method for fixing the foils to the aluminiumalloy substrate has been developed based on multipletests. An epoxide adhesive gave a suitably long life andgood quality of coupling. Finally, the surface of thestandards was polished.
The standards prepared in this way were subjectedto statistical examination for homogeneity. The resultswere obtained via XRF radiation intensitymeasurements made in four different parts of a givensurface of 30 randomly selected discs of each of the 16standards. This represented 30% of the referencematerials produced. The Snedecor F-test (4) wasapplied to the statistical calculations. The nullhypothesis, indicating that the concentrations of theelement examined within the object and betweenobjects do not differ significantly has been verified.The value of F is calculated from Equation (1):
Table 2 Chemical composition ofthejewellerygold certifiedreferencematerials (goldseries)
Sample Au [%]No
Au 1 33.32±0.04
Au 2 33.35 ± 0.03
Au 3 37.07 ±0.08
Au 4 37.06± 0.06
Au 5 37.14± 0.05
Au 6 49.99± 0.07
Au 7 57.88± 0.04
Au 8 57.96± 0.07
Au 9 57.81± 0.09
Au 10 74.83± 0.06
Au 11 74.95± 0.06
Au1 2 74.98± 0.04
Au13 91.67 ± 0.06
Au 14 96.00± 0.05
Au1 5 98.60± 0.05
Au16 99.99 ±0.002
(00' Cold Bulletin 1998, 31(4)
Ag [%]
65.99±0.04
44.65±0.05
10.57±0.04
20.00±0.07
25.09±0.08
12.54±0.05
27.68±0.04
7.48±0.01
2.76±0.04
eo [%] Pd [%] Zn [%] Ni [%]
121

(1)
QUALITY OFTHEXRF ANALYSISRESULTS FROM THE GOLDJEWELLERY ALLOYS AUl - AU16
The following methods were used for the elements,as indicated below:
Au - cupellation, weightAg - potentiometric, weight, ICPCu - ICp, AAS, electrolyticPd - ICp, weightZn - ICp, weight, AASNt - weight, ICp, AAS, electrolytic
The final compositions obtained for the jewellery goldreference materials are given in Table 2.
X-ray spectrometry laboratories often need to analyseseveral grades of jewellery or other gold. The possibilityof their analyses being based on one series of standardswhich could be used for several types of alloys wouldconsiderably simplify the calibration procedure, sincewhen alloys of different constituents are analysedstrong matrix effects can be taken into account. Thematrix effects are the source of the most importantsystematic errors in XRF spectrometry. The absorptionenhancement effects are the most essential componentsof the matrix effects, and they result predominantlyfrom a differentiated chemical composition in theanalysed material.
The very wide range of chemical compositions iscovered by the series of reference materials whichcorrespond to the jewellery alloys made mostfrequently, ie Au (33.32 - 99.99%), Ag (0 - 66.59%),Pd (0 - 32.44%). This investigation was designed toestablish whether the percentage of each element couldbe determined using the XRF technique. The
AuL 13 AuLa
AuL 11 lab
AgK 13AgKa
IPdKI3
PdK aAgKab
\
52 1Fcalc = S22
Where S21 represents variances corresponding todispersion of results between samples
and S22 represents variances corresponding todispersion of results within a sample
Table 3 Analyticalparameters ofthe PW1404 spcctromctci"
Element Analytical Line 20 [0] Detector
Au La 36.960 FCl + SC2
Ag Ka 15.970 SC
Pd Ka 16.720 SC
Cu Ka 45.025 FC + SC
Zn Ka 41.800 FC + SC
Ni Ka 48.670 FC
The ratios of variances (Fcalc) were smaller in each casethan Ftabular> and this confirms homogeneousdistributions of the alloying constituents in all thematerials used for standards.
The peripherals remaining after cutting out thediscs from the strips were sent to the laboratories usedfor certification. The average chemical compositions ofthe jewellery gold reference materials were based on thechemical analyses obtained from the followinglaboratories:
- Anglo American Platinum Company, Germiston,South Africa
- Anglo American Research Laboratories,Johannesburg, South Africa
- Mintek, Randburg, South Africa- Genmin Laboratory, Springs, South Africa- Handy and Harman, Fairfield, Connecticut, USA- Metalor Refining Corporation, North Attelboro,
Massachusetts, USA- Royal Canadian Mint, Ottawa, Canada- Rand Refinery, Germiston, South Africa- Institute of Non-Ferrous Metals, Gliwice, Poland- Polish State Mint, Warsaw, Poland
") The following remaining parameters were applied while measuring:
voltage/intensity of the X-ray tube - 60 kV/SO mA
analysing crystal - LiF200
collimator - fine
pulse height analyser - lower level 20
upper level 80
1) flow proportional counter 2) scintillation counter
?Pd Kab
0,4 0,5 0,6 0,7 0,8 0,9 1.0 1.1 1.2 1,3wavelengt h f•.A
Figure 3 Analytical line and absorption edgesofsilver;
palladium andgold
122 (00' ColdBulletin1998,31(4)

Table 4 Correction coeff1cients ensuring optimum correction ofmatrix effects
Correction Coefficients
Determined l3 ik 'Yimn
element'i' elements 'J' elements 'k' elements'm,n'
Au
Ag
Pd
Ag, Pd,Au, Ni, Cu
Pd,Ag,Au, Ni, Cu
Au
Ag, Pd
Ag
Ag - Pd
Cu
Zn
Ni
Ag, Pd,Au
Cu
Pd,Au, Zn
PdKcx radiation; or indirect enhancement, for example,of AuLcx radiation by PdKcx radiation which has beenadditionally enhanced by AgKf3 radiation. Matrixeffects became apparent whilst measuring the referencematerials with the PW1404 Philips X-ray Spectrometerequipped with a Mo/Se X-ray tube. The analyticalparameters for the Spectrometer are given in Table 3.
The least squares method was used to determinethe relationships between the concentration of theelements in the standards and the corresponding X-rayintensities. These are shown in Figures 4 and 5 for goldand silver. The residual standard deviations obtainedwere ±4.82 for gold and ±1.36 for silver and theseindicate strong absorption enhancement effects,disturbing the linear relationships betweenconcentrations and XRF intensities for these elements.The values for the other elements of interest forjewellery alloys are also large: palladium ±O.87%, copper±O.56%, Zn ±O.lO%, Ni ±O.65%, making theiracceptance for quantitative analysis purposes impossible.
It is therefore necessary to apply corrections forthese absorption enhancement effects (both direct andindirect) and the Philips model was used. This is acombination of the Claisse-Quintin (5), de jongh (6),Lucas-Tooth-Pyne (7) and Rasberry-Heinrich (8)models and covers corrections for all the effectsindicated above.
The model selected has the following mathematicalform:
JLC i = D, + Eil i[1 + 2:cxijlj + 2:f3u1-C, + 2:'"Yimn1m1nl
J k m,n
Where:Ei> D i - calibration coefficients,Ii - X-ray fluorescence radiation intensity ofanalyte, 'i'
Cc hem (Aul)
Cch,", IA"1)
oCO". AP:SfDAU
oCorr. AP:STDAU
Mod" :PH
Mod, !:PH
ROOft
Rcorr
Aul Au I250,00 -Keps
210.00
70.00
1-lO,OO
32.50
130.0 A"I Ag
K.",
97,50
65.00
Figure 5 AgKcx X-ray fluorescence intensity vs concentration of
silver. Average standard deviation: 5 = 1.36% Ag
0.000 p'--I-----1I----+_-+_-+_-+_-+-_+_-+_~0.0000 7.0000 14.000 21.000 28.000 35.000 42.000 49.000 56.000 63.000 70.000
0,000 +--+--I-----1---+--+--+--+--+-+_---l0,000 10.000 20.000 30.000 40.000 50,000 60,000 70.000 80.000 90,000 100.000
Figure 4 Aula X-ray fluorescence intensity vs concentration of
gold. Average standard deviation: 5 = 4.82% Au
placement of the basic absorption lines and absorptionedges for Ag, Pd and Au, as indicated in Figure 3,means that for alloys with high proportions of silverand palladium, the effects of enhancement of PdKcxand AuLcx by palladium and silver lines of the K seriesmay be observed. This may be direct enhancement of,for example AuLcx radiation by the more energetic
(00' Cold Bulletin 1998, 31(4) 123
Ij> Ik> Im, In - X-ray fluorescence radiation intensityof matrix elements J.k.m.n,'.C. - concentration of the analyte,CYij - absorption correction coefficient,f3ik - direct enhancement correction coefficient,'")'imn - indirect enhancement correction coefficient.
The cy,f3,'")' coefficients calculated using the leastsquares method and ensuring optimum correction ofmatrix for all the determined elements are given inTable 4.
As can be seen from Table 4, the absorption effectswere the dominant ones which needed to be corrected.It is necessary to take enhancement effects into accountonly for silver and gold - direct in both cases andindirect as well for gold.
It should be emphasized that empiricallydetermined matrix effect correction coefficients mayhave slightly different values depending on the type ofspectrometer used, the geometry of measurement, theX-ray tube, the excitation and X-ray spectrumregistration conditions applied and the standards andcorrection models (equations) available for a givensoftware. Other correction equations may also be usedbut the efficiency of correction for matrix effects shouldbe similar. The authors have therefore checked this with
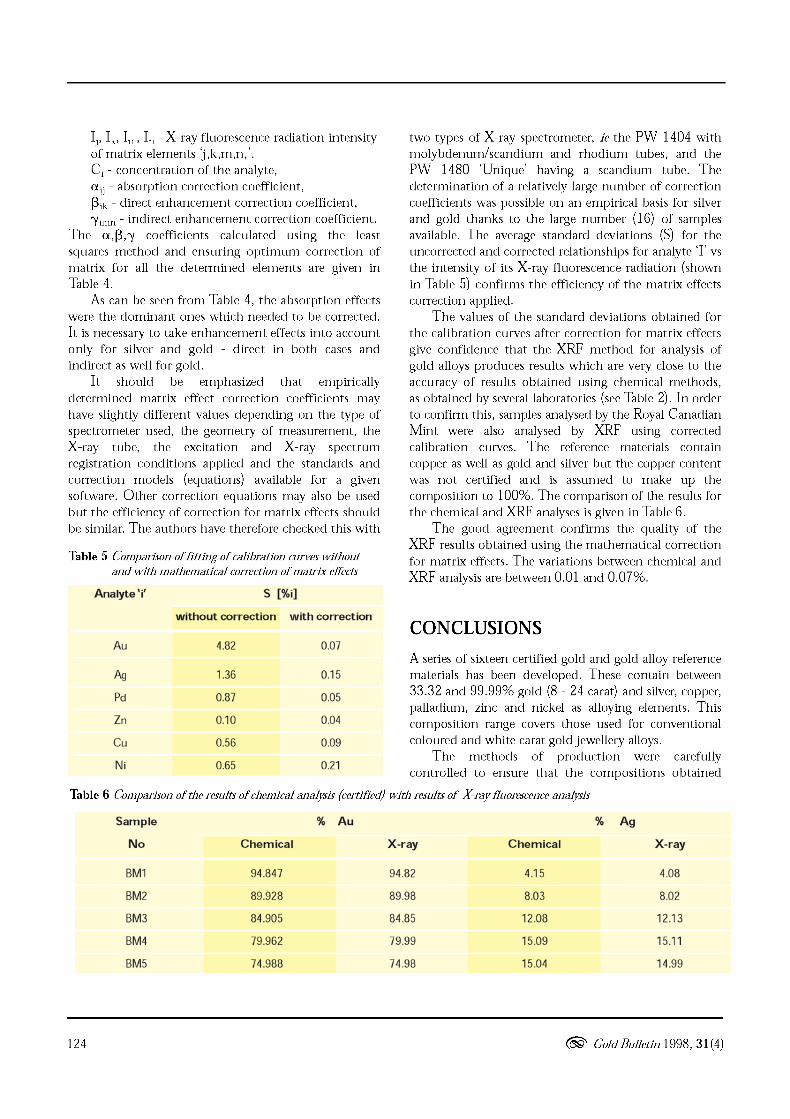
Table 5 Comparison off1tting ofcalibration curves withoutand with mathematical correction ofmatrix effects
two types of X-ray spectrometer, ie the PW 1404 withmolybdenum/scandium and rhodium tubes, and thePW 1480 'Unique' having a scandium tube. Thedetermination of a relatively large number of correctioncoefficients was possible on an empirical basis for silverand gold thanks to the large number (16) of samplesavailable. The average standard deviations (5) for theuncorrected and corrected relationships for analyte T vsthe intensity of its X-ray fluorescence radiation (shownin Table 5) confirms the efficiency of the matrix effectscorrection applied.
The values of the standard deviations obtained forthe calibration curves after correction for matrix effectsgive confidence that the XRF method for analysis ofgold alloys produces results which are very close to theaccuracy of results obtained using chemical methods,as obtained by several laboratories (see Table 2). In orderto confirm this, samples analysed by the Royal CanadianMint were also analysed by XRF using correctedcalibration curves. The reference materials containcopper as well as gold and silver but the copper contentwas not certified and is assumed to make up thecomposition to 100%. The comparison of the results forthe chemical and XRF analyses is given in Table 6.
The good agreement confirms the quality of theXRF results obtained using the mathematical correctionfor matrix effects. The variations between chemical andXRF analysis are between 0.01 and 0.07%.
Analyte 'i' S [%i]
without correction with correctionCONCLUSIONS
0.07
0.21
0.09
0.04
0.05
0.15
4.82
0.65
0.56
0.10
0.87
1.36
Ni
Zn
Au
Ag
Pd
Cu
A series of sixteen certified gold and gold alloy referencematerials has been developed. These contain between33.32 and 99.99% gold (8 - 24 carat) and silver, copper,palladium, zinc and nickel as alloying elements. Thiscomposition range covers those used for conventionalcoloured and white carat gold jewellery alloys.
The methods of production were carefullycontrolled to ensure that the compositions obtained
Table 6 Comparison ofthe results ofchemical analysis {certif1ed} with results of X-ray fluorescence analysis
Sample % Au % Ag
No Chemical X-ray Chemical X-ray
BMl 94.847 94.82 4.15 4.08
BM2 89.928 89.98 8.03 8.02
BM3 84.905 84.85 12.08 12.13
BM4 79.962 79.99 15.09 15.11
BM5 74.988 74.98 15.04 14.99
124 (00' Cold Bulletin 1998, 31(4)

accurately reflected those intended, with highhomogeneity for all components.
The XRF method developed, with mathematicalcorrection for matrix effects, enables the analysis ofvarious grades of gold alloys using analytical curves foreach element determined.
There were ten laboratories participating in thecertification process, which included the use of a widerange of analytical procedures and produced goodconvergence. The accuracy of determination for theprecious metals (gold, silver and palladium) was±0.002 - ±0.09%, and for the other elements (copper,zinc and nickel) ±0.01 - ±0.10%.
The accuracies obtained for each individual element,ie ±0.07% for Au in the range 33 - 100% Au, ±0.15%for Ag in the range 0 - 67% Ag, ±0.05% for Pd in therange 0 - 32% Pd, ±0.04% for Zn in the range 0 - 8%Zn, ±0.09% Cu in the range 0 - 24% Cu, and ±0.21 %Ni in the range 0 - 32% Ni, are in the ranges obtainedfor commonly applied chemical methods, but the timeused for XRF analysis can be very much shorter.
ACKNOWLEDGEMENTS
The authors express their gratitude to Mrs GiovannaValente of the Royal Canadian Mint for access to thegold bullion reference materials and valuable comments.
The reference materials are commercially availablefrom Mr janusz Luboinski, Polish State Mint,00-958, ul Pereca 21. Tel: +4822 656 4271;Fax: +4822 620 5522.
ABOUT THE AUTHORS
Wieslaw Stankiewicz received his MSc from AdarnMickiewicz University in Poznan in 1969 and a PhDin 1983 from the Silesian University in Katowice.
(00' Cold Bulletin 1998, 31(4)
Since 1969 he has been employed in the AnalyticalChemistry Department of the Institute of Non-FerrousMetals in Gliwice, Poland and has developed aspeciality in the use of XRF spectroscopy for thedetermination of elements, including the preciousmetals, in non-ferrous metallic materials. He has alsobeen involved in the development of referencematerials for XRF spectroscopy.
Barbara Bolibrzuch graduated from the Universityof Wroclaw (MSc) in 1979 and is now the opticalemission (OES) specialist in the same Department inGliwice. She has recently been involved in thedefinition of reference materials (in co-operation withNIST, USA) for non-ferrous metals and their alloys, aswell as in the development of OES methods for thedetermination of precious metals in various materials.
Milosz Marczak graduated from Warsaw TechnicalUniversity in 1983 and he is at present deputymanager of the Chemical Laboratory at the PolishState Mint in Warsaw. He has specialized in theanalysis of precious metals, including application ofOES and XRF methods. He has also been involved inthe preparation of precious metal calibration samplesfor use in various analytical techniques.
REFERENCES
'GoldReference MaterIals forAnalysls of GoldAlloys', Cold BuD, 1996,29, 74
G. Valente, 'FIne GoldReference MaterIals', Royal Canadian MInt, Ottawa, Aprlll8,
1993
3 G.Valente, 'GoldBullion Reference MaterIals', Royal Canadian MInt,Ottawa, January
6,1995
E. Morgan, 'Chemometrlcs: ExperImental Deslgn', JohnWlley and Sons, Chichester,
UK,1991
5 F. Claisse andM. Qulntln,Can. Spectrosc., 1967, 12, 129
6 WK dejongh. X-RaySpectrom., 1973, 2, 151
7 HJ Lucas-Tooth andE.C.Pyne, AdE X-RayAnal,1964, 7, 523
8 S.D.Rasberry andK,FJ HeInrlch, Anal Chem., 1974,46,81
125