Embed Size (px)
Citation preview
RESEARCH PAPER
Gold, silver, and palladium nanoparticle/nano-agglomerategeneration, collection, and characterization
Sunita R. Boddu • Veera R. Gutti •
Tushar K. Ghosh • Robert V. Tompson •
Sudarshan K. Loyalka
Received: 24 August 2010 / Accepted: 29 August 2011 / Published online: 18 September 2011
� Springer Science+Business Media B.V. 2011
Abstract Generation, collection, and characteriza-
tion of gold, silver, and palladium nanoparticles and
nano-agglomerates (collectively ‘‘nanoparticles’’)
have been explored. The nanoparticles were generated
with a spark aerosol generator (Palas GFG-1000).
They were collected using a deposition cell under
diffusion and thermophoresis. The shapes and sizes of
the deposited particles were measured using transmis-
sion electron microscopy (TEM). TEM images
showed that the particles were in the range of
8–100 nm in diameter, and their shapes varied from
nearly spherical to highly non-spherical. Thermopho-
resis enhanced the deposition of nanoparticles (over
the diffusive or the isothermal deposition) in all cases.
Further, the size distributions of the nanoparticles
generated in the gas phase (aerosol) were measured
using a scanning mobility particle sizer (SMPS 3080,
TSI) spectrometer. The SMPS results show that an
increase in the spark frequency of the generator shifted
the size distributions of the nanoparticles to larger
diameters, and the total particle mass production rate
increased linearly with increase in the spark fre-
quency. The computational fluid dynamics code
Fluent (Ansys) was used to model the flow in the
deposition cell, and the computed results conform to
the observations.
Keywords Nanoparticle � Nano-agglomerate �Spark generation � Deposition � Cancer treatment �Thermophoresis � Nanomedicine
Introduction
In recent years, noble metal nanoparticles and their
nano-sized agglomerates (collectively referred to as
nanoparticles or particles in the subsequent sections)
have been the subjects of much focused research due
to their unique electronic, optical, mechanical, mag-
netic, and chemical properties that can be significantly
different from those of bulk materials. To enhance
their use, it is important to understand the generation,
transport, deposition, and interaction of such particles.
For example, the diffusive transport of gold nanopar-
ticles in the design of therapeutic drugs for cancer
treatment, and elucidation of the transport and depo-
sition of particles in nuclear reactor containments and
reactor cores for very high temperature reactor designs
are two widely different applications with similar
nanoparticle related needs.
There has been considerable interest recently in the
synthesis and applications of gold (Cao 2004; Hsu
2004; Huang 2006; Frieboes et al. 2006; Kannan et al.
S. R. Boddu � V. R. Gutti � T. K. Ghosh �R. V. Tompson � S. K. Loyalka (&)
Nuclear Science & Engineering Institute and Particulate
Systems Research Center, University of Missouri,
E2433 Lafferre Hall, Columbia, MO 65211, USA
e-mail: [email protected]
123
J Nanopart Res (2011) 13:6591–6601
DOI 10.1007/s11051-011-0566-x
2006; Antonello and Bocci 2007; Pathak et al. 2007;
De Jong et al. 2008), silver (Bae et al. 2002; Kumar
et al. 2003; Zhang et al. 2004; Patel et al. 2005; Kim
et al. 2005; Chaudhari et al. 2007; Pal et al. 2007; Chen
and Gao 2007), and palladium (Jenson et al. 1980;
Ache et al. 1989; Ozawa et al. 2002; Giridhar et al.
2006) nanoparticles. Since a number of issues remain,
including control of sizes, shapes, and rates of
production, it is of interest to explore further their
generation and synthesis.
Our objective in this article is to report on the
exploration of the generation, collection, and charac-
terization of gold, silver, and palladium nanoparticles.
Aerosol generation by spark discharge method is of
special interest because it is continuous, clean, flexible
with respect to material, and scale-up is possible
(Evans et al. 2003; Lehtinen et al. 2004; Byeon et al.
2008; Tabrizi et al. 2009; Boddu et al. 2011). We used
a spark aerosol generator (GFG-1000, Palas) to
generate primary particles and a thermophoretic
deposition cell for sample collection. Transmission
electron microscopy (TEM) and scanning electron
microscopy (SEM) were used to characterize the
deposited particles. We also used a scanning mobility
particle sizer (SMPS) spectrometer to measure the
particle size distributions in the aerosol phase. The
computational fluid dynamics (CFD) code Fluent
(Ansys) was employed to compute the deposition
mass fractions of nanoparticles in the deposition cell
and to estimate the increase in particle deposition due
to thermophoresis. We obtained experimental data for
nanoparticle deposition at different spark frequencies
that conform to the results based on the CFD modeling
of the deposition efficiencies.
Experimental methods
Particle generation
The GFG-1000 spark aerosol generation system
(Palas) consists of two electrodes, made of material
of interest for generation of nanoparticles, separated
by a 1.8 mm gap. One of the electrodes was connected
to a high voltage (3,000 V) supply in parallel with a
capacitor (20 nF). Charge stored in the capacitor is
discharged at a set frequency which produces sparks
across the electrode gap. Each electric spark locally
evaporates the electrode material in the vicinity of the
spark. The evaporated material (atoms/ions) nucleates
to very fine primary particles in a controlled gaseous
flow, and grows further via agglomeration and
condensation. The particle production rate and sizes
depend on the spark frequency, and the size/shape
distributions are also affected by the gaseous environ-
ment and flow rate.
Particle collection
Nanoparticles have low inertia compared with larger
particles and have low diffusivities compared with
gaseous molecules. Thus, their collection by either
inertial impaction or diffusional deposition processes
alone is not very efficient. We have collected particles
on TEM grids in thermal gradients utilizing thermo-
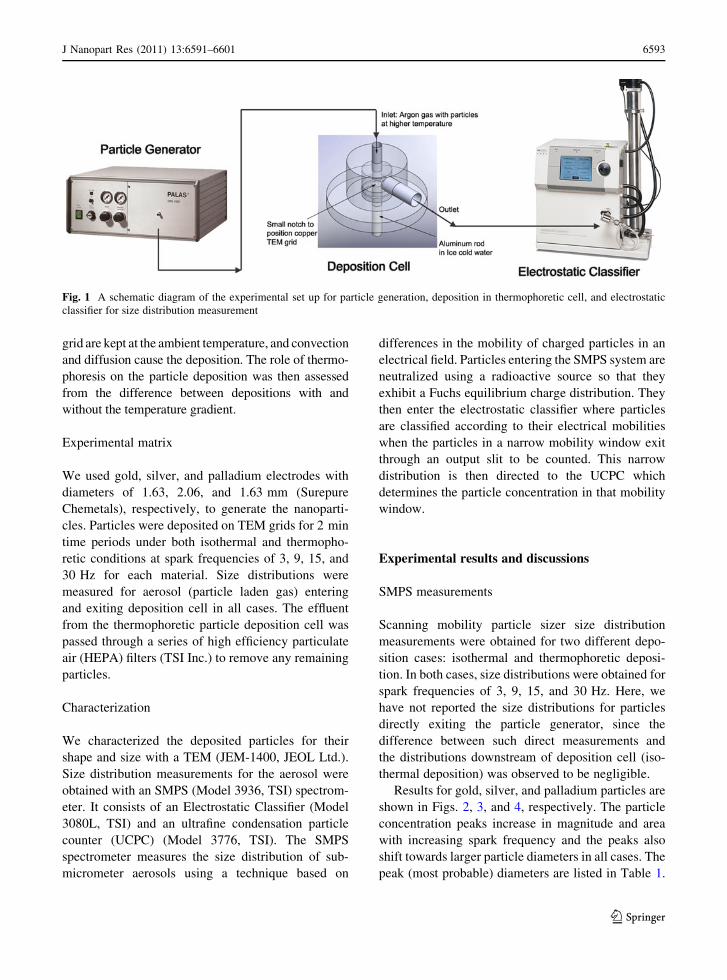
phoresis for particle deposition. A schematic diagram
of the experimental set up for particle generation and
subsequent deposition on TEM grids in a deposition
cell is shown in Fig. 1.
Argon gas exiting the particle generator is heated to
a temperature of 100 �C as it passes through a
cylindrical heating tube wrapped with a heating tape.
When the exiting argon gas is observed to have
reached a temperature of 100 �C, we initiate sparking
between the two electrodes and particle generation
begins. The particle/gas mixture then flows into the
thermophoretic deposition cell. A carbon-coated cop-
per TEM grid is placed on the notch shown in Fig. 1.
The aluminum rod on which the notch (for positioning
of a TEM grid) is located was cooled using an ice bath
which results in an initial temperature at the notch of
7 �C. This temperature rises steadily during the
particle collection interval to about 17 �C, depending
on the gas flow rate.
A 3-way valve is positioned at the inlet of the
thermophoretic deposition cell such that the heated
particle/gas mixture enters the valve and exits to either
the thermophoretic cell or to the atmosphere. This
allows the heated, particle laden argon flow to be
directed into the deposition cell as a step function, once
the steady-state particle generation, heating of the flow,
and cooling of the copper TEM grid are established.
Particle collection times were fixed at 2 min for all
experimental runs. The nanoparticles deposited on the
TEM grids were studied using TEM, SEM, and energy
dispersive X-ray spectroscopy (EDS). We deposited
particles in the deposition cell under isothermal condi-
tions as a control, i.e., when the argon gas and TEM
6592 J Nanopart Res (2011) 13:6591–6601
123
grid are kept at the ambient temperature, and convection
and diffusion cause the deposition. The role of thermo-
phoresis on the particle deposition was then assessed
from the difference between depositions with and
without the temperature gradient.
Experimental matrix
We used gold, silver, and palladium electrodes with
diameters of 1.63, 2.06, and 1.63 mm (Surepure
Chemetals), respectively, to generate the nanoparti-
cles. Particles were deposited on TEM grids for 2 min
time periods under both isothermal and thermopho-
retic conditions at spark frequencies of 3, 9, 15, and
30 Hz for each material. Size distributions were
measured for aerosol (particle laden gas) entering
and exiting deposition cell in all cases. The effluent
from the thermophoretic particle deposition cell was
passed through a series of high efficiency particulate
air (HEPA) filters (TSI Inc.) to remove any remaining
particles.
Characterization
We characterized the deposited particles for their
shape and size with a TEM (JEM-1400, JEOL Ltd.).
Size distribution measurements for the aerosol were
obtained with an SMPS (Model 3936, TSI) spectrom-
eter. It consists of an Electrostatic Classifier (Model
3080L, TSI) and an ultrafine condensation particle
counter (UCPC) (Model 3776, TSI). The SMPS
spectrometer measures the size distribution of sub-
micrometer aerosols using a technique based on
differences in the mobility of charged particles in an
electrical field. Particles entering the SMPS system are
neutralized using a radioactive source so that they
exhibit a Fuchs equilibrium charge distribution. They
then enter the electrostatic classifier where particles
are classified according to their electrical mobilities
when the particles in a narrow mobility window exit
through an output slit to be counted. This narrow
distribution is then directed to the UCPC which
determines the particle concentration in that mobility
window.
Experimental results and discussions
SMPS measurements
Scanning mobility particle sizer size distribution
measurements were obtained for two different depo-
sition cases: isothermal and thermophoretic deposi-
tion. In both cases, size distributions were obtained for
spark frequencies of 3, 9, 15, and 30 Hz. Here, we
have not reported the size distributions for particles
directly exiting the particle generator, since the
difference between such direct measurements and
the distributions downstream of deposition cell (iso-
thermal deposition) was observed to be negligible.
Results for gold, silver, and palladium particles are
shown in Figs. 2, 3, and 4, respectively. The particle
concentration peaks increase in magnitude and area
with increasing spark frequency and the peaks also
shift towards larger particle diameters in all cases. The
peak (most probable) diameters are listed in Table 1.
Fig. 1 A schematic diagram of the experimental set up for particle generation, deposition in thermophoretic cell, and electrostatic
classifier for size distribution measurement
J Nanopart Res (2011) 13:6591–6601 6593
123
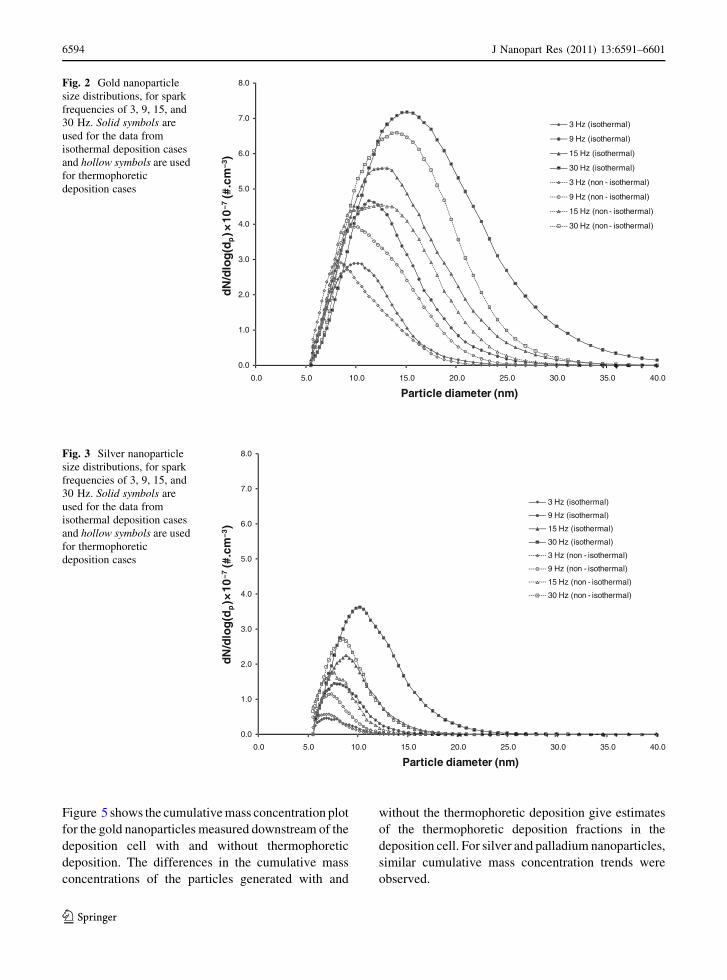
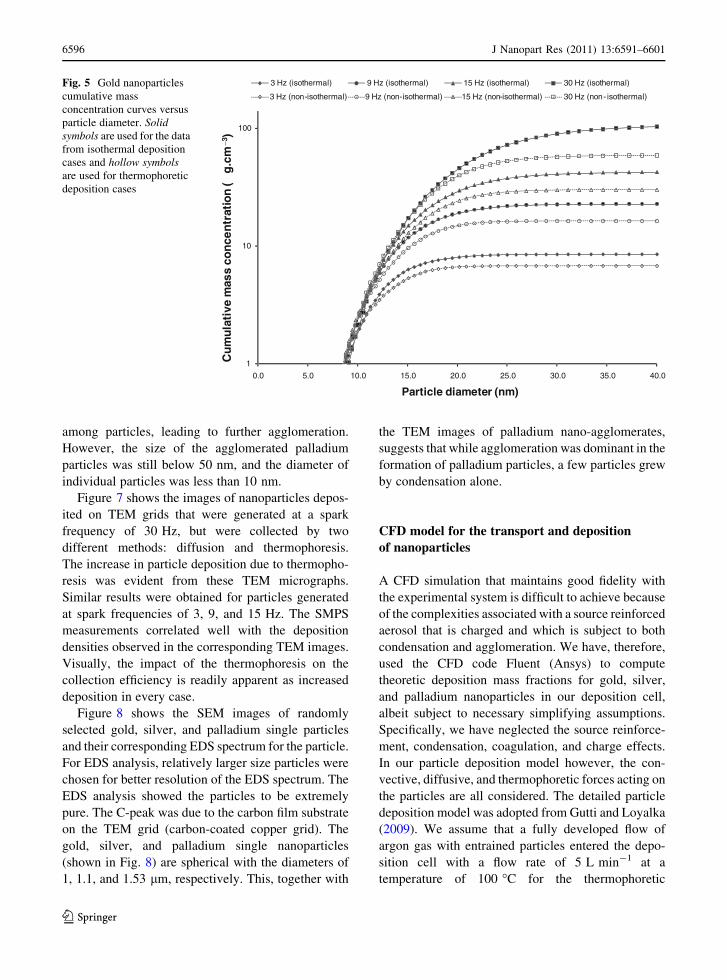
Figure 5 shows the cumulative mass concentration plot
for the gold nanoparticles measured downstream of the
deposition cell with and without thermophoretic
deposition. The differences in the cumulative mass
concentrations of the particles generated with and
without the thermophoretic deposition give estimates
of the thermophoretic deposition fractions in the
deposition cell. For silver and palladium nanoparticles,
similar cumulative mass concentration trends were
observed.
0.0
1.0
2.0
3.0
4.0
5.0
6.0
7.0
8.0
0.0 5.0 10.0 15.0 20.0 25.0 30.0 35.0 40.0
Particle diameter (nm)
3 Hz (isothermal)
9 Hz (isothermal)
15 Hz (isothermal)
30 Hz (isothermal)
3 Hz (non - isothermal)
9 Hz (non - isothermal)
15 Hz (non - isothermal)
30 Hz (non - isothermal)d
N/d
log
(dp) ×
10−7
(#.c
m−3
)
Fig. 2 Gold nanoparticle
size distributions, for spark
frequencies of 3, 9, 15, and
30 Hz. Solid symbols are
used for the data from
isothermal deposition cases
and hollow symbols are used
for thermophoretic
deposition cases
0.0
1.0
2.0
3.0
4.0
5.0
6.0
7.0
8.0
0.0 5.0 10.0 15.0 20.0 25.0 30.0 35.0 40.0
dN
/dlo
g(d
p) ×
10−7
(#.c
m−3
)
Particle diameter (nm)
3 Hz (isothermal)
9 Hz (isothermal)
15 Hz (isothermal)
30 Hz (isothermal)
3 Hz (non - isothermal)
9 Hz (non - isothermal)
15 Hz (non - isothermal)
30 Hz (non - isothermal)
Fig. 3 Silver nanoparticle
size distributions, for spark
frequencies of 3, 9, 15, and
30 Hz. Solid symbols are
used for the data from
isothermal deposition cases
and hollow symbols are used
for thermophoretic
deposition cases
6594 J Nanopart Res (2011) 13:6591–6601
123
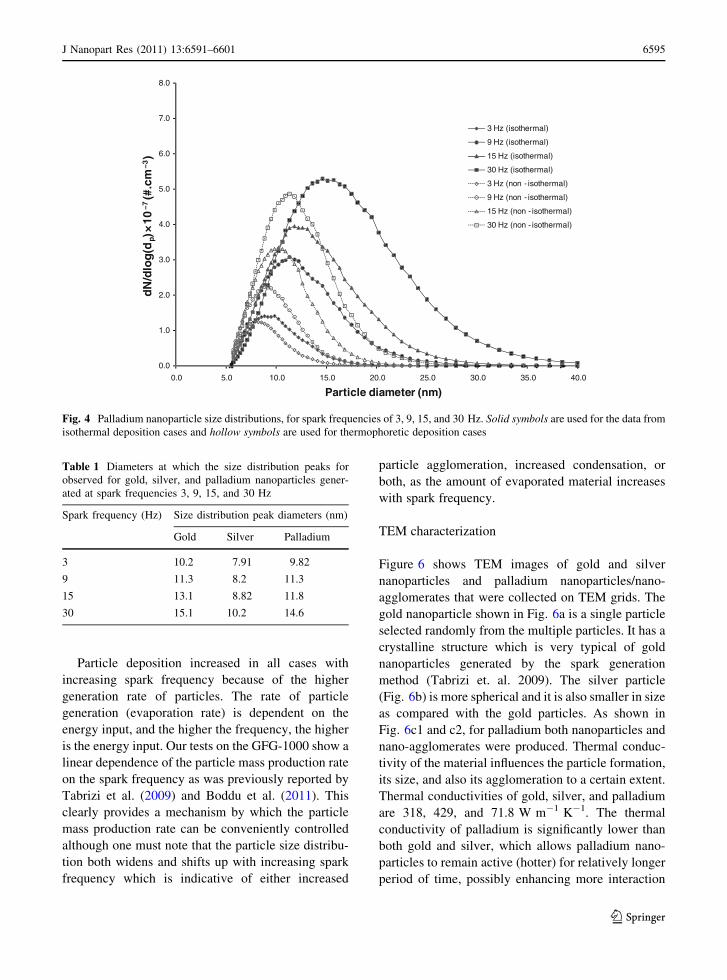
Particle deposition increased in all cases with
increasing spark frequency because of the higher
generation rate of particles. The rate of particle
generation (evaporation rate) is dependent on the
energy input, and the higher the frequency, the higher
is the energy input. Our tests on the GFG-1000 show a
linear dependence of the particle mass production rate
on the spark frequency as was previously reported by
Tabrizi et al. (2009) and Boddu et al. (2011). This
clearly provides a mechanism by which the particle
mass production rate can be conveniently controlled
although one must note that the particle size distribu-
tion both widens and shifts up with increasing spark
frequency which is indicative of either increased
particle agglomeration, increased condensation, or
both, as the amount of evaporated material increases
with spark frequency.
TEM characterization
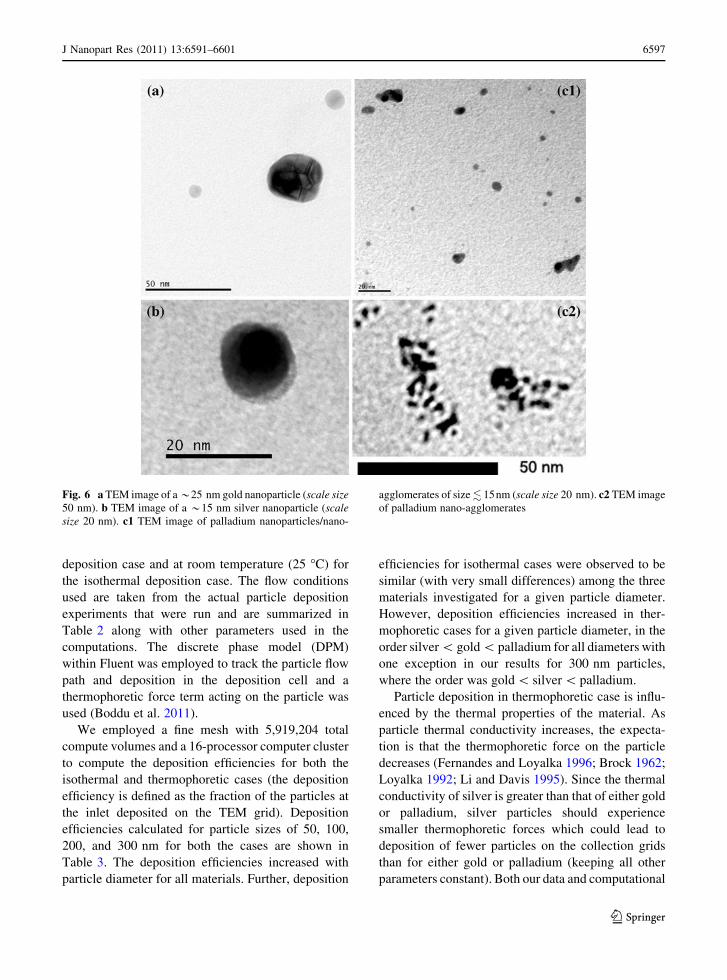
Figure 6 shows TEM images of gold and silver
nanoparticles and palladium nanoparticles/nano-
agglomerates that were collected on TEM grids. The
gold nanoparticle shown in Fig. 6a is a single particle
selected randomly from the multiple particles. It has a
crystalline structure which is very typical of gold
nanoparticles generated by the spark generation
method (Tabrizi et. al. 2009). The silver particle
(Fig. 6b) is more spherical and it is also smaller in size
as compared with the gold particles. As shown in
Fig. 6c1 and c2, for palladium both nanoparticles and
nano-agglomerates were produced. Thermal conduc-
tivity of the material influences the particle formation,
its size, and also its agglomeration to a certain extent.
Thermal conductivities of gold, silver, and palladium
are 318, 429, and 71.8 W m-1 K-1. The thermal
conductivity of palladium is significantly lower than
both gold and silver, which allows palladium nano-
particles to remain active (hotter) for relatively longer
period of time, possibly enhancing more interaction
0.0
1.0
2.0
3.0
4.0
5.0
6.0
7.0
8.0
0.0 5.0 10.0 15.0 20.0 25.0 30.0 35.0 40.0
dN
/dlo
g(d
p) ×
10−7
(#.c
m−3
)
Particle diameter (nm)
3 Hz (isothermal)
9 Hz (isothermal)
15 Hz (isothermal)
30 Hz (isothermal)
3 Hz (non - isothermal)
9 Hz (non - isothermal)
15 Hz (non - isothermal)
30 Hz (non - isothermal)
Fig. 4 Palladium nanoparticle size distributions, for spark frequencies of 3, 9, 15, and 30 Hz. Solid symbols are used for the data from
isothermal deposition cases and hollow symbols are used for thermophoretic deposition cases
Table 1 Diameters at which the size distribution peaks for
observed for gold, silver, and palladium nanoparticles gener-
ated at spark frequencies 3, 9, 15, and 30 Hz
Spark frequency (Hz) Size distribution peak diameters (nm)
Gold Silver Palladium
3 10.2 7.91 9.82
9 11.3 8.2 11.3
15 13.1 8.82 11.8
30 15.1 10.2 14.6
J Nanopart Res (2011) 13:6591–6601 6595
123
among particles, leading to further agglomeration.
However, the size of the agglomerated palladium
particles was still below 50 nm, and the diameter of
individual particles was less than 10 nm.
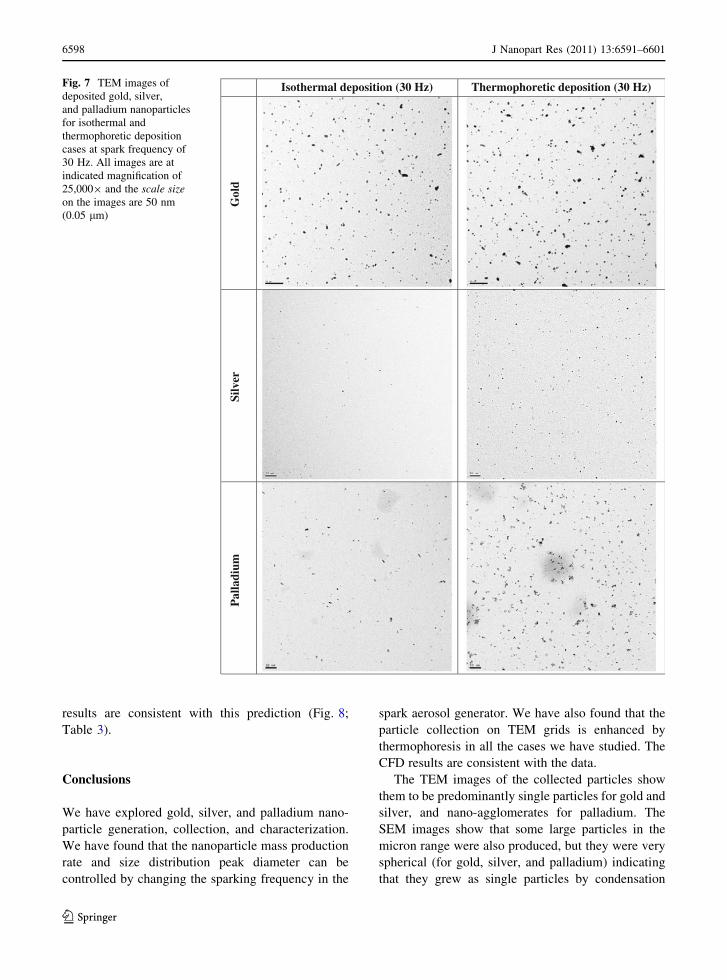
Figure 7 shows the images of nanoparticles depos-
ited on TEM grids that were generated at a spark
frequency of 30 Hz, but were collected by two
different methods: diffusion and thermophoresis.
The increase in particle deposition due to thermopho-
resis was evident from these TEM micrographs.
Similar results were obtained for particles generated
at spark frequencies of 3, 9, and 15 Hz. The SMPS
measurements correlated well with the deposition
densities observed in the corresponding TEM images.
Visually, the impact of the thermophoresis on the
collection efficiency is readily apparent as increased
deposition in every case.
Figure 8 shows the SEM images of randomly
selected gold, silver, and palladium single particles
and their corresponding EDS spectrum for the particle.
For EDS analysis, relatively larger size particles were
chosen for better resolution of the EDS spectrum. The
EDS analysis showed the particles to be extremely
pure. The C-peak was due to the carbon film substrate
on the TEM grid (carbon-coated copper grid). The
gold, silver, and palladium single nanoparticles
(shown in Fig. 8) are spherical with the diameters of
1, 1.1, and 1.53 lm, respectively. This, together with
the TEM images of palladium nano-agglomerates,
suggests that while agglomeration was dominant in the
formation of palladium particles, a few particles grew
by condensation alone.
CFD model for the transport and deposition
of nanoparticles
A CFD simulation that maintains good fidelity with
the experimental system is difficult to achieve because
of the complexities associated with a source reinforced
aerosol that is charged and which is subject to both
condensation and agglomeration. We have, therefore,
used the CFD code Fluent (Ansys) to compute
theoretic deposition mass fractions for gold, silver,
and palladium nanoparticles in our deposition cell,
albeit subject to necessary simplifying assumptions.
Specifically, we have neglected the source reinforce-
ment, condensation, coagulation, and charge effects.
In our particle deposition model however, the con-
vective, diffusive, and thermophoretic forces acting on
the particles are all considered. The detailed particle
deposition model was adopted from Gutti and Loyalka
(2009). We assume that a fully developed flow of
argon gas with entrained particles entered the depo-
sition cell with a flow rate of 5 L min-1 at a
temperature of 100 �C for the thermophoretic
1
10
100
0.0 5.0 10.0 15.0 20.0 25.0 30.0 35.0 40.0
Cu
mu
lati
ve m
ass
con
cen
trat
ion
(µg
.cm
−3)
Particle diameter (nm)
3 Hz (isothermal) 9 Hz (isothermal) 15 Hz (isothermal) 30 Hz (isothermal)
3 Hz (non-isothermal) 9 Hz (non-isothermal) 15 Hz (non-isothermal) 30 Hz (non- isothermal)
Fig. 5 Gold nanoparticles
cumulative mass
concentration curves versus
particle diameter. Solidsymbols are used for the data
from isothermal deposition
cases and hollow symbolsare used for thermophoretic
deposition cases
6596 J Nanopart Res (2011) 13:6591–6601
123
deposition case and at room temperature (25 �C) for
the isothermal deposition case. The flow conditions
used are taken from the actual particle deposition
experiments that were run and are summarized in
Table 2 along with other parameters used in the
computations. The discrete phase model (DPM)
within Fluent was employed to track the particle flow
path and deposition in the deposition cell and a
thermophoretic force term acting on the particle was
used (Boddu et al. 2011).
We employed a fine mesh with 5,919,204 total
compute volumes and a 16-processor computer cluster
to compute the deposition efficiencies for both the
isothermal and thermophoretic cases (the deposition
efficiency is defined as the fraction of the particles at
the inlet deposited on the TEM grid). Deposition
efficiencies calculated for particle sizes of 50, 100,
200, and 300 nm for both the cases are shown in
Table 3. The deposition efficiencies increased with
particle diameter for all materials. Further, deposition
efficiencies for isothermal cases were observed to be
similar (with very small differences) among the three
materials investigated for a given particle diameter.
However, deposition efficiencies increased in ther-
mophoretic cases for a given particle diameter, in the
order silver \ gold \ palladium for all diameters with
one exception in our results for 300 nm particles,
where the order was gold \ silver \ palladium.
Particle deposition in thermophoretic case is influ-
enced by the thermal properties of the material. As
particle thermal conductivity increases, the expecta-
tion is that the thermophoretic force on the particle
decreases (Fernandes and Loyalka 1996; Brock 1962;
Loyalka 1992; Li and Davis 1995). Since the thermal
conductivity of silver is greater than that of either gold
or palladium, silver particles should experience
smaller thermophoretic forces which could lead to
deposition of fewer particles on the collection grids
than for either gold or palladium (keeping all other
parameters constant). Both our data and computational
Fig. 6 a TEM image of a *25 nm gold nanoparticle (scale size50 nm). b TEM image of a *15 nm silver nanoparticle (scalesize 20 nm). c1 TEM image of palladium nanoparticles/nano-
agglomerates of size. 15nm (scale size 20 nm). c2 TEM image
of palladium nano-agglomerates
J Nanopart Res (2011) 13:6591–6601 6597
123
results are consistent with this prediction (Fig. 8;
Table 3).
Conclusions
We have explored gold, silver, and palladium nano-
particle generation, collection, and characterization.
We have found that the nanoparticle mass production
rate and size distribution peak diameter can be
controlled by changing the sparking frequency in the
spark aerosol generator. We have also found that the
particle collection on TEM grids is enhanced by
thermophoresis in all the cases we have studied. The
CFD results are consistent with the data.
The TEM images of the collected particles show
them to be predominantly single particles for gold and
silver, and nano-agglomerates for palladium. The
SEM images show that some large particles in the
micron range were also produced, but they were very
spherical (for gold, silver, and palladium) indicating
that they grew as single particles by condensation
Isothermal deposition (30 Hz) Thermophoretic deposition (30 Hz)
Gol
dSi
lver
Pal
ladi
um
Fig. 7 TEM images of
deposited gold, silver,
and palladium nanoparticles
for isothermal and
thermophoretic deposition
cases at spark frequency of
30 Hz. All images are at
indicated magnification of
25,0009 and the scale sizeon the images are 50 nm
(0.05 lm)
6598 J Nanopart Res (2011) 13:6591–6601
123
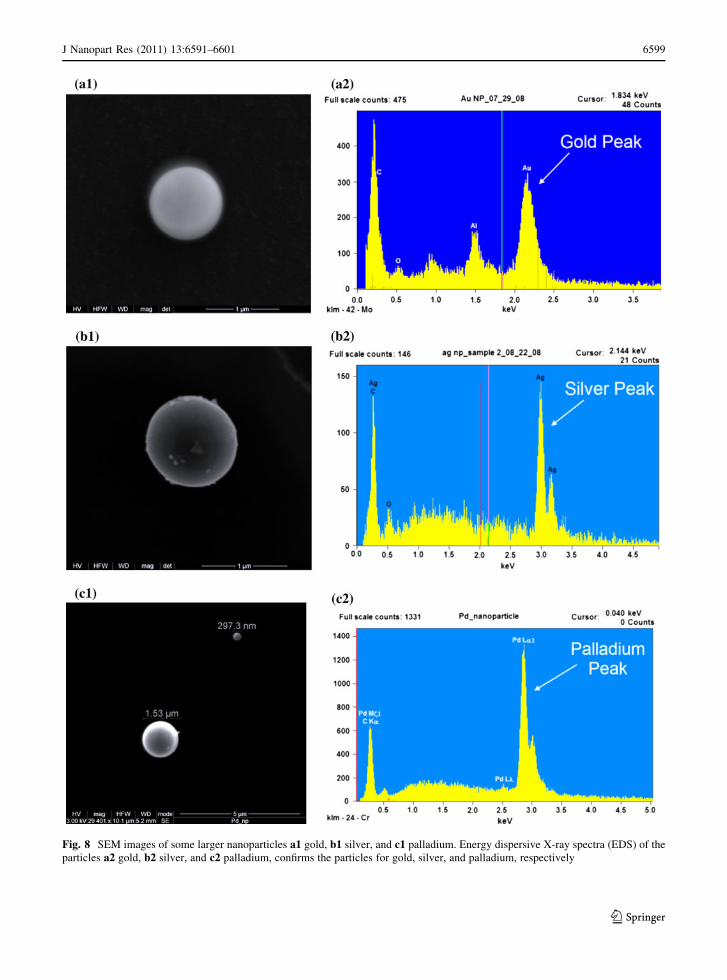
Fig. 8 SEM images of some larger nanoparticles a1 gold, b1 silver, and c1 palladium. Energy dispersive X-ray spectra (EDS) of the
particles a2 gold, b2 silver, and c2 palladium, confirms the particles for gold, silver, and palladium, respectively
J Nanopart Res (2011) 13:6591–6601 6599
123
alone. This holds the possibility that by optimally
controlling the argon flow rate and the spark fre-
quency, one could control both the agglomeration and
the condensational growth, and produce particles in a
narrow and well defined range.
We note that the basic concepts employed in this
study for the collection of samples and for the
computational analysis of the particle deposition can
also be used to study the fundamental transport and
deposition properties of many other different particles,
including those with complex shapes, or incorporating
radioactivity, or charge on many different types of
surfaces. For example, radioactive gold nanoparticles
could be used for the study of the influence of
radioactivity on particle deposition and/or growth by
condensation and agglomeration.
Acknowledgments This research has been supported by the
following grants from the Department of Energy: Nuclear
Energy Research Initiative (NERI-C; Grant # DE-FG07-
07ID14892), Innovations in Nuclear Education and
Infrastructure (INIE; Grant # DE-FG07-03ID14531), and
Global Nuclear Energy Partnership (GNEP; grant DE-FG07-
07ID14851).
References
Ache HJ, Baetsle LH, Bust RP, Nechaev AF, Popik VP, Ying Y
(1989) Feasibility of separation and utilization of ruthe-
nium, rhodium and palladium from high level waste.
IAEA, technical report series No. 308, Vienna
Antonello DP, Bocci G (2007) Drug distribution in tumors:
mechanisms, role in drug resistance, and methods for
modification. Curr Onco Rep 9:109–114
Bae CH, Nam SH, Park SM (2002) Formation of silver nano-
particles by laser ablation of a silver target in NaCl solu-
tion. Appl Surf Sci 197–198:628–634
Boddu S, Gutti VR, Meyer RM, Tompson RV, Loyalka SK
(2011) Carbon nanoparticle generation, collection, and
characterization using a spark generator and a thermoph-
oretic deposition cell. Nucl Technol (in publication)
Brock JR (1962) On the theory of thermal forces acting on
aerosol particles. J Colloid Sci 17(8):768–780
Byeon JH, Park JH, Hwang J (2008) Spark generation of
monometallic and bimetallic aerosol nanoparticles. J Aer-
osol Sci 39:888–896
Cao G (2004) Nanostructures and nanomaterials: synthesis,
properties, and applications. Imperial College Press,
London
Chaudhari VR, Harama SK, Kulshreshtha SK, Bellare JR,
Hassan PA (2007) Synthesis of silver nanoparticles by
chemical reduction method and their antibacterial activity.
Colloids Surf A Physicochem Eng Asp 301:475–480
Chen Z, Gao L (2007) A facile and novel way for the synthesis
of nearly monodisperse silver nanoparticles. Mater Res
Bull 42:1657–1661
De Jong WH, Hagens WI, Krystek P, Burger MC, Sips AJAM,
Geertsma RE (2008) Particle size-dependent organ distri-
bution of gold nanoparticles after intravenous administra-
tion. Biomaterials 29:1912–1919
Evans DE, Harrison RM, Ayres JG (2003) The generation and
characterization of metallic and mixed element aerosols for
human challenge studies. Aerosol Sci Technol 37:975–987
Fernandes A, Loyalka SK (1996) Modeling of thermophoretic
aerosol deposition in nuclear reactor containments. Nucl
Technol 116(3):270–282
Frieboes HB, Sinek JP, Nalcioglu O, Fruehauf JP, Cristini V
(2006) Nanotechnology in cancer drug therapy: a bio-
computational approach. In: BioMEMS and Biomedical
Nanotechnology, Vol 1. Springer, New York
Giridhar P, Venkatesan KA, Reddy BP, Srinivasan TG, Rao
PRV (2006) Recovery of fission palladium by electrode-
position using room temperature ionic liquids. Radiochim
Acta 94:131–136
Gutti VR, Loyalka SK (2009) Thermophoretic deposition in a
cylindrical tube: computations and comparison with
experiments. Nucl Technol 166(2):121–133
Hsu H (2004) Photochemical synthesis of gold nanoparticles
with interesting shapes. NNIN REU Research accomplish-
ments:68–69
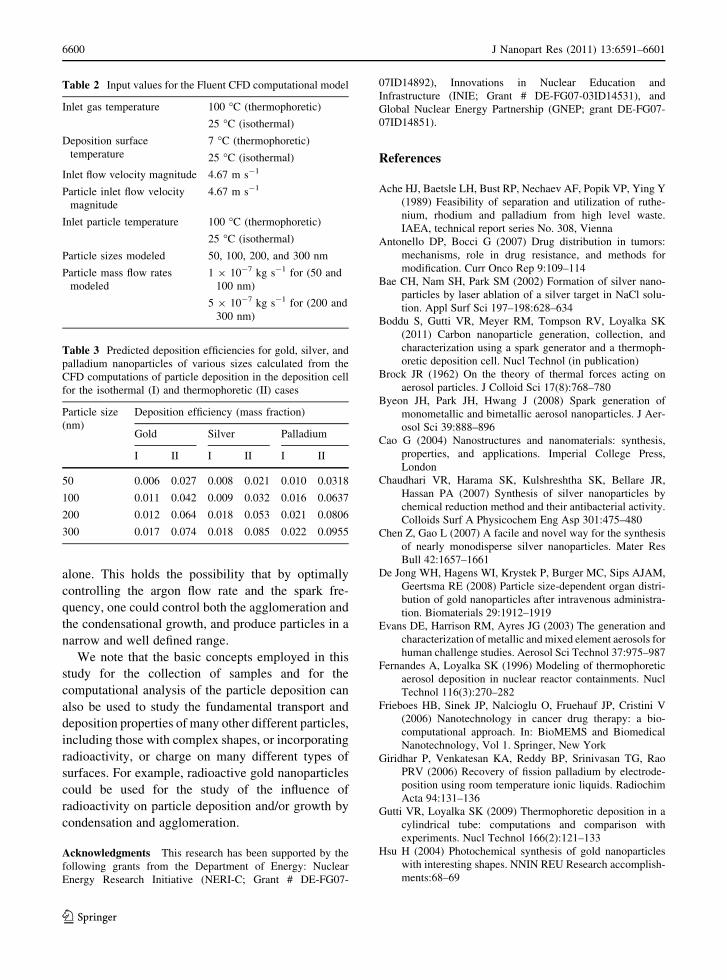
Table 2 Input values for the Fluent CFD computational model
Inlet gas temperature 100 �C (thermophoretic)
25 �C (isothermal)
Deposition surface
temperature
7 �C (thermophoretic)
25 �C (isothermal)
Inlet flow velocity magnitude 4.67 m s-1
Particle inlet flow velocity
magnitude
4.67 m s-1
Inlet particle temperature 100 �C (thermophoretic)
25 �C (isothermal)
Particle sizes modeled 50, 100, 200, and 300 nm
Particle mass flow rates
modeled
1 9 10-7 kg s-1 for (50 and
100 nm)
5 9 10-7 kg s-1 for (200 and
300 nm)
Table 3 Predicted deposition efficiencies for gold, silver, and
palladium nanoparticles of various sizes calculated from the
CFD computations of particle deposition in the deposition cell
for the isothermal (I) and thermophoretic (II) cases
Particle size
(nm)
Deposition efficiency (mass fraction)
Gold Silver Palladium
I II I II I II
50 0.006 0.027 0.008 0.021 0.010 0.0318
100 0.011 0.042 0.009 0.032 0.016 0.0637
200 0.012 0.064 0.018 0.053 0.021 0.0806
300 0.017 0.074 0.018 0.085 0.022 0.0955
6600 J Nanopart Res (2011) 13:6591–6601
123
Huang X (2006) Gold nanoparticles used in cancer cell diag-
nostics, selective photothermal therapy and catalysis of
NADH oxidation reaction. Dissertation, Georgia Institute
of Technology, Atlanta
Jenson GA, Rohmann CA, Perrigo LD (1980) Recovery and use
of fission product noble metals. Transactions ANS 34:
335–336
Kannan R, Rahing V, Cutler C, Pandrapragada R, Katti KK,
Kattumuri V, Robertson JD, Casteel SJ, Jurisson S, Smith
C, Boote E, Katti KV (2006) Nanocompatible chemistry
toward fabrication of target-specific gold nanoparticles.
J Am Chem Soc 128:11342–11343
Kim YH, Lee DK, Kang YS (2005) Synthesis and character-
ization of Ag and Ag-SiO2 nanoparticles. Colloids Surf A
Physicochem Eng Asp 257–258:273–276
Kumar A, Joshi H, Pasricha R, Mandale AB, Sastry M (2003)
Phase transfer of silver nanoparticles from aqueous to
organic solutions using fatty amine molecules. J Colloid
Interface Sci 264:396–401
Lehtinen KEJ, Backman U, Jokiniemi JK, Kulmala M (2004)
Three-body collisions as a particle formation mechanism in
silver nanoparticle synthesis. J Colloid Interface Sci 274:
526–530
Li W, Davis EJ (1995) The effects of gas and particle properties
on thermophoresis. J Aerosol Sci 26:1085–1099
Loyalka SK (1992) Thermophoretic force on a single particle-I.
Numerical solution of the linearized Boltzmann equation.
J Aerosol Sci 23(3):291
Ozawa M, Shinoda Y, Sano Y (2002) The separation of fission
product rare elements toward bridging the nuclear and soft
energy systems. Prog Nucl Energ 40:527–538
Pal A, Shah S, Devi S (2007) Synthesis of Au, Ag and Au-Ag
alloy nanoparticles in aqueous polymer solution. Colloids
Surf A Physicochem Eng Asp 302:51–57
Patel K, Kapoor S, Dave DP, Mukherjee T (2005) Synthesis of
Pt, Pd, Pt/Ag and Pd/Ag nanoparticles by microwave-
polyol method. J Chem Sci 117(4):311–315
Pathak P, Katiyar VK, Giri S (2007) Cancer research-nanopar-
ticles, nanobiosensors and their use in cancer research.
J Nanotechnol. doi: 10.2240/azojono0116
Tabrizi NS, Ullmann M, Vons VA, Lafont U, Schmidt-Ott A
(2009) Generation of nanoparticles by spark discharge.
J Nanopart Res 11:315–332
Zhang JP, Chen P, Sun CH, Hu X (2004) Sonochemical syn-
thesis of colloidal silver catalysts for reduction of com-
plexing silver in DTR system. Appl Catal A 266:49–54
J Nanopart Res (2011) 13:6591–6601 6601
123