Embed Size (px)
Citation preview

1 | P a g e
Golden Investment Forums Task Force Report to City Council June , 2018
2 | P a g e
Special Thanks to Task Force Members: Jordan Beezley, Don Cameron, Deborah Deal, Kevin Fletcher, Hannah Fritz, Bill Litz, Bill McKee, Mathew Murphy, Hassan Najjar, Bryan Oldham, Erik Petersen, Cynthia Szymanski, Jen Thoemke, Bethany Thomas, Jen Trout, Meg Van Ness, Waylon Wouters.
3 | P a g e
Project Background: We who call Golden home, whether by place of residence, or by employment, or in spirit, are in a unique situation in Colorado. Through clarity of purpose and community supported decisions, the City’s ability to maintain our high quality infrastructure and to provide a very high level of service is well established and currently seems in little danger from adverse unforeseen events. The question, then, is whether we are achieving the community we strive for, or is there more to accomplish? Are we committed enough to the Golden Vision 2030 principles and community values that we will commit additional time, talent, and resources toward achieving our community goals? The Golden City Council has posed these questions to the community. In 2017, City Council more specifically directed that an effort be undertaken to assess community awareness and support for the investment recommendations embedded in Golden Vision 2030 and the associated community and neighborhood plans that would likely require tens of millions of dollars above currently projected resources to implement. City Council asked Goldenites to join together to review some of the types of community amenities, enhancements, and improvements proposed in recent years to see if there is true community support to seek to realize some or all of these enhancements. To facilitate this community discussion, City Council established a Task Force in fall 2017 to help guide a community conversation about possible increased investment in infrastructure and amenities for Golden. Council had decided that a broad, diverse citizen task force will help guide the effort and help Council determine if there is a desire to fund additional investments and how to prioritize such opportunities. The establishment of a citizen task force up front was recommended for a number of reasons:
• A broad based group with varied interests will assure that the project is approached from a community wide perspective that considers all view points;
• It is important that the Golden Investment Forum discussions are truly seen as responding to community desires, and not the desires of staff or Council;
• Such a group can partner with City Council through all phases of the discussion, and potentially play an independent role if Council does decide to pursue a revenue measure.
The Task Force began meeting in late 2017, and has met monthly since. The Task Force efforts can be summarized according to the following goals:
• Develop and implement an effective community engagement program to discuss what the Task Force has come to term “discretionary infrastructure and amenity” investments. The specific goal of the intended engagement program was to answer the below two questions:
What are the community’s priorities for addressing community opportunities and challenges? To what degree is the community willing to invest in identified opportunities and challenges with additional revenue-generating measures?

4 | P a g e
• Utilizing the information collected in the community engagement program and the background knowledge available to task force members, the Task Force would identify general trends and community priorities, and formulate recommendations to City Council.
Task Force Activities to Date: Over the course of December 2017, through May 2018, the Task Force spent time understanding their charge from City Council, and developing and implementing the community engagement program. The early activities and results included the following:
• The Golden Investment Forum was one of the earliest projects featured on GuidingGolden.com. Through this introduction the project started to become more familiar to the community. The GuidingGolden.com Investment Forum page has an extensive document library of community plans, a forum section that has been used with modest success, and until early March it had a survey where respondents could rank several categories of “discretionary infrastructure and amenity” investments.
• Through January and February, the Task Force evaluated two main engagement approaches to be utilized in concert. The main effort was always planned to be an extensive stakeholder outreach, including both in-person outreach to identified community groups, and promotion of input opportunities through hard copy and digital information. The second engagement method initially considered was a series of open house type meetings where attendees could discuss some of the identified projects and project categories, and provide direct input. One such open house meeting occurred on March 14th 2018, with minimal community attendance. Following that meeting, the Task Force decided to focus primarily on stakeholder outreach for this initial phase of the project, intended to culminate in this report to City Council. Future activities may include any range of engagement activities.
• Before the March 14th Open House, a new survey was implemented using the “Balancing Act” web platform whereby respondents would be given a budget of $15 million in discretionary resources for the period from 2021 to 2030 (which relates to the period when the City will experience a drop in debt service in the Sales and Use Tax capital fund), and asked to identify high priority investments in 9 project categories. The survey responses were required to result in a balanced budget, so if a respondent wished to fund projects in excess of the $15 million over the ten year period, they would be required to authorize an increase in tax revenue in the form of either sales tax, a lodging tax, or property tax. This survey was active from about March 10th thru April 5th, and generated approximately 70 responses.
• Following the March 14th event, the Task Force directed that a few changes be made to the survey to simplify user experience, which resulted in a new version of the survey being launched on April 6th, 2018. In addition to refinements in project descriptions, this version includes the option to raise revenue by allowing a limited number of recreational marijuana outlets in Golden. This survey is the primary data source for the Task Force discussions. As of June 4th, there have been approximately 340 survey responses submitted. While the survey is still active, the data set for Task Force use in preparing this report required a cut-off date.

5 | P a g e
• Also following the March 14th event, the Task Force determined that, for this initial phase of input, and report out to Council, no additional open house events would be scheduled, and the effort would focus solely on outreach to stakeholders and the general public. A brief listing of stakeholder groups or events contacted include:
o City boards and commissions o State of the City lunch o Golden United o Golden Civic Foundation o Visitor Center Board o Chamber EDC Committee o Downtown Merchants meeting o Leadership Golden o May 10th Volunteer event o Optimists Club o Non-profit Directors round table o Post cards were handed out at a May 17th housing discussion at Foothills Art Center o Post cards were handed out at an early May neighborhood fair at the Golden Terrace
Communities. o The survey information was rebroadcast by local groups to expand the reach.
• Finally, the Task Force developed a simple one page forced ranking of the nine investment categories to be used in group settings, while encouraging completion of the more detailed survey. To date, approximately 35 of these surveys have been completed.
Initial Indications and Trends: Throughout this initial phase of the Golden Investment Forum project, the Task Force began to identify some early indications and trends. Some of these indications included:
• With some exceptions, the project recommendations and ideas identified in Golden Vision and more specialized plans are by nature not well defined or specific. Examples of lesser defined project areas include open space preservation (where listing of specific private properties can be problematic), and the ideas of investing in affordable housing, solar energy for city buildings, or general park and trail improvements. There are some potential projects with quite specific descriptions, but they are often still conceptual. It was also noted that there is not a strong sense that the community as a whole is familiar with many of the potential investment projects.
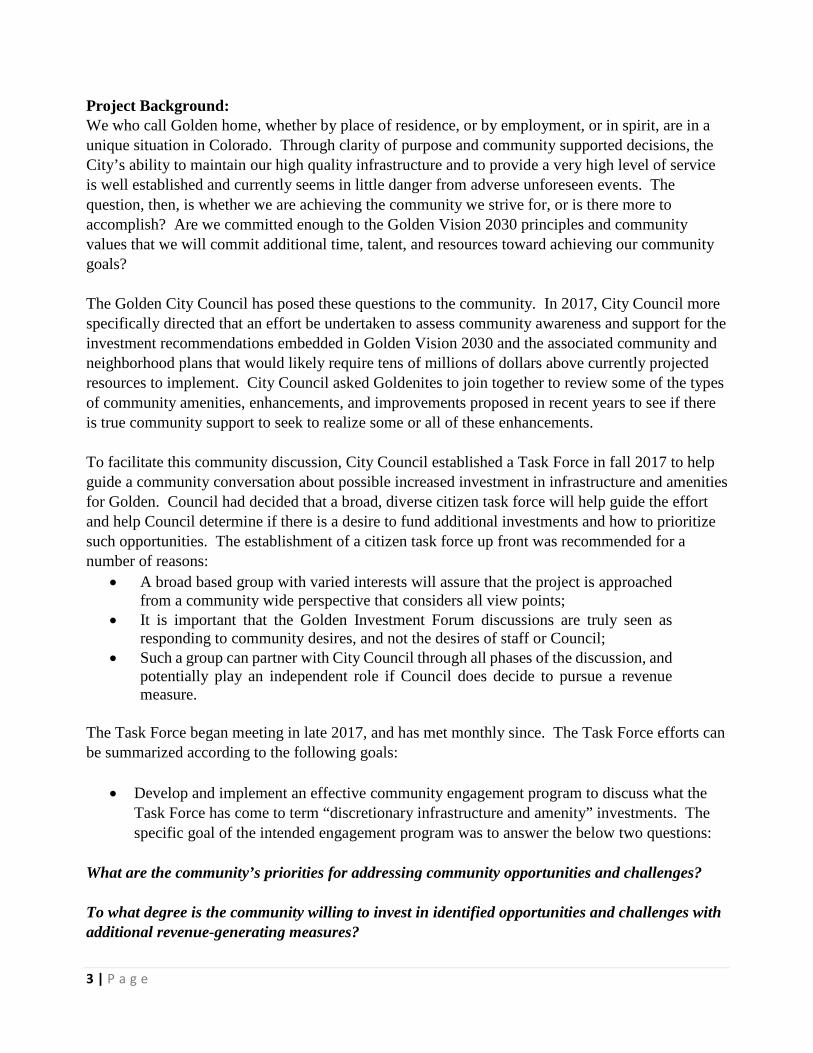
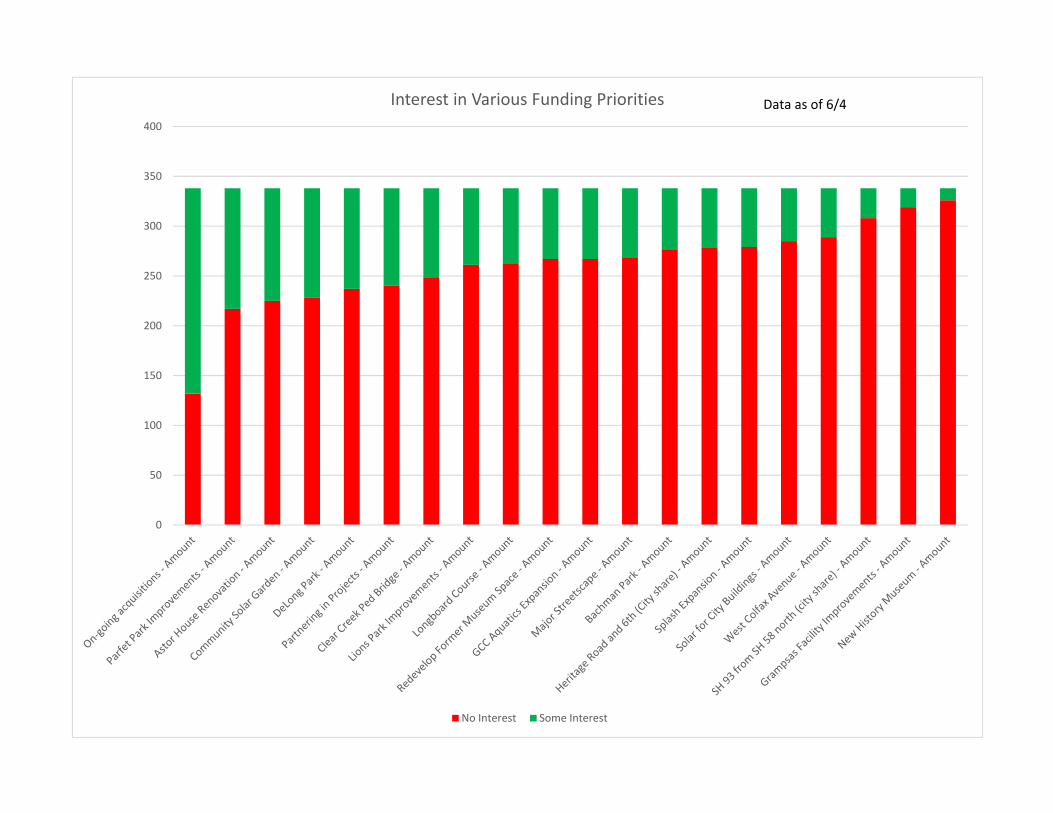
• As noted below in the section describing the input data received, most potential investment projects have some level of support, but few have a large embedded support level, and to date, only “On-going Open Space Acquisitions” has support by a majority of survey respondents. It is interesting to speculate as to this level of support. Given that there is not a ready list of targeted properties for acquisition, this strong support may be related in part to
6 | P a g e
the general negative reaction to change and growth and development throughout the Front Range and the entire state.
• Upon further consideration, it should not be considered unusual that specific project support for most projects is not currently overwhelming, as people’s priorities vary. Rather, it may make sense to simply consider prioritization as a scale of community support, with staff, various boards, and Council evaluating when it is appropriate to pursue lower ranked projects (or not).
• Staff also has raised a concern that the sheer cost of some projects listed in the Balancing Act survey may have tended to lower the survey respondent support for that project since it is difficult to support high cost projects in the survey exercise, unless one also includes a revenue measure increase of some level. The two projects that consistently garnered the least support – Tony Grampsas Park improvements and a new history museum fall within the category of expensive enough to use most of the anticipated discretionary revenues in the exercise.
• It was not surprising that, with the level of information widely known in the community, there is not a demonstrated groundswell of support for a ballot measure for a revenue question. It is also not surprising that, of traditional taxes, a property tax increase ranked lowest, followed by a sales tax increase, and the most support was expressed for a lodging tax of a moderate level (3 – 5%). In the survey released on April 6th, (the one with the vast majority of responses) there was little support for enacting a program to license and tax recreational marijuana sales in the community.
• While the detailed “Balancing Act” survey has by far the most responses, it is interesting to note that responses to the one page forced ranking exercise of project categories do not mirror the detailed survey. Recognizing that the detailed survey is more related to additional “discretionary” capital investments, it may not be surprising that general priorities may be slightly different than the willingness to fund specific projects.
Review of Detailed Data: The Task Force is pleased to have collected a large number of responses to our various efforts to engage the community. While not necessarily completely clear or consistent, the data presented in the appendices attached hereto should provide sufficient information for City Council to consider policy direction and next steps. The specific detailed data available to the Task Force and Council include the following:
• Appendix A details the vast majority of survey responses regarding support for individual projects and revenue measures. This Balancing Act survey has approximately 340 responses, and clearly details the projects with the most support and the fairly lukewarm support for a ballot revenue question at this time.

7 | P a g e
• Appendix B details the responses to the initial Balancing Act survey, available from mid March to early April. There were approximately 70 completed responses to this survey which was very similar to the later version.
• Appendix C reflects the information from the initial Guiding Golden survey that asked respondents to rank several investment project categories on a scale from “Not at all important” thru “Not very important”, “Very important” and “Essential”. This survey exercise had the least response rate (34 completed) and showed a consistent trend that is similar in some ways to the below forced ranking.
• Appendix D contains data from the one page forced ranking exercise utilized in April and May at group events. The raw data from this exercise showed incredible diversity of opinion, such that a simple averaging of the responses did not generate meaningful direction. Rather the data in the appendix is presented in two graphs. The first graph shows which project categories had the most “high priority” rankings (defined as “1”, “2”, or “3”). The second graph lists the number of times a project category was ranked as low priority (defined as “7”,”8”, or “9”). One simple difficulty with this sampling is evidenced by the fact that neighborhood parks which had the least amount of highest priority votes also had the least number of lowest priority votes. Other project types also varied greatly in this ranking.
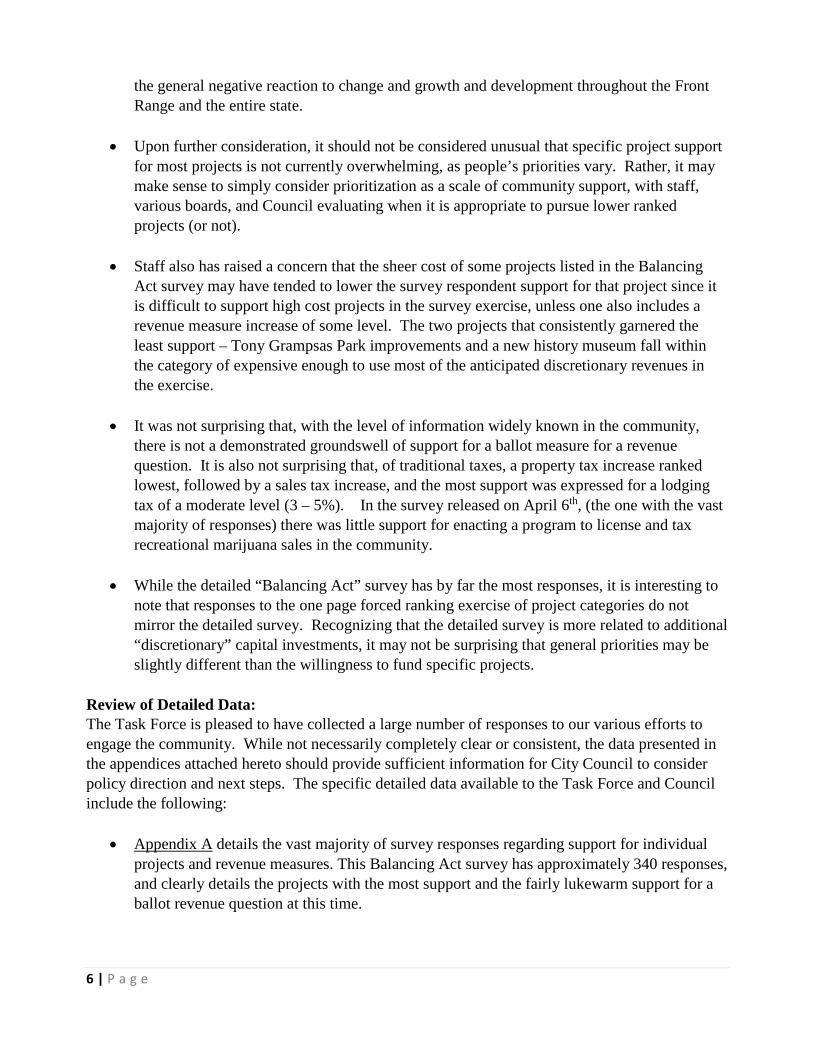
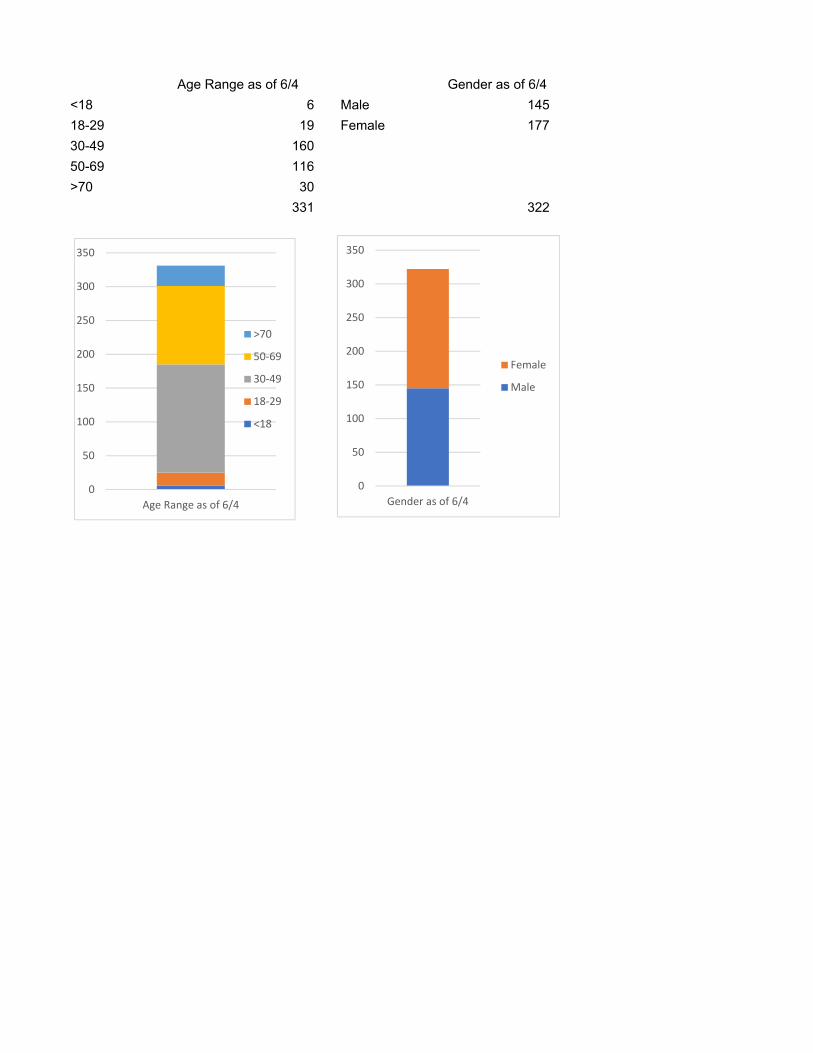
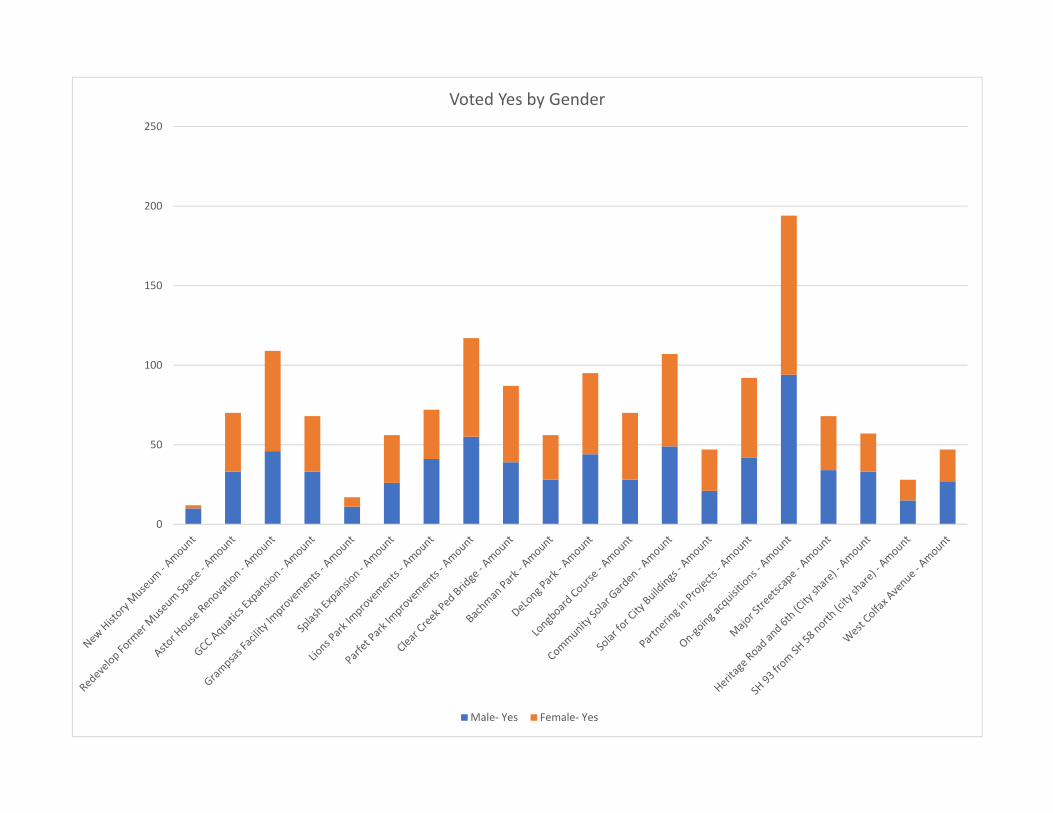
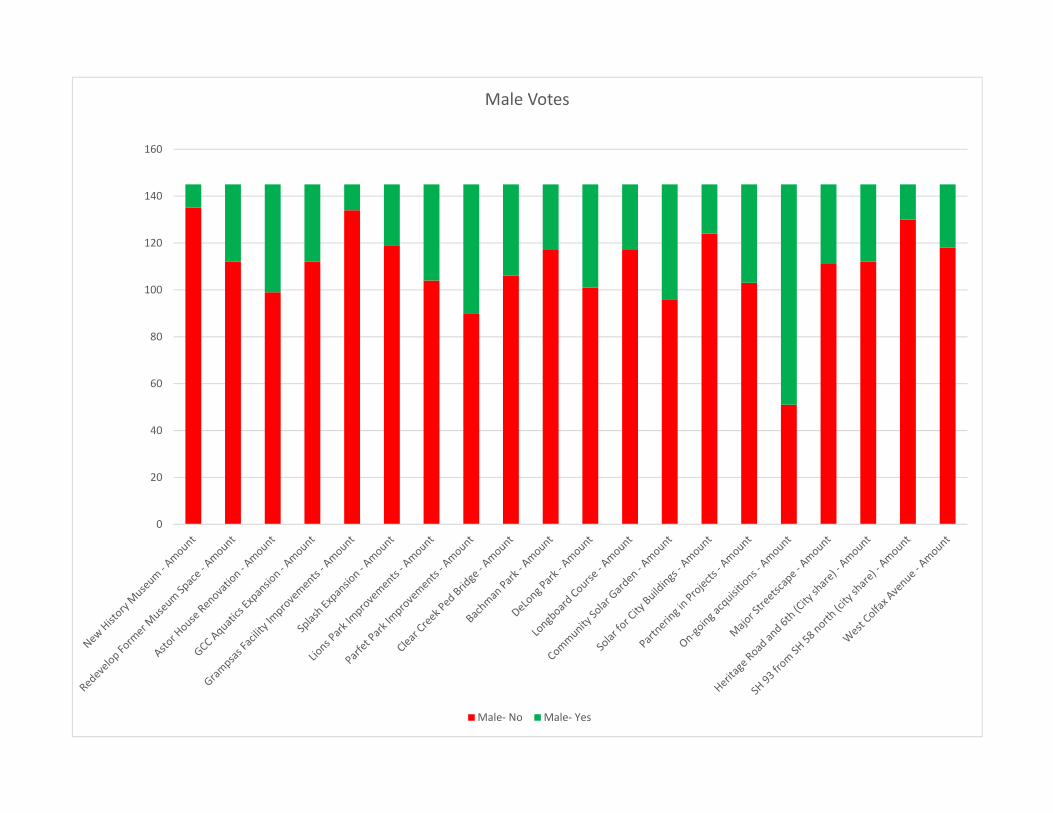
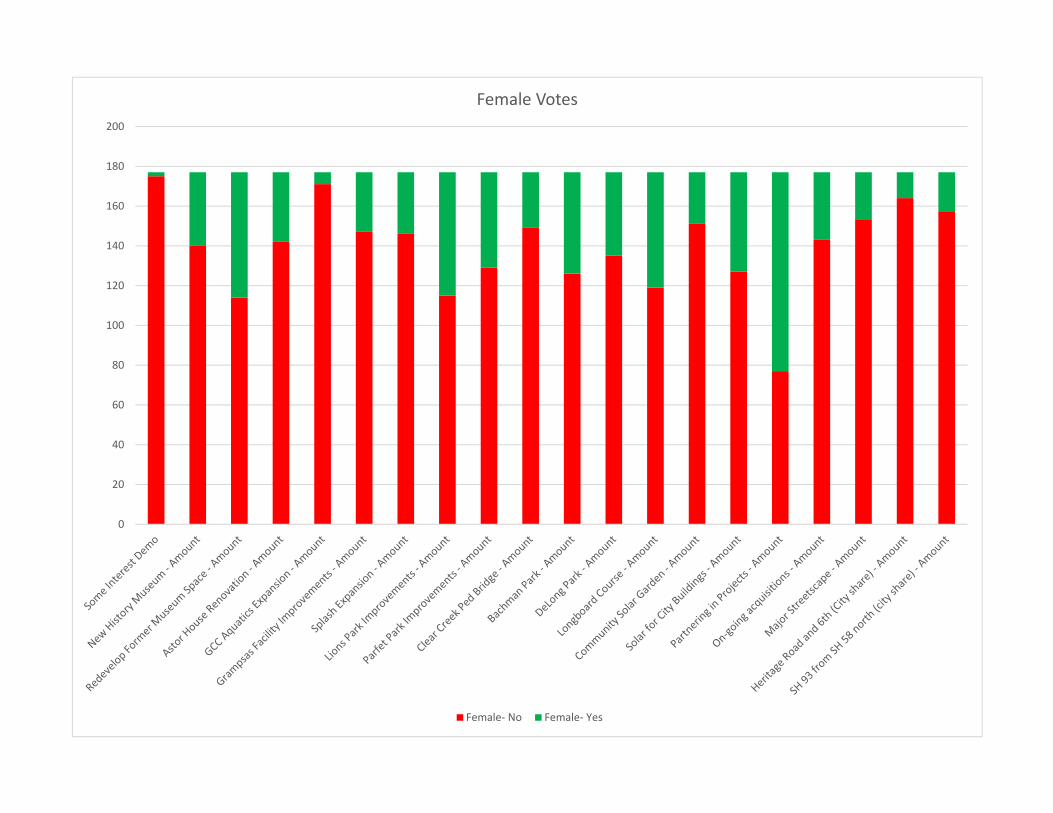
In considering the above, the Task Force feels that the information in Appendix A best describes the feeling of the community (based upon their specific knowledge of the projects – or lack thereof). A closer review of Appendix A details several factors including age and gender in terms of specific projects and inclination to support a revenue measure. One note on the project priority graphs is that some project type names are shorthand from the “Balancing Act” data base and may not be self explanatory. A couple of these include Open Space acquisitions (listed as “on-going acquisitions”), affordable housing investments (listed as “partnering in projects”), and a potential downtown streetscape project (listed as “major streetscape”). Apart from these three, the project names should be familiar to the reader. One basic conclusion that one could reach from the Appendix A data is that there are a few groupings that could be made based upon the level of funding support. Although there are other potential groupings, the below excerpt from Appendix A shows four general levels of project support from high to fair. This is one way to look at this input.

8 | P a g e
Potential Courses of Action for City Council to Consider: The Task Force has been careful not to jump to conclusions about any potential recommendations to City Council. However, given the two basic questions in the task force assignment (prioritization and willingness to devote additional resources), it was natural for the task force to occasionally acknowledge some of the various alternative courses of action available to City Council. Some of these potential directions are detailed below:
1. Move toward a 2018 or 2019 Ballot Measure for a Single Narrow Question. One idea mentioned in task force meetings could involve choosing the project with the strongest support (Open Space) and a moderate level lodging tax and proceeding immediately to the ballot as early as this fall. In this course of action, City staff would recommend that the use of funds would be limited to the areas permitted under the current Jefferson County open space program (funded by a ½ cent sales tax). These uses do include park and open space acquisition, development, and maintenance. The argued linkage between the funding source and the use of funds would be the fact that our open space and park amenities are a major component of visitation and community attractiveness.
2. Move toward a 2019 or 2020 Ballot Measure for Top Tier Investments. A similar, but
less immediate, course would involve choosing a limited set of projects (or more likely

9 | P a g e
project categories since the funding would be expected to continue for a lengthy or indefinite period, after initial construction) and scheduling a comprehensive community review and conversation about the benefit of directly funding such investments through a specific revenue measure (could be a revenue increase, or bonding, or both). This course could begin with a Council determination of the probable “top tier” projects categories, or might start with a statistically valid survey regarding both the priority of such a grouping and/or the willingness to fund.
3. Continue to Discuss. Given the only moderate level of awareness and understanding in the
community related to the City’s capital investment program in general (and the idea of additional discretionary infrastructure and amenity investment), Council could consider a more concerted effort over the next year or longer to better define, scope and communicate with the community about project types and specific potential investment projects. The primary goal of such an effort would be to increase community awareness and understanding of the existing infrastructure and capital investment programs, with a focus on the community plan recommendations for unfunded investments. The discussion of the need to either increase funding resources or phase projects over a very long period (decades) would not be the main focus, but would certainly be included. This effort may or may not lead to a ballot measure on funding in coming years, but would certainly be valuable in consideration of the 10 year Capital Improvement Program, especially for the years starting in 2021, when some additional resources become available.
4. Incorporate the Task Force effort into CIP planning with no discussion of additional resources. The final major potential outcome of the task force investigation could be City Council direction to consider the community input received in upcoming Capital Improvement Program planning efforts, and shelve the topic of additional revenue issues as related to ballot measures. As noted in option 3 above, this effort would certainly be valuable in consideration of the 10 year Capital Improvement Program, especially for the years starting in 2021, when some additional resources become available.
Analysis of Alternative Courses of Action: In many ways, the pros/cons and policy implications of many of the possible courses of action that Council might consider are similar. A few points to consider include:
• Any course of action involving a ballot measure would require an organized and highly motivated grass roots community group to promote it, since the City cannot actively promote any side of a measure once placed on an election ballot, and has traditionally been careful not to violate the spirit of campaign reform laws by refraining from such activities even before placing a question on the ballot.
• “Experts” will provide lots of opinions about whether it is better or worse to schedule a question during our municipal elections, or in a mid-term year (2018) or a presidential year. In the end, it is a local determination.

10 | P a g e
• These same “experts” will provide somewhat varying opinions about “ballot fatigue” based upon the number and type of questions in any one year, and the impact of competing with regional or state initiatives (which won’t be known until late summer each year).
• The task force discussion about the risks associated with options 1,2 and 3 above related to the difference between seeking a quicker determination that may or may not necessarily preclude or complicate additional future community decisions, and moving toward a larger more comprehensive community commitment, that may have a lower chance of success.
Task Force Recommendation: The Task Force meeting on May 30, 2018 was devoted to a discussion of which course of action to recommend to City Council in this interim report. While not unanimous, and not all Task Force members were present, the group did reach a specific recommendation as follows:
• The Task Force recommends that City Council consider adding a ballot measure this fall (or in 2019, if this fall is not practical) proposing a lodging tax and to ear mark that money to open space (defined as uses permitted under the current Jefferson County Open Space program, also including park and open space acquisition, development, and maintenance). The argued linkage between the funding source and the use of funds would be the fact that our open space and park amenities are a major component of visitation and community attractiveness.
• The Task Force also recommends that the un-programmed Sales and Use Tax (SUT) fund resources beginning when the large portion of debt service is retired in 2020 should be allocated to all CIP projects and that the task force should spend more time over the next two years with staff, CBAC, Council, and the community to figure out which CIP projects should get priority.
Additional Policy Considerations identified by staff following the Task Force recommendation: In addition to all of the above considerations, the specific Task Force recommendation to proceed with a narrow question raises other decision points, that Council may wish to consider.
1. Policy considerations for a 2018 narrow question • If Council were inclined to support an immediate action to seek 2018 voter approval of a
question, it would need to be based upon the existence of a committed group of supporters willing and able to mount such a campaign.
• If Council were inclined to support an immediate action to seek 2018 voter approval of a question, it would also (by virtue of the timing) be without the benefit of any further statistically valid polling to determine the level of support.
• In this case, Council would also need to determine what lodging tax percentage to request. While staff opinions vary somewhat, a 3% or 4% tax would be most in line with nearby communities. Based upon new hotel construction and the up-coming licensing of short term rentals, a 3% lodging tax could generate up to about $750,000 a year in a few years, and the 4% rate could be $1,000,000 annually within a few years.

11 | P a g e
• Furthermore, for this option, Council would need to make the decision very quickly, including having the City Clerk notify the county of our intent to participate in the coordinated election by July 30, 2018, and the need for Council to adopt a resolution establishing the ballot question on July 26th or August 9th, 2018.
• Finally for this option, it would be critical to meet with lodging industry stakeholders, immediately to discuss the rationale and basis of the ballot question and benefits to the industry. This would probably be a staff function.
2. Policy questions for 2019 or 2020 narrow or broader questions • If Council is inclined to further investigate priorities and a potential revenue question, but not
for this year, the decisions about next steps are perhaps more straightforward. The two most likely next steps would either focus on developing and communicating project (or category) descriptions to build a much higher awareness of the opportunities, or pursuing a statistically valid survey of community support for project categories and a possible revenue measure.
3. Policy considerations for further capital planning prioritization/ role of Task Force • While the Task Force has been a valuable resource to work through the process to date, their
probable role is most obvious if Council wants to continue working on one or more alternatives for possible future revenue question(s). In this case, there is much work to be done regarding community awareness and support for projects as well as the understanding of resource availability. These would be good areas for the Task Force to continue to focus upon.
• Alternately, if Council desires to move immediately toward a 2018 narrow revenue question, a number of the Task Force members would be expected to join the community based campaign to support the ballot question, and therefore it may be best to terminate the Task Force at this time.
• Further, if Council is not inclined to further investigate a possible revenue question at this time, one main question is whether the Task Force should continue to have a specific voice in prioritization, or if this group is duplicative to CBAC and the various boards and commissions.
Summary: The Task Force thanks City Council for the opportunity to begin this community discussion and process, and hopes that City Council will find the above information of value. The Task Force is anxious to seek Council comment and direction on the matter. Attachments: Appendices A – D Comparative Front Range sales and lodging tax rates

12 | P a g e

Appendix A
0
50
100
150
200
250
300
350
400
Interest in Various Funding Priorities
No Interest Some Interest
Data as of 6/4
Age Range as of 6/4 Gender as of 6/4
<18 6 Male 145
18-29 19 Female 177
30-49 160
50-69 116
>70 30
331 322
0
50
100
150
200
250
300
350
Age Range as of 6/4
>70
50‐69
30‐49
18‐29
<18
0
50
100
150
200
250
300
350
Gender as of 6/4
Female
Male

0
50
100
150
200
250
Interest By Age
<18 18‐29 30‐49 50‐69 >70
0
50
100
150
200
250
Voted Yes by Gender
Male‐ Yes Female‐ Yes

0
50
100
150
200
250
300
350
No Interest in this item by Age
<18 18‐29 30‐49 50‐69 >70

0
50
100
150
200
250
300
350
No Interest in this area by Gender
Male‐ No Female‐ No
0
20
40
60
80
100
120
140
160
Male Votes
Male‐ No Male‐ Yes
0
20
40
60
80
100
120
140
160
180
200
Female Votes
Female‐ No Female‐ Yes

0
50
100
150
200
250
300
350
Sales Yes Sales No Lodging Yes Lodging No Property Yes Property No Marijuana Yes Marijuana No No Tax
Willing to raise taxes by Age
<18 18‐29 30‐49 50‐69 >70

0
50
100
150
200
250
300
350
Sales Tax Lodging Tax Property Tax Recreational Marijuana Tax Any Tax Increase at All?
Willing to Pass This Type of Tax out of 331Votes
No Yes
June 4

Appendix B
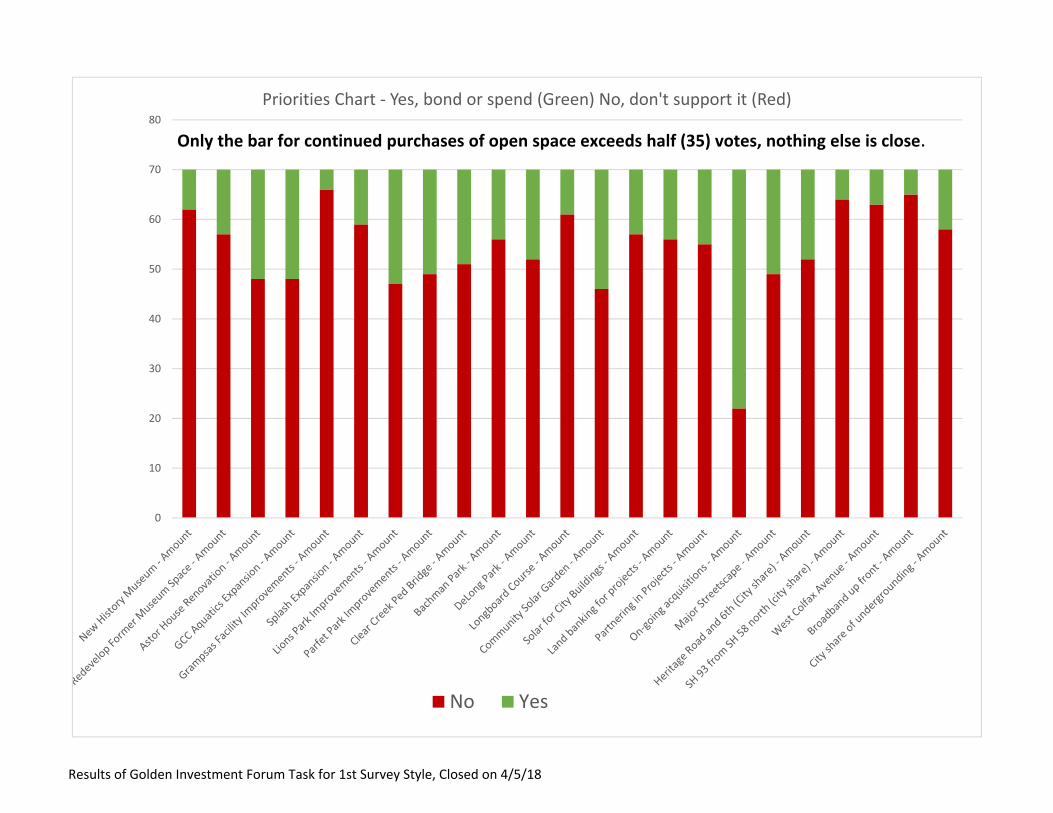
Results of Golden Investment Forum Task for 1st Survey Style, Closed on 4/5/18
0
10
20
30
40
50
60
70
80Priorities Chart ‐ Yes, bond or spend (Green) No, don't support it (Red)
No Yes
Only the bar for continued purchases of open space exceeds half (35) votes, nothing else is close.

New
History Museu
m ‐ Am
ount
Rede
velop Fo
rmer M
useu
m Spa
ce ‐ Am
ount
Astor H
ouse Ren
ovation ‐ A
mou
nt
GCC
Aqu
atics E
xpan
sion ‐ A
mou
nt
Grampsas Facility Im
prov
emen
ts ‐ Am
ount
Splash Expan
sion ‐ A
mou
nt
Lion
s Park Im
prov
emen
ts ‐ Am
ount
Parfet Park Im
prov
emen
ts ‐ Am
ount
Clea
r Creek Ped
Brid
ge ‐ Am
ount
Bachman
Park ‐ A
mou
nt
DeLong
Park ‐ A
mou
nt
Long
board Co
urse ‐ Am
ount
Commun
ity Solar Garde
n ‐ A
mou
nt
Solar for City
Buildings ‐ Am
ount
Land
ban
king
for p
rojects ‐ Amou
nt
Partne
ring in Projects ‐ Amou
nt
On‐go
ing acqu
isitio
ns ‐ Am
ount
Major Stree
tscape
‐ Am
ount
Heritage Ro
ad and
6th (C
ity sh
are) ‐ Am
ount
SH 93 from
SH 58
north (city
share) ‐ Am
ount
West C
olfax Av
enue
‐ Am
ount
Broa
dban
d up
fron
t ‐ Amou
nt
City sh
are of und
ergrou
nding ‐ A
mou
nt
No 62 57 48 48 66 59 47 49 51 56 52 61 46 57 56 55 22 49 52 64 63 65 58Yes 8 13 22 22 4 11 23 21 19 14 18 9 24 13 14 15 48 21 18 6 7 5 12

0 5 10 15 20 25
0%
1%
2%
3%
4%
5%
6%
7%
Votes for Lodging Tax at % of tax rate indicated5 people, for example, voted for a 7% tax
Notes sum of votes for some lodging tax is 48, versus 22 against
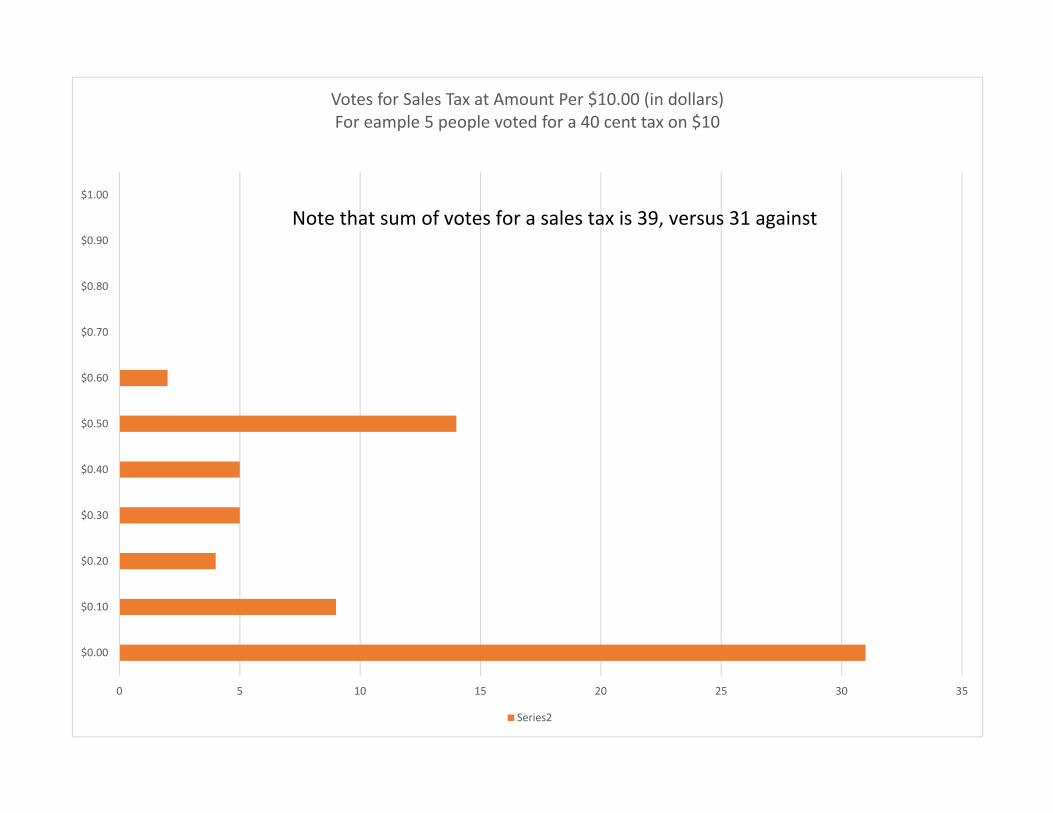
0 5 10 15 20 25 30 35
$0.00
$0.10
$0.20
$0.30
$0.40
$0.50
$0.60
$0.70
$0.80
$0.90
$1.00
Votes for Sales Tax at Amount Per $10.00 (in dollars)For eample 5 people voted for a 40 cent tax on $10
Series2
Note that sum of votes for a sales tax is 39, versus 31 against

0 5 10 15 20 25 30 35 40 45 50
0 mil
1 mil
2 mil
3 mil
4 mil
5 mil
Votes for Property Tax at mil level indicated
No votes for property tax exceed sum of all other votes at 47, 22 for a tax

Appendix C
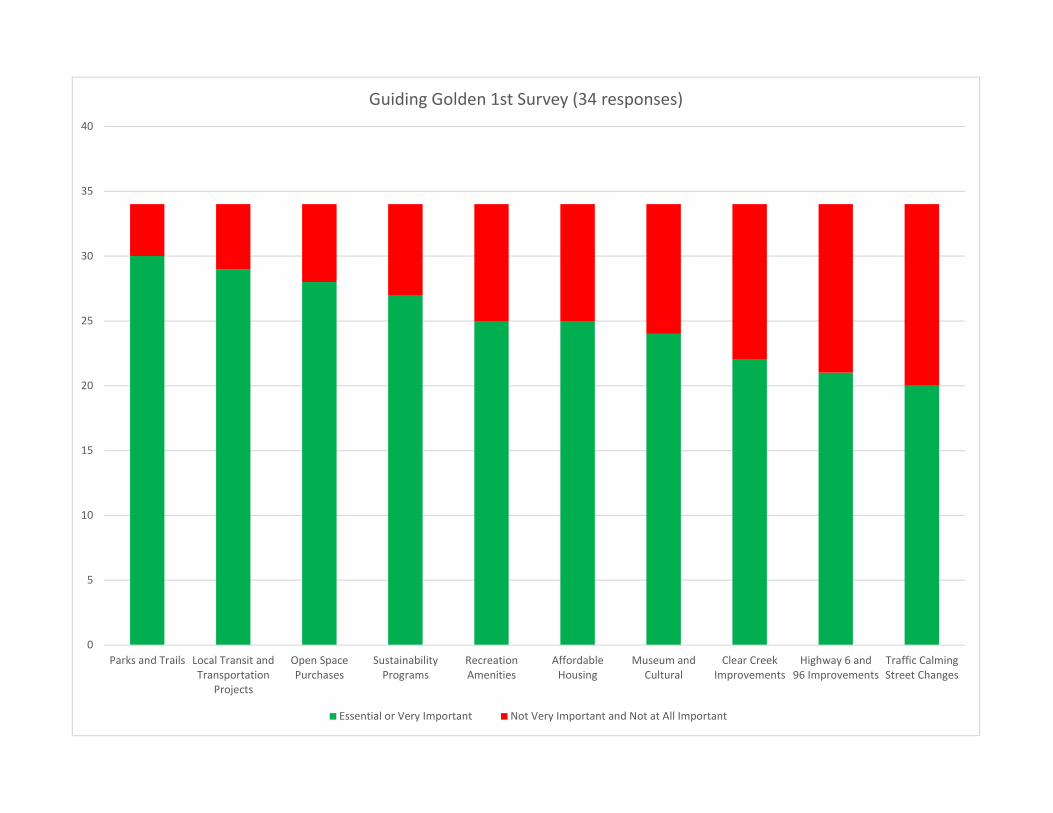
0
5
10
15
20
25
30
35
40
Parks and Trails Local Transit andTransportation
Projects
Open SpacePurchases
SustainabilityPrograms
RecreationAmenities
AffordableHousing
Museum andCultural
Clear CreekImprovements
Highway 6 and96 Improvements
Traffic CalmingStreet Changes
Guiding Golden 1st Survey (34 responses)
Essential or Very Important Not Very Important and Not at All Important

Appendix D

0
2
4
6
8
10
12
14
16
18
20
Transportation Affordable Housing Open SpaceAcquisitions
RecreationFacilities
DowntownImprovements
Cultural Facilities Clear CreekCorridor
SustainabilityImprovements
NeighborhoodParks
Forced Rankings ‐ Sum of 1s, 2s and 3 votes for each category

0
2
4
6
8
10
12
14
16
18
NeighborhoodParks
Affordable Housing RecreationFacilities
Transportation SustainabilityImprovements
Open SpaceAcquisitions
Clear CreekCorridor
Cultural Facilities DowntownImprovements
Least Favorites ‐ Sum of 7, 8, 9 (Highest votes is least favored)
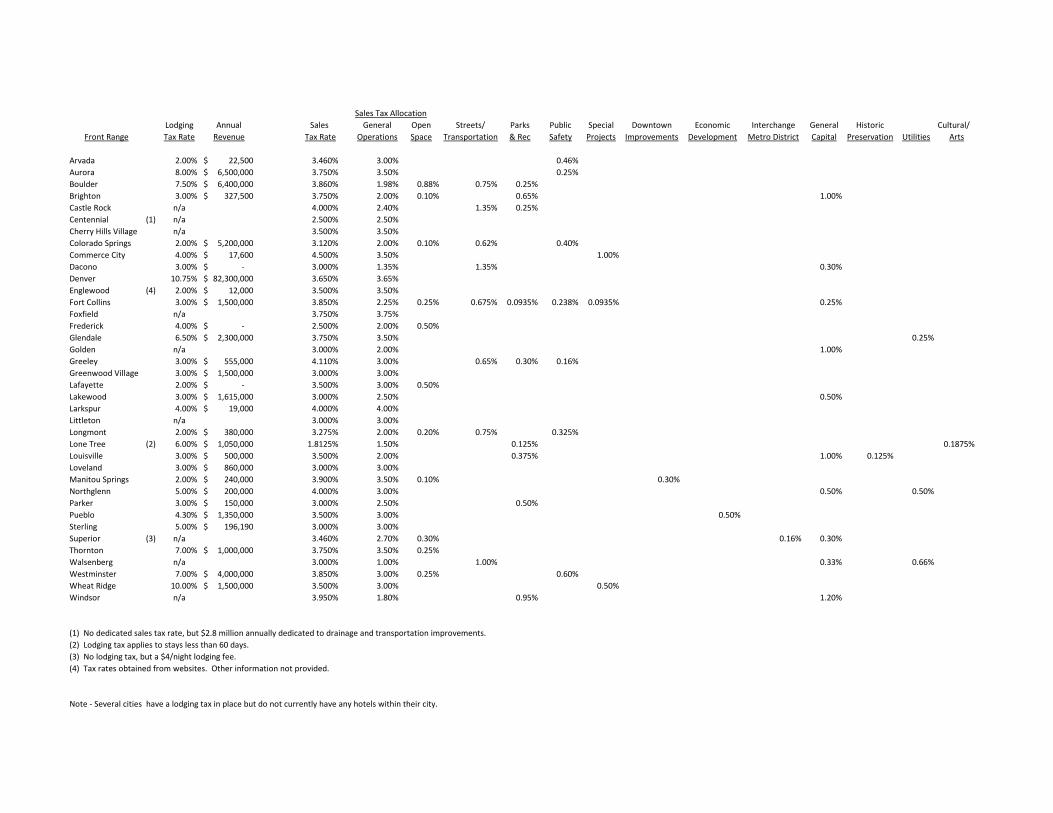
Sales Tax Allocation
Lodging Annual Sales General Open Streets/ Parks Public Special Downtown Economic Interchange General Historic Cultural/
Front Range Tax Rate Revenue Tax Rate Operations Space Transportation & Rec Safety Projects Improvements Development Metro District Capital Preservation Utilities Arts
Arvada 2.00% 22,500$ 3.460% 3.00% 0.46%
Aurora 8.00% 6,500,000$ 3.750% 3.50% 0.25%
Boulder 7.50% 6,400,000$ 3.860% 1.98% 0.88% 0.75% 0.25%
Brighton 3.00% 327,500$ 3.750% 2.00% 0.10% 0.65% 1.00%
Castle Rock n/a 4.000% 2.40% 1.35% 0.25%
Centennial (1) n/a 2.500% 2.50%
Cherry Hills Village n/a 3.500% 3.50%
Colorado Springs 2.00% 5,200,000$ 3.120% 2.00% 0.10% 0.62% 0.40%
Commerce City 4.00% 17,600$ 4.500% 3.50% 1.00%
Dacono 3.00% -$ 3.000% 1.35% 1.35% 0.30%
Denver 10.75% 82,300,000$ 3.650% 3.65%
Englewood (4) 2.00% 12,000$ 3.500% 3.50%
Fort Collins 3.00% 1,500,000$ 3.850% 2.25% 0.25% 0.675% 0.0935% 0.238% 0.0935% 0.25%
Foxfield n/a 3.750% 3.75%
Frederick 4.00% -$ 2.500% 2.00% 0.50%
Glendale 6.50% 2,300,000$ 3.750% 3.50% 0.25%
Golden n/a 3.000% 2.00% 1.00%
Greeley 3.00% 555,000$ 4.110% 3.00% 0.65% 0.30% 0.16%
Greenwood Village 3.00% 1,500,000$ 3.000% 3.00%
Lafayette 2.00% -$ 3.500% 3.00% 0.50%
Lakewood 3.00% 1,615,000$ 3.000% 2.50% 0.50%
Larkspur 4.00% 19,000$ 4.000% 4.00%
Littleton n/a 3.000% 3.00%
Longmont 2.00% 380,000$ 3.275% 2.00% 0.20% 0.75% 0.325%
Lone Tree (2) 6.00% 1,050,000$ 1.8125% 1.50% 0.125% 0.1875%
Louisville 3.00% 500,000$ 3.500% 2.00% 0.375% 1.00% 0.125%
Loveland 3.00% 860,000$ 3.000% 3.00%
Manitou Springs 2.00% 240,000$ 3.900% 3.50% 0.10% 0.30%
Northglenn 5.00% 200,000$ 4.000% 3.00% 0.50% 0.50%
Parker 3.00% 150,000$ 3.000% 2.50% 0.50%
Pueblo 4.30% 1,350,000$ 3.500% 3.00% 0.50%
Sterling 5.00% 196,190$ 3.000% 3.00%
Superior (3) n/a 3.460% 2.70% 0.30% 0.16% 0.30%
Thornton 7.00% 1,000,000$ 3.750% 3.50% 0.25%
Walsenberg n/a 3.000% 1.00% 1.00% 0.33% 0.66%
Westminster 7.00% 4,000,000$ 3.850% 3.00% 0.25% 0.60%
Wheat Ridge 10.00% 1,500,000$ 3.500% 3.00% 0.50%
Windsor n/a 3.950% 1.80% 0.95% 1.20%
(1) No dedicated sales tax rate, but $2.8 million annually dedicated to drainage and transportation improvements.
(2) Lodging tax applies to stays less than 60 days.
(3) No lodging tax, but a $4/night lodging fee.
(4) Tax rates obtained from websites. Other information not provided.
Note - Several cities have a lodging tax in place but do not currently have any hotels within their city.