Embed Size (px)
Citation preview

Interim Report and Financial Statements
for the period ended 30 June 2014
GOLDEN PROSPECT PRECIOUS METALS LIMITED

Contents
Page
Chairman's Statement 2
Board Members 4
Investment Manager's Report 5
Financial Statements
Statement of Comprehensive Income 6
Statement of Changes in Equity 7
Statement of Financial Position 8
Statement of Cash Flows 9
Notes to the Financial Statements 10
Portfolio Statement (unaudited) 25
Management and Administration 27
GOLDEN PROSPECT PRECIOUS METALS LIMITED
1

Chairman's Statement
Dear Shareholder
GOLDEN PROSPECT PRECIOUS METALS LIMITED
Attempting to navigate through the vast amount currently being written about gold worldwide can be an exercise in
futility in that one is none the wiser afterwards.
A lifetime in the financial and investment sector however tells me that it won’t be long before a ‘black swan’ event
triggers a major change in the fortunes of all of us who participate in the investment markets and struggle from time to
time with our ever changing portfolio strategies.
An army of research analysts and investment commentators who are paid more than handsomely are at odds over how to
read the global geopolitical and financial scene. No matter what their views are… including yours, and mine, in truth no
one knows. One can buy into all sorts of theories and noise but this only adds to the confusion.
Such uncertainty then breeds even more confusion which more often than not leads to poor investment decisions and there
is a strong argument in favour of falling back on the old market adage ‘when in doubt do naught’.
So in many ways I am appreciative of the fact that I and my fellow directors do not personally have to make the tricky
stock picking choices that our excellent investment and analytical team do at CQS. You can read their investment
management report here in.
However from a generalist or macro view point I will attempt to collate some of the current for and against arguments for
gold in particular but also the other precious metals.
My own view as a seasoned professional investor and self-proclaimed ‘gold bug’ is that bullion should remain a solid safe
haven asset given its many defensive qualities. It remains an insurance against geopolitical events; it offers currency
protection and asset diversification. Central Banks and Sovereign-wealth funds are still buying it to combat future
inflation and expanding or burgeoning Chinese and Indian demand reflects a strong appetite for buying gold in these
regions. In fact most Asian governments are encouraging their citizens to buy gold having liberalised their bullion
markets at a time when holding costs remain low. So for all these reasons gold and gold shares will remain a core asset in
my personal portfolio and I can’t see this changing for as long as Western governments borrow, spend and print money all
of which dictates the need for investors to hold hard assets.
On the bear tack the main argument is that the US economy will continue to strengthen with falling unemployment
leading to a steeper slope in interest rates. The gold market reacts negatively to the Fed now being more prepared to
tighten interest rates than previously thought. As a consequence the dollar has risen strongly. The lack of inflation in the
US and Europe has also dampened gold demand in the West and as we know rising inflationary expectations normally act
as a strong catalyst for gold demand. In the immediate term though deflation stubbornly continues to win out.
But bears also point to conspiracy and manipulation theories of which there does seem to be some evidence and they also
worry that maybe a substantial amount of the gold in US vaults has been leased out to the bullion banks since Germany
and Austria are only getting a little gold at a time to settle the recall of their bullion back home. It may be years before
they get all their gold back, or so the argument runs and this does beg the question as to why?
This in turn has encouraged some of the bigger investment banks to engage in shorting practices plus their creation of
other derivatives which collectively dwarf the actual physical trade. Industry hedging is another factor that hit gold in the
previous bear market and there is concern that this will materialise again in the medium term. The cost of production is
currently running at circa $1350 per Oz, according to most informed sources.
Looking to future worldwide trends, Asia’s physical and investment gold demand is increasing with the liberalisation of
their gold markets at a time when Western investment demand is falling. According to China Gold Association China
will accumulate 8500 tonnes in official gold reserves. Its president recently ‘said “Gold is money par excellence and will
support the Renminbi to become an international currency.”
2

Chairman's Statement (continued)
Malcolm Burne
Chairman
Undoubtedly though gold faces a crucial test in the coming months as it tries to combat the stronger US dollar the price
and may remain range bound until the signs of significant inflation return. With sentiment constantly changing around the
geopolitical and QE news flow it is understandably difficult for the investor to commit further funds at such an uncertain
time. However, there is plethora of newsletter writers and alleged gurus currently banging the drum to get back into gold
and gold equities. John Paulson, Eric Sprott, Jim Rodgers, George Sorros, Rick Rule, Doug Cassey, and the Aden sisters
are among them. And it’s not just gold they are recommending. They also point to big supply and demand imbalances in
silver and platinum while the diamonds sector is strengthening all the time. On balance I agree with their collective
positive assessment.
Summarising, I am hopeful that we are not far away from our fund recovering much of its lost ground in the recent past,
and I will be personally adding to my holding after these report and accounts are published.
GOLDEN PROSPECT PRECIOUS METALS LIMITED
Although the ETFs have been liquidating, a significant equities market correction which is arguably overdue should result
in the rotation of substantial funds back into gold and gold shares.
3

Board Members
GOLDEN PROSPECT PRECIOUS METALS LIMITED
Malcolm Burne, is a former stockbroker and financial journalist with The Financial Times. He has controlled and
managed fund management, venture capital and investment banking companies in London, Australia, Hong Kong and
North America. He has been a director of more than 20 companies, many of which have been in the mineral resource
and gold exploration fields. In 1997, he founded Golden Prospect plc and was executive chairman until 2007 when the
company changed its name to Ambrian Capital plc. In addition, he was executive chairman of the Australian Bullion
Company (Pty) Limited, which at the time was Australia's leading gold dealer and member of the Sydney Futures
Exchange. He is currently a director of several other resources companies in Australia and the UK.
Kaare Foy, was an executive director of Great Panther Silver Limited, a silver exploration and mining company based
in Vancouver, from 1994 until the beginning of 2012 and was its Executive Chairman when it reached a market
capitalisation of more than US$600 million in 2011. He is currently chairman of Viscount Mining Limited and Polar
Star Mining Corporation, and has been heavily involved with silver and gold projects in North America. He also serves
as executive chairman for Canadian exploration company Cangold Limited, and worked with Malcolm Burne at the
Australian Bullion Company (Pty) Ltd during the 1980s.
Robert King, is a non-executive director for a number of open and closed ended investment funds and companies. He
was a Director of Cannon Asset Management Limited and their associated companies, from October 2007 to February
2011. Prior to this he was a Director of Northern Trust International Fund Administration Services (Guernsey) Limited
(formerly Guernsey International Fund Managers Limited) where he had worked from 1990 to 2007. He has been in
the offshore finance industry since 1986 specialising in administration and structuring of offshore open and closed
ended investment funds. Rob is British and resident in Guernsey.
The Directors have overall responsibility for the Company's activities including the review of its activities and
performance.
The Directors of the Company at the date of signing the accounts, all of whom are non-executive, are listed below:
Toby Birch, is a non-executive director on a number of investment funds and companies, including BullionRock
which merged with Guernsey Gold during 2014. Previously he was managing director of Oppenheim & Co Limited in
Guernsey and Blackfish Capital Holdings, the private investment arm of a single family office. He was also investment
manager of the Blackfish Capital Exodus Fund trading in commodities, precious metals and real asset themes and was
a director of the Blackfish-Investec Resources Special Situations Fund, investing in mining companies. He is a
Chartered Fellow, and committee member, of the Chartered Institute for Securities and Investments, who have
appointed him a Chartered Wealth Manager. He is a regular public speaker on the conference circuit and in the media,
covering financial megatrends, precious metals, agricultural investment and monetary reform.
4

GOLDEN PROSPECT PRECIOUS METALS LIMITEDINVESTMENT MANAGER'S REPORT
October 2014
New City Investment Managers (a trading name of CQS Asset Management Limited)
We believe that the reasons for owning gold within a portfolio remain unchanged; indeed the continuing currency
debasement by global central banks only strengthens that position. Though the strong dollar provides a headwind for
all commodities to overcome, we believe the fund is well positioned given its bias towards assets with the flexibility
to weather the current challenging metal price environment while offering attractive growth potential.
The fund also remains exposed to some exciting, high-grade diamond deposits located in North America. While
these equities were largely unmoved during the first half of the year, mirroring underling diamond price indices,
share price performance has more recently improved as the projects emerge from a relatively quiet period in their
development schedules.
Gold and silver spot prices added 10.5% and 8% respectively during the first half of the year with gains
encouragingly occurring despite economic stimulus withdrawal by the US FED, a process which is anticipated to
conclude this autumn. Latterly the prospect of nominal interest rate tightening has weighed on sentiment though the
impact has been lessened by geopolitical instability, which has become a more prevalent and supportive market
feature. In this regard tensions in the Ukraine have more recently been accompanied by renewed turmoil in the
Middle East, a trend that may continue should the US pare back its global policing role, a potential result of
improved confidence in its domestic energy security.
Importantly, US labour market slack and the sheer magnitude of government indebtedness mean the trajectory of
regional rate increases and the impact of associated US dollar strength on the gold price may be muted. Meanwhile,
the ECB appears to be adopting similar policies as it considers unconventional monetary stimulus, potentially its
own form of inflationary QE, to reinvigorate anaemic Eurozone economic conditions.
Crucially, gold ETF liquidation, which weighed so heavily on the metal price during 2013, abated in February with
ETF physical holdings currently around 54Moz, within a range of 50-55Moz believed to represent a “core” position.
In this context, despite Asian purchases slowing appreciably against the prior year’s opportunistic surge, gold bar
and jewellery demand remains robust. Indeed, China’s voracity for gold during the 2013, constrained only by the
speed with which London Good Delivery bars could be refined into smaller Shanghai 9999 kilo bars, may indicate
significant demand support at US$1,200/oz. More immediately the outlook for a seasonal pick-up in demand,
notably from India, may help lift prices with the potential for added impetus should the new Modi government relax
the region’s import restrictions.
Corporate M&A also adds a further positive dimension to the sectors risk-reward profile as capital expenditure and
exploration austerity among the larger gold mining groups, coupled with preferential extraction of their higher grade
resource, lays the foundations for sustained M&A as producers seek to acquire growth.
Reflecting our positive view, the fund increased its exposure to operational geared equities during the period.
Holdings in Silver Wheaton and Royal Gold were reduced with proceeds reinvested into mining equities such as
Fortuna Silver, whose share price had declined as a result of GDXJ index rebalancing during March, and explorer
Continental Gold. Financial gearing was also maintained at a high level through the period though has more recently
been reduced as the valuations of some investments such as Fortuna Silver and Mandalay Resources ran ahead of
metal prices. It is perhaps telling of broader investor reticence towards the sector that the share prices of low-risk
royalty companies, such as Silver Wheaton have more than kept pace with underlying mining equities though in-so-
doing relative valuations are becoming stretched.
Elsewhere protracted strike action in the South African mining industry, responsible for over 70% of global platinum
group metal production, had a clear influence on metal prices while also vindicating our cautious preference for
exposure via physically backed exchange traded funds. Palladium rose 17.7% during the first half of the year
outpacing platinum which rose 8.5%. The formation of two palladium ETF’s spurred gains, accentuating deficit
conditions which continue to benefit from robust vehicle demand, notably in China. Ukrainian events were also
helpful for the palladium price given the risk of sanctions restricting the supply of Russian stocks, historically
equivalent to those of South Africa, into the market. While remaining favourably disposed to PGM metals given the
industry’s longer-term structural challenges exposure was pared-back as South African labour issues were resolved.
5

Statement of Comprehensive Income (Unaudited)
For the period from 1 January 2014 to 30 June 2014
01.01.14 01.01.13
to 30.06.14 to 30.06.13
Notes Revenue Capital Total Total
£ £ £ £
Income
Income from investments designated
7 74,499 - 74,499 155,274
7 - 4,623,887 4,623,887 (23,404,893)
Net investment gains/(losses) 74,499 4,623,887 4,698,386 (23,249,619)
Expenses
Investment management fees 5 (155,166) - (155,166) (276,456)
Administration fees 5 (27,275) - (27,275) (26,972)
Custodian fees 5 (6,744) - (6,744) (10,165)
Directors' fees 5 (27,121) - (27,121) (39,577)
Audit fees (13,058) - (13,058) (8,599)
Directors' insurance costs (3,316) - (3,316) (3,297)
Registrar's fees (6,910) - (6,910) (6,513)
Sponsor fees (7,623) - (7,623) (8,827)
Legal fees (2,903) - (2,903) (16,655)
Printing (2,835) - (2,835) (11,082)
Other expenses (92,822) - (92,822) (45,872)
Total operating expenses (345,773) - (345,773) (454,015)
Operating profit /(loss) (271,274) 4,623,887 4,352,613 (23,703,634)
Finance cost
3,704 - 3,704 2,295
Overdraft interest 8 (62,339) - (62,339) (43,870)
Profit / (loss) for the period before tax (329,909) 4,623,887 4,293,978 (23,745,209)
Withholding tax (12,534) - (12,534) -
Other comprehensive income - - - -
(£342,443) £4,623,887 £4,281,444 (£23,745,209)
6 7.51p (41.66p)
All the items in the above statement derive from continuing operations.
Basic and diluted earnings/(loss) per
Ordinary Share (pence)
The 'Total' column of this statement represents the Company’s Income Statement, prepared in accordance with IFRS as
endorsed by the European Union. The supplementary ‘Revenue’ and ‘Capital’ columns are both prepared for
information purposes only.
GOLDEN PROSPECT PRECIOUS METALS LIMITED
The notes on pages 10 to 24 form part of these Unaudited Interim Financial Statements.
at fair value through profit or loss
Net capital gains/(losses) on
investments at fair value through
profit or loss
Total comprehensive profit /(loss)
for the period
Finance income
6

Statement of Changes in Equity
For the period from 1 January 2014 to 30 June 2014
Realised Unrealised
Notes Share Share Capital Capital Revenue Distributable Total
Capital Premium Reserve Reserve Reserve Reserve Equity
£ £ £ £ £ £ £
Balance as at 1 January 2014 57,002 - (5,973,732) (13,058,968) (3,064,947) 43,995,829 21,955,184
Total comprehensive profit for the period 12 - - (884,512) 5,508,399 (342,443) - 4,281,444
Total transactions with owners - - - - - - -
Balance as at 30 June 2014 £57,002 £- (£6,858,244) (£7,550,569) (£3,407,390) £43,995,829 £26,236,628
For the period from 1 January 2013 to 30 June 2013
Balance as at 1 January 2013 57,002 - 1,677,387 5,681,476 (2,530,460) 43,995,733 48,881,138
Total comprehensive loss for the period 12 - - (4,768,394) (18,636,499) (340,316) - (23,745,209)
Transactions with owners
Issue of ordinary shares 11, 12 - 95 - - - - 95
Transfer to Distributable Reserve - (95) - - - 95 -
Total transactions with owners - - - - - 95 95
Balance as at 30 June 2013 £57,002 £- (£3,091,007) (£12,955,023) (£2,870,776) £43,995,828 £25,136,024
The notes on pages 10 to 24 form part of these Unaudited Interim Financial Statements.
GOLDEN PROSPECT PRECIOUS METALS LIMITED
7

Statement of Financial PositionAs at 30 June 2014 (Unaudited) (Audited)
Notes 30.06.14 31.12.13
£ £
Current Assets
7 29,772,051 23,824,367
Cash and cash equivalents 8 - 84,487
Receivables 9 21,363 13,638
Total Assets 29,793,414 23,922,492
Current Liabilities
Payables and accruals 10 (61,662) (74,759)
8 (3,495,124) (1,892,549)
(3,556,786) (1,967,308)
Net Assets £26,236,628 £21,955,184
Equity
Share capital 11 57,002 57,002
Revenue reserve 12 (3,407,390) (3,064,947)
Distributable reserve 12 43,995,829 43,995,829
Other reserves 12 (14,408,813) (19,032,700)
Total Equity £26,236,628 £21,955,184
Number of Ordinary Shares in issue 11 57,001,926 57,001,926
17 46.03p 38.52p
Robert King Toby Birch
The notes on pages 10 to 24 form part of these Unaudited Interim Financial Statements.
The Unaudited Interim Financial Statements on pages 6 to 24 were approved by the Board of Directors and authorised for
issue and signed on 8 October 2014 on its behalf by:
Net Asset Value per Ordinary Share (pence)
Bank overdraft
Investments at fair value
GOLDEN PROSPECT PRECIOUS METALS LIMITED
Total Liabilities
8

Statement of Cash Flows
For the period from 1 January 2014 to 30 June 2014 01.01.14 01.01.13
to 30.06.14 to 30.06.13
Notes £ £
Cash flows from operating activities
Profit / (loss) for the period 4,281,444 (23,745,209)
Adjustment for:
Capital (gain) / loss on investments at fair value (4,623,887) 23,404,893
Operating cash flows before movements in working capital (342,443) (340,316)
(Increase) / decrease in receivables (7,725) 60,708
Decrease in payable and accruals (13,097) (56,710)
Purchase of investments (8,846,914) (11,714,323)
Proceeds from sale of investments 7,523,117 14,148,495
Net cash (used in) / generated from operating activities (1,687,062) 2,097,854
Cash flows from financing activities
Proceeds from issue of Ordinary Shares 11 - 95
Net cash generated from financing activities - 95
Net (decrease) / increase in cash and cash equivalents (1,687,062) 2,097,949
Net cash and cash equivalents at beginning of period (1,808,062) (2,093,061)
Cash and cash equivalents at period end 8 (3,495,124) 4,888
Supplementary cash flow information
Net cash (used in)/generated from operating activities include: £ £
Interest received on cash balances 3,704 2,295
Interest paid on cash balances (62,339) (43,870)
Income received from investments 80,493 155,274
The notes on pages 10 to 24 form part of these Unaudited Interim Financial Statements.
GOLDEN PROSPECT PRECIOUS METALS LIMITED
9

GOLDEN PROSPECT PRECIOUS METALS LIMITED
Notes to the Financial Statements
For the period ended 30 June 2014
1 COMPANY INFORMATION
2 SIGNIFICANT ACCOUNTING POLICIES
Basis of preparation
Accounting judgements and estimates
The Financial Statements have been prepared on a historical cost basis except for the measurement of financial
assets and financial liabilities at fair value through profit or loss.
The Financial Statements have been prepared in accordance with International Financial Reporting Standards
(“IFRS”) which comprise standards and interpretations as issued and approved by the International Accounting
Standards Board (“IASB”), and International Accounting Standards Interpretations Committee's interpretations
approved by the International Accounting Standards Committee ("IASC") that remain in effect, and to the extent
that they have been adopted by the European Union, and reflect the following policies, which have been adopted
and applied consistently.
Golden Prospect Precious Metals Limited ("the Company") was incorporated in Guernsey on 16 October 2006 as
an authorised closed-ended investment scheme under the Protection of Investors (Bailiwick of Guernsey) Law
1987, as amended. The Company's registered office is as shown on page 27.
The Company's Ordinary shares are traded on London Stock Exchange SETS QX with the code GPM.
The Company's ordinary shares were admitted to the Official List of the Channel Islands Stock Exchange
("CISX") on 24 June 2008. On 20 December 2013 the Royal Court of Guernsey approved the scheme of
arrangement (“the scheme”) between The Channel Islands Stock Exchange, LBG (“CISX”), The Channel Islands
Securities Exchange Limited (“CISEL”) and The Channel Islands Securities Exchange Authority Limited
(“CISEAL”). In accordance with the scheme, the business of CISX has been acquired by CISEAL. All securities
that were listed on the Official List of CISX have been transferred in accordance with Listing Rule 2.6A of the
CISX Listing Rules and are now listed on the Official List of CISEAL.
The Company’s investment objective is to generate above average returns for Shareholders primarily through the
capital appreciation of its investments. The Directors believe that such returns can be obtained by investing in a
selective portfolio of securities and other instruments in the precious metals, diamond and uranium sectors.
The following accounting policies have been applied consistently in dealing with items which are considered to be
material in relation to the Company's Financial Statements:
Items included in the Company's Financial Statements are measured using the currency of the primary economic
environment in which it operates ("the functional currency"). The currency in which the Company's shares are
denominated, and in which its operating expenses are incurred, is Sterling. The Company's investments are
denominated in many different currencies. Accordingly, the Directors regard Sterling as the functional currency.
The Company has also adopted Sterling as its presentational currency.
The preparation of Financial Statements in conformity with IFRS requires management to make judgements,
estimates and assumptions that affect the application of policies and the reported amounts of assets and liabilities,
income and expenses. The estimates and associated assumptions are based on historical experience and various
other factors that are believed to be reasonable under the circumstances, the results of which form the basis of
making the judgements about carrying values of assets and liabilities that are not readily apparent from other
sources. Actual results may differ from these estimates.
The estimates and underlying assumptions are reviewed on an ongoing basis. Revisions to accounting estimates
are recognised in the period in which the estimate is revised if the revision affects only that period, or in the period
of revision and future periods if the revision affects both current and future periods.
10

GOLDEN PROSPECT PRECIOUS METALS LIMITED
Notes to the Financial Statements (continued)
For the period ended 30 June 2014
2 SIGNIFICANT ACCOUNTING POLICIES (continued)
Accounting judgements and estimates (continued)
Adoption of new and revised standards
IFRS 10 - Consolidated Financial Statements
IFRS 10 - Consolidated Financial Statements - Amendment for investment entities
IFRS 11 - Joint arrangements
IFRS 12 - Disclosures of Interests in Other Entities
IFRS 12 - Disclosures of Interests in Other Entities - Amendment for investment entities
IAS 27 - Consolidated and Separate Financial Statements - Amendments for investment entities
IAS 28 - Investments in Associates and Joint Ventures
IAS 32 - Offsetting Financial Assets and Financial Liabilities
Standards and Interpretations in issue and not yet effective
* - Still to be endorsed by the EU.
Financial instruments
These standards and interpretations will be adopted by the Company when they become effective. The Directors
anticipate that, with the exception of IFRS 9, the adoption of these standards and interpretations in future periods will
not have a material impact on the financial statements of the Company. The Directors are considering, but have not
yet concluded, on what the impact of IFRS 9 will be on the Company’s Statement of Financial Position but do not
anticipate adopting the standard until the year ending December 2018.
The Company has not early adopted any other standard, interpretation or amendment that has been issued but is not
yet effective.
The accounting policies adopted in the period are consistent with those of the previous financial period, with the
exception of new standards that have become effective during the period. Although there were a number of new
standards and interpretations that apply for the first time in 2014 none of these had any significant impact on the
Company's financial statements.
The list below shows the IFRSs, IFRICs and amendments that are mandatory for the first time in this financial
reporting period but which have had no significant impact on these financial statements.
At the date of authorisation of these Financial Statements, the following standards and interpretations, which will
become relevant to the Company but have not been applied in these Financial Statements, were in issue but not yet
effective:
IFRS 9, "Financial Instruments - Classification and Measurement" (for accounting periods currently no sooner than 1
January 2018, though no effective date has been set by the IASB)
IFRS 7, Financial Instruments Disclosures- Amendments regarding initial application of IFRS 9* - effective for
periods commencing on or after 1 January 2015.
Financial assets and financial liabilities are recognised in the Statement of Financial Position when the Company
becomes a party to the contractual provisions of the instrument. Financial assets and financial liabilities are only
offset and the net amount reported in the Statement of Financial Position and Statement of Comprehensive Income
when there is a currently enforceable legal right to offset the recognised amounts and the Company intends to settle on
a net basis or realise the asset and liability simultaneously.
The most significant accounting judgements made by management are deemed to be the fair value estimation of non
listed investments and consideration of the functional and presentational currency of the Company.
11

GOLDEN PROSPECT PRECIOUS METALS LIMITED
Notes to the Financial Statements (continued)
For the period ended 30 June 2014
2 SIGNIFICANT ACCOUNTING POLICIES (continued)
Financial assets
Loans and receivables
Financial assets at fair value
Classification
Recognition
Derecognition of financial assets
Measurement
A financial asset (in whole or in part) is derecognised either (i) when the Company has transferred substantially all the
risks and rewards of ownership, or (ii) when it has neither transferred nor retained substantially all the risks and
rewards and when it no longer has control over the asset or a proportion of the asset, or (iii) when the contractual right
to receive cash flows has expired. Any gain or loss on derecognition is taken to the Statement of Comprehensive
Income as appropriate.
Sales of investments awaiting settlement are sales of securities transacted before the period end with a post period end
settlement date.
The classification of financial assets at initial recognition depends on the purpose for which the financial asset was
acquired and its characteristics. All financial assets are initially recognised at fair value. All purchases of financial
assets are recorded at trade date, being the date on which the Company became party to the contractual requirements
of the financial asset. The Company has not classified any of its financial assets as Held to Maturity or as Available
for Sale. The Company's financial assets fall within the loans and receivables and financial assets at fair value
categories.
These are non-derivative financial assets with fixed or determinable payments that are not quoted in an active market.
They principally comprise of other receivables and cash and cash equivalents. These are subsequently measured at
amortised cost using the effective interest rate method, less any impairment. The effect of discounting is immaterial.
Cash and cash equivalents comprise cash on hand and demand deposits and other short-term highly liquid investments
with an original maturity of three months or less that are readily convertible to a known amount of cash and are
subject to an insignificant risk of changes in value.
All investments are classified as “financial assets at fair value”. These financial assets are designated by the Board of
Directors at fair value through profit or loss at inception.
Financial assets designated at fair value through profit or loss at inception are those that are managed and their
performance evaluated on a fair value basis in accordance with the Company’s documented investment strategy. The
Company’s policy is for the Investment Manager and the Board of Directors to evaluate the information about these
financial assets on a fair value basis together with other related financial information.
Purchases and sales of investments are recognised on the trade date, the date on which the Company commits to
purchase or sell the investment.
Financial assets at fair value are initially recognised at fair value. Subsequent to initial recognition, all financial assets
at fair value through profit or loss are measured at fair value. Gains and losses arising from changes in the fair value
of the ‘financial assets at fair value’ category are presented in the Statement of Comprehensive Income in the period in
which they arise.
Cash and cash equivalents
12

GOLDEN PROSPECT PRECIOUS METALS LIMITED
Notes to the Financial Statements (continued)
For the period ended 30 June 2014
2 SIGNIFICANT ACCOUNTING POLICIES (continued)
Financial assets at fair value (continued)
Fair value estimation
Fair value measurement hierarchy
Financial liabilities measured at amortised cost
Derecognition of financial liabilities
Interest income and expense
Income
Expenses
The classification of financial liabilities at initial recognition depends on the purpose for which the financial liability
was issued and its characteristics. All financial liabilities are initially recognised at fair value net of transaction costs
incurred. The Company's financial liabilities only consist of financial liabilities measured at amortised cost.
These include payables and other short-term monetary liabilities, which are initially recognised at fair value and
subsequently carried at amortised cost using the effective interest method. Bank borrowings are initially recognised at
fair value net of attributable transactions costs incurred. Such interest bearing liabilities are subsequently measured at
amortised cost using the effective interest method.
- Inputs for the asset or liability that are not based on observable market data (unobservable inputs) (Level 3).
The level in the fair value hierarchy within which the financial asset or financial liability is categorised is determined
on the basis of the lowest input that is significant to the fair value measurement. Financial assets and financial
liabilities are classified in their entirety into one of the three levels.
For financial instruments that are recognised at fair value on a recurring basis, the Board determines whether transfers
have occurred between levels in the hierarchy by re-assessing categorisation (based on the lowest level input that is
significant to the fair value measurement as a whole) at the end of each reporting period.
The fair value of financial assets traded in active markets is based on quoted market prices at the Statement of
Financial Position date. The quoted market price used for the financial assets held by the Company is the bid price at
the close of the respective market at the Statement of Financial Position date. Debt securities are carried at fair value
using discounted cashflow. Warrants are carried at fair value using standard Black Scholes valuation models. Further
details are disclosed in note 7.
Financial liabilities
All other income is accounted for on an accruals basis and is recognised in the Statement of Comprehensive Income.
Interest income and interest expense are recognised within the Statement of Comprehensive Income using the effective
interest rate method.
All other expenses are accounted for on an accruals basis.
IFRS 13 requires disclosure of fair value measurements by level of the following fair value measurement hierarchy:
- Quoted prices (unadjusted) in active markets for identical assets or liabilities (Level 1).
- Inputs other than quoted prices included within level 1 that are observable for the asset or liability, either directly
(that is, as prices) or indirectly (that is, derived from prices) (Level 2).
A financial liability (in whole or in part) is derecognised when the Company has extinguished its contractual
obligations, it expires or is cancelled. Any gain or loss on derecognition is taken to the Statement of Comprehensive
Income.
13

GOLDEN PROSPECT PRECIOUS METALS LIMITED
Notes to the Financial Statements (continued)
For the period ended 30 June 2014
2 SIGNIFICANT ACCOUNTING POLICIES (continued)
Capital reserves
Translation of foreign currency
Segmental reporting
3 TAXATION
4 DISTRIBUTION TO SHAREHOLDERS
5 RELATED PARTY TRANSACTIONS AND OTHER SIGNIFICANT AGREEMENTS
Related party transactions
Any share issue expenses will be treated as a deduction from equity in the Statement of Changes in Equity, and
written off against Share Premium. During the period there were no such expenses incurred (2013: £Nil).
Gains and losses recorded on the realisation of investments are accounted for in the Realised Capital Reserve.
Unrealised gains and losses recorded on the revaluation of investments held at the period end and unrealised exchange
differences on investments are accounted for in the Unrealised Capital Reserve.
Operating segments are reported in a manner consistent with the internal reporting provided to the Board. The chief
operating decision-maker, which is responsible for allocating resources and assessing performance of the operating
segments, has been identified as the Board of Directors of the Company.
Transactions in currencies other than the functional currency are recorded using the exchange rate prevailing at the
transaction date. Foreign exchange gains and losses resulting from the settlement of such transactions and those from
the translation at period end exchange rates of monetary assets and liabilities denominated in foreign currencies are
recognised in the Statement of Comprehensive Income.
The Company is exempt from taxation in Guernsey under the provisions of The Income Tax (Exempt Bodies)
(Guernsey) Ordinance 1989 and has paid an annual exemption fee of £600.
Share issue expenses
For management purposes, the Company is organised into one main operating segment, which invests in precious
metals securities which are principally listed on the stock exchanges of London, Toronto and Sydney. All of the
Company's activities are interrelated, and each activity is based upon analysis of the Company as one segment. On a
day to day basis investment decisions have been delegated to the Investment Manager, New City Investment
Managers.
The Company does not hold any non-current assets which require disclosure under IFRS 8. The Company also does
not have any external customers and therefore the disclosure of customers geographically required under IFRS 8 is not
applicable. However, for additional information, the fair value of each geographical base and the respective
percentages of the total value of the Company can be found in the Portfolio Statement beginning on page 25.
The Directors do not expect income (net of expenses) to be significant and do not currently expect to declare any cash
dividends. In the event that net income is significant, the Directors may consider the distribution of net income in the
form of cash dividends. To the extent that any cash dividends are paid, they will be paid in accordance with any
applicable laws and the regulations of the CISEAL.
Parties are considered to be related if one party has the ability to control the other party or exercise significant
influence over the other party in making financial or operational decisions.
14
GOLDEN PROSPECT PRECIOUS METALS LIMITED
Notes to the Financial Statements (continued)
For the period ended 30 June 2014
5 RELATED PARTY TRANSACTIONS AND OTHER SIGNIFICANT AGREEMENTS (continued)
Related party transactions
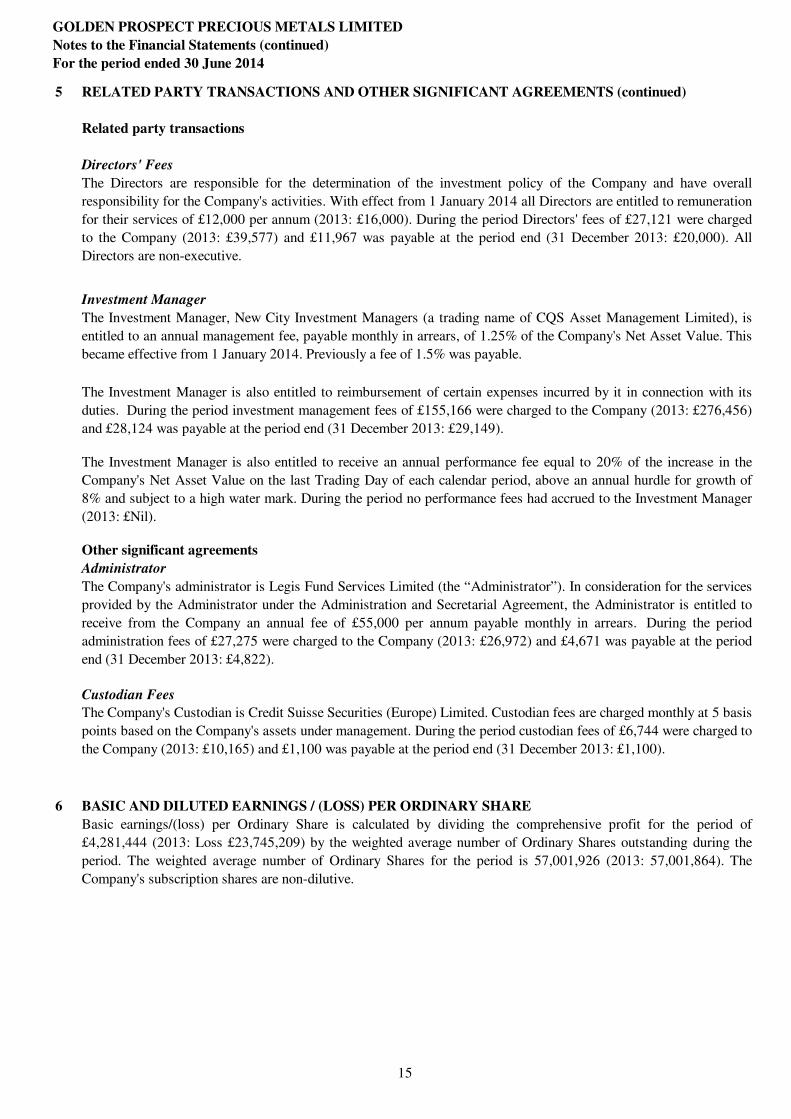
Directors' Fees
Investment Manager
Other significant agreements
Administrator
6 BASIC AND DILUTED EARNINGS / (LOSS) PER ORDINARY SHARE
The Company's Custodian is Credit Suisse Securities (Europe) Limited. Custodian fees are charged monthly at 5 basis
points based on the Company's assets under management. During the period custodian fees of £6,744 were charged to
the Company (2013: £10,165) and £1,100 was payable at the period end (31 December 2013: £1,100).
The Directors are responsible for the determination of the investment policy of the Company and have overall
responsibility for the Company's activities. With effect from 1 January 2014 all Directors are entitled to remuneration
for their services of £12,000 per annum (2013: £16,000). During the period Directors' fees of £27,121 were charged
to the Company (2013: £39,577) and £11,967 was payable at the period end (31 December 2013: £20,000). All
Directors are non-executive.
Custodian Fees
Basic earnings/(loss) per Ordinary Share is calculated by dividing the comprehensive profit for the period of
£4,281,444 (2013: Loss £23,745,209) by the weighted average number of Ordinary Shares outstanding during the
period. The weighted average number of Ordinary Shares for the period is 57,001,926 (2013: 57,001,864). The
Company's subscription shares are non-dilutive.
The Company's administrator is Legis Fund Services Limited (the “Administrator”). In consideration for the services
provided by the Administrator under the Administration and Secretarial Agreement, the Administrator is entitled to
receive from the Company an annual fee of £55,000 per annum payable monthly in arrears. During the period
administration fees of £27,275 were charged to the Company (2013: £26,972) and £4,671 was payable at the period
end (31 December 2013: £4,822).
The Investment Manager, New City Investment Managers (a trading name of CQS Asset Management Limited), is
entitled to an annual management fee, payable monthly in arrears, of 1.25% of the Company's Net Asset Value. This
became effective from 1 January 2014. Previously a fee of 1.5% was payable.
The Investment Manager is also entitled to reimbursement of certain expenses incurred by it in connection with its
duties. During the period investment management fees of £155,166 were charged to the Company (2013: £276,456)
and £28,124 was payable at the period end (31 December 2013: £29,149).
The Investment Manager is also entitled to receive an annual performance fee equal to 20% of the increase in the
Company's Net Asset Value on the last Trading Day of each calendar period, above an annual hurdle for growth of
8% and subject to a high water mark. During the period no performance fees had accrued to the Investment Manager
(2013: £Nil).
15

GOLDEN PROSPECT PRECIOUS METALS LIMITED
Notes to the Financial Statements (continued)
For the period ended 30 June 2014
7 INVESTMENTS AT FAIR VALUE
Fair Value Fair Value Fair Value
Level 1 Level 2 Total
£ £ £
Opening fair value at 1 January 2014 23,341,036 483,331 23,824,367
Purchases 8,566,263 280,651 8,846,914
Sales (7,523,117) - (7,523,117)
Gain / (loss)
- realised (884,512) - (884,512)
- unrealised 5,633,723 (125,324) 5,508,399
Closing fair value at 30 June 2014 29,133,393 638,658 29,772,051
Split by:
Listed equities 29,133,393 - 29,133,393
Bonds - 627,103 627,103
Warrants - 11,555 11,555
29,133,393 638,658 29,772,051
Fair Value Fair Value Fair Value
Level 1 Level 2 Total
£ £ £
Opening fair value at 1 January 2013 50,410,594 595,250 51,005,844
Purchases 22,058,919 - 22,058,919
Sales (22,664,757) (99,158) (22,763,915)
Gain / (loss)
- realised (7,739,962) 3,925 (7,736,037)
- unrealised (18,723,758) (16,686) (18,740,444)
Closing fair value at 31 December 2013 23,341,036 483,331 23,824,367
Split by:
Listed equities 23,341,036 - 23,341,036
Bonds - 452,707 452,707
Warrants - 30,624 30,624
23,341,036 483,331 23,824,367
Details of the significant accounting policies and methods adopted by the Company, including the criteria for
recognition, the basis of measurement and the basis on which income and expenses are recognised, in respect of its
financial assets and liabilities are disclosed in Note 2. The following table analyses the fair value of the Company's
financial assets and liabilities by category as defined in IFRS 13.
During the period there were no transfers between Level 1 and Level 2 fair value measurements, and no transfers into
or out of Level 3 fair value measurements.
Please refer to pages 25 - 26 for an analysis of financial assets at fair value through profit or loss which are disclosed
above.
16

GOLDEN PROSPECT PRECIOUS METALS LIMITED
Notes to the Financial Statements (continued)
For the period ended 30 June 2014
7 INVESTMENTS AT FAIR VALUE (continued)
Net gains/(losses) on financial assets at fair value through profit or loss: 01.01.14 01.01.13
to 30.06.14 to 30.06.13
£ £
Realised loss on financial assets
designated as at fair value through profit or loss (884,512) (4,768,394)
Net unrealised gain/(loss) on financial assets
designated as at fair value through profit or loss 5,508,399 (18,636,499)
Net capital gains/(losses) on financial assets £4,623,887 (£23,404,893)
Dividend income and interest on bonds 74,499 155,274
Total net gains/(losses) on financial assets £4,698,386 (£23,249,619)
Fair value
Item hierarchy level Valuation techniques
Level 1
Level 2
Level 2
8 CASH AND CASH EQUIVALENTS
Cash and cash equivalents comprise the following:
30.06.14 31.12.13
£ £
Cash at bank - 84,487
Bank overdraft (3,495,124) (1,892,549)
(£3,495,124) (£1,808,062)
Financial assets at fair value through
profit or loss - Listed equity securities
Overdraft interest is calculated on a daily basis using the one month Libor rate plus 175 basis points and is charged to
the Company on a monthly basis. In order to satisfy CSSEL of liquidity, a margin requirement is calculated to
establish a net equity and cash position that must be maintained as collateral. If the Company falls into deficit then
more funds are called. If the margin calls are not met then CSSEL can call in all outstanding funds. At no point during
the period did the Company fall into deficit and at the period end the Company held an excess over the margin
requirement of £14,255,946 (31 December 2013: £12,359,280).
Credit Suisse Securities (Europe) Limited ("CSSEL") may determine from time to time the overdraft limit it will
provide to the Company and may provide reasonable notice in writing of such an amount.
Financial assets at fair value through
profit or loss - Debt securities
Fair value is the quoted bid price.
Valuation techniques used in the determination of fair values, including the key inputs used, are as follows:
The fair value of Debt Securities is calculated as the
present value of the estimated future cash flows
based on observable gold price, time value and
discount rates.
The fair value of Warrants has been calculated using
the underlying listed prices, expiry dates and
observable future volatility.
The overdraft interest during the period of £62,339 (2013: £43,870) represents the only gain or loss on financial
liabilities measured at amortised cost.
Financial assets at fair value through
profit or loss - Warrants
17

GOLDEN PROSPECT PRECIOUS METALS LIMITED
Notes to the Financial Statements (continued)
For the period ended 30 June 2014
9 RECEIVABLES
30.06.14 31.12.13
£ £
Dividend income receivable 5,433 5,704
Bond interest receivable 181 5,723
Sales of investments awaiting settlement - -
General expenses prepaid 15,749 2,211
£21,363 £13,638
10 PAYABLES AND ACCRUALS
30.06.14 31.12.13
£ £
Administration fee payable 4,671 4,822
Directors' fees payable 11,967 20,000
Investment management fee payable 28,124 29,149
Bank overdraft interest 7,742 3,704
Audit fee 8,058 15,000
Custodian fee payable 1,100 1,100
Sundry creditor - 984
£61,662 £74,759
11 SHARE CAPITAL
Authorised Share Capital as at 30 June 2014 and 31 December 2013 No. of shares £
Ordinary Shares of £0.001 par value 200,000,000 £200,000
2014 2013 2014 2013
Issued and Fully Paid Share Capital £ £
Equity Shares
Ordinary Shares of £0.001 each at inception
As at 1 January 57,001,926 57,001,852 57,002 57,002
Issued during the period / year - 74 - -
As at 30 June / 31 December 57,001,926 57,001,926 57,002 57,002
Subscription shares of no par value each
As at 1 January 28,498,048 28,498,122 - -
Exercised during the period / year - (74) - -
As at 30 June / 31 December 28,498,048 28,498,048 - -
Ordinary Shareholders are entitled to one vote for each Ordinary Share held and are entitled to receive any
distributions declared by the Company. On a winding up, the Ordinary Shareholders shall be entitled, pro rata to their
holdings, to all the assets of the Company available for distribution to Shareholders.
The Directors consider that the carrying amount of receivables approximates their fair value due to their short term
nature.
The Directors consider that the carrying amount of payables and accruals approximates their fair value due to their
short term nature.
During the period no Shareholders have elected to exercise subscription shares (2013: 74).
No. of Shares Share Capital
18
GOLDEN PROSPECT PRECIOUS METALS LIMITED
Notes to the Financial Statements (continued)
For the period ended 30 June 2014
11 SHARE CAPITAL (continued)
12 RESERVES
Distributable Reserve
Realised Capital Reserve and Unrealised Capital Reserve
Revenue Reserve
13 FINANCIAL RISK MANAGEMENT
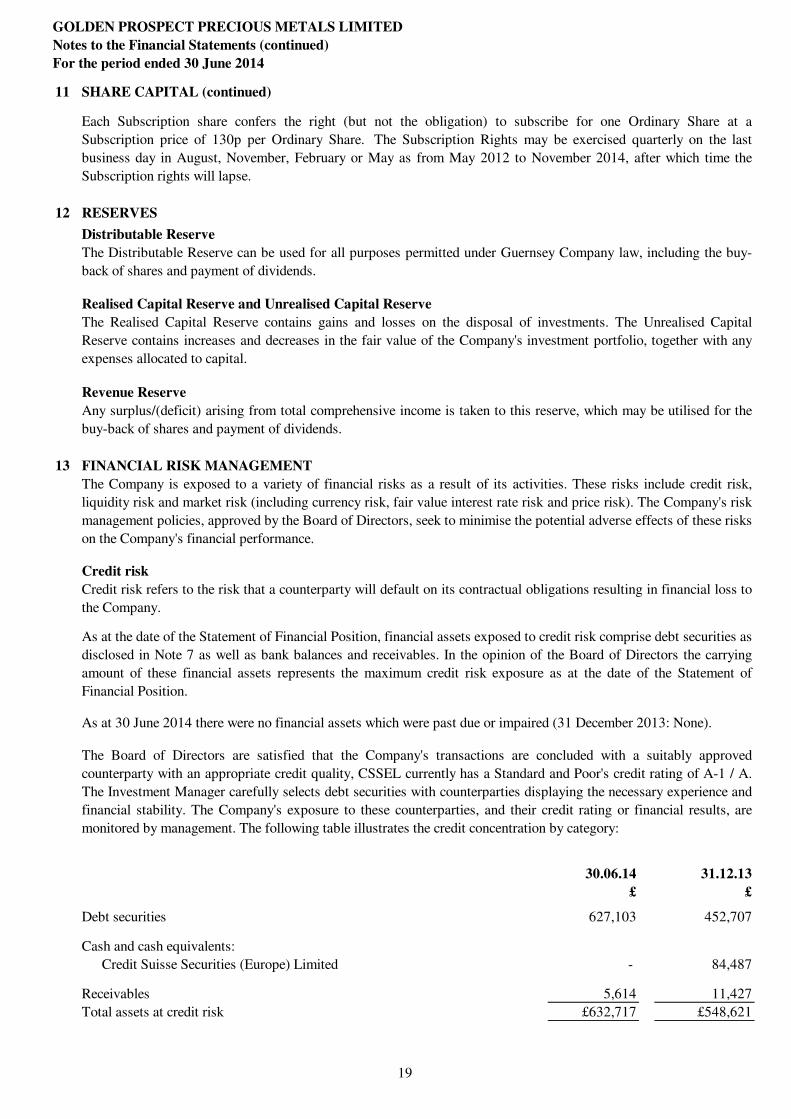
30.06.14 31.12.13
£ £
Debt securities 627,103 452,707
Cash and cash equivalents:
- 84,487
Receivables 5,614 11,427
Total assets at credit risk £632,717 £548,621
Credit risk
As at the date of the Statement of Financial Position, financial assets exposed to credit risk comprise debt securities as
disclosed in Note 7 as well as bank balances and receivables. In the opinion of the Board of Directors the carrying
amount of these financial assets represents the maximum credit risk exposure as at the date of the Statement of
Financial Position.
Credit Suisse Securities (Europe) Limited
Any surplus/(deficit) arising from total comprehensive income is taken to this reserve, which may be utilised for the
buy-back of shares and payment of dividends.
The Board of Directors are satisfied that the Company's transactions are concluded with a suitably approved
counterparty with an appropriate credit quality, CSSEL currently has a Standard and Poor's credit rating of A-1 / A.
The Investment Manager carefully selects debt securities with counterparties displaying the necessary experience and
financial stability. The Company's exposure to these counterparties, and their credit rating or financial results, are
monitored by management. The following table illustrates the credit concentration by category:
Each Subscription share confers the right (but not the obligation) to subscribe for one Ordinary Share at a
Subscription price of 130p per Ordinary Share. The Subscription Rights may be exercised quarterly on the last
business day in August, November, February or May as from May 2012 to November 2014, after which time the
Subscription rights will lapse.
As at 30 June 2014 there were no financial assets which were past due or impaired (31 December 2013: None).
The Company is exposed to a variety of financial risks as a result of its activities. These risks include credit risk,
liquidity risk and market risk (including currency risk, fair value interest rate risk and price risk). The Company's risk
management policies, approved by the Board of Directors, seek to minimise the potential adverse effects of these risks
on the Company's financial performance.
The Distributable Reserve can be used for all purposes permitted under Guernsey Company law, including the buy-
back of shares and payment of dividends.
The Realised Capital Reserve contains gains and losses on the disposal of investments. The Unrealised Capital
Reserve contains increases and decreases in the fair value of the Company's investment portfolio, together with any
expenses allocated to capital.
Credit risk refers to the risk that a counterparty will default on its contractual obligations resulting in financial loss to
the Company.
19

GOLDEN PROSPECT PRECIOUS METALS LIMITED
Notes to the Financial Statements (continued)
For the period ended 30 June 2014
13 FINANCIAL RISK MANAGEMENT (continued)
Liquidity risk
Less than 3 months 1 year 30.06.14
1 month 1-3 months to 1 year to 5 years Total
£ £ £ £ £
Gross settled:
Bank overdraft - 3,495,124 - 3,495,124
Bank overdraft interest 7,742 - - - 7,742
Investment management
fee payable 28,124 - - - 28,124
Administration fee payable 4,671 - - - 4,671
Directors' fees payable 11,967 - - - 11,967
Audit fee - - 8,058 - 8,058
Custodian fee payable 1,100 - - - 1,100
Sundry creditor - - - - -
£53,604 £3,495,124 £8,058 £- £3,556,786
Less than 3 months 1 year 31.12.13
1 month 1-3 months to 1 year to 5 years Total
£ £ £ £ £
Gross settled:
Bank overdraft - 1,892,549 - 1,892,549
Bank overdraft interest 3,704 - - - 3,704
Investment management
fee payable 29,149 - - - 29,149
Administration fee payable 4,822 - - - 4,822
Directors' fees payable 20,000 - - - 20,000
Audit fee - - 15,000 - 15,000
Custodian fee payable 1,100 - - - 1,100
Sundry creditor 984 - - - 984
£59,759 £1,892,549 £15,000 £- £1,967,308
Liquidity risk is the risk that the Company will encounter in realising assets or otherwise raising funds to meet
financial commitments.
CSSEL as Custodian has a fixed charge on all cash held by Credit Suisse, and all assets, in return for services
provided including execution of transactions, custody of investments and cash and financing. As per note 8 CSSEL
also calculates a margin requirement to establish a net cash and equity position that must be maintained as collateral.
As at the period end the Company had a significant excess over this margin requirement. Should there be a deficit at
any point CSSEL is entitled to call in all outstanding funds.
Whilst most of the Company's financial assets are listed securities which are considered readily realisable as they are
listed on major recognised stock exchanges, some of the financial assets held by the Company may not be listed on
recognised stock exchanges and so will not be readily realisable and their marketability may be restricted. The
Company might only be able to liquidate these positions at disadvantageous prices, should the Investment Manager
determine, or it become necessary, to do so.
The following table details the Company's liquidity analysis for its financial liabilities. The table has been drawn up
based on the undiscounted net cash flows on the financial liabilities that settle on a net basis and the undiscounted
gross cash flows on those financial liabilities that require gross settlement.
20

GOLDEN PROSPECT PRECIOUS METALS LIMITED
Notes to the Financial Statements (continued)
For the period ended 30 June 2014
13 FINANCIAL RISK MANAGEMENT (continued)
Liquidity risk (continued)
Price risk
Price sensitivity
Interest rate risk
The Company expects to meet its other obligations for operating cash flows at the Statement of Financial Position
date. The Company expects to maintain current debt to equity security ratio of 30%.
The Investment Manager manages liquidity on a daily basis. The Company's overall exposure to liquidity risk is
monitored by the Board of Directors on a quarterly basis.
Price risk is the risk that the fair value of future cash flows of a financial instrument will adversely fluctuate because
of changes in market prices (other than those arising from interest rate risk or currency risk).
The Company is exposed to market price risk arising from its financial assets designated as at fair value through
profit or loss. The performance of these financial assets will be affected by the performance of the investee
companies. The exploration, development and production of metal and mineral deposits involves significant
uncertainties and the investee companies will be subject to all the hazards and risks normally encountered in such
activities. Many of these are difficult to predict and are outside the control of the investee companies. They include,
amongst others, issues relating to the environment, the climate, the geopolitical environment, local and international
regulatory requirements, licensing terms, planning permission, unexpected geological formations, rock falls, flooding,
pollution, legal liabilities, the availability and reliability of plant and equipment, the scaling-up of operations, the
reliance on key individuals, local finance and tax regimes, foreign currency repatriation, capital and budget
constraints, contractors and suppliers, local employment regulations and practices, employment unions and the
availability of suitable labour. In addition, there is often no guarantee that the estimates of quantities and grades of
metals and minerals disclosed by investee companies will be available for extraction.
The Company's financial assets are exposed to market price fluctuations which are monitored by the Investment
Manager in pursuance of the Company's investment objectives and policies. Adherence to investment guidelines and
to investment and borrowing powers set out in the Placing and Offer for Subscription document mitigates the risk of
excessive exposure to any particular type of security or issuer. However, with respect to the investment strategy
utilised by the Company there is always some, and occasionally some significant, degree of market risk.
The value of the Company's financial assets had a sensitivity of £5,954,410 (31 December 2013: £4,764,873) to a
20% increase or decrease in the market prices with other variables being held constant as at 30 June 2014. A 20%
change is the sensitivity rate currently used when reporting price risk internally to key management personnel.
Market risk
The Company's activities expose it primarily to the market risks of changes in market prices, interest rates and foreign
currency exchange rates.
Interest rate risk is the risk that the fair value or future cash flows of a financial instrument will fluctuate because of
changes in market interest rates.
The Company is directly exposed to interest rate risk as it has cash and cash equivalents which are invested at short
term rates and debt securities which receive interest at a fixed rate. The Investment Manager manages the Company's
exposure to interest rate risk on a daily basis in accordance with the Company's investment objectives and policies.
The Company's overall exposure to interest rate risk is monitored on a quarterly basis by the Board of Directors.
21

GOLDEN PROSPECT PRECIOUS METALS LIMITED
Notes to the Financial Statements (continued)
For the period ended 30 June 2014
13 FINANCIAL RISK MANAGEMENT (continued)
Interest rate risk (continued)
As at 30 June 2014
0-3 Months 1-5 Years Total
£ £ £
Fixed rate assets
Debt securities - 274,095 274,095
Total interest bearing assets - 274,095 274,095
Variable rate liabilities
Bank overdraft 3,495,124 - 3,495,124
Total interest bearing liabilities 3,495,124 - 3,495,124
As at 31 December 2013
0-3 Months 1-5 Years Total
£ £ £
Variable rate assets
Cash and cash equivalents 84,487 - 84,487
Fixed rate assets
Debt securities - 452,707 452,707
Total interest bearing assets 84,487 452,707 537,194
Variable rate liabilities
Bank overdraft 1,892,549 - 1,892,549
Total interest bearing liabilities 1,892,549 - 1,892,549
All other assets and liabilities of the Company are non interest bearing.
Interest rate sensitivity
The sensitivity analysis below has been determined based on the Company's exposure to interest rates for interest
bearing assets and liabilities at the date of the Statement of Financial Position and the stipulated change taking place
at the beginning of the financial period and held constant throughout the reporting period in the case of instruments
that have floating rates.
If interest rates had been 25 basis points higher or lower and all other variables had been held constant, the
Company’s net assets attributable to holders of Ordinary Shares for the period would have been £6,410 (2013:
£4,930) higher or lower due to the change in the interest payable on the bank loan and the interest receivable on cash
and cash equivalents.
The following table analyses the Company’s interest rate risk exposure. The Company’s assets and liabilities are
included at fair value and categorised by the earlier of contractual re-pricing or maturity dates.
Returns from debt securities are fixed at the time of purchase, as the fixed coupon payments are known, as are the
final redemption proceeds. Consequentially, if such a debt security is held until its redemption date, the total return
achieved is unaltered from its purchase date. However over its life the market price at any given time will depend on
the market environment at that time. Therefore, a debt security sold before its redemption date is likely to have a
different price from its purchase level and a profit or loss may be incurred. Interest rate risk on fixed interest debt
securities is considered to be part of market price risk as disclosed above.
22

GOLDEN PROSPECT PRECIOUS METALS LIMITED
Notes to the Financial Statements (continued)
For the period ended 30 June 2014
13 FINANCIAL RISK MANAGEMENT (continued)
Currency risk
Assets Liabilities Assets Liabilities
£ £ £ £
Australian Dollar (AUD) 5,617,065 (8,557) 3,835,283 (399)
Canadian Dollar (CAD) 16,733,786 - 12,443,751 -
United States Dollar (USD) 3,290,995 - 3,610,005 -
Swiss Franc (CHF) 189 - 195 -
25,642,035 (8,557) 19,889,234 (399)
Foreign currency sensitivity
The Company is mainly exposed to AUD, CAD and USD.
AUD CAD USD
£ £ £
Change in net assets in response to a 623,167 1,859,310 365,666
10% change in foreign currency rates (509,865) (1,521,253) (299,181)
AUD CAD USD
£ £ £
Change in net assets in response to a 426,098 1,382,639 401,111
10% change in foreign currency rates (348,626) (1,131,250) (328,182)
30.06.14
30.06.14
The following table details the Company's sensitivity to a 10% increase or decrease in Sterling against the relevant
foreign currencies. A 10% change is the sensitivity rate currently used when reporting foreign currency risk internally
to key management personnel. The sensitivity analysis includes only outstanding foreign currency denominated
financial assets and financial liabilities and adjusts their translation at the period end for a 10% change in foreign
currency rates. A positive number indicates an increase in net assets attributable to holders of Ordinary Shares where
Sterling weakens against the relevant currency and a negative number indicates a decrease in net assets where Sterling
strengthens against the relevant currency.
Currency risk is the risk that the fair value or future cash flows of a financial instrument will fluctuate because of
changes in foreign currency exchange rates. The presentation currency of the Company is Sterling. The majority of the
Company’s financial assets are currently denominated in various currencies other than Sterling and the Company may
hold other financial instruments, the price of which may be determined with reference to currencies other than
Sterling.
To the extent that these financial instruments are unhedged, or are not adequately hedged, the value of the Company's
financial instruments may fluctuate with exchange rates as well as with price changes in various local markets and
currencies. The value of the financial assets may therefore be affected unfavourably by fluctuations in currency rates
and exchange control regulations. The Investment Manager has the power to manage exposure to currency
movements by using hedging instruments. The Investment Manager’s treatment of currency transactions is set out in
Note 2 to the Financial Statements under "Translation of foreign currency".
There were no hedging instruments held at period end or used in the period (31 December 2013: None).
The carrying amount of the Company's foreign currency denominated financial assets and financial liabilities at the
date of the Statement of Financial Position was as follows:
31.12.13
31.12.13
23

GOLDEN PROSPECT PRECIOUS METALS LIMITED
Notes to the Financial Statements (continued)
For the period ended 30 June 2014
13 FINANCIAL RISK MANAGEMENT (continued)
Capital Management
The Company is not exposed to any externally imposed capital requirements.
14 CONTINGENT LIABILITIES
There were no contingent liabilities at the Statement of Financial Position date.
15 EVENTS AFTER THE REPORTING DATE
16 CONTROLLING PARTY
17 NAV RECONCILIATION
30.06.14 31.12.13
Net Asset Value per financial statements £26,236,628 £21,955,184
Number of shares in issue 57,001,926 57,001,926
Unaudited NAV per Ordinary Share 46.03p 38.52p
Issued NAV per Ordinary Share 46.42p 38.83p
With effect from 22 July 2014 the Company has entered into arrangements necessary to ensure compliance with
AIFMD. On this date the Board approved the appointment of CQS Asset Management Limited (“CQS”) as the
Company’s alternative investment fund manager (“AIFM”) on the terms of, and subject to the conditions of, a new
investment management agreement between the Company, CQS and CQS Cayman Limited Partnership. The
Management fee and notice period are unchanged.
The Board also authorised the appointment of Legis Depositary Services Limited (“LDSL”) to act as the Company’s
depositary to perform its duties in accordance with AIFMD. A depositary agreement between the Company, CQS and
LDSL entitles LDSL to a fee, payable by the Company, of 0.02% of the Net Asset Value of the Company per annum
up to £175 million, subject to a minimum fee of £1,000 per month.
The difference in NAV per Ordinary Share relates to the pricing of the Portfolio which is valued at mid price for
valuation purposes and bid price for accounting purposes under IFRS.
The issued Ordinary Shares of the Company are owned by numerous parties and therefore, in the opinion of the
Directors, there is no immediate or ultimate controlling party of the Company.
The primary objective of the Company’s capital management is to ensure that it maintains shareholder value and that
it is able to continue as a going concern. The Company manages its capital structure and, where necessary, makes
adjustments to it in light of changes in economic conditions. The Company’s overall strategy remains unchanged from
the prior period.
The capital structure of the Company consists of net debt, as disclosed in note 8 and equity as per note 11.
24

GOLDEN PROSPECT PRECIOUS METALS LIMITED
Portfolio Statement
As at 30 June 2014
Fair
Value % of Total
Description Holding £ Net Assets
Equities
Australia
Ausgold Ltd 3,375,000 85,540 0.33%
Beadell Resources Ltd 5,485,000 1,828,385 6.97%
Gascoyne Resources 1,200,000 66,118 0.25%
Independence Group 430,000 1,021,131 3.89%
Lachlan Star Ltd 600,000 28,100 0.11%
Perseus Mining Ltd 1,931,451 441,639 1.68%
Phoenix Gold Ltd 3,076,924 245,822 0.94%
Regis Resources Ltd 500,000 449,049 1.71%
Resolute Mining Ltd 4,250,000 1,440,124 5.49%
5,605,908 21.37%
Canada
Asanko Gold Inc 640,857 973,134 3.71%
Anvil Mining Ltd 350,000 147,737 0.56%
Aureus Mining Inc 1,111,500 275,096 1.05%
Brazil Resources Inc 500,000 263,131 1.00%
Castle Mountain Mining Corp 1,850,000 659,199 2.51%
Endeavour Mining Corp 1,835,000 794,685 3.03%
First Majestic Silver Corp 275,000 1,736,668 6.62%
Fortuna Silver Mines 549,500 1,750,151 6.67%
Kennady Diamonds Inc 102,631 315,064 1.20%
Klondex Mines Ltd 509,100 555,377 2.12%
Mandalay Resources 3,220,000 1,888,735 7.20%
Royal Canadian Mint 51,800 429,470 1.64%
Affero Mining Inc 325,000 894,373 3.41%
New Gold Inc 200,000 736,768 2.81%
Pilot Gold Inc 275,000 220,099 0.84%
Perseus Mining Ltd 1,242,500 303,101 1.16%
Polar Star Mining Corp 2,347,500 77,213 0.29%
Rio Alto Mining Ltd 300,000 401,276 1.53%
Santacruz Silver Mining Ltd 1,448,000 746,153 2.84%
Silver Wheaton Corp 89,917 1,378,195 5.25%
Tahoe Resources Inc 65,000 985,948 3.76%
Timmins Gold Corp 900,000 927,539 3.54%
16,459,112 62.74%
United Kingdom
Fresnillo Plc 234,000 2,039,310 7.77%
Sovereign Mines of Africa 2,400,000 22,800 0.09%
ETFS Physical Palladium 24,750 1,182,293 4.51%
DB Physical Rhodium 904 56,197 0.21%
ETFS Phys Platinum 10,000 837,221 3.19%
Sovereign Bauxite of Guinea Limited 100,000 - 0.00%
4,137,821 15.77%25

Portfolio Statement (continued)
As at 30 June 2014
Fair
Value % of Total
Holding £ Net Assets
United States
Continental Gold Ltd 600,000 1,124,887 4.28%
SPDR Gold Trust 15,000 1,121,733 4.28%
ETFS Palladium Trust 7,000 334,795 1.28%
PPL Corporation 7,000 311,425 1.19%
ZKB Gold 50 37,712 0.14%
2,930,552 11.17%
Total Equities 29,133,393 111.05%
Warrants
African MI EQW 01 Jan 00 2,500,000 - 0.00%
Gran Colombia Gold 7,500 - 0.00%
Aureus Mng Wts 187,500 - 0.00%
Ausgold EQW 15/05/15 1,125,000 11,157 0.04%
Gran Colombia Gold Corp 15,000 247 0.00%
Kinross Gold Corp 13,750 151 0.00%
Pan Am EQW 12 Jul 01 20,000 - 0.00%
Total Warrants 11,555 0.04%
Bonds
Canada
Maya Gold and Silver Inc 8% 31 Dec 2016 500,000 274,095 1.04%
Gran Colombia Gold Corp 10% 31 Oct 2017 750,000 353,008 1.35%
Total Bonds 627,103 2.39%
Total investments 29,772,051 113.48%
Other current assets less current liabilities (3,535,423) (13.48%)
Total Net Assets £26,236,628 100.00%
GOLDEN PROSPECT PRECIOUS METALS LIMITED
26

GOLDEN PROSPECT PRECIOUS METALS LIMITED
Management and Administration
Directors all of
Malcolm Alec Burne Registered office
Kaare Glenne Foy 11 New Street
Robert Paul King St Peter Port
Toby Birch (appointed 3 April 2014) Guernsey
John Bowles (resigned 3 April 2014 ) GY1 2PF
Paul Craig (resigned 3 April 2014)
Details available at - www.ncim.co.uk
Legis Fund Services Limited Nplus 1 Singer Limited
11 New Street One Bartholomew Lane
St Peter Port London
Guernsey EC2N 2AX
GY1 2PF
Investment Manager
Limited)
5th
Floor
33 Chester Street
London
SW1X 7BL
Auditor to the Company
Rue du Pré London
St. Peter Port E14 4QJ
Guernsey
GY1 3LL
Babbé Lawrence Graham LLP
18-20 Smith Street 4 More London Riverside
St Peter Port London
Guernsey SE1 2AU
GY1 4BL
Registrar and CREST Agent
Capita Registrars (Guernsey) Limited
Mont Crevelt House
Bulwer Avenue
St Sampson
Guernsey
GY2 4LH
Nplus 1 Singer Limited KBC Peel Hunt
One Bartholomew Lane 111 Old Broad Street
London EC2N 2AX London EC2N 1PH
Winterflood Securities Cantor Fitzgerald Europe
25 Dowgate Hill 17 Crosswall
London EC4R 2GA London EC3N 2LB
Financial Adviser and Broker to the Company
CQS Cayman Limited Partnership New City Investment Managers
Gardenia
(a trading name of CQS Asset Management
Secretary, Administrator and CISEAL Sponsor
Camana Bay
Grand Cayman KY1-1104
Credit Suisse Securities (Europe) Limited
P.O. Box 242
Custodian and Principal Bankers
45 Market Street
Note: The Company has appointed CQS as its investment manager. However, CQS has, with the agreement of the Board, delegated that function to NCIM.
BDO Limited
Advocates to the Company as to Guernsey Law Solicitors to the Company as to English Law
Market Makers
Cayman Islands
P O Box 180 One Cabot Square
27