Embed Size (px)
Citation preview

GOLDMAN SACHS BANK EUROPE SE
Pillar 3 Disclosures
December 2020 | Pillar 3 Disclosures 1
Goldman Sachs Bank Europe SE
Pillar 3
Disclosures
For the period ended December 31, 2020

GOLDMAN SACHS BANK EUROPE SE
Pillar 3 Disclosures
December 2020 | Pillar 3 Disclosures 2
TABLE OF CONTENTS
Page No.
Introduction ....................................................................................................................................................................... 5 Risk Management ........................................................................................................................................................... 10 Capital Framework .......................................................................................................................................................... 14 Regulatory Capital .......................................................................................................................................................... 15 Risk-Weighted Assets ..................................................................................................................................................... 16 Credit Risk ..................................................................................................................................................................... 17 Securitisations ............................................................................................................................................................... 25 Market Risk ..................................................................................................................................................................... 27 Interest Rate Sensitivity .................................................................................................................................................. 31 Operational Risk ............................................................................................................................................................. 32 Model Risk ...................................................................................................................................................................... 34 Leverage Ratio .............................................................................................................................................................. 35 Capital Adequacy ........................................................................................................................................................... 39 Own Funds Template ..................................................................................................................................................... 40 Countercyclical Capital Buffer Template ........................................................................................................................ 41 Capital Instruments ......................................................................................................................................................... 42 Governance Arrangements............................................................................................................................................. 43 Liquidity Risk Management ............................................................................................................................................ 46 Asset Encumbrance ........................................................................................................................................................ 49 Remuneration Disclosures.............................................................................................................................................. 53 Cautionary Note on Forward-Looking Statements ......................................................................................................... 59 Glossary .......................................................................................................................................................................... 60 Appendix I: Scope of Consolidation Tables .................................................................................................................... 62 Appendix II: Credit Risk Tables ...................................................................................................................................... 64 Appendix III: Counterparty Credit Risk Tables ............................................................................................................... 72 Appendix IV: Past Due Exposures, Impaired Exposures and Impairment Provisions Tables ....................................... 74 Appendix V: Index of Tables to EBA Templates ............................................................................................................ 75

GOLDMAN SACHS BANK EUROPE SE
Pillar 3 Disclosures
December 2020 | Pillar 3 Disclosures 3
INDEX OF TABLES
Page No. Table 1: Minimum Regulatory Capital Ratios ................................................................................................................. 14 Table 2: Regulatory Capital Ratios ................................................................................................................................. 15 Table 3: Regulatory Capital ........................................................................................................................................... 15 Table 4: Reconciliation to Balance Sheet ....................................................................................................................... 15 Table 5: Overview of RWAs .......................................................................................................................................... 16 Table 6: Analysis of CCR Exposure by Approach ......................................................................................................... 19 Table 7: Exposures to CCPs .......................................................................................................................................... 19 Table 8: CVA VaR Capital Charge ................................................................................................................................ 20 Table 9: RWA Flow Statements of CCR Exposures under the IMM ............................................................................. 20 Table 10: Total and Average Net Amount of Exposures ............................................................................................... 20 Table 11: CRM Techniques ........................................................................................................................................... 22 Table 12: Credit Derivatives Exposures ......................................................................................................................... 22 Table 13: Securitisation Exposures by Type .................................................................................................................. 26 Table 14: Securitisation Exposures and Related RWAs by Risk Weight Bands ............................................................ 26 Table 15: IMA values for trading portfolios ..................................................................................................................... 28 Table 16: Market Risk under the IMA ............................................................................................................................. 29 Table 17: RWA flow statements of market risk exposures under the IMA ..................................................................... 29 Table 18: Comparison of VaR estimates with gains/losses ........................................................................................... 30 Table 19: Market Risk under the Standardised Approach ............................................................................................. 31 Table 20: Operational Risk Capital Requirement ............................................................................................................ 33 Table 21: Leverage Ratio ............................................................................................................................................... 35 Table 22: Summary Reconciliation of Accounting Assets and Leverage Ratio Exposures ........................................... 36 Table 23: On-Balance Sheet Exposures ........................................................................................................................ 36 Table 24: Leverage Ratio Common Disclosure .............................................................................................................. 37 Table 25: Own Funds Disclosure .................................................................................................................................. 40 Table 26: Countercyclical Capital Buffer ........................................................................................................................ 41 Table 27: Geographical Distribution of Credit Exposures Relevant for the Calculation of the Buffer ............................ 41 Table 28: GSBE Capital Instruments’ Main Features Template .................................................................................... 42 Table 29a: GSBE Executive Board of Directors ............................................................................................................. 44 Table 29b: GSBE Supervisory Board of Directors ......................................................................................................... 45 Table 30: Liquidity Coverage Ratio ................................................................................................................................ 46 Table 31: Encumbered and Unencumbered Assets ....................................................................................................... 49 Table 32: Components of Encumbered and Unencumbered Assets ............................................................................. 50 Table 33: Collateral Received ........................................................................................................................................ 50 Table 34: Components of Collateral Received ............................................................................................................... 51 Table 35: Sources of Encumbrance ............................................................................................................................... 51 Table 36: Senior Management and Other Risk Takers .................................................................................................. 58 Table 37: Remuneration Band ........................................................................................................................................ 58 Table 38: Differences Between Accounting and Regulatory Scopes of Consolidation and Mapping of Financial
Statement Categories with Regulatory Risk Categories ............................................................................................... 62 Table 39: Main Sources of Differences Between Regulatory Exposures Amounts and Carrying Values in Financial
Statements ..................................................................................................................................................................... 63 Table 40: Geographical Breakdown of Exposures ........................................................................................................ 64 Table 41: Concentration of Exposures by Industry or Counterparty Types .................................................................. 65 Table 42: Maturity of Exposures .................................................................................................................................... 66 Table 43: Credit Quality of Exposures by Exposure Class and Instrument ................................................................... 67 Table 44: Credit Quality of Exposures by Industry or Counterparty Types ................................................................... 68 Table 45: Credit Quality of Exposures by Geography ................................................................................................... 68 Table 46: Standardised Approach - Credit Risk Exposure and CRM Effects ............................................................... 69

GOLDMAN SACHS BANK EUROPE SE
Pillar 3 Disclosures
December 2020 | Pillar 3 Disclosures 4
Table 47: Standardised Approach .................................................................................................................................. 69 Table 48: Credit quality of performing and non-performing exposures by past due days .............................................. 70 Table 49: Performing and non-performing exposures and related provisions ............................................................... 71 Table 50: Impact of Netting and Collateral Held on Exposure Values .......................................................................... 72 Table 51: Composition of Collateral for Exposures to CCR .......................................................................................... 72 Table 52: Standardised approach – CCR exposures by regulatory portfolio and risk ................................................... 73 Table 53: Changes in the Stock of General and Specific Credit Risk Adjustments ...................................................... 74

GOLDMAN SACHS BANK EUROPE SE
Pillar 3 Disclosures
December 2020 | Pillar 3 Disclosures 5
Introduction
Overview
Goldman Sachs Bank Europe SE (GSBE or the bank)
provides a wide range of financial services to a diversified
client base that includes corporations, financial institutions,
and ultra-high-net-worth individuals, from its registered
office in Frankfurt am Main and branches in Amsterdam,
Copenhagen, Dublin, London, Luxembourg, Madrid, Milan,
Paris, Stockholm and Warsaw1.
GSBE is primarily supervised by the European Central Bank
(ECB) within the context of the European Single Supervisory
Mechanism, the Federal Financial Supervisory Authority
(BaFin) and the Deutsche Bundesbank.
The bank’s ultimate parent undertaking and controlling entity
is The Goldman Sachs Group, Inc. (Group Inc.). Group Inc.
is a bank holding company and a financial holding company
regulated by the Board of Governors of the Federal Reserve
System (FRB). In relation to the bank, “group undertaking”
means Group Inc. or any of its subsidiaries. Group Inc.,
together with its consolidated subsidiaries, form “GS Group”
(also referred to as the firm). GS Group is a leading global
investment banking, securities and investment management
firm that provides a wide range of financial services to a
substantial and diversified client base that includes
corporations, financial institutions, governments and
individuals. GS Group’s purpose is to advance sustainable
economic growth and financial opportunity. GS Group’s
goal, reflected in the One Goldman Sachs initiative, is to
deliver its full range of services and expertise to support its
clients in a more accessible, comprehensive and efficient
manner, across business and product areas. The sole
shareholder of GSBE is Goldman Sachs (Cayman) Holding
Company with its registered office in George Town, Cayman
Islands. On July 1, 2021 Goldman Sachs (Cayman) Holding
Company distributed 100% of it’s shareholding in GSBE to
The Goldman Sachs Group, Inc. which in turn contributed the
full shareholding to Goldman Sachs Bank USA. As such
with effect from July 1, 2021 the sole shareholder is Goldman
Sachs Bank USA, with its registered office in New York,
United States. Goldman Sachs Bank Europe SE is registered
in Frankfurt am Main with the register number HRB 114190.
The capital requirements are expressed as risk-based capital
and leverage ratios that compare measures of regulatory
capital to risk-weighted assets (RWAs), average assets and
1 https://www.goldmansachs.com/disclosures/gsbese-related-
disclosures/Legal_and_Regulatory_Information.pdf
off-balance-sheet exposures. Failure to comply with these
capital requirements could result in restrictions being
imposed by our regulators and could limit our ability to
repurchase shares, pay dividends and make certain
discretionary compensation payments. GSBE’s capital levels
are also subject to qualitative judgements by our regulators
about components of capital, risk weightings and other
factors.
For information on Group Inc.’s financial statements and
regulatory capital ratios, please refer to the firm’s annual
Pillar 3 Disclosures and Annual Report on Form 10-K.
References to the “2020 Form 10-K” are to the firm’s Annual
Report on Form 10-K for the year ended December 31, 2020.
https://www.goldmansachs.com/investor-
relations/financials/current/other-information/4q-pillar3-
2020.pdf
https://www.goldmansachs.com/investor-
relations/financials/current/10k/2020-10-k.pdf
GSBE’s regulatory capital requirement has been calculated in
accordance with the E.U. Capital Requirements Directive
(CRD) and the E.U. Capital Requirements Regulation (CRR).
These are largely based on the Basel Committee on Banking
Supervision’s (Basel Committee) final capital framework for
strengthening international capital standards (Basel III),
which is structured around three pillars: Pillar 1 “minimum
capital requirements”, Pillar 2 “supervisory review process”
and Pillar 3 “market discipline”.
GSBE’s Pillar 3 disclosures published for December 31,
2020 have been prepared in accordance with the EBA
Guidelines on disclosure requirements under Part 8 of the
CRR published in December 2016.
As of December 31, 2020, GSBE has Nil exposures to
disclose pursuant to the guidelines (EBA/GL/2020/07) on
disclosure of exposures subject to measures applied in
response to the Covid-19 crisis, as such the required tables
have not been included in this document.
The Pillar 3 disclosures have been published both in English
and German languages following the publication of the
GSBE’s 2020 IFRS Financial Information and GSBE’s 2020
Financial Statements. Both documents can be accessed via
the following link:
https://www.goldmansachs.com/investor-
relations/financials/subsidiary-financial-info/gsbe/index.html

GOLDMAN SACHS BANK EUROPE SE
Pillar 3 Disclosures
December 2020 | Pillar 3 Disclosures 6
GSBE has received permission according to Article 24(2)
CRR from the competent authorities to change its accounting
standard for prudential purposes from German GAAP (HGB)
to International Financial Reporting Standards (IFRS) during
2020. The aim of which is to enhance transparency and
comparability for stakeholders. Impacts of this GAAP change
are further commented as relevant in the respective sections
of this document. In addition, GSBE continues to prepare its
statutory financial statements in accordance with HGB.
Measures of exposures and other metrics disclosed in this
report may not be based on International Financial Reporting
Standards (IFRS), may not be directly comparable to
measures reported in financial statements, and may not be
comparable to similar measures used by other companies.
Basis of Consolidation
GSBE and its subsidiaries are indirectly wholly-owned by the
parent company, Group Inc. and included in its consolidated
financial statements.
Due to immateriality of its subsidiaries pursuant to Section
296 (2) of HGB, GSBE waives its obligation from preparing
consolidated financial statements. However, the subsidiaries
are consolidated according to the equity method in the IFRS
financial information and no fair values are disclosed
separately.
The subsidiaries are:
Goldman, Sachs & Co. Verwaltungs GmbH
Goldman Sachs Gives Gemeinnützige GmbH
Goldman, Sachs Management GP GmbH
The additional information to be disclosed in accordance with
Section 26(a) of the German Banking Act
(Kreditwesengesetz; in the following, "KWG") was also
included in GSBE’s 2020 Financial Statements under the
section of “Branches of the Bank” within Note 20.
GSBE is considered the parent company of a group under §
10a of KWG. Its subsidiary Goldman, Sachs Management
GP GmbH, Frankfurt am Main, a financial corporation
according to § 1 Abs 3 KWG, may in line with Article 19
CRR be exempted from the scope of consolidation so that, in
accordance with Article 11 of CRR, there is no requirement
for a regulatory consolidation, and the rules on disclosure
obligations on a consolidated basis under Article 13 do not
apply. Therefore, these disclosures are prepared for GSBE on
a stand-alone basis.
Restrictions on the Transfer of Funds or Regulatory Capital within the Firm
Group Inc. is a holding company and, therefore, utilises
dividends, distributions and other payments from its
subsidiaries to fund dividend payments and other payments
on its obligations, including debt obligations. Regulatory
capital requirements, as well as other provisions of applicable
law and regulations restrict Group Inc.’s ability to withdraw
capital from its regulated subsidiaries.
A transfer of funds between GSBE and its subsidiaries is
considered immaterial and therefore we don’t elaborate on
this further.
For information regarding the capital adequacy of GSBE, see
“Risk Report - Capital Adequacy” within “Management
Report” of GSBE’s 2020 Financial Statements.
For further information about restrictions on the transfer of
funds within Group Inc. and its subsidiaries, see “Note 20.
Regulation and Capital Adequacy” in Part II, Item 8
“Financial Statements and Supplementary Data” and “Risk
Management - Liquidity Risk Management” and “Equity
Capital Management and Regulatory Capital” in Part II, Item
7 “Management’s Discussion and Analysis of Financial
Condition and Results of Operations” in the firm’s 2020
Form 10-K.
Definition of Risk-Weighted Assets
The risk weights used in the calculation of RWAs reflect an
assessment of the riskiness of our assets and exposures.
These risk weights are based on predetermined levels set by
regulators. The relationship between available capital and
capital requirements can be expressed in the form of a ratio,
and capital requirements are arrived at by dividing RWAs by
12.5. Minimum capital ratios set out in Table 1 are higher as
they include the impact of additional buffers.
Fair Value
Financial assets that are not held for the collection of
contractual cash flows or do not have cash flows that
represent solely payments of principal and interest are
mandatorily measured at fair value through profit or loss.
Financial assets mandatorily measured at fair value are
initially measured at fair value with transaction costs
expensed in the income statement. Such financial assets are
subsequently measured at fair value with gains or losses
recognised in net revenues.

GOLDMAN SACHS BANK EUROPE SE
Pillar 3 Disclosures
December 2020 | Pillar 3 Disclosures 7
Financial liabilities held for trading are initially measured at
fair value and subsequently at fair value through profit or
loss, with gains or losses recognised in net revenues.
Financial liabilities held for trading include trading liabilities,
which consists of trading cash instruments and derivative
instruments.
The bank also designates certain financial liabilities at fair
value through profit or loss. Financial liabilities designated at
fair value through profit or loss are initially measured at fair
value and subsequently at fair value through profit or loss,
with Debt Valuation Adjustment (DVA) being recognised in
other comprehensive income, if it does not create or enlarge
an accounting mismatch, and the remaining changes in the
fair value being recognised in net revenues. Amounts
recognised in other comprehensive income attributable to
own credit spreads are not subsequently transferred to the
income statement, even upon derecognition of the financial
liability. Gains or losses exclude contractual interest, which is
included in interest income and interest expense, for all
instruments other than hybrid financial instruments. The
primary reasons for designating such financial liabilities at
fair value through profit or loss are:
To eliminate or significantly reduce a measurement
or recognition inconsistency that would otherwise
arise from measuring assets or liabilities or
recognising the gains and losses on them on
different bases; and
The group of financial liabilities, or financial assets
and liabilities, is managed and its performance
evaluated on a fair value basis.
For additional information regarding the fair value
measurement of GSBE’s assets and liabilities, see “Note 2.
Summary of Significant Accounting Policies. Financial
Assets and Liabilities Measured at Fair Value Through Profit
or Loss” in GSBE’s 2020 IFRS Financial Information.
The firm has documented policies and maintains systems and
controls for the calculation of Prudent Valuation Adjustment
(PVA) as required by the Commission Delegated Regulation
(EU) No. 2016/101. PVA represents the excess of valuation
adjustments required to achieve prudent value, over any
adjustment applied in the firm’s fair value that addresses the
same source of valuation uncertainty. For the year 2020
GSBE applied the Simplified Approach, where institutions
assess a capital deduction as a percentage to the fair-valued
positions, which are not exactly matching or offsetting and
therefore a change in accounting valuation of these positions
would have an impact on Common Equity Tier 1 (CET1)
capital.
Banking Book / Trading Book Classification
The firm has a comprehensive framework of policies,
controls and reporting to meet the requirements of the CRR
for inclusion of positions in the banking book and trading
book. In order to determine the appropriate regulatory capital
treatment for our exposures, positions must first be classified
into either “banking book” or “trading book”. Positions are
classified as banking book unless they qualify to be classified
as trading book.
Trading book positions generally meet the following criteria:
they are assets or liabilities that are accounted for at fair
value; they are risk managed using a Value-at-Risk (VaR)
internal model; they are held as part of our market-making
and underwriting businesses and are intended to be resold in
the short term, or positions intended to benefit from actual or
expected short-term price differences between buying and
selling prices or from other price or interest rate variations2.
Trading book positions are subject to market risk regulatory
capital requirements, as are foreign exchange and commodity
positions, whether or not they meet the other criteria for
classification as trading book positions. Market risk is the
risk of loss in value of these positions due to changes in
market conditions. Some trading book positions, such as
derivatives, are also subject to counterparty credit risk
regulatory capital requirements.
Banking book positions are accounted for in line with the
principles outlined in the bank’s Financial Statements.
Banking book positions are subject to credit risk regulatory
capital requirements. Credit risk represents the potential for
loss due to the default or deterioration in credit quality of a
counterparty (e.g., an Over-The-Counter (OTC) derivatives
counterparty or a borrower) or an issuer of securities or other
instruments we hold.
Regulatory Developments
The bank’s businesses are subject to extensive regulation and
supervision worldwide. Regulations have been adopted or are
being considered by regulators and policy-makers. The
expectation is that the principal areas of impact from
regulatory reform for the bank will be increased regulatory
capital requirements and increased regulation and restriction
on certain activities. However, given that many of the new
and proposed rules are highly complex, the full impact of
regulatory reform will not be known until the rules are
implemented and market practices develop under final E.U.
regulations.
2 As defined in point (85) of Article 4(1) in CRR

GOLDMAN SACHS BANK EUROPE SE
Pillar 3 Disclosures
December 2020 | Pillar 3 Disclosures 8
Risk-Based Capital Ratios. In June 2019, amendments to
the CRR and CRD were published in the Official Journal of
the E.U.
The amendments to the CRR include changes to rules for the
leverage ratio, the net stable funding ratio, requirements for
own funds and eligible liabilities (MREL), counterparty
credit risk, market risk, exposures to central counterparties,
exposures to collective investment undertakings, large
exposures, and reporting and disclosure requirements. Most
of these requirements applied from June 27, 2021 in the E.U.
The amendments to the CRD include the requirement to
establish an E.U. intermediate parent undertaking (“IPU”) as
well as provisions on remuneration, interest rate risk
management, supervisory powers and macro-prudential
capital requirements. The amendments to the CRD are
expected to phase in over time.
In December 2017, the Basel Committee published standards
that it described as the finalisation of the Basel III post-crisis
regulatory reforms. These standards set a floor on internally
developed capital requirements at a percentage of the capital
requirements under the standardised approach. They also
revised the Basel Committee’s standardised and model-based
approaches for credit risk, provide a new standardised
approach for operational risk capital and revise the
frameworks for credit valuation adjustment risk. The Basel
Committee has proposed that national regulators implement
these standards beginning January 1, 2023, and that the new
floor be phased in through January 1, 2028.
The Basel Committee’s standards are not effective in any
jurisdiction until rules implementing such standards have
been implemented by the relevant authorities in such
jurisdiction.
The impact of the latest Basel Committee developments on
the bank (including its RWAs and regulatory capital ratios) is
subject to uncertainty until corresponding legislation is
implemented.
Minimum Requirements for Own Funds and Eligible
Liabilities. In May 2020, the Single Resolution Board (SRB)
published a statement of policy on minimum requirement for
MREL under the revised Banking Package. The SRB policy
requires material subsidiaries of banking groups to meet a
minimum internal MREL requirement to facilitate the
transfer of losses to its resolution entity, which for GSBE is
Group Inc. On February 3, 2021, GSBE issued €800m of
MREL eligible debt. The MREL eligible debt was issued in
the expectation of GSBE being required to maintain an
internal MREL in the near future.
The SRB expects to communicate internal MREL
requirements in 2021 with the transitional minimum internal
MREL requirement expected to phase in from January 1,
2022, and become fully effective on January 1, 2024.
Climate Change
We recognize that climate change presents both challenges
and opportunities for our business. Climate change could
potentially disrupt the firm’s business, affect client activity
levels and creditworthiness and damage the firm’s reputation.
For example, climate change may cause extreme weather
events that disrupt operations at one or more of the firm’s
primary locations, affecting its ability to service and interact
with its clients. Climate change may also have a negative
impact on the financial condition of its clients, which may
decrease revenues from those clients and increase the credit
risk associated with loans and other credit exposures to those
clients. Additionally, the firm’s reputation may be damaged
as a result of its involvement, or its clients’ involvement, in
certain industries or projects associated with climate change.
The firm’s Environmental Policy Framework articulates our
roadmap for environmental progress and our approach to
engaging with clients on climate-related risks and
opportunities, including risk management guidelines for
carbon intense sectors.
Climate change presents financial risk through two primary
components, physical and transition. Physical risks relate to
the firm’s own infrastructure as well as real estate lending
and investment exposure. The firm uses an internal model to
assess physical risk factors at any locations for time horizons
through the year 2050 as well as for today. Transition risk
emerge due to policy changes towards low carbon emission
economy. The firm uses an internal transition risk model that
allows scenario analysis under several distinct representative
pathways and distinct shocks to equity, credit and other
market variables.
In the context of GSBE’s existing activities, our analysis
suggests that the loss associated with GS stress testing
scenarios at GSBE level is not material, though we will
continue to monitor materiality on an ongoing basis. As the
firm continues to develop and refine its process around
climate risk monitoring, its impact on wholesale lending will
remain an important consideration.
Brexit
In December 2019, the U.K. and the E.U. ratified the Brexit
withdrawal agreement, resulting in the U.K. leaving the E.U.
in January 2020 and entering into a transition period. Before
the end of the transition period on 31 December 2020, the

GOLDMAN SACHS BANK EUROPE SE
Pillar 3 Disclosures
December 2020 | Pillar 3 Disclosures 9
U.K. and the E.U. agreed the Trade and Cooperation
Agreement which includes provisions for the future trade
arrangements between the two parties. The U.K. also granted
the E.U. equivalence in a number of areas including CRR,
however this has not been reciprocated by the E.U. to date.
Following the end of the Brexit transition period, GSBE has
further expanded business activities across Investment
Banking, FICC, Equities and Investment Management.
Other Developments
The resurgence in the spread of COVID-19 towards the end
of 2020 and into 2021 has created greater uncertainty
regarding the economic outlook for the near term, even as
efforts to distribute vaccines are underway. While
governments and central banks continue to be aggressive in
providing fiscal and monetary stimulus, the global economic
recovery remains fragile.
The bank has continued to successfully execute on its
Business Continuity Planning (BCP) strategy since initially
activating it in March 2020 in response to the emergence of
the COVID-19 pandemic. The bank’s priority has been to
safeguard its employees and to seek to ensure continuity of
business operations on behalf of its clients. As a result of the
bank’s BCP strategy, the majority of its employees worked
remotely during most of 2020 and continue to do so in 2021.
In order to partially re-open the bank’s offices to employees
after initial restrictions began to ease in the second quarter of
2020, the bank established policies and protocols to address
safety considerations, taking into account the readiness of
people, communities and facilities. Over the course of the
pandemic, the extent to which the bank’s employees have
worked from its offices has varied based on how
circumstances in each location have evolved. The bank is in
constant dialogue with key stakeholders to assess health and
safety conditions across all of its office locations and has
robust procedures in place to protect the well-being of
employees, such as controls around building access, strict
physical distancing measures, enhanced cleaning regimes and
on-site COVID-19 testing.
The COVID-19 pandemic has created economic and financial
disruptions that have in the past adversely affected, and may
in the future adversely affect the company’s business,
financial condition, liquidity and results of operations. The
extent to which the COVID-19 pandemic will negatively
affect the bank’s businesses, financial condition, liquidity and
results of operations will depend on future developments,
including the widespread availability, use and effectiveness
of vaccines, which are highly uncertain and cannot be
predicted.

GOLDMAN SACHS BANK EUROPE SE
Pillar 3 Disclosures
December 2020 | Pillar 3 Disclosures 10
Risk Management
Overview
The firm believes that effective risk management is critical
to the success of the firm and of GSBE as an entity.
Accordingly, the firm has established an Enterprise Risk
Management (ERM) framework that employs a
comprehensive, integrated approach to risk management,
and is designed to enable comprehensive risk management
processes through which the firm at the GS Group level and
GSBE at an entity level identify, assess, monitor and
manage the risks associated with its business activities.
These risks include liquidity, market, credit, operational,
model, legal, compliance, conduct, regulatory, business
environment and strategic risks, and reputational risks. The
following section covers the bank’s risk management
structure which is consistent with GS Group and built
around three core components: governance, processes and
people.
Governance
Risk management governance starts with the bank’s
Executive Board, which both directly and through
established committees, including the GSBE Risk
Committee, oversees the risk management policies and
practices. The GSBE Executive Board is also responsible
for the annual review and approval of the GSBE Risk
Appetite Statement (RAS). The RAS describes the levels
and types of risk the bank is willing to assume within its risk
capacity to achieve its strategic business objectives included
in the bank’s business plan, while remaining in compliance
with regulatory requirements. The Executive Board reviews
the business plan and is ultimately responsible for
overseeing and setting strategy and risk appetite. For more
details on the GSBE RAS refer to the ‘Risk Profile and
Strategy’.
Enterprise Risk, which reports to the GS Group Chief Risk
Officer (CRO), oversees the implementation of the firm’s
risk governance structure and core risk management
processes and is responsible for ensuring that the Enterprise
Risk Management framework provides senior management
and relevant governing bodies, including the GSBE
Executive Board and Risk Committee, with a consistent and
integrated approach to managing the various risks in a
manner consistent with the firm’s and the bank’s risk
appetite.
The bank’s revenue-producing units, as well as Treasury,
Technology, Human Capital Management, Operations, and
Corporate and Workplace Solutions, are considered the first
line of defence and are accountable for the outcomes of the
risk-generating activities, as well as for assessing and
managing those risks within the bank’s risk appetite.
The independent risk oversight and control functions are
considered the second line of defence and provide
independent assessment, oversight and challenge of the risks
taken by the first line of defence, as well as lead and
participate in risk-oriented committees. Independent risk
oversight and control functions include Compliance, Tax,
and Controllers (Finance Division) that directly report to the
bank’s Chief Financial Officer (CFO) / Chief Operating
Officer (COO), Credit Risk, Liquidity Risk, Market Risk,
Model Risk Management, Operational Risk, Corporate Risk,
and Risk Engineering that directly report to the bank’s Chief
Risk officer (CRO), and Legal that directly reports to the
General Counsel of GSBE.
Internal Audit is considered the third line of defence and
reports to the bank’s Executive Board and administratively
to the CFO/COO. Internal Audit includes professionals with
a broad range of audit and industry experience, including
risk management expertise. Internal Audit is responsible for
independently assessing and validating the effectiveness of
key controls, including those within the risk management
framework, and providing timely reporting to the bank’s
Executive and Supervisory Boards, senior management and
regulators.
The three lines of defence structure promotes the
accountability of first line risk takers, provides a framework
for effective challenge by the second line and empowers
independent review from the third line.
Consistent with the firm, the bank maintains strong and
proactive communication about risk and it has a culture of
collaboration in decision-making among the first and second
lines of defence, committees and senior management. While
the first line of defence is responsible for management of
their risk, the bank dedicates extensive resources to the
second line of defence in order to ensure a strong oversight
structure and an appropriate segregation of duties. The firm
regularly reinforces its strong culture of escalation and
accountability across all functions.
Additional oversight is provided by the GSBE Supervisory
Board which receives regular updates from the GSBE
Executive Board on the bank’s risk profile and other risk
related matters.

GOLDMAN SACHS BANK EUROPE SE
Pillar 3 Disclosures
December 2020 | Pillar 3 Disclosures 11
Processes
The bank maintains various processes that are critical
components of its risk management framework, including
(i) risk identification and assessment, (ii) risk appetite, limit
and threshold setting, (iii) risk reporting and monitoring,
and (iv) risk decision making.
To effectively assess and monitor risks, the bank maintains
a daily discipline of marking substantially all of its
inventory to current market levels. The bank also applies a
comprehensive framework of limits and thresholds to
control and monitor risk across transactions, products,
businesses and markets. See “Credit Risk”, “Market Risk”
and “Liquidity Risk Management”, “Operational Risk” and
“Model Risk” for further information.
People
Even the best technology serves only as a tool for helping to
make informed decisions in real time about the risks GSBE
is taking. Ultimately, effective risk management requires
people to interpret risk data on an ongoing and timely basis
and adjust risk positions accordingly. The experience of the
bank’s and the firm’s professionals, and their understanding
of the nuances and limitations of each risk measure, guides
the bank in assessing exposures and maintaining them
within prudent levels.
Consistent with GS Group, the bank reinforces a culture of
effective risk management, consistent with its risk appetite,
in its training and development programmes, as well as in
the way it evaluates performance, recognises and rewards
people. The firm’s training and development programmes,
including certain sessions led by the most senior leaders, are
focused on the importance of risk management, client
relationships and reputational excellence. As part of the
firm’s annual performance review process, the firm assesses
reputational excellence, including how an employee
exercises good risk management and reputational
judgement, and adheres to the firm’s code of conduct and
compliance policies. The firm’s review and reward
processes are designed to communicate and reinforce to its
professionals the link between behaviour and how people
are recognised, the need to focus on clients and reputation,
and the need to always act in accordance with the highest
standards of the firm.
Structure
Oversight of risk in the bank is ultimately the responsibility
of the GSBE Executive Board, who oversees risk both
directly and through delegation to various committees. A
series of committees within the bank with specific risk
management mandates covering important aspects of the
entity’s businesses also have oversight or decision-making
responsibilities. The key committees with oversight of the
bank’s activities are described below.
GSBE Risk Committee. The GSBE Risk Committee is a
management committee, which is responsible for the
ongoing monitoring and control of all financial and non-
financial risks associated with the bank’s activities. This
includes reviewing key financial and risk metrics, including
but not limited to profit and loss, capital (including Internal
Capital Adequacy Assessment Process (ICAAP)), funding,
liquidity (including Internal Liquidity Adequacy
Assessment Process (ILAAP)), credit risk, market risk,
operational risk and stress tests. Within its mandate, the
GSBE Risk Committee approves market risk, credit risk,
liquidity and regulatory capital management buffers and
triggers and alerts, or articulate recommendations with
regard to risk limits which require Executive Board
approval. Its membership includes senior managers from the
revenue-producing divisions and independent risk oversight
and control functions. The GSBE Risk Committee reports to
the bank’s Executive Board.
GSBE Operational Risk Committee. The GSBE
Operational Risk Committee provides oversight of the
ongoing development and implementation of operational
risk policies, framework and methodologies, with oversight
from the GSBE Risk Committee, and monitors the
effectiveness of operational risk management. The
Committee is accountable for the implementation of
business standards and practices, including reputational risk
management, client service and conduct risk, within the
scope of its mission.
GSBE Credit Risk Council. The GSBE Credit Risk
Council is responsible for (i) ensuring that the bank has
appropriate and effective credit risk management processes,
and (ii) ongoing monitoring and review of credit risk
exposure. The Council reports to the bank’s Risk
Committee.
GSBE Asset Liability Committee. The GSBE Asset
and Liability Committee (ALCO) reviews and approves the
strategic direction for the bank’s financial resources
including capital, liquidity, funding and balance sheet. This
committee has oversight responsibility for asset liability
management, including interest rate and currency risk, funds
transfer pricing, capital allocation and incentives, and credit
ratings. This committee makes recommendations as to any
adjustments to asset liability management and financial
resource allocation in light of current events, risks,
exposures, and regulatory requirements and approves related

GOLDMAN SACHS BANK EUROPE SE
Pillar 3 Disclosures
December 2020 | Pillar 3 Disclosures 12
policies. Its membership includes senior managers from the
revenue-producing divisions and independent control and
support functions. The GSBE ALCO directly reports to the
bank’s Executive Board.
As a subsidiary and integrated part of GS Group, the
comprehensive regional and global risk governance
framework in place forms an integral part of the strategy
and risk management process of the bank. The integration
into the firmwide risk management framework allows the
bank to use the firm’s methods and systems and a consistent
implementation of firmwide structures and principles while
considering the entity specificities and governance structure.
The firm has established a series of committees with
specific risk management mandates. Committees with
oversight of matters relevant to the bank include
representation from bank’s senior management, where
relevant.
For more information regarding the primary firmwide and
regional risk and oversight committees which have also
oversight of matters relevant for GSBE, see “Risk Report -
Overview and Structure of Risk Management” within
“Management Report” of GSBE’s 2020 Financial
Statements.
Risk Profile and Strategy
In the normal course of activities in serving clients, we
commit capital, engage in derivative and lending
transactions, and otherwise incur risk as an inherent part of
our business. However, we endeavour not to undertake risk
in form or amount that could potentially and materially
impair our capital and liquidity position or the ability to
generate revenues, even in a stressed environment. Where
possible we employ mitigants and hedges, such as collateral,
netting derivatives and other controls, in order to manage
such risks and risk concentrations within our risk appetite
levels.
The bank’s overall risk appetite is established through an
assessment of opportunities relative to potential losses, and
is calibrated to, among others, GSBE’s capital, liquidity and
earnings capability, and reflective of its strategy. The
primary means of evaluating risk-taking capacity is through
the ICAAP. The bank’s ICAAP is a comprehensive internal
process which coherently integrates several key components
including risk identification and materiality assessment,
capital planning, and risk appetite, and is integrated into the
broader risk management framework and decision making
throughout the entity.
The RAS of GSBE is complemented by the GS Group RAS,
and articulates the risk philosophy, the identification of risks
generated by its business activities, as well as the appetite
and limits set in order to manage effectively those risks.
Consistent with this objective, we pay particular attention to
evaluating risks that are concentrated, correlated, illiquid, or
have other adverse characteristics. The intention is to
mitigate or eliminate these risks, limiting them to such an
extent that they could not, individually or collectively,
materially and adversely affect GSBE. The bank regularly
reviews risk exposure and risk appetite, and takes into
consideration the key external stakeholders, in particular our
clients, shareholders, creditors, rating agencies, and
regulators. The long-term success of our business model is
directly linked to the preservation of strong relationships
with each of these key constituents.
The GSBE Executive Board, in coordination with the GSBE
CRO and the GSBE Risk Committee and with further
supervision from the GSBE Supervisory Board, is actively
engaged in reviewing and approving our overall risk
appetite, as well as in reviewing the risk profile.
The consideration of risk appetite and the underlying risk
management framework ensures that GSBE’s businesses are
congruent with its strategy under both normal and stressed
environments. We believe that the risk management
framework and the associated risk policies, procedures and
systems in place are comprehensive and effective with
regard to our profile and strategy. The framework is
evaluated on an ongoing basis and subject to independent
internal audit assessments to ensure our risk management
arrangements remain effective.
Risk Measurement
On a day-to-day basis risk measurement plays an important
role in articulating the risk appetite of the firm and GSBE
and in managing the risk profile as expressed in the RAS.
Risk may be monitored against firmwide, product,
divisional or business level limits or thresholds, or against a
combination of such attributes. We measure risk using a
suite of metrics, as relevant to each type of risk, including
stress metrics to calculate the potential loss from a wide
range of scenarios and sensitivity analysis. These risks are
tracked systematically and they are monitored and reported
to the relevant senior management Committees and Board
on a regular basis.
A number of specialist committees and governance bodies
sit within the broader risk management framework with
responsibilities for the monitoring of specific risks against
risk limits or thresholds and the escalation of any breaches

GOLDMAN SACHS BANK EUROPE SE
Pillar 3 Disclosures
December 2020 | Pillar 3 Disclosures 13
as described above.
GSBE is fully integrated into the broader firmwide
organizational structure and risk governance, and applies a
risk philosophy and risk management principles consistent
with GS Group. For an overview of the GS Group risk
management framework, including governance, processes
and committee structure, see “Risk Management –
Overview and Structure of Risk Management” in Part II,
Item 7 “Management’s Discussion and Analysis of
Financial Condition and Results of Operations” in the firm’s
2020 Form 10-K.
Adequacy of Risk Management Arrangements
GSBE is satisfied that the risk management arrangements
and systems, as described above, are appropriate given the
strategy and risk profile of the bank. These elements are
reviewed at least annually and, where appropriate, updated
to reflect best practice, evolving market conditions and
changing regulatory requirements.

GOLDMAN SACHS BANK EUROPE SE
Pillar 3 Disclosures
December 2020 | Pillar 3 Disclosures 14
Capital Framework
Capital Structure
For regulatory capital purposes, a bank’s total available
capital has the following components:
Common Equity Tier 1 capital (CET1), which is
comprised of common shareholders’ equity, after
giving effect to deductions for disallowed items
and other adjustments;
Tier 1 capital which is comprised of CET1 capital
and other qualifying capital instruments; and
Tier 2 capital which is comprised of long term
qualifying subordinated debt and preference shares.
Certain components of our regulatory capital are subject to
regulatory limits and restrictions under the rules. In general,
to qualify as Tier 1 or Tier 2 capital, an instrument must be
fully paid and unsecured. A qualifying Tier 1 or Tier 2
capital instrument must also be subordinated to all senior
indebtedness of the organisation.
Under the rules, the minimum CET1, Tier 1 capital and
Total capital ratios (collectively the Pillar 1 capital
requirements) are supplemented by:
A capital conservation buffer of 2.5%, consisting
entirely of capital that qualifies as CET1.
A countercyclical capital buffer of up to 2.5%
(consisting entirely of CET1) in order to counteract
excessive credit growth. The buffer only applies to
GSBE’s exposures to certain types of counterparties
and exposures based in jurisdictions which have
announced and implemented a countercyclical buffer.
As of December 2020, the buffer increases the
minimum CET1 ratio by 0.01%.
In addition to the existing capital requirement resulting
from Pillar 1, GSBE is subject to an annual Supervisory
Review and Evaluation Process (SREP) by its
regulators. As a result of this SREP process the
supervisory authorities determine a SREP capital add-
on. The SREP capital add-on applicable to GSBE for
2020 was previously set by the BaFin. It will be
replaced by the capital add-on determined by the SREP
process conducted by the ECB. This capital add-on
consists of two components: a Pillar 2 Capital
requirement (P2R) and a Pillar 2 Capital Guidance
(P2G). While the P2R is binding and breaches can have
direct legal consequences for banks, the P2G indicates
to banks the supervisory view of the adequate level of
capital to be maintained to provide a sufficient buffer to
withstand stressed situations. Unlike the P2R, the P2G
is not legally binding.
GSBE’s P2R capital add-on, effective from January 1,
2021 onwards, has been set by the ECB to 3.0% of
which 1.69% have to be held in CET1 capital.
Minimum Regulatory Capital Ratios
The following table presents GSBE’s minimum required
ratios as of December 2020.
Table 1: Minimum Regulatory Capital Ratios
December 2020
Minimum ratio3
CET1 ratio 7.0%
Tier 1 capital ratio 8.5%
Total capital ratio 10.5%
3 Includes the capital conservation buffer and countercyclical capital
buffer described above
Compliance with Capital Requirements
As of December 31, 2020, GSBE had capital levels in
excess of its overall capital requirements (OCR) which
include the pillar 1 requirement, pillar 2 requirement, capital
conservation buffer and countercyclical capital buffer and
SREP add-on.
GSBE’s shareholder made CET1 capital contributions
totalling €2,000m during the first half of 2021 and GSBE
issued €800m of MREL eligible debt.

GOLDMAN SACHS BANK EUROPE SE
Pillar 3 Disclosures
December 2020 | Pillar 3 Disclosures 15
Regulatory Capital
Overview
The following table presents a breakdown of GSBE’s
capital ratios under CRR as of December 31, 2020.
Table 2: Regulatory Capital Ratios4
€ in thousands As of December 2020
CET1 Capital € 3,180,504
Tier 1 Capital 3,180,504
Tier 2 Capital 20,000
Total Capital € 3,200,504
RWAs € 7,957,105
CET1 Ratio 40.0%
Tier 1 Capital Ratio 40.0%
Total Capital Ratio 40.2%
Capital Structure
All capital, RWAs and ratios are based on current
interpretation, expectations and understanding of the rules
and may evolve in the future.
The following tables contain information on the components
of our regulatory capital structure. The capital resources of
GSBE are based on GSBE’s 2020 IFRS financial
information.
For year-end 2020 GSBE calculated its capital resources
based on IFRS for the first time. Compared to the previous
year’s capital resources, this led to minor changes in the
composition of GSBE’s capital. While the capitalisation of
deferred tax assets (DTAs) slightly increased GSBE’s
capital resources, the higher valuation of GSBE’s pension
liabilities had an almost offsetting effect. No impact arose
from the recognition of intangibles and goodwill under
IFRS due to these positions being subject to deductions
under the CRR capital framework. Therefore, the transition
from HGB to IFRS had no major impacts on GSBE’s capital
resources.
4 Ratios are calculated using the regulatory capital resources as of
December 31, 2020 excluding 2020 year-end profits in accordance
with Article 26(2) of the regulation 575/2013. Including such
profits would, ceteris paribus, increase the CET1, Tier 1 and Total
capital ratios to 41.2%, 41.2% and 41.4% respectively.
Table 3: Regulatory Capital
€ in thousands As of December 2020
Ordinary Share Capital and related share premium accounts
€ 311,271
Retained Earnings 463,057
Other capital reserves 2,586,307
Accumulated Other Comprehensive Income
(31,707)
2020 Year-end profits (96,821)
CET1 Capital Before Deductions
€ 3,232,107
CVA and DVA -
Prudent Valuation Adjustments (11,018)
Intangible Assets5 (40,193)
DTAs that rely on future profitability, excluding those arising from temporary differences
(392)
CET1 Capital After Deductions € 3,180,504
Additional Tier 1 capital -
Tier 1 Capital After Deductions € 3,180,504
Tier 2 Capital Before Deductions 20,000
Other Adjustments -
Tier 2 Capital After Deductions € 20,000
Total Capital Resources € 3,200,504
5 The impact from application of the new EBA prudential treatment of
software assets on GSBE own funds was immaterial as of December
2020
We set out below a reconciliation between the capital
resources of GSBE and its balance sheet.
Table 4: Reconciliation to Balance Sheet
€ in thousands As of December 2020
Total Shareholders' Equity per IFRS Balance Sheet
€ 3,355,526
Capital instruments not yet recognised in CET1 capital 6
€ (26,598)
2020 Year-end profits (96,821)
Regulatory deductions (51,603)
Additional Tier 1 Capital -
Tier 2 Capital 20,000
Total Capital Resources € 3,200,504
6 Pertains to 3,816,600 shares of € 1 each allotted to Goldman
Sachs International (GSI) for contribution and transfer of the
businesses pertaining to GSI branches into GSBE.

GOLDMAN SACHS BANK EUROPE SE
Pillar 3 Disclosures
December 2020 | Pillar 3 Disclosures 16
Risk-Weighted Assets
RWAs are calculated based on measures of credit risk, market risk and operational risk. The table below represents a summary of
the RWAs and capital requirements for GSBE by type as at December 31, 2020 and December 31, 2019.
The overall impact from the IFRS transition on GSBE’s RWA was negligible.
Table 5: Overview of RWAs
€ in thousands
RWAs Minimum
capital requirements
December 2020 December 2019
1 Credit risk (excluding CCR) € 655,163 € 168,226 € 52,413
2 Of which the standardised approach 655,163 168,226 52,413
4 Of which the advanced IRB (AIRB) approach - - -
5 Of which equity IRB under the simple risk-weighted approach or the IMA - - -
3 CCR € 4,402,841 € 744,899 € 352,227
4 Of which mark to market 106,268 22,486 8,501
5 Of which the standardised approach - - -
6 Of which internal model method (IMM) 3,715,298 531,198 297,224
7 Of which risk exposure amount for contributions to the default fund of a
CCP 155,634 45,626 12,451
8 Of which CVA 425,642 145,589 34,051
9 Settlement risk € 220,720 € 19,133 € 17,658
10 Securitisation exposures in the banking book (after the cap) € 13,321 € 14,274 € 1,066
11 Of which standardised approach (ERBA) 1,175 1,161 94
12 Of which standardised approach 12,146 13,113 972
13 Market risk € 2,351,872 € 5,438 € 188,150
14 Of which the standardised approach 437,579 5,438 35,006
15 Of which IMA 1,914,293 - 153,143
16 Large exposures - - -
17 Operational risk € 313,188 € 269,784 € 25,055
18 Of which basic indicator approach 313,188 269,784 25,055
19 Of which standardised approach - - -
20 Total € 7,957,105 € 1,221,755 € 636,568
Total RWA increased by € 6.7 billion mainly due to Counterparty Credit Risk and Market Risk RWAs driven by higher trading
volumes as a result of business growth in 2020, decreasing the total capital ratio from 56.2% in December 2019 to 40.2% in
December 2020.
GOLDMAN SACHS BANK EUROPE SE
Pillar 3 Disclosures
December 2020 | Pillar 3 Disclosures 17
Credit Risk
Overview
Credit risk represents the potential for loss due to the default
or deterioration in credit quality of a counterparty (e.g. an
OTC derivatives counterparty or a borrower) or an issuer of
securities or other instruments we hold.
The bank’s exposure to credit risk comes mostly from client
transactions in OTC derivatives and cash placements mainly
with Central Banks. Credit risk also comes from securities
financing transactions (i.e. resale and repurchase agreements
and securities borrowing and lending activities) and lending
activity. In addition, the bank may hold other positions that
give rise to credit risk (e.g., bonds held in inventory) —
these credit risks are captured as a component of market risk
measures, which are monitored and managed by Market
Risk, consistent with other inventory positions.
Credit Risk which is independent of the revenue-producing
units and reports to GS Group’s chief risk officer, has
primary responsibility for assessing, monitoring and
managing GS Group’s credit risk through oversight across
the GS Group’s global businesses.
The bank’s framework for managing credit risk is consistent
with the framework of GS Group established by GS Group’s
Risk Governance Committee, with the bank’s Credit Risk
department being an integral part of the GS Group Credit
Risk function and reporting to the bank’s chief risk officer.
Credit Risk Management Process
The process for managing credit risk includes the critical
components of the risk management framework described in
the “Overview and Structure of Risk Management” within
“Management Report” of GSBE’s 2020 Financial
Statements. as well as the following:
Setting of credit limits and monitoring
compliance with established credit risk limits;
Regular reporting (daily, weekly, monthly,
quarterly) on the bank’s credit exposures and
credit concentrations to the chief credit officer,
chief risk officer, the Credit Risk Council, the
Risk Committee, and the Executive Board of
GSBE;
Assessing and determining internal credit
ratings for counterparties and the associated
likelihood that a counterparty will default on its
payment obligations;
Measuring our current and potential credit
exposure and losses resulting from a
counterparty default;
Using credit risk mitigants, including collateral
and hedging; and
Maximizing recovery through active workout
and restructuring of claims.
The bank performs credit reviews, which include initial and
ongoing analyses of the bank’s counterparties. A credit
review is an independent analysis of the capacity and
willingness of a counterparty to meet its financial
obligations, resulting in an internal credit rating. The
determination of internal credit ratings also incorporates
assumptions with respect to the nature of and outlook for the
counterparty’s industry, and the economic environment.
Senior personnel, with expertise in specific industries,
inspect and approve credit reviews and internal credit
ratings.
The credit risk management systems capture credit exposure
to individual counterparties and on an aggregate basis to
counterparties and their subsidiaries. These systems also
provide management with comprehensive information about
aggregate credit risk by product, internal credit rating,
industry, country and region.
Risk Measures
Credit risk is measured based on the potential loss in the
event of non-payment by a counterparty using current and
potential exposure which are calculated using the firm’s
own models. For derivatives and securities financing
transactions, current exposure represents the amount
presently owed after taking into account applicable netting
and collateral arrangements, while potential exposure
represents the firm’s estimate of the future exposure that
could arise over the life of a transaction based on market
movements within a specified confidence level (usually at
the 95th-percentile). Potential exposure also takes into
account netting and collateral arrangements. For loans and
lending commitments, the primary measure of credit risk is
a function of the notional amount of the position.
Limits
Credit limits and escalation thresholds are used at various
levels (e.g. counterparty, economic group, industry and
country) to manage the size and nature of the bank’s credit
exposures. The bank’s Executive Board and the GSBE Risk
Committee approve credit risk limits at the bank-wide level,
and where appropriate the business and product level,

GOLDMAN SACHS BANK EUROPE SE
Pillar 3 Disclosures
December 2020 | Pillar 3 Disclosures 18
consistent with the bank’s risk appetite. Furthermore, the
GSBE Executive Board or Risk Committee (including the
Credit Risk Council) approve the framework that governs
the setting of credit risk sub-limits at the bank level, which
is delegated to Credit Risk.
Credit Risk is responsible for monitoring these limits and
identifying and escalating to senior management and/or the
appropriate risk committee, on a timely basis, instances
where limits have been exceeded.
Credit Exposures
For information on the bank’s credit exposures, including
the gross fair value, netting benefits and current exposure of
the bank’s derivative exposures and the bank’s securities
financing transactions, see “Note 6. Repurchase
Agreements” and “Note 7. Trading Assets and Liabilities”
and “Credit Risk Management” in “Management Report” in
the GSBE’s 2020 financial statements.
Credit Risk and Counterparty Credit Risk RWAs
Credit RWAs are calculated based on measures of credit
exposure, which are then risk weighted. Below is a
description of the methodology used to calculate RWAs for
Wholesale exposures, which generally include credit
exposures to corporates, institutions, sovereigns or
government entities (other than securitisation, retail or
equity exposures). GSBE does not have regulatory
permission to compute risk weights in accordance with the
Advanced Internal Ratings Based (AIRB) approach, which
utilises internal assessments of each counterparty’s
creditworthiness. Instead, it uses Standardised Risk
Weights, for which nominated External Credit Assessment
Institutions (ECAI) ratings are used.
Exposure at Default (EAD). The exposure amount that is
risk weighted for regulatory capital calculations. For on-
balance-sheet assets, such as receivables and cash, EAD is
generally based on the balance sheet value. For the
calculation of EAD for off-balance-sheet exposures,
including commitments and guarantees, an equivalent
exposure amount is calculated based on the notional amount
of each transaction multiplied by a credit conversion factor
in accordance with Article 166 of CRR.
For the measurement of substantially all counterparty credit
exposure on OTC, cleared and listed derivative and
securities financing transactions, GSBE has been granted
temporary tolerance to use the Internal Model Method
(IMM). The models estimate Expected Exposures (EE) at
various points in the future using risk factor simulations.
The model parameters are derived from historical and
implied market data using the most recent three-year period
as well as a stressed three-year period. The models also
estimate the Effective Expected Positive Exposure (EEPE)
over the first year of the portfolio, which is the time-
weighted average of non-declining positive credit exposure
over the EE simulation. EAD is calculated by multiplying
the EEPE by a standard regulatory factor of 1.4.
The EAD detailed in the following tables represents the
exposures used in computing capital requirements and is not
a directly comparable metric to balance sheet amounts
presented in the financial information of GSBE for the year
ended December 31, 2020 due to differences in
measurement methodology, counterparty netting and
collateral offsets used.
As GSBE calculates the majority of its counterparty credit
exposure under the IMM, the impacts of netting and
collateral are integral to the calculation of the exposure. The
exposures disclosed below are presented on a net and
collateralised basis where there is a legally enforceable
netting and collateral opinion. They do not include the effect
of any credit protection purchased on counterparties.
Governance and Validation of Risk Parameters
Approaches and methodologies for quantifying EAD are
monitored and managed by the Risk Engineering
department within the Risk Division. Models are
independently reviewed, validated and approved by Model
Risk Management. For further information, see “Model
Risk”. The performance of each IMM model used to
quantify EAD is assessed quarterly via backtesting
procedures, performed by comparing the predicted and
realised exposure of a set of representative trades and
portfolios at certain horizons. The firm’s models are
monitored and enhanced in response to backtesting.
External Credit Rating Assessment Institutions
The External Credit Assessment Institutions (ECAIs) used
are Standard & Poor’s Ratings Services (S&P), Moody’s
Investors Service (Moody’s) and Fitch, Inc. (Fitch) for all
types of exposure categories in accordance with Articles
135 and 444 of CRR.

GOLDMAN SACHS BANK EUROPE SE
Pillar 3 Disclosures
December 2020 | Pillar 3 Disclosures 19
The following two tables present the methods used to calculate Counterparty Credit Risk RWAs and main parameters used within
each method for GSBE as of December 31, 2020.
Table 6: Analysis of CCR Exposure by Approach
€ in thousands
As of December 2020
Notional
Replacement cost/current
market value
Potential future credit
exposure EEPE Multiplier
EAD post CRM
RWAs
1 Mark to market € 587 € 162,260 € 613,758 € 106,268
3 Standardised approach - - - -
4 IMM (for derivatives and SFTs)
6,880,462 1.40 9,632,647 3,715,298
5 Of which securities financing transactions
151,862 1.40 212,607 161,574
6 Of which derivatives and long settlement transactions
6,728,600 1.40 9,420,041 3,553,724
11 Total € 3,821,566
The following table presents GSBE’s EAD after credit risk mitigation and RWAs on exposures to CCPs as of December 31, 2020. Table 7: Exposures to CCPs
€ in thousands As of December 2020
EAD post CRM RWAs
1 Exposures to QCCPs (total) € 165,368
2 Exposures for trades at QCCPs (excluding initial margin and default fund contributions); of which
340,049 6,801
3 (i) OTC derivatives 193,360 3,867
4 (ii) Exchange-traded derivatives - -
5 (iii) SFTs - -
6 (iv) Netting sets where cross-product netting has been approved - -
7 Segregated initial margin -
8 Non-segregated initial margin 146,689 2,934
9 Prefunded default fund contributions 157,482 155,634
10 Alternative calculation of own funds requirements for exposures -
11 Exposures to non-QCCPs (total) -
12 Exposures for trades at non-QCCPs (excluding initial margin and default fund contributions); of which
- -
17 Segregated initial margin -
18 Non-segregated initial margin - -
19 Prefunded default fund contributions - -
20 Unfunded default fund contributions - -
GOLDMAN SACHS BANK EUROPE SE
Pillar 3 Disclosures
December 2020 | Pillar 3 Disclosures 20
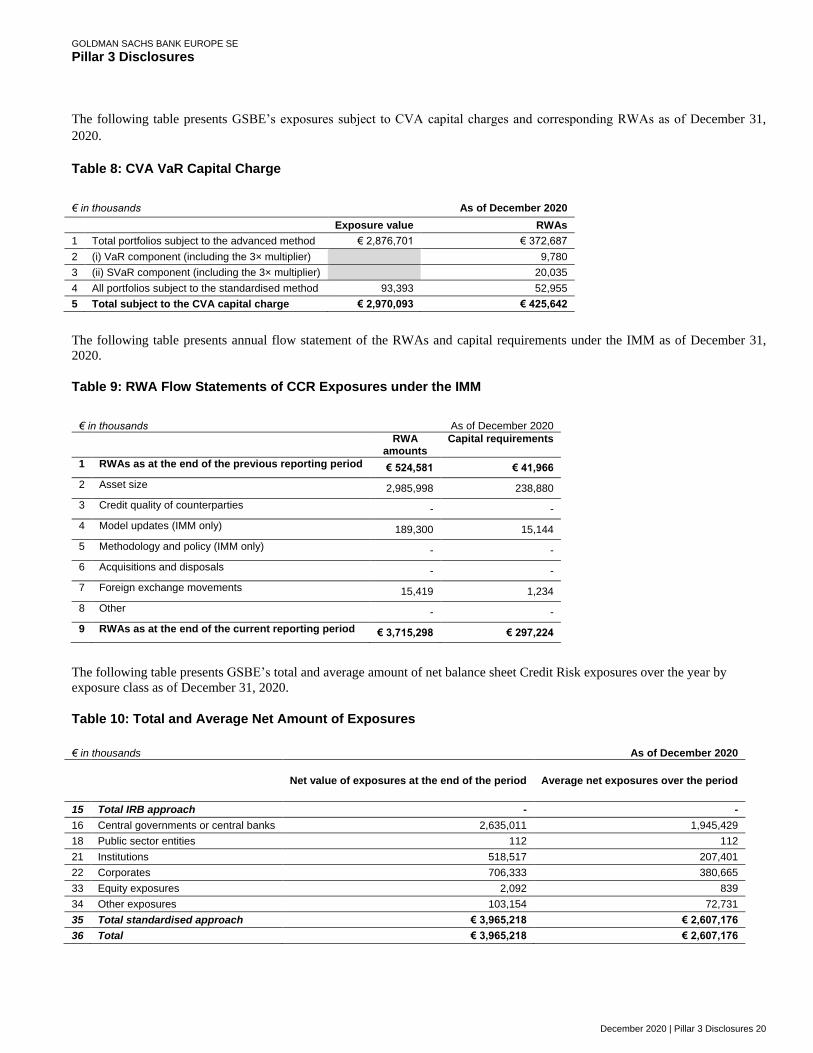
The following table presents GSBE’s exposures subject to CVA capital charges and corresponding RWAs as of December 31,
2020.
Table 8: CVA VaR Capital Charge
€ in thousands As of December 2020
Exposure value RWAs
1 Total portfolios subject to the advanced method € 2,876,701 € 372,687
2 (i) VaR component (including the 3× multiplier) 9,780
3 (ii) SVaR component (including the 3× multiplier) 20,035
4 All portfolios subject to the standardised method 93,393 52,955
5 Total subject to the CVA capital charge € 2,970,093 € 425,642
The following table presents annual flow statement of the RWAs and capital requirements under the IMM as of December 31,
2020.
Table 9: RWA Flow Statements of CCR Exposures under the IMM
€ in thousands As of December 2020
RWA
amounts Capital requirements
1 RWAs as at the end of the previous reporting period € 524,581 € 41,966
2 Asset size 2,985,998 238,880
3 Credit quality of counterparties - -
4 Model updates (IMM only) 189,300 15,144
5 Methodology and policy (IMM only) - -
6 Acquisitions and disposals - -
7 Foreign exchange movements 15,419 1,234
8 Other - -
9 RWAs as at the end of the current reporting period € 3,715,298 € 297,224
The following table presents GSBE’s total and average amount of net balance sheet Credit Risk exposures over the year by
exposure class as of December 31, 2020.
Table 10: Total and Average Net Amount of Exposures
€ in thousands As of December 2020
Net value of exposures at the end of the period Average net exposures over the period
15 Total IRB approach - -
16 Central governments or central banks 2,635,011 1,945,429
18 Public sector entities 112 112
21 Institutions 518,517 207,401
22 Corporates 706,333 380,665
33 Equity exposures 2,092 839
34 Other exposures 103,154 72,731
35 Total standardised approach € 3,965,218 € 2,607,176
36 Total € 3,965,218 € 2,607,176

GOLDMAN SACHS BANK EUROPE SE
Pillar 3 Disclosures
December 2020 | Pillar 3 Disclosures 21
Credit Risk Mitigation
To reduce credit exposures on derivatives and securities
financing transactions, the bank may enter into netting
agreements with counterparties that permit it to offset
receivables and payables with such counterparties.
The bank may also reduce credit risk with counterparties by
entering into agreements that enable us to receive and post
cash and securities collateral with respect to our derivatives
and securities financing transactions, subject to the terms of
the related credit support agreements or similar
arrangements (collectively, credit support agreements). An
enforceable credit support agreement grants the non-
defaulting party exercising termination provisions the right
to liquidate collateral and apply the proceeds to any amounts
owed. In order to assess enforceability of our right to setoff
under netting and credit support agreements, we evaluate
various factors, including applicable bankruptcy laws, local
statutes and regulatory provisions in the jurisdiction of the
parties to the agreement. The collateral we hold consists
primarily of cash and securities of high quality government
bonds (mainly US and EU), subject to haircuts as deemed
appropriate by the Credit Risk function. Credit Risk
performs ongoing collateral monitoring to ensure the firm
maintains an appropriate quality and level of diversification
of collateral.
Bank’s collateral is managed by certain functions within the
firm which review exposure calculations, make margin calls
with relevant counterparties, and ensure subsequent
settlement of collateral movements. We monitor the fair
value of the collateral on a daily basis to ensure our credit
exposures are appropriately collateralised.
As of December 2020, the aggregate amounts of additional
collateral or termination payments related to our net
derivative liabilities under bilateral agreements that could
have been called by our counterparties in the event of a one-
and two-notch downgrade of our credit ratings are
immaterial.
For loans and lending commitments, depending on the credit
quality of the borrower and other characteristics of the
transaction, we deploy a variety of potential risk mitigants.
Risk mitigants include: collateral provisions, guarantees,
covenants, structural seniority of the bank loan claims and,
for certain lending commitments, provisions in the legal
documentation that allow us to adjust loan amounts, pricing,
structure and other terms as market conditions change. The
type and structure of risk mitigants employed can
significantly influence the degree of credit risk involved in a
loan or lending commitment.
When the bank does not have sufficient visibility into a
counterparty’s financial strength or when it believes a
counterparty requires support, the bank may obtain third-
party guarantees of the counterparty’s obligations. Main
types of guarantors are sovereigns, certain supranational and
multilateral development banks, banks and other financial
institutions, or other GS Group entities. The bank may also
mitigate its credit risk using credit derivatives.

GOLDMAN SACHS BANK EUROPE SE
Pillar 3 Disclosures
December 2020 | Pillar 3 Disclosures 22
The following table presents GSBE’s net carrying values of credit risk exposures secured by different CRM techniques as of
December 31, 2020.
Table 11: CRM Techniques
€ in thousands As of December 2020
Exposures unsecured -
Carrying amount
Exposures secured -
Carrying amount
Exposures secured by
collateral
Exposures secured by
financial guarantees
Exposures secured by
credit derivatives
1 Total loans € 518,700 € 45,480 € 45,480 - -
2 Total debt securities - - - - -
3 Total exposures € 518,700 € 45,480 € 45,480 - -
4 Of which defaulted - - - - -
Credit Derivatives
We enter into credit derivative transactions primarily to
facilitate client activity and to manage the credit risk
associated with market-making.
We may also use credit derivatives to hedge counterparty
exposure associated with investing and financing activities
as well as derivative exposure. Some of these hedges may
qualify as credit risk mitigants for regulatory capital
purposes Risk Weight substitution approach (and subject to
the regulatory haircuts for maturity and currency mismatch
where applicable).
Where the aggregate notional of credit derivatives hedging
exposure to a loan obligor is less than the notional loan
exposure, the substitution approach is only employed for the
percentage of loan exposure covered by eligible credit
derivatives.
For further information on the Credit Risk management
process please refer to the “Credit Risk Management”
within “Management Report” of GSBE’s 2020 Financial
Statements.
The following table presents GSBE’s exposure to credit derivatives based on notional and fair values as of December 31, 2020.
Table 12: Credit Derivatives Exposures
€ in thousands As of December 2020
Credit derivative hedges Other credit derivatives
Protection bought Protection sold
Notionals
Index credit default swaps € 41,448,870 € 41,364,421 -
Total return swaps - - -
Other credit default swaps 5,910,041 6,099,328 -
Other credit derivatives - - 12,694,102
Total notionals € 47,358,910 € 47,463,748 € 12,694,102
Fair values - - -
Positive fair value (asset) € 45,876 € 1,862,173 € 20,469
Negative fair value (liability) € 1,860,374 € 45,799 € 20,469

GOLDMAN SACHS BANK EUROPE SE
Pillar 3 Disclosures
December 2020 | Pillar 3 Disclosures 23
Wrong-way Risk
We seek to minimise risk where there is a significant
positive correlation between the probability of default of a
counterparty and our exposure to that counterparty (net of
the market value of any collateral we receive), which is
known as “wrong-way risk”. Wrong-way risk is commonly
categorised into two types: specific wrong-way risk and
general wrong-way risk. We categorise exposure as specific
wrong-way risk when our counterparty and the issuer of the
reference asset of the transaction are the same entity or are
affiliates, or if the collateral supporting a transaction is
issued by the counterparty or its affiliates. General wrong-
way risk arises when there is a significant positive
correlation between the probability of default of a
counterparty and general market risk factors affecting the
exposure to that counterparty. We have procedures in place
to actively identify, monitor and control specific and general
wrong-way risk, beginning at the inception of a transaction
and continuing through its life, including assessing the level
of risk through stress tests. We ensure that material wrong-
way risk is mitigated using collateral agreements or
increases to initial margin, where appropriate.
Credit Valuation Adjustment Risk-Weighted Assets
RWAs for CVA address the risk of losses related to changes
in counterparty credit risk arising from OTC derivatives. We
calculate RWAs for CVA primarily using the Advanced
CVA approach set out in CRR, which permits the use of
regulator approved VaR models. Consistent with our
Regulatory VaR calculation (see “Market Risk” for further
details), the CVA RWAs are calculated at a 99% confidence
level over a 10-day time horizon.
The CVA RWAs also include a stressed CVA component,
which is also calculated at a 99% confidence level over a
10-day horizon using both a stressed VaR period and
stressed EEs. The CVA VaR model estimates the impact on
our credit valuation adjustments of changes to our
counterparties’ credit spreads. It may reflect eligible CVA
hedges (as defined in CRR), but it excludes those hedges
that, although used for risk-management purposes, are
ineligible for inclusion in the regulatory CVA VaR model.
Examples of such hedges are interest rate hedges, or those
that do not reference the specific exposures they are
intended to mitigate, but are nevertheless highly correlated
to the underlying credit risk.
Other Credit Risk-Weighted Assets
Credit RWAs also include the following components:
Cleared Transactions
RWAs for cleared transactions and default fund
contributions (defined as payments made by clearing
members to central clearing agencies pursuant to mutualised
loss arrangements) are calculated based on specific rules
within CRR. A majority of our exposures on centrally
cleared transactions are to counterparties that are considered
to be Qualifying Central Counterparties (QCCPs) in
accordance with the European Market Infrastructure
Regulation (EMIR). Such exposures may arise from OTC
derivatives, exchange-traded derivatives, and securities
financing transactions and are required to be risk weighted
at either 2% or 4% based on the specified criteria.
Other Assets
Other assets primarily include fixed assets, and assets for
which there is no defined capital methodology or that are
not material. RWAs for other assets are generally based on
the carrying value and are typically risk weighted at 100%.
Equity Exposures in the Banking Book
The bank has direct investments in private equity securities
of its affiliated companies. These investments are typically
longer-term in nature and they are therefore classified for
regulatory capital purposes as banking book equity
investments.
Past due exposures, impaired exposures and impairment provisions
Payments aged more than a threshold of 90 days on any
material credit obligation to the bank are considered past
due.
An exposure is considered impaired when it is probable that
the borrower will be unable to pay all amounts due
according to the contractual terms of the loan agreement.
The bank’s definition of unlikeliness to pay includes the
distressed restructuring of an obligation, including bank
loan obligations, that results in deferred or reduced payment
to GS, whether or not counterparty is in bankruptcy,
insolvency or local jurisdictional equivalent.

GOLDMAN SACHS BANK EUROPE SE
Pillar 3 Disclosures
December 2020 | Pillar 3 Disclosures 24
Expected Credit Losses
The bank assesses the expected credit losses (ECL)
associated with financial assets measured at amortised cost
on a forward looking basis in accordance with the
provisions of IFRS 9 in conjunction with IDW RS BFA 7.
For information on GSBE’s ECL associated with financial
assets measured at amortised cost, see GSBE’s 2020
Financial Statements.
GOLDMAN SACHS BANK EUROPE SE
Pillar 3 Disclosures
December 2020 | Pillar 3 Disclosures 25
Securitisations
Overview
CRR defines certain activities as securitisation transactions
which attract capital requirements under the “Securitisation
Framework.” A securitisation is defined as a transaction or
scheme, whereby the credit risk associated with an exposure
or pool of exposures is tranched, having both of the
following characteristics:
Payments in the transaction or scheme are dependent
upon the performance of the exposure or pool of
exposures; and
The subordination of tranches determines the
distribution of losses during the ongoing life of the
transaction or scheme.
The rules also distinguish between traditional and synthetic
securitisations, the primary difference being that a traditional
securitisation involves the transfer of assets from a bank’s
balance sheet into a securitisation vehicle, whereas a
synthetic securitisation involves the transfer of credit risk
through credit derivatives or guarantees.
Within GSBE, we currently hold the risk retention portion of
securitised residential mortgages issued by securitisation
vehicles (e.g., trusts and special purpose vehicles) as part of
our role as the originator.
Beneficial interests issued by securitisation entities are debt
or equity securities that give the investors rights to receive all
or portions of specified cash inflows to a securitisation
vehicle and include senior and subordinated interests in
principal, interest and/or other cash inflows. The proceeds
from the sale of beneficial interests are used to pay the
transferor for the financial assets sold to the securitisation
vehicle or to purchase securities which serve as collateral.
We account for a securitisation as a sale when we have
relinquished control over the transferred financial assets.
Prior to securitisation, we account for assets pending transfer
at fair value and therefore do not typically recognise
significant gains or losses upon the transfer of assets. GSBE
did not, as of December 31, 2020 have assets held with the
intent to securitise.
Banking Book Activity
All securitisation exposures as of December 31, 2020 were
classified in the banking book. The securitisation exposures
in the banking book within GSBE that meet the regulatory
definition of a securitisation are exposures that we hold
under the E.U. securitisation retention rule of 5% that
originators must comply with. Under this rule, originators are
required to withhold securities not below 5% of the total
issuances.
By engaging in the banking book securitisation activities
noted above, we are primarily exposed to credit risk and to
the performance of the underlying assets. Liquidity risk
associated with securitisations is consistently managed as
part of the bank’s overall liquidity risk management
framework. For additional details on GSBE’s risk
management process and practices, see “Credit Risk” and
“Market Risk” sections of this report, which also apply to
securitisation positions covered in this chapter.
Calculation of Risk-Weighted Assets
The current securitisation framework came into effect in
2019. All securitisations are capitalised under this
securitisation framework.
The hierarchy consists of three primary methods, the SEC-
IRBA (Internal Ratings Based Approach), SEC-SA
(Standardised Approach), and SEC-ERBA (External Ratings
Based Approach). The External Credit Assessment
Institutions (ECAIs) used for the SEC-ERBA are Standard &
Poor’s Ratings Services (S&P), Moody’s Investors Service
(Moody’s) and Fitch, Inc. (Fitch) for all types of exposures.
For trading and banking book positions we follow the
hierarchy of RWA approaches.
The RWAs for securitisation positions are calculated by
multiplying the exposure amount by the specific risk-
weighting factors assigned. The exposure amount is defined
as the carrying value for securities, or the market value of the
effective notional of the instrument or indices underlying
derivative positions. The securitisation capital requirements
are capped at the maximum loss that could be incurred on
any given transaction.

GOLDMAN SACHS BANK EUROPE SE
Pillar 3 Disclosures
December 2020 | Pillar 3 Disclosures 26
The following tables show our securitisation exposures in the banking book by type of exposure and risk weight band as of
December 31, 2020.
Table 13: Securitisation Exposures by Type
€ in thousands As of December 2020
On-balance-sheet Exposures Off-balance-sheet Exposures Total Exposure Amount
Traditional Synthetic
Residential mortgages € 17,401 - € 17,401
Commercial mortgages - - -
Corporates - - -
Asset-backed and other - - -
Total € 17,401 - € 17,401
Table 14: Securitisation Exposures and Related RWAs by Risk Weight Bands
€ in thousands As of December 2020
Exposure Amount RWAs
0% - 25% € 15,191 € 1,519
26% - 100% 1,139 686
101% - 250% 220 489
251% - 650% - -
651% - 1,250% 850 10,627
Total € 17,401 € 13,321

GOLDMAN SACHS BANK EUROPE SE
Pillar 3 Disclosures
December 2020 | Pillar 3 Disclosures 27
Market Risk
Overview
Market risk is the risk of loss in the value of inventory,
investments, loans and other financial assets and liabilities
accounted for at fair value, due to changes in market
conditions. Categories of market risk include the following:
Interest rate risk: results from exposures to changes
in the level, slope and curvature of yield curves,
the volatilities of interest rates, prepayment
speeds and credit spreads;
Equity price risk: results from exposures to
changes in prices and volatilities of individual
equities, baskets of equities and equity indices;
Currency rate risk: results from exposures to
changes in spot prices, forward prices and
volatilities of currency rates; and
Commodity price risk: results from exposures to
changes in spot prices, forward prices and
volatilities of commodities, such as crude oil,
petroleum products, natural gas, electricity, and
precious and base metals.
Market Risk, which is independent of the revenue-producing
units and reports to the firm’s chief risk officer and locally
into GSBE’s chief risk officer, has primary responsibility for
assessing, monitoring and managing market risk through
firmwide oversight across global businesses.
Managers in revenue-producing units and Market Risk
discuss market information, positions and estimated loss
scenarios on an ongoing basis. Managers in revenue-
producing units are accountable for managing risk within
prescribed limits. These managers have in-depth knowledge
of their positions, markets and the instruments available to
hedge their exposures.
Market Risk Management Process
The bank’s process for managing market risk is described in
the “Overview and Structure of Risk Management” within
“Management Report” of GSBE’s 2020 Financial
Statements, as well as the following:
Monitoring compliance with established market
risk limits and reporting our exposures;
Diversifying exposures;
Controlling position sizes; and
Evaluating mitigants, such as economic hedges in
related securities or derivatives.
Market Risk produces risk measures and monitors them
against established market risk limits. These measures
reflect an extensive range of scenarios and the results are
aggregated at product, business and firmwide levels. For
additional information regarding market risk measures and
risk limits, see “Market Risk Management” within
“Management Report” of GSBE’s 2020 Financial
Statements.
Market Risk-Weighted Assets
Trading book positions are subject to market risk capital
requirements which are designed to cover the risk of loss in
value of these positions due to changes in market conditions.
These capital requirements are determined either by
applying prescribed risk weighting factors, or they are based
on internal models which are subject to various qualitative
and quantitative parameters. The CRR market risk capital
rules require that a firm obtains prior written permission
from its regulators before using any internal model to
calculate its risk-based capital requirement. GSBE has been
granted temporary tolerance to use the Internal Model
Approach (IMA).
For positions captured by GSBE’s model permission, the
capital requirements for market risk are calculated using the
following internal models: Value-at-Risk (VaR), Stressed
VaR (SVaR), and Incremental Risk Charge (IRC). In
addition, Standardised Rules, in accordance with Title IV of
Part Three of CRR, are used to calculate capital
requirements for market risk for certain securitised and non-
securitised positions by applying risk-weighting factors
predetermined by regulators, to positions after applicable
netting is performed. RWAs for market risk are the sum of
each of these measures multiplied by 12.5. An overview of
each of these measures is provided below.
Regulatory VaR
VaR is the potential loss in value of trading assets and
liabilities, as well as certain investments, loans, and other
financial assets and liabilities accounted for at fair value,
due to adverse market movements over a defined time
horizon with a specified confidence level. For both risk
management purposes (positions subject to VaR limits) and
regulatory capital calculations, the firm uses a single VaR
model, which captures risks including those related to
interest rates, equity prices, currency rates and commodity

GOLDMAN SACHS BANK EUROPE SE
Pillar 3 Disclosures
December 2020 | Pillar 3 Disclosures 28
prices. As such, VaR facilitates comparison across portfolios
of different risk characteristics. VaR also captures the
diversification of aggregated risk at the firmwide level.
VaR used for regulatory capital requirements (Regulatory
VaR) differs from risk management VaR due to different
time horizons and confidence levels (10-day and 99% for
Regulatory VaR vs. one-day and 95% for risk management
VaR), as well as differences in the scope of positions on
which VaR is calculated. The 10-day VaR is based on
scaling the 1-day VaR by the square root of 10.
VaR is calculated daily using historical simulations with full
valuation of market factors, capturing both general and
specific market risk. VaR is calculated at a positional level
based on simultaneously shocking the relevant market risk
factors for that position, using a mix of absolute and relative
returns. We sample from five years of historical data to
generate the scenarios for our VaR calculation. The
historical data is weighted so that the relative importance of
data reduces over time. This gives greater importance to
more recent observations and reflects current asset
volatilities.
In accordance with the CRR market risk regulatory capital
requirements, we evaluate the accuracy of our VaR model
through daily backtesting. The results of the backtesting
determine the size of the VaR multiplier used to compute
RWAs.
Table 15 presents our period end, maximum, minimum and
average daily GSBE 99% 10-day Regulatory VaR over the
twelve-month period ended December 2020.
Stressed VaR
SVaR is the potential loss in value of trading assets and
liabilities, as well as certain investments, loans, and other
financial assets and liabilities accounted for at fair value,
during a period of significant market stress. SVaR is based
on a full valuation at a 99% confidence level over a 10-day
time horizon using market data inputs from a continuous 12-
month period of stress. The 10-day SVaR is calculated as
the 1-day SVaR scaled by the square root of 10. We identify
the stressed period by comparing VaR using market data
inputs from different historical periods.
Table 15 presents our period end, maximum, minimum and
average weekly GSBE 99% 10-day SVaR over the twelve-
month period ended December 2020.
Incremental Risk
Incremental risk is the potential loss in value of non-
securitised positions due to the default or credit migration of
issuers of financial instruments over a one-year time
horizon. As required by the CRR market risk regulatory
capital rules, this measure is calculated at a 99.9%
confidence level over a one-year time horizon. It uses a
multi-factor model assuming a constant level of risk. When
assessing the risk, we take into account market and issuer-
specific concentration, credit quality, maturity of the debt
and correlation of default and migration risk. The average
liquidity horizon as of December 2020 was 3 months.
Table 15 presents our period end, maximum, minimum and
average weekly GSBE Incremental risk measure over the
twelve-month period ended December 2020
Table 15: IMA values for trading portfolios
€ in thousands As of December 2020
VaR (10 day 99%)
1 Maximum value 18,140
2 Average value 1,378
3 Minimum value -
4 Period end 11,029
SVaR (10 day 99%)
5 Maximum value 31,001
6 Average value 5,606
7 Minimum value -
8 Period end 27,374
IRC (99.9%)
9 Maximum value 101,571
10 Average value 15,919
11 Minimum value -
12 Period end 63,046
Comprehensive risk capital charge (99.9%)
13 Maximum value -
14 Average value -
15 Minimum value -
16 Period end -
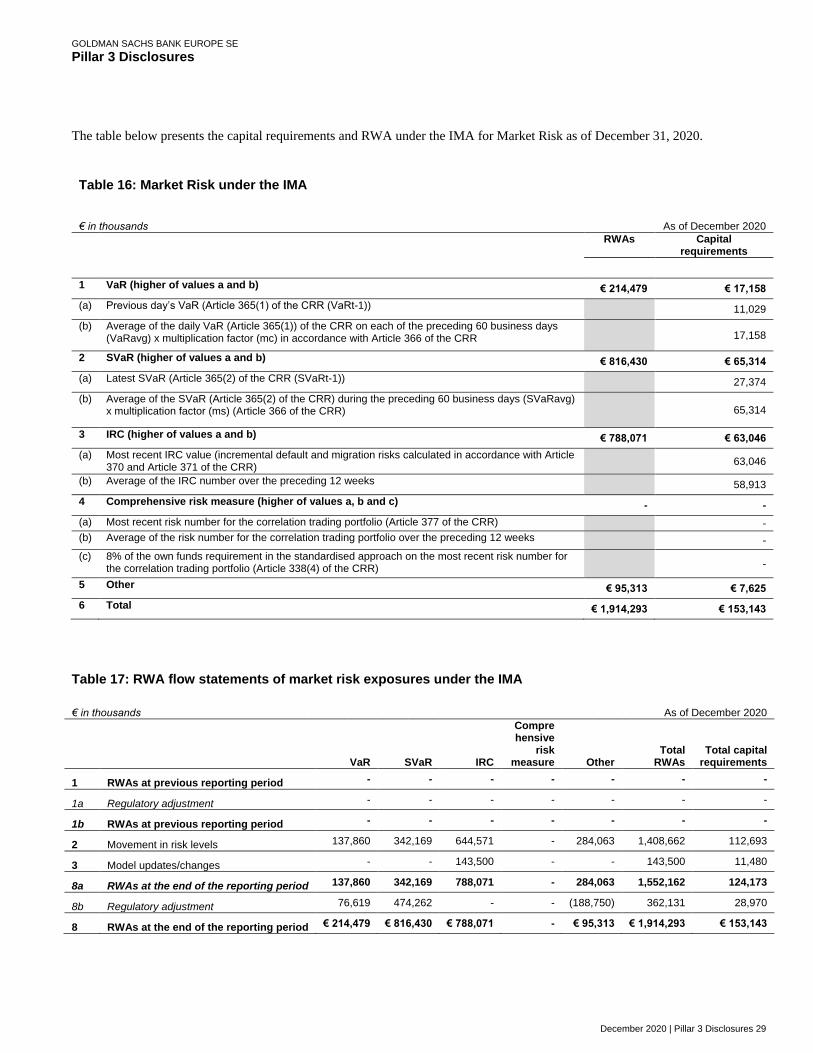
GOLDMAN SACHS BANK EUROPE SE
Pillar 3 Disclosures
December 2020 | Pillar 3 Disclosures 29
The table below presents the capital requirements and RWA under the IMA for Market Risk as of December 31, 2020.
Table 16: Market Risk under the IMA
€ in thousands As of December 2020
RWAs Capital
requirements
1 VaR (higher of values a and b) € 214,479 € 17,158
(a) Previous day’s VaR (Article 365(1) of the CRR (VaRt-1)) 11,029
(b) Average of the daily VaR (Article 365(1)) of the CRR on each of the preceding 60 business days (VaRavg) x multiplication factor (mc) in accordance with Article 366 of the CRR 17,158
2 SVaR (higher of values a and b) € 816,430 € 65,314
(a) Latest SVaR (Article 365(2) of the CRR (SVaRt-1)) 27,374
(b) Average of the SVaR (Article 365(2) of the CRR) during the preceding 60 business days (SVaRavg) x multiplication factor (ms) (Article 366 of the CRR) 65,314
3 IRC (higher of values a and b) € 788,071 € 63,046
(a) Most recent IRC value (incremental default and migration risks calculated in accordance with Article 370 and Article 371 of the CRR)
63,046
(b) Average of the IRC number over the preceding 12 weeks 58,913
4 Comprehensive risk measure (higher of values a, b and c) - -
(a) Most recent risk number for the correlation trading portfolio (Article 377 of the CRR) -
(b) Average of the risk number for the correlation trading portfolio over the preceding 12 weeks -
(c) 8% of the own funds requirement in the standardised approach on the most recent risk number for the correlation trading portfolio (Article 338(4) of the CRR) -
5 Other € 95,313 € 7,625
6 Total € 1,914,293 € 153,143
Table 17: RWA flow statements of market risk exposures under the IMA
€ in thousands As of December 2020
VaR SVaR IRC
Comprehensive
risk measure Other
Total RWAs
Total capital requirements
1 RWAs at previous reporting period - - - - - - -
1a Regulatory adjustment - - - - - - -
1b RWAs at previous reporting period - - - - - - -
2 Movement in risk levels 137,860 342,169 644,571 - 284,063 1,408,662 112,693
3 Model updates/changes - - 143,500 - - 143,500 11,480
8a RWAs at the end of the reporting period 137,860 342,169 788,071 - 284,063 1,552,162 124,173
8b Regulatory adjustment 76,619 474,262 - - (188,750) 362,131 28,970
8 RWAs at the end of the reporting period € 214,479 € 816,430 € 788,071 - € 95,313 € 1,914,293 € 153,143

GOLDMAN SACHS BANK EUROPE SE
Pillar 3 Disclosures
December 2020 | Pillar 3 Disclosures 30
Model Review and Validation
The models discussed above, which are used to determine
Regulatory VaR, SVaR and Incremental risk, are
independently reviewed, validated and approved by Model
Risk Management.
These models are regularly reviewed and enhanced in order
to incorporate changes in the composition of positions
included in market risk measures, as well as variations in
market conditions. Prior to implementation in production,
any changes to those models are subject to validation and
approval by Model Risk Management.
Regulatory VaR Backtesting Results
As required by the CRR market risk capital rules, we
validate the accuracy of our Regulatory VaR models by
backtesting the output of such models against daily loss
results. The number of exceptions (that is, the number of
overshootings based on comparing the higher of positional
or actual losses to the corresponding 99% one-day
Regulatory VaR) over the most recent 250 business days is
used to determine the size of the VaR multiplier, which
could increase from a minimum of three to a maximum of
four, depending on the number of exceptions
As defined in the CRR market risk capital rules,
hypothetical net revenues for any given day represent the
impact of that day’s price variation on the value of positions
held at the close of business the previous day. As a
consequence, these results exclude certain revenues
associated with market-making businesses, such as bid/offer
net revenues, which are more likely than not to be positive
by their nature. In addition, hypothetical net revenues used
in our Regulatory VaR backtesting relate only to positions
which are included in Regulatory VaR and, as noted above,
differ from positions included in our risk management VaR.
This measure of hypothetical net revenues is used to
evaluate the performance of the Regulatory VaR model and
is not comparable to our actual daily net revenues.
GSBE’s hypothetical losses or actual losses observed on a
single day did not exceed our 99% one-day Regulatory VaR
during 12 months preceding December 2020. Note that,
although a one-day time horizon is used for backtesting
purposes, a 10-day time horizon is used, as described earlier,
to determine RWAs associated with Regulatory VaR.
The table below presents our 99% one-day Regulatory VaR
and hypothetical and actual PnL during the previous 12
months.
Table 18: Comparison of VaR estimates with gains/losses
The table below summarizes the number of reported
excesses for GSBE for the previous 12 months.
Number of reported excesses
Multiplier Hypothetical Actual
Backtesting
GSBE 3.00 0 0
Stress Testing
Stress testing is a method of determining the effect of
various hypothetical stress scenarios on the firm and GSBE
individually. Stress testing is used to examine risks of
specific portfolios as well as the potential impact of
significant risk exposures across GSBE. A variety of stress
testing techniques is used to calculate the potential loss from
a wide range of market moves on portfolios, including
firmwide stress tests, sensitivity analysis and scenario
analysis.
For a detailed description of the bank’s stress testing
practices, see “Market Risk Management –Stress Testing”
within “Management Report” of GSBE’s 2020 Financial
Statements.

GOLDMAN SACHS BANK EUROPE SE
Pillar 3 Disclosures
December 2020 | Pillar 3 Disclosures 31
The table below presents the components of own funds
requirements under Standardised approach as of December
31, 2020.
Table 19: Market Risk under the Standardised Approach
€ in thousands As of December 2020
RWAs
Capital requirements
Outright products
1 Interest rate risk (general and specific)
€ 291,118 € 23,289
2 Equity risk (general and specific)
- -
3 Foreign exchange risk 50,883 4,071
4 Commodity risk - -
4a Collective investment undertakings
- -
Options
5 Simplified approach - -
8 Securitisation (specific risk) - -
9 Total € 342,001 € 27,360
Interest Rate Sensitivity
Interest Rate Risk in the Banking Book
Our exposure to interest rate risk in the banking book
(IRRBB) arises from differences in interest earned or paid as
interest rates change, due to the reset characteristics of our
assets and liabilities.
The impact of an interest rate shock on the economic value
of the bank’s banking book is simulated monthly, utilizing
multiple assumptions. GSBE uses the same metrics in its
internal risk management as it applies for the disclosure,
assuming a spot balance sheet shock with instantaneous and
unexpected parallel shift in interest rates (+/-100 basis
points). In the scenario -100 basis points, the yield curve is
not floored, allowing interest rates to go negative.
As of December 31, 2020, the Economic Value of Equity
(EVE) is disclosed in GSBE’s 2020 Financial Statements.
The IRRBB exposure is materially Euro denominated and
other currencies are not material. For further information
regarding IRRBB, see “Market Risk Management – Interest
Rate Risk in the banking Book (IRRBB)” within
“Management Report” of GSBE’s 2020 Financial
Statements.

GOLDMAN SACHS BANK EUROPE SE
Pillar 3 Disclosures
December 2020 | Pillar 3 Disclosures 32
Operational Risk
Overview
Operational risk is the risk of an adverse outcome resulting
from inadequate or failed internal processes, people,
systems, or from external events. GSBE’s exposure to
operational risk arises from routine processing errors, as
well as extraordinary incidents, such as major systems
failures or legal and regulatory matters.
Potential types of loss events related to internal and
external operational risk include:
Clients, products and business practices;
Execution, delivery and process management;
Business disruption and system failures;
Employment practices and workplace safety;
Damage to physical assets;
Internal fraud; and
External fraud.
Operational Risk, which is independent of revenue-
producing units and reports to GS Group’s chief risk officer
and locally into GSBE’s chief risk officer, has primary
responsibility for developing and implementing a formalised
framework for assessing, monitoring, and managing
operational risk with the goal of maintaining GSBE’s
exposure to operational risk at levels that are within its risk
appetite.
Operational Risk Management Process
GSBE’s process for managing operational risk includes the
critical components of the risk management framework
described in “Overview and Structure of Risk Management”
in the Management Report within the bank’s 2020 Annual
Financial Report.
The firm combines top-down and bottom-up approaches to
manage and measure operational risk. From a top-down
perspective, senior management assesses firmwide and
business-level operational risk profiles. From a bottom-up
perspective, the first and second lines of defence are
responsible for risk identification and risk management on a
day-to-day basis, including escalating operational risks to
senior management.
The firm maintains a comprehensive control framework
designed to provide a well-controlled environment to
minimise operational risks. The GSBE Operational Risk
Committee provides oversight of the ongoing development
and implementation of operational risk policies, framework
and methodologies, with oversight from the directors of the
firm, and monitors the effectiveness of operational risk
management.
GSBE’s operational risk management framework is
designed to comply with the operational risk measurement
rules under the Capital Framework at GS Group level and
has evolved based on the changing needs of its businesses
and regulatory guidance, including at the GSBE entity level.
A comprehensive data collection process is in place,
including firmwide policies and procedures, for operational
risk events.
Policies are in place that require all employees to report and
escalate operational risk events. When operational risk
events are identified, the policies require that the events be
documented and analysed to determine whether changes are
required in the systems and/or processes to further mitigate
the risk of future events.
GSBE uses operational risk management applications to
capture and organise operational risk event data and key
metrics. One of the key risk identification and assessment
tools is an operational risk and control self-assessment
process, which is performed by managers across the firm.
This process consists of the identification and rating of
operational risks, on a forward-looking basis, and the related
controls. The results from this process are analysed to
evaluate operational risk exposures and identify businesses,
activities or products with heightened levels of operational
risk.

GOLDMAN SACHS BANK EUROPE SE
Pillar 3 Disclosures
December 2020 | Pillar 3 Disclosures 33
Risk Measurement
GSBE measures operational risk exposure using both
statistical modelling and scenario analyses, which involves
qualitative and quantitative assessments of internal and
external operational risk event data and internal control
factors for each of our businesses. Operational risk
measurement also incorporates an assessment of business
environment factors, including:
Evaluations of the complexity of business
activities;
The degree of automation in our processes;
New activity information;
The legal and regulatory environment; and
Changes in the markets for our products and
services, including the diversity and sophistication
of our customers and counterparties.
The results from these scenario analyses are used to monitor
changes in operational risk and to determine business lines
that may have heightened exposure to operational risk.
These analyses are used in the determination of the
appropriate level of operational risk capital to hold in
accordance with GSBE’s internal capital adequacy
framework.
Model Review and Validation
The models used to measure operational risk exposure are
independently reviewed, validated and approved by the
Model Risk Management.
Capital Requirements
The operational risk capital requirements for GSBE is
calculated under the Basic Indicator Approach in accordance
with the CRR.
Table 20: Operational Risk Capital Requirement
€ in thousands As of December 2020
Basic Indicator Approach € 25,055

GOLDMAN SACHS BANK EUROPE SE
Pillar 3 Disclosures
December 2020 | Pillar 3 Disclosures 34
Model Risk
Overview
Model risk is the potential for adverse consequences from
decisions made based on model outputs that may be
incorrect or used inappropriately. The firm relies on
quantitative models across business activities primarily to
value certain financial assets and liabilities, to monitor and
manage risk, and to measure and monitor regulatory capital.
Model Risk Management, which is independent of revenue-
producing units, model developers, model owners and
model users, and reports to the firm’s chief risk officer and
locally to the GSBE’s chief risk officer, has primary
responsibility for assessing, monitoring and managing
model risk through oversight across global businesses, and
provides periodic updates to senior management, risk
committees and the Risk Committee of the GS Board.
GSBE’s framework for managing model risk is consistent
with and part of GS Group’s framework.
The firm’s model risk management framework is managed
through a governance structure and risk management
controls, which encompass standards designed to ensure we
maintain a comprehensive model inventory, including risk
assessment and classification, sound model development
practices, independent review and model-specific usage
controls. The Firmwide Model Risk Control Committee
oversees the model risk management framework.
Model Review and Validation Process
Model Risk Management consists of quantitative
professionals who perform an independent review,
validation and approval of the firm’s models. This review
includes an analysis of the model documentation,
assumptions, input and output data, limitations and
uncertainties, independent testing, an assessment of the
appropriateness of the methodology used, verification of
compliance with model development and implementation
standards, and assessment of adequacy of the ongoing
monitoring plan.
The firm regularly refines and enhances models to reflect
changes in market or economic conditions and its business
mix. All models are reviewed on an annual basis, and new
models or significant changes to existing models and their
assumptions are approved prior to implementation.
The model validation process incorporates a review of
models and their assumptions in order to critically evaluate
and verify the model’s conceptual soundness, suitability of
calculation techniques, accuracy and sensitivity to input
parameters and assumptions, as well as the scope of testing
performed by the model developers
See “Liquidity Risk Management”, “Market Risk”, “Credit
Risk”, and “Operational Risk” for further information about
the use of models within these areas.

GOLDMAN SACHS BANK EUROPE SE
Pillar 3 Disclosures
December 2020 | Pillar 3 Disclosures 35
Leverage Ratio
GSBE is required to monitor and disclose its leverage ratio
using the CRR’s definition of exposure as amended by the
European Commission Leverage Ratio Delegated Act. In
June 2019, the European Commission published updates to
the CRR to implement a 3% minimum leverage ratio
requirement for certain E.U. financial institutions, including
GSBE. This leverage ratio compares CRR’s definition of
Tier 1 capital to a measure of leverage exposure, defined as
the sum of certain assets plus certain off-balance-sheet
exposures (which include a measure of derivatives,
securities financing transactions, commitments and
guarantees), less Tier 1 capital deductions. The required
minimum leverage ratio became effective for GSBE on 27
June 2021. This leverage ratio is based on our current
interpretation and understanding of this rule and may evolve
in the future.
Table 21: Leverage Ratio7
€ in thousands As of December 2020
Tier 1 Capital € 3,180,504
Leverage Ratio Exposure € 31,711,938
Leverage Ratio 10.03%
7 The ratio is calculated using the regulatory capital resources as of
December 31, 2020 excluding 2020 year-end profits in accordance with Article 26(2) of the regulation 575/2013. Including such profits would, ceteris paribus, increase the Leverage Ratio to 10.33%.

GOLDMAN SACHS BANK EUROPE SE
Pillar 3 Disclosures
December 2020 | Pillar 3 Disclosures 36
The following tables present further information on the leverage ratio. Table 22 reconciles the exposure measure to the balance
sheet of GSBE. Table 23 breaks down the exposures from on-balance sheet assets by trading and banking book. Table 24 gives
further details on the adjustments and drivers of the leverage ratio.
Table 22: Summary Reconciliation of Accounting Assets and Leverage Ratio Exposures
€ in thousands As of December 2020
Total assets as per published financial statements € 56,795,861
Adjustment for entities which are consolidated for accounting purposes but are outside the scope of regulatory consolidation
-
Adjustment for fiduciary assets recognised on the balance sheet pursuant to the applicable accounting framework but excluded from the leverage ratio exposure measure in accordance with Article 429(13) of Regulation (EU) No 575/2013 "CRR"
-
Adjustments for derivative financial instruments* (24,182,513)
Adjustments for securities financing transactions* 59,169
Adjustment for off-balance sheet items* 944,870
Adjustment for intragroup exposures excluded from the leverage ratio exposure measure in accordance with Article 429(7) of Regulation (EU) No 575/20131
-
Adjustment for exposures excluded from the leverage ratio exposure measure in accordance with Article 429(14) of Regulation (EU) No 575/2013
(1,853,845)
Other adjustments (51,603)
Total leverage ratio exposure € 31,711,938
*Differences between the accounting values recognised as assets on the balance sheet and the leverage ratio exposure values. A further breakdown
of these amounts can be found in Table 24.
Table 23: On-Balance Sheet Exposures
€ in thousands As of December 2020
Total on-balance sheet exposures (excluding derivatives, SFTs, and exempted exposures), of which: € 9,751,203
Trading book exposures € 6,332,764
Banking book exposures, of which: € 3,418,439
Covered bonds -
Exposures treated as sovereigns 2,635,011
Exposures to regional governments, MDB, international organisations and PSE not treated as sovereigns 112
Institutions 518,517
Secured by mortgages of immovable properties -
Retail exposures -
Corporate 142,154
Exposures in default -
Other exposures 122,646

GOLDMAN SACHS BANK EUROPE SE
Pillar 3 Disclosures
December 2020 | Pillar 3 Disclosures 37
Table 24: Leverage Ratio Common Disclosure
€ in thousands As of December 2020
On-balance sheet exposures (excluding derivatives and SFTs)
On-balance sheet items (excluding derivatives, SFTs and fiduciary assets, but including collateral) € 17,233,692
Asset amounts deducted in determining Tier 1 capital (51,603)
Total on-balance sheet exposures (excluding derivatives, SFTs and fiduciary assets) € 17,182,090
Derivative exposures
Replacement cost associated with all derivatives transactions (ie net of eligible cash variation margin) 2,329,100
Add-on amounts for PFE associated with all derivatives transactions (mark-to-market method) 15,424,719
Exposure determined under Original Exposure Method -
Gross-up for derivatives collateral provided where deducted from the balance sheet assets pursuant to the applicable accounting framework
-
Deductions of receivables assets for cash variation margin provided in derivatives transactions (5,497,200)
Exempted CCP leg of client-cleared trade exposures (777,149)
Adjusted effective notional amount of written credit derivatives 53,757,473
Adjusted effective notional offsets and add-on deductions for written credit derivatives (53,056,791)
Total derivative exposures € 12,180,153
SFT exposures
Gross SFT assets (with no recognition of netting), after adjusting for sales accounting transactions 4,475,743
Netted amounts of cash payables and cash receivables of gross SFT assets (1,276,241)
Counterparty credit risk exposure for SFT assets 59,169
Derogation for SFTs: Counterparty credit risk exposure in accordance with Article 429b(4) and 222 of Regulation (EU) No 575/2013
-
Agent transaction exposures -
Exempted CCP leg of client-cleared SFT exposure -
Total securities financing transaction exposures € 3,258,671
Other off-balance sheet exposures
Off-balance sheet exposures at gross notional amount 3,925,683
Adjustments for conversion to credit equivalent amounts (2,980,813)
Other off-balance sheet exposures € 944,870
Exempted exposures in accordance with CRR Article 429(7) and (14) (on and off balance sheet)
Intragroup exposures (solo basis) exempted in accordance with Article 429(7) of Regulation (EU) No 575/2013 (on and off balance sheet)
-
Exposures exempted in accordance with Article 429(14) of Regulation (EU) No 575/2013 (on and off balance sheet) (1,853,845)
Capital and total exposures
Tier 1 capital € 3,180,504
Total leverage ratio exposures € 31,711,938
Leverage ratio
Leverage ratio 10.03%
Leverage ratio (excluding the impact of any applicable temporary exemption of central bank exposures) 9.48%
Choice on transitional arrangements and amount of derecognised fiduciary items
Choice on transitional arrangements for the definition of the capital measure -
Amount of derecognised fiduciary items in accordance with Article 429(11) of Regulation (EU) No 575/2013 -

GOLDMAN SACHS BANK EUROPE SE
Pillar 3 Disclosures
December 2020 | Pillar 3 Disclosures 38
Factors impacting the Leverage Ratio
The leverage ratio has increased from 9.8% in December
2019 to 10.0% in December 2020 due to increase in Tier 1
capital driven by capital injections during the year, partly
offset by increases in On and Off Balance Sheet exposures
reflecting an increase in Balance Sheet size and business
activity throughout the year.
GSBE also applied the “CRR quick fix” allowing for the
exemption of eligible central bank cash balances from the
Leverage Exposures per Article 500b of Regulation (EU)
No 575/2013 as amended by Regulation (EU) 2019/876 and
Regulation (EU) 2020/873. The ratio without application of
this exemption would have been 9.5%.
Risk of Excessive Leverage
The risk of excessive leverage is the risk resulting from a
vulnerability due to leverage or contingent leverage that
may require unintended corrective measures to our business
plan, including distressed selling of assets which might
result in losses or in valuation adjustments to our remaining
assets.
The GSBE ALCO is the primary governance committee for
the management of the bank’s balance sheet. The GSBE
ALCO is responsible for maintaining leverage ratio in
accordance with the levels expressed in the bank’s risk
appetite statement.
We monitor the leverage ratio regularly and have processes
in place to dynamically manage our assets and liabilities.
These processes include:
Monthly leverage ratio monitoring is conducted for GSBE.
Leverage ratio monitoring thresholds have been established
for GSBE and reported to the ALCO, CRO, Chief Financial
Officer, Chief Executive Officer, Risk Committee and
Board if the ratio drops below these escalation thresholds.
Potential new transactions which could have a material
impact on GSBE capital and/or leverage position are
escalated to and approved by Controllers and other
managers from independent control and support functions.

GOLDMAN SACHS BANK EUROPE SE
Pillar 3 Disclosures
December 2020 | Pillar 3 Disclosures 39
Capital Adequacy
Overview
Capital adequacy is of critical importance to us. We have in
place a comprehensive capital management policy that
provides a framework, defines objectives and establishes
guidelines to assist us in maintaining the appropriate level
and composition of capital in both business-as-usual and
stressed conditions.
We determine the appropriate level and composition of
capital by considering multiple factors including current and
future regulatory capital requirements, results of capital
planning and stress testing processes and other factors such
as rating agency guidelines, the business environment and
conditions in the financial markets.
Internal Capital Adequacy Assessment Process
We perform an ICAAP with the objective of ensuring that
GSBE is appropriately capitalised relative to the risks in our
business. We assess capital adequacy based on two
complementary perspectives, the Economic Internal
Perspective and the Normative Perspective. In both
perspectives, we define and articulate capital adequacy
based on the comparison of available capital resources
against the amount of capital needed to mitigate material
risks.
In the Economic Internal Perspective, we define our internal
capital adequacy based on the ratio of our internal capital to
the sum of risks that could have a material impact on our
capital position from an economic (i.e. fair market value)
perspective over a one-year horizon, quantified using
internal methodologies. In the Normative Perspective capital
adequacy is considered from a regulatory and accounting
view, by comparing the regulatory definition of capital
resources to regulatory capital requirements for material
risks. We assess our ability to maintain sufficient capital to
meet Overall Capital Requirements (OCR) in a baseline
scenario and Total SREP Capital Requirements (TSCR)
under an adverse scenario over a three-year projection
horizon.
Our goal is to hold sufficient capital to ensure we remain
adequately capitalised in both the Economic Internal
Perspective and in the Normative Perspective.

GOLDMAN SACHS BANK EUROPE SE
Pillar 3 Disclosures
December 2020 | Pillar 3 Disclosures 40
Own Funds Template
The table below presents further information on the detailed capital position of GSBE, in accordance with the format prescribed
by the Commission Implementing Regulation (EU) No 1423/2013.
Table 25: Own Funds Disclosure
€ in thousands As of December 2020
Capital instruments and the related share premium accounts € 311,271
Paid up capital instruments 310,366
Share premium 905
Retained earnings 366,236
Statutory Reserves 2,586,307
Other Comprehensive Income (31,707)
Common Equity Tier 1 (CET1) capital before regulatory adjustments € 3,232,107
Additional value adjustments (11,018)
Intangible assets (net of related tax liability) (40,193)
Deferred Tax Assets that rely on future profitability, excluding those arising from temporary differences (392)
Total regulatory adjustments to Common equity Tier 1 (CET1) € (51,603)
Common Equity Tier 1 (CET1) capital € 3,180,504
Additional Tier 1 (AT1) capital -
Tier 1 capital (T1 = CET1 + AT1) € 3,180,504
Tier 2 Long Term Sub-Debt 20,000
Tier 2 (T2) capital € 20,000
Total capital (TC = T1 + T2) € 3,200,504
Total risk weighted assets € 7,957,105
Common Equity Tier 1 (as a percentage of risk exposure amount) 39.97%
Tier 1 (as a percentage of risk exposure amount) 39.97%
Total capital (as a percentage of risk exposure amount) 40.22%
Institution specific buffer requirement (CET1 requirement in accordance with article 92 (1) (a) plus capital conservation and countercyclical buffer requirements, plus systemic risk buffer, plus the systemically important institution buffer (G-SII or O-SII buffer), expressed as a percentage of risk exposure amount)
7.76%
Of which: Capital conservation buffer requirement 2.50%
Of which: Counter cyclical buffer requirement 0.01%
Common Equity Tier 1 available to meet buffers (as a percentage of risk exposure amount) 35.5%
Direct and indirect holdings of the capital of financial sector entities where the institution does not have a significant investment in those entities (amount below 10% threshold and net of eligible short positions)
€ 141,495
Direct and indirect holdings by the institution of the CET 1 instruments of financial sector entities where the institution has a significant investment in those entities (amount below 10% threshold and net of eligible short positions)
€ 1,744
GSBE does not make use of any transitional provisions for calculating its regulatory capital resources, including transitional
arrangements on IFRS9 and hence no further disclosures are made in this regard.

GOLDMAN SACHS BANK EUROPE SE
Pillar 3 Disclosures
December 2020 | Pillar 3 Disclosures 41
Countercyclical Capital Buffer Template
The following tables present information on the impact of
the countercyclical capital buffer as prescribed under CRR
440 which came into force from January 1, 2017.
Table 26: Countercyclical Capital Buffer
€ in thousands As of December 2020
Total risk exposure amount
€ 7,957,105
Countercyclical buffer rate
0.01%
Countercyclical buffer requirement
1,015
The geographical distribution of credit exposures relevant
for the calculation of the countercyclical capital buffer is
broken down in Table 27.
As of December 31, 2020 GSBE had recognised exposures
to counterparties from Czech Republic, Hong Kong,
Luxembourg and Norway as implemented in the calculation
of this buffer according to rates set by the ESRB. These are
shown as separate rows below with their respective
contributions to own funds requirements for GSBE.
Table 27: Geographical Distribution of Credit Exposures Relevant for the Calculation of the Buffer
€ in thousands As of December 2020
Exposure
value
for SA
Exposure
value
for IRB
Sum of long
and short
position of
trading book
Value of trading
book exposure
for internal
models
Exposure
value
for SA
Exposure
value
for IRB
Of which:
General
credit
exposures
Of which:
Trading
book
exposures
Of which:
Securiti-
sation
exposures
Total
Czech Republic 1,665 - - 10,546 - - 133 844 - 977 0.3% 0.50%
Hong Kong, Special
Administrative Region Of
China
- - - 36,490 - - - 2,919 - 2,919 1.0% 1.00%
Luxembourg 20,280 - - 32,284 - - 499 293 - 792 0.3% 0.25%
Norway - - - 2 - - - 109 - 109 0.0% 1.00%
Other 789,634 - 138,732 18,128,105 17,401 - 35,331 250,701 1,066 287,098 98.4% 0.00%
Total € 811,579 - € 138,732 € 18,207,427 € 17,401 - € 35,963 € 254,865 € 1,066 € 291,895 100.0% 0.01%
Own
funds
require-
ment
weights
Counter-
cyclical
capital
buffer
rate
Breakdown by Country
General credit
exposuresTrading book exposure Securitisation exposure Own funds requirements

GOLDMAN SACHS BANK EUROPE SE
Pillar 3 Disclosures
December 2020 | Pillar 3 Disclosures 42
Capital Instruments
The following table summarises the main features of capital instruments for GSBE as of December 2020
Table 28: GSBE Capital Instruments’ Main Features Template
€ in thousands
As of December 2020
Issuer GSBE GSBE
Unique Identifier (e.g. CUSIP, ISIN, or Bloomberg identifier for private placement) N/A N/A
Governing law(s) of the instrument Germany Germany
Transitional CRR rules Common Equity Tier 1 Tier 2
Post-transitional CRR rules Common Equity Tier 1 Tier 2
Eligible at solo/(sub-) consolidated/solo&(sub-) consolidated Solo Solo
Instrument type Ordinary share capital Subordinated debt
Amount recognised in regulatory capital € 310,366 € 20,000
Nominal amount of instrument € 310,366 € 20,000
Issue Price At par At par
Redemption Price At par At par
Accounting Classification Shareholders' equity Liability - amortised cost
Original date of issuance8 01/07/2011; 25/02/2019;
07/06/2020 22/03/2004; 15/04/2008
Perpetual or dated Perpetual Perpetual
Original maturity date No maturity No maturity
Issuer call subject to prior supervisory approval No No
Option call date, contingent call dates and redemption amount N/A N/A
Subsequent call dates, if applicable N/A N/A
Fixed or floating dividend / coupon N/A Floating
Coupon rate and any related index No 3-months-euro-libor plus 150
bps
Existence of a dividend stopper No No
Fully discretionary, partially discretionary or mandatory (in terms of timing) Fully Discretionary Mandatory
Fully discretionary, partially discretionary or mandatory (in terms of amount) Fully Discretionary Mandatory
Existence of step up or other incentive to redeem No No
Noncumulative or cumulative Noncumulative Noncumulative
Convertible or non-convertible Nonconvertible Nonconvertible
If convertible, conversion trigger(s) N/A N/A
If convertible, fully or partially N/A N/A
If convertible, conversion rate N/A N/A
If convertible, mandatory or optional conversion N/A N/A
If convertible, specify instrument type convertible into N/A N/A
If convertible, specify issuer of instrument it converts to N/A N/A
Write-down features No No
If write-down, write-down trigger(s) N/A N/A
If write-down, full or partial N/A N/A
If write-down, permanent or temporary N/A N/A
If temporary write-down, description of write-up mechanism N/A N/A
Position in subordination hierarchy in liquidation (specify instrument type immediately senior to instrument)
Tier 2 Repayment of loan only after
claims of other, non-subordinated creditors
Non-compliant transitioned features No No
If yes, specify non-compliant features N/A N/A
Link to the full terms and conditions of capital instrument can be found here:
https://www.goldmansachs.com/disclosures/gsbank-europe-se-disclosures.html Key changes during the period On June 7, 2020, 366,100 shares of € 1 each was allotted to Goldman Sachs International (GSI) for contribution and transfer of
the businesses pertaining to GSI branches into GSBE.
GSBE’s shareholders injected a total of € 2.5bn into free capital reserves over the course of 2020.
8 First date of ordinary share issuance

GOLDMAN SACHS BANK EUROPE SE
Pillar 3 Disclosures
December 2020 | Pillar 3 Disclosures 43
Governance Arrangements
GSBE is managed by its Executive Board under its own
responsibility. The Executive Board carries the full
responsibility for the management of the bank in accordance
with the German Stock Corporation Act. Its members are
appointed and dismissed by the Supervisory Board, an
independent body.
Recruitment and Diversity Policy
In the selection of the members of the Executive Board and
Supervisory Board, a candidate for each role is considered
when, in addition to the actual knowledge, capabilities and
experience required by regulations, professional and
personal competence of the candidates is also demonstrated.
GSBE thereby places the highest requirements on persons
who are considered for selection.
GSBE considers diversity to be a priority for promoting the
participation of qualified women in leadership positions. As
part of the Goldman Sachs Group, GSBE implements the
global principles, measures, and goals for diversity at
Goldman Sachs. Female and male candidates are given
equal consideration. There are no goals or targets to achieve
a specified ratio of female members of the Executive Board
or Supervisory Board. As of December 31, 2020 female
members comprised 50% of the Supervisory Board.
We have set out below the biographies of the members of
the Executive Board and the Supervisory Board of GSBE as
of December 31, 2020, together with the positions and
number of directorships they held at that date, including
those with other Goldman Sachs affiliates.
Risk Committee
The Supervisory Board of GSBE has not formed its own
risk committee, since the Supervisory Board consists of only
four members and the tasks of a risk committee are
performed by the entire Supervisory Board 9 . The
Supervisory Board ordinarily meets at least once per
calendar quarter.
Description of the information flow on risk to the management body
For a description of the information flow on risk to the
management body please refer to Risk Management section
on page 10.
9 Risk Committee has been established as of May 26, 2021, as the
Supervisory Board has been expanded with another independent
Supervisory Board member in April 2021.

GOLDMAN SACHS BANK EUROPE SE
Pillar 3 Disclosures
December 2020 | Pillar 3 Disclosures 44
Table 29a: GSBE Executive Board of Directors
Name Background Director-
ships10
M. Bock
Matthias Bock joined the GSBE Executive Board in July 2011 and is general counsel of GSBE. Within the Executive Board Dr. Bock is also responsible on an interim basis for oversight of the Risk Division. In addition to his duties for GSBE he also oversees the Legal department in Moscow. He joined Goldman Sachs in 2000 in London and transferred to Frankfurt in 2007. He is deputy chairman of the Association of Banks in Hesse and holds different positions within the German Banking Association11 (chairman of its Committee for Foreign Banks, member of its Legal Committee). He also serves on the board of the Civitas-Bernhard-Vogel foundation. Dr. Bock studied in Heidelberg (First State Exam 1992), Hamburg (Second State Exam and Dr. iur. 1995) and at the University of Chicago (LLM 1996). He is admitted to the New York Bar.
1
T. Degn-Petersen
Thomas Degn-Petersen is the chief operating officer of GSBE, having joined the GSBE Executive Board in March 2018. He is also a member of the Board of Goldman Sachs Poland Services Sp. z.o.o., and a non-executive director of Goldman Sachs Saudi Arabia. Mr. Degn-Petersen also serves as the co-branch manager of Goldman Sachs International Bank, Frankfurt. In addition, Mr. Degn-Petersen is a member of the EMEA Operational Risk and Resilience Committee, the Goldman Sachs Bank Europe Risk Committee and is member of the International Banking Committee of the German Banking Association. Previously, Mr. Degn-Petersen was co-head of Controllers in India and global head of the Shared Services Management office from 2014 to 2018. Before that, he relocated to Moscow in 2007 as head of Finance and was head of the Federation in Moscow from 2009 to 2013. He is a qualified accountant and member of the Chartered Institute of Management Accountants. Mr. Degn-Petersen earned a BSc (Hons) in Management Studies from the University of Surrey in 1996.
1
W. Fink
Wolfgang Fink is the chief executive officer of GSBE, having joined the GSBE Executive Board in April 2015. He is responsible for GSBE´s Investment Banking, Global Markets, Asset Management and Private Wealth Management Divisions. In addition, he is member of the firm´s EMEA Conduct Committee and the European Management Committee and head of Goldman Sachs in Germany and Austria12 Dr. Fink joined Goldman Sachs in Mergers & Acquisitions in London in 1993 and later worked in the Principal Investment Area. He subsequently served as co-head of Investment Banking for Russia and Central and Eastern Europe before heading the European Industrials Group in Investment Banking. Dr. Fink was named managing director in 2004 and partner in 2008. Dr. Fink earned an MSc from Vienna University and a PhD in Economics from the European Business School.
1
10 In accordance with Article 91(3), (4) and (5) of Directive 2013/36/EU, we counted directorships within the same group as a single
directorship and did not count directorships in organisations which do not pursue predominantly commercial objectives. Taking into account
such directorships, Dr. Bock holds five directorships, Mr. Degn-Petersen holds five directorships, and Dr. Fink holds three directorships. 11 The Association of Banks in Hesse is renamed to Bankenverband Mitte e.V. as of January 1, 2021. 12 In April 2021 Dr. Fink joined the Board of the Bundesverband Deutscher Banken e.V.

GOLDMAN SACHS BANK EUROPE SE
Pillar 3 Disclosures
December 2020 | Pillar 3 Disclosures 45
Table 29b: GSBE Supervisory Board of Directors13
Name Background Director-
ships14
S. A. Boyle Ms. Boyle joined the GSBE Supervisory Board in July 2015. Ms. Boyle is also a director at GSI and a member of the
Supervisory Boards of Goldman Sachs Group Europe SE and Goldman Sachs Europe SE. She is head of Human Capital Management (HCM) in EMEA and is responsible for HCM manager experience functions globally. She is a member of the European Management Committee, Firmwide Conduct and Operational Risk Committee, EMEA Culture and Conduct Risk Committee and the Vendor Management Operating Committee. Ms. Boyle joined Goldman Sachs in 1999, before which she was a partner at Mills & Reeve Solicitors. Ms. Boyle is also a non-executive director of the Royal Air Force.
1
D. W. McDonogh Mr. McDonogh is the Chair of the Supervisory Board, having joined the GSBE Supervisory Board in February 2018.
Mr. McDonogh is a director at GSI and Goldman Sachs (UK) L.L.C. and a non-executive director of Goldman Sachs Bank USA. He is the chief executive officer of GSIB and chief operating officer for EMEA. Mr. McDonogh chairs the Supervisory Boards of Goldman Sachs Group Europe SE and Goldman Sachs Europe SE. He serves on a number of the firm’s committees including the European Management Committee, Firmwide Enterprise Risk Committee, Firmwide Risk Committee, Firmwide Conduct Committee and the Firmwide Asset Liability Committee. Additionally, Mr. McDonogh chairs the GSIB Management Committee, co-chairs the GSI Risk Committee, the GSIB Risk Committee and the EMEA Conduct Committee. He joined Goldman Sachs in 1994. Mr. McDonogh earned a degree in Finance from the University of Limerick in Ireland.
1
E. E. Stecher Ms. Stecher is the Deputy Chair of the Supervisory Board, having joined the GSBE Supervisory Board in February
2018. She is a director at GSI and a member of the GSI Remuneration Committee. She also chairs the Goldman Sachs Bank USA Board of Directors and is the Deputy Chair of the Supervisory Boards of Goldman Sachs Group Europe SE and Goldman Sachs Europe SE and a chair of boards of directors of the Goldman Sachs Philanthropy Fund. She is chair of the Consent Order Oversight Sub-Committee, and a member of the Firmwide Reputational Risk Committee and Firmwide Enterprise Risk Committee. Ms. Stecher is a trustee emeritus of Columbia University and remains involved in other roles at Columbia University. Ms. Stecher joined Goldman Sachs in 1994, prior to which she was a partner at Sullivan & Cromwell. Ms. Stecher earned a BA from the University of Minnesota and a JD from Columbia Law School.
1
Dr. Feuring Dr. Feuring joined the GSBE Supervisory Board as an independent Supervisory Board member in February 2020. Dr. Feuring is Of Counsel at Sullivan & Cromwell LLP. Before joining Sullivan & Cromwell as a partner in 2001, Dr. Feuring was a partner of Freshfields Bruckhaus Deringer and predecessor firms and worked in the legal department of Deutsche Bank AG. He was admitted to the bar in 1981.
13 The table reflects the members of the Supervisory Board as of December 31, 2020. Ulrich Pukropski joined the GSBE Supervisory Board as
an independent member in April 2021. 14 In accordance with Article 91(3), (4) and (5) of Directive 2013/36/EU, we counted directorships within the same group as a single
directorship and did not count directorships in organisations which do not pursue predominantly commercial objectives. Taking into account
such directorships, Ms. Boyle holds five directorships, Mr. McDonogh holds seven directorships and Ms. Stecher holds seven directorships.

GOLDMAN SACHS BANK EUROPE SE
Pillar 3 Disclosures
December 2020 | Pillar 3 Disclosures 46
Liquidity Risk Management
Introduction
Overview
The liquidity coverage ratio (LCR) is designed to ensure that
a bank maintains an adequate amount of unencumbered
high-quality liquid assets (HQLA) equal to or greater than
the total net cash outflows (NCOs) over a prospective 30
calendar-day stress scenario. GSBE is subject to the
liquidity requirements as set out in the European
Commission Delegated Regulation 2018/1620 and
Delegated Regulation 2015/61 to supplement Regulation No
575/2013 of the European Parliament and the Council with
regard to liquidity coverage requirement for credit
institutions. When we use the term “liquidity standards”, we
refer to the aforementioned regulations.
The EBA guidelines on LCR disclosure (EBA/GL/2017/01)
require banks to disclose, on an annual basis, the average
monthly LCR for the trailing twelve-months.
Liquidity Risk Management
Liquidity risk is the risk that the bank will be unable to fund
itself or meet its liquidity needs in the event of bank-
specific, broader industry, or market liquidity stress events.
The bank has in place a comprehensive and conservative set
of liquidity and funding policies. The bank’s principal
objective is to be able to fund itself and to enable its core
businesses to continue to serve clients and generate
revenues, even under adverse circumstances.
Corporate Treasury, which reports to the bank’s chief
financial officer, has primary responsibility for developing,
managing and executing the bank’s liquidity and funding
strategy within its risk appetite.
Liquidity Risk, which is independent of the revenue-
producing units and Treasury, and reports to the bank’s chief
risk officer, has primary responsibility for assessing,
monitoring and managing the bank’s liquidity risk through
oversight across the bank’s businesses and the establishment
of stress testing and limits frameworks. The bank’s
framework for managing liquidity risk is consistent with,
and part of, the GS Group framework.
Liquidity Coverage Ratio
GSBE’s average monthly LCR for the trailing twelve-month
period ended December 2020 was 240%. This ratio is based
on our current interpretation and understanding of the
liquidity standards and may evolve in the future.
The table below presents a breakdown of the bank’s LCR
calculated in accordance with the liquidity standards.
Table 30: Liquidity Coverage Ratio
Twelve Months Ended December 2020
€ in millions Average Weighted
Total high-quality liquid assets (HQLA)
€ 2,382.45
Net cash outflows € 1,066.84
Liquidity coverage ratio15 240%
We expect business-as-usual fluctuations in our client
activity, business mix and overall market environment to
affect our average LCR on an ongoing basis.
High-Quality Liquid Assets
Total HQLA represents unencumbered, high-quality liquid
assets held by a bank. The liquidity standards define HQLA
in three asset categories: Level 1, Level 2A and Level 2B,
and applies haircuts and limits to certain asset categories.
Level 1 assets are considered the most liquid and are eligible
for inclusion in a bank’s HQLA amount without a haircut or
limit. Level 2A and 2B assets are considered less liquid than
Level 1 assets and are subject to additional adjustments as
prescribed in the liquidity standards. In addition, the sum of
Level 2A and 2B assets cannot comprise more than 40% of
a bank’s HQLA amount, and Level 2B assets cannot
comprise more than 15% of a bank’s HQLA amount.
GSBE’s HQLA substantially consists of Level 1 assets.
Net Cash Outflows
Overview
The liquidity standards define NCOs as the net of cash
outflows and inflows during a prospective stress period of
30 calendar days. The NCOs in GSBE are largely comprised
of prospective outflows related to the company’s unsecured
funding and derivative positions and inflows related to short
15 The ratio reported in this row is calculated as average of the monthly
LCRs for the trailing twelve-month period and may not equal the calculation of ratio using component amounts reported in rows “Total high-quality liquid assets” and “Net cash outflows”

GOLDMAN SACHS BANK EUROPE SE
Pillar 3 Disclosures
December 2020 | Pillar 3 Disclosures 47
term placements with affiliates.
Unsecured and Secured Funding
Unsecured Net Cash Outflows
The company’s sources of funding include
Unsecured long-term borrowings, including
registered bonds (Namensschuldverschreibungen),
loan against borrower’s notes
(Schuldscheindarlehen) and funding from Group
Inc. and affiliates.
Time deposits and demand deposits from private
bank clients, institutional clients and affiliates
The liquidity standards require that the NCOs calculation
reflects a bank’s upcoming maturities of unsecured long-
term borrowing during a 30 calendar-day period, assuming
no rollover of debt that matures. The liquidity standards also
prescribe outflows related to a partial loss of deposits
funding.
Secured Net Cash Outflows
GSBE funds inventory on a secured basis, through various
secured funding transactions including repurchase
agreements, securities loaned and other secured financings.
In addition, we provide financing to our clients for their
securities trading activities, as well as securities lending and
other prime brokerage services.
The liquidity standards consider outflows and inflows
related to secured funding and securities services together as
part of “Secured wholesale funding” and “Secured lending”.
Specifically, under the liquidity standards, secured funding
transactions include repurchase agreements, collateralised
deposits, securities lending transactions and other secured
wholesale funding arrangements. Secured lending
transactions, as defined under the liquidity standards,
include reverse repurchase transactions, margin loans,
securities borrowing transactions and secured loans.
The standardised stress scenario prescribed in the liquidity
standards applies outflow and inflow rates between 0-100%
to secured funding and lending transactions. Specific
outflow and inflow rates are based on factors such as the
quality of the underlying collateral, as well as the type,
tenor, and counterparty of a transaction.
Derivatives
Overview
Derivatives are instruments that derive their value from
underlying asset prices, indices, reference rates and other
inputs, or a combination of these factors. Derivatives maybe
traded on an exchange or they maybe privately negotiated
contracts, which are usually referred to as OTC derivatives.
Certain OTC Derivatives are cleared and settled through
central clearing counterparties, while others are bilateral
contracts between two counterparties.
Market-Making. As a market maker, GSBE enters
into derivative transactions to provide liquidity to
clients and to facilitate the transfer and hedging of
their risks. In this role, we typically act as principal
and are required to commit capital to provide
execution, and maintain inventory in response to, or
in anticipation of, client demand.
Risk Management. GSBE also enters into
derivatives to actively manage risk exposures that
arise from its market-making and investing and
lending activities in derivative and cash
instruments. Our holdings and exposures are
hedged, in many cases, on either a portfolio or risk-
specific basis, as opposed to an instrument-by-
instrument basis. In addition, the bank may enter
into derivatives that are used to manage interest
rate exposure in certain fixed-rate unsecured long-
term and short-term borrowings, and deposits.
GSBE enters into various types of derivatives, including
futures, forwards, swaps and options.
Derivative Net Cash Outflows
The liquidity standards require that NCOs reflect outflows
and inflows resulting from contractual settlements related to
derivative transactions occurring over a 30 calendar-day
period. These outflows and inflows can generally be netted
at a counterparty level if subject to a valid qualifying master
netting agreement. In addition, the liquidity standards
require that NCOs reflect certain contingent outflows related
to a bank’s derivative positions that may arise during a 30
calendar-day stress scenario, including:
Legal right of substitution of collateral posted to a
bank for less liquid or non-HQLA collateral;
Collateral required as a result of market
movements. The liquidity standards require that a
bank reflects in its NCOs calculation the absolute
value of the largest net cumulative collateral
outflow or inflow in a 30 calendar-day period over

GOLDMAN SACHS BANK EUROPE SE
Pillar 3 Disclosures
December 2020 | Pillar 3 Disclosures 48
the last two years; and
Excess collateral greater than the current collateral
requirement under the governing contract that a
bank may be contractually required to return to
counterparty.
Unfunded Commitments
The liquidity standards apply outflow rates to the undrawn
portion of committed credit and liquidity facilities that a
bank has extended based on counterparty type and purpose.
The undrawn portion is defined as the amount of the facility
that could be drawn upon within 30 calendar days under the
governing agreement, less the fair value of any liquid assets
that serve as collateral, after recognising the applicable
haircut for those assets. Commitments extended to non-
financial sector corporates are prescribed an outflow rate of
10-30%, insurance sector entities an outflow rate of 40-
100%, credit institutions an outflow rate of 40% and all
others an outflow rate of 100%.

GOLDMAN SACHS BANK EUROPE SE
Pillar 3 Disclosures
December 2020 | Pillar 3 Disclosures 49
Asset Encumbrance
Overview
Asset encumbrance refers to the pledging or use of an asset
as a means to secure, collateralise or credit-enhance any on-
balance-sheet or off-balance-sheet transaction from which it
cannot be freely withdrawn. The majority of the
encumbrance is driven by derivatives and secured funding
activity. A portion of GSBE’s assets are encumbered in
currencies other than Euros. Asset encumbrance is an
integral part of GSBE’s liquidity, funding and collateral
management process.
The tables in this section identify components of our
encumbered and unencumbered assets for the period ended
December 31, 2020. GSBE has migrated from German
Generally Accepted Accounting Practices (GAAP) to
International Financial Reporting Standards (IFRS) in 2020.
The template results are based on reported metrics, which
reflect accounting standards applied at the time. Median
values are computed over the preceding 4 quarterly data
points. This disclosure is being made in accordance with the
format outlined in Commission Delegated Regulation (EU)
2017/2295 supplementing regulation (EU) No 575/2013 on
the disclosure of encumbered and unencumbered assets.
Table 31: Encumbered and Unencumbered Assets
16 The figures in Table 32 are a subset of Assets of the Reporting Institution in Table 31 17 Cells are marked N/A to indicate those components which are not reportable under EBA Guidelines
€ in thousands
Carrying Amount of
Encumbered Assets
Fair Value of
Encumbered Assets
Carrying Amount of
Unencumbered Assets
Fair Value of
Unencumbered Assets
Of which
notionally eligible
EHQLA and HQLA
Of which
notionally eligible
EHQLA and HQLA
Of which
notionally eligible
EHQLA and HQLA
Of which
notionally eligible
EHQLA and HQLA
Assets of the Reporting Institution 16 3,113 - N/a17 N/a17 14,150 1,969 N/a17 N/a17

GOLDMAN SACHS BANK EUROPE SE
Pillar 3 Disclosures
December 2020 | Pillar 3 Disclosures 50
Table 32: Components of Encumbered and Unencumbered Assets18
€ in thousands
Carrying Amount of Encumbered Assets
Fair Value
of Encumbered Assets
Carrying Amount
of Unencumbered assets
Fair Value
of Unencumbered Assets
Of which
notionally eligible
EHQLA and HQLA
Of which
notionally eligible
EHQLA and HQLA
Of which
notionally eligible
EHQLA and HQLA
Of which
notionally eligible
EHQLA and HQLA
Equity Instruments 1 - N/a19 N/a19 231 - N/a19 N/a19
Debt Securities20 17 - 17 - 166 - 166 -
of which: covered bonds - - - - - - - -
of which: asset-backed securities - - - - - - - -
of which: issued by general governments - - - - 46 - 46 -
of which: issued by financial corporations 17 - 17 - 2 - 2 -
of which: issued by non-financial corporations
- - - - 80 - 80 -
Other Assets 3,096 - N/a19 N/a19 13,93221 1,969 N/a19 N/a19
18 The figures in Table 32 are a subset of Assets of the Reporting Institution in Table 31 19 Cells are marked N/A to indicate those components which are not reportable under EBA Guidelines 20 Fair value is the same as carrying value for Debt Securities 21 The majority of unencumbered Other Assets relate to derivative instrument
The bank receives securities collateral in respect of securities purchased under agreement to resell, secured borrowings and
derivatives. The tables below break down securities collateral received into the portion which has been treated as encumbered and
the portion which is available for encumbrance.
Table 33: Collateral Received
22The figures shown in Table 34 are a subset of Collateral Received by the Reporting Institution in Table 33
23Collateral Received by the Reporting Institution does not include cash collateral which is included as an on-balance-sheet asset in Tables 31 and 32
€ in thousands
Fair Value of Encumbered Collateral Received or Own Debt Securities Issued
Fair Value of Collateral Received or Own Debt Securities Issued Available for Encumbrance
Of which
notionally eligible EHQLA and HQLA
Of which
notionally eligible EHQLA and HQLA
Collateral Received by the Reporting Institution22,23
660 628 831 630

GOLDMAN SACHS BANK EUROPE SE
Pillar 3 Disclosures
December 2020 | Pillar 3 Disclosures 51
Table 34: Components of Collateral Received24
€ in thousands
Fair Value of Encumbered Collateral Received or Own Debt Securities Issued
Fair Value of Collateral Received or Own Debt Securities Issued Available for Encumbrance
Of which
notionally eligible
EHQLA and HQLA
Of which
notionally eligible
EHQLA and HQLA
Loans on Demand - - - -
Equity Instruments 2 - 202 55
Debt Securities 659 628 629 573
of which: covered bonds - - 3 -
of which: asset-backed securities - - - -
of which: issued by general governments 627 601 534 534
of which: issued by financial corporations25 1 - 38 9
of which: issued by non-financial corporations 32 27 26 8
Loans and advances other than loans on demand - - - -
Other Collateral Received - - - -
Own Debt Securities Issued other than Own Covered Bonds or ABSs - - - -
Own Covered Bonds and Asset-Backed Securities issued and not yet pledged N/a26 N/a26 - -
Total Assets, Collateral received and Own Debt Securities Issued 3,773 651 N/a26 N/a26
24The figures shown in Table 34 are a subset of Collateral Received by the Reporting Institution in Table 33 25HQLA balances reported in this row mainly comprise of securities issued by Multinational Development Banks and Public Sector Enterprises 26Cells are marked N/A to indicate those components which are not reportable under EBA Guidelines
The table below shows the extent to which liabilities have been matched to encumbered assets.
Table 35: Sources of Encumbrance
€ in thousands
Matching Liabilities, Contingent Liabilities or
Securities Lent
Assets, Collateral Received and Own Debt Securities Issued other than Covered Bonds and
ABSs Encumbered
Carrying amount of selected financial liabilities27 11,173 3,741
27There may be a mismatch between liabilities and encumbered assets and collateral received driven by the accounting standard presentation of derivatives

GOLDMAN SACHS BANK EUROPE SE
Pillar 3 Disclosures
December 2020 | Pillar 3 Disclosures 52
Commentary
We view GSBE’s level of asset encumbrance as being
higher than the level of asset encumbrance implied in the
preceding tables due to differences in the accounting
standard presentation of derivatives and encumbrance
methodology. In this disclosure, derivative instruments are
reported in accordance with the applicable accounting
standard. In addition, total assets include collateralised
lending where the receivable is reported as a balance sheet
asset in Tables 31 and 32 and the underlying collateral
received is reported in Tables 33 and 34 resulting in double
counting of these assets.
GSBE primarily adopts standard collateral agreements and
collateralises based on industry standard contractual
agreements (mostly Credit Support Annexes (CSA) and
Global Master Repurchase Agreements (GMRAs)). The
rights and obligations on collateral posted to counterparties
for derivatives are dependent on the counterparty and the
nature and jurisdiction of the CSA. Derivative liabilities are
collateralised primarily using G10 currencies and
government bonds.

GOLDMAN SACHS BANK EUROPE SE
Pillar 3 Disclosures
December 2020 | Pillar 3 Disclosures 53
Remuneration Disclosures
Introduction
The following disclosures are made by Goldman Sachs
Bank Europe SE (“GSBE”) in accordance with Article 450
of the EU Capital Requirements Regulation No. 575/2013
(“CRR”).
Remuneration Programme Philosophy
Retention of talented employees is critical to executing the
firm’s business strategy successfully. Remuneration is,
therefore, a key component of the costs the firm incurs to
generate revenues, similar to cost of goods sold or
manufacturing costs in other industries.
The remuneration philosophy and the objectives of the
remuneration programme for the firm are reflected in the
Compensation Principles for The Goldman Sachs Group,
Inc. (“GS Group”), as posted on the Goldman Sachs public
website:
http://www.goldmansachs.com/investor-relations/corporate-
governance/corporate-governance-documents/compensation-
principles.pdf
GS Group’s Compensation Principles were approved by
shareholders at the 2010 annual shareholders’ meeting. In
particular, effective remuneration practices should:
(i) Encourage a real sense of teamwork and
communication, binding individual short-term interests
to the institution’s long-term interests;
(ii) Evaluate performance on a multi-year basis;
(iii) Discourage excessive or concentrated risk-taking;
(iv) Allow an institution to attract and retain proven talent;
and
(v) Align aggregate remuneration for the firm with
performance over the cycle.
Remuneration Governance
The Compensation Committee
The Board of Directors of GS Group (the “Board”) oversees
the development, implementation and effectiveness of the
firm’s global remuneration practices, which it generally
exercises directly or through delegation to the
Compensation Committee of the Board (the “Compensation
Committee”). The responsibilities of the Compensation
Committee include:
Review and approval of (or recommendation to the Board
to approve) the firm’s variable remuneration structure,
including the portion to be paid as equity-based awards,
all year-end equity-based grants for eligible employees
(including those employed by GSBE), and the terms and
conditions of such awards.
Assisting the Board in its oversight of the development,
implementation and effectiveness of policies and
strategies relating to the Human Capital Management
(“HCM”) function, including recruiting, retention, career
development and progression, management succession
(other than that within the purview of the Corporate
Governance and Nominating Committee) and diversity.
The Compensation Committee held 8 meetings in 2020 to
discuss and make determinations regarding remuneration.
The members of the Compensation Committee at the end of
2020 were M. Michele Burns (Chair), Drew G. Faust, Ellen
J. Kullman, Lakshmi N. Mittal and Adebayo O. Ogunlesi
(ex-officio). None of the members of the Compensation
Committee was an employee of the firm. All members of
the Compensation Committee were “independent” within
the meaning of the New York Stock Exchange Rules and
the GS Group Board Policy on Director Independence.
GSBE Board Governance
The GSBE Executive Board (“Executive Board”) is
responsible for overseeing the development and
implementation of the GSBE Compensation Policy. The
GSBE Compensation Policy is designed to ensure alignment
with GSBE’s business and risk strategies. The Executive
Board will ensure that the policy is subject to an
independent internal review at least annually, and, as far as
it applies to the compensation of the Executive Board, by
the Supervisory Board of GSBE (“Supervisory Board”). The
Executive Board will at least annually update the
Supervisory Board on the GSBE Compensation Policy. In
2020, the Executive Board held 13 meetings.
Fixed and variable compensation for GSBE employees
(including in its branches) is determined annually by the
Executive Board or its delegate, based on proposals
developed in the Firmwide global compensation process and
in accordance with the Goldman Sachs Compensation
Principles, the GSBE Compensation Policy and applicable
statutory law. The Executive Board as a body approved at
year-end the aggregate variable compensation spent across
the entity, including GSBE branches.

GOLDMAN SACHS BANK EUROPE SE
Pillar 3 Disclosures
December 2020 | Pillar 3 Disclosures 54
Compensation of the members of the Executive Board is set
each year by the Supervisory Board in accordance with the
Goldman Sachs Compensation Principles, group-wide
processes, the GSBE Compensation Policy and applicable
statutory law.
Other Stakeholders
In carrying out the responsibilities of the Compensation
Committee, the Chair of the Compensation Committee met
multiple times with senior management during the year,
including the firm’s Chief Operating Officer (“COO”), the
Global Head of HCM and other members of senior
management.
The GS Group’s Chief Risk Officer (“CRO”) presented an
annual compensation-related risk assessment to the
Compensation Committee, meeting jointly with the Risk
Committee of the GS Board, to assist the Compensation
Committee in its assessment of the effectiveness of the
firm’s remuneration programme, and particularly, whether
the programme is consistent with the principle that variable
remuneration does not encourage employees to expose the
firm to imprudent risk. This assessment most recently
occurred in December 2020.
In addition, the firm’s EMEA Conduct Committee assists
senior management of GSBE in the oversight of conduct
risk and business standards.
External Consultants
The Compensation Committee recognises the importance of
using a remuneration consultant that is appropriately
qualified and is determined to be independent.
For 2020, the Compensation Committee commissioned the
advice of FW Cook.
Global Remuneration Determination Process
The firm’s global process for setting variable remuneration
(including the requirement to consider risk and compliance
issues) applies to employees of GSBE in the same way as to
employees in other regions and is subject to oversight by the
senior management of the firm in the region. The firm uses
a highly disciplined and robust process for setting variable
remuneration across all divisions and regions.
The process involves divisional compensation managers,
divisional compensation committees, division heads, HCM,
the Firmwide Management Committee (the firm’s most
senior leaders), as appropriate. In addition, as part of the
remuneration determination process, members of the firm’s
Compliance, Risk, Employment Law Group and Employee
Relations functions make arrangements for divisional
management to take into consideration certain compliance,
risk or control matters when determining remuneration of
individuals. Before any individual remuneration decisions
are finalised, Employee Relations and the Employment Law
Group assess the recommended remuneration for relevant
individuals in the context of overall performance and other
factors, and recommendations are reviewed with respect to
comparators.
Additionally, recommendations developed via the global
remuneration determination process for GSBE employees
are presented to the Executive Board for approval, and
recommendations developed for Executive Board members
are presented to the Supervisory Board for approval.
Link Between Pay and Performance
In 2020, annual remuneration for employees generally
comprised fixed remuneration (including base salary) and
variable remuneration. The firm’s remuneration practices
provide for variable remuneration determinations to be
made on a discretionary basis. Variable remuneration is
based on multiple factors and is not set as a fixed percentage
of revenue or by reference to any other formula. Firmwide
performance is a key factor in determining variable
remuneration.
The firm is committed to aligning variable remuneration
with performance. In order to do so, the performance of the
firm, division and individual over the past year, as well as
over prior years, are taken into account. The firm believes
that the firm’s senior leaders have responsibility for overall
performance and, as a result, senior employees have
experienced more volatility in their remuneration year-over-
year, particularly in periods when the firm’s performance
declined significantly.
The firm believes that multi-year guarantees should be
avoided as they risk misaligning remuneration and
performance, and guaranteed variable remuneration should
be awarded in exceptional circumstances only (for example,
for certain new hires).
Performance Measurement
Variable remuneration determinations take into account
firm, division, business unit, desk and individual
performance, as applicable.

GOLDMAN SACHS BANK EUROPE SE
Pillar 3 Disclosures
December 2020 | Pillar 3 Disclosures 55
Firmwide performance
Certain firmwide financial metrics and year-on-year
changes in those metrics are reviewed, including the
following:
Return on average common shareholders’ equity;
Diluted earnings per common share;
Book value per share;
Net revenues
Divisional performance
Additionally, each revenue-producing division has
quantitative and/or qualitative metrics specific to the
division, its business units and, where applicable, desks that
are used to evaluate the performance of the division and its
employees.
Individual performance
Employees are evaluated annually as part of the
performance review feedback process. This process reflects
input from a number of employees, including supervisors,
peers and those who are junior to the employee, regarding
an array of performance measures. The performance
evaluations for 2020 included assessments of Teamwork
and Collaboration (One GS); Compliance, Risk
Management, Code of Conduct, and Firm Reputation;
Sensitivity to Risk and Control (revenue-producing
employees); Control Side Empowerment (control
functions); and Culture.
Risk Adjustment
Prudent risk management is a hallmark of the firm’s culture
and sensitivity to risk and risk management are key
elements in assessing employee performance, including as
part of the performance review feedback process noted
above.
The firm takes risk, including conduct risk, into account
both on an ex-ante and ex-post basis when setting the
amount and form of variable remuneration for employees.
Different lines of business have different risk profiles and
these are taken into account when determining
remuneration. These include credit, market, liquidity,
operational, reputational, legal, compliance and conduct
risks. Guidelines are provided to assist compensation
managers when applying discretion during the remuneration
process to promote consistent consideration of the different
risks presented by the firm’s businesses. Further, to ensure
the independence of control function employees,
remuneration for those employees is not determined by
individuals in revenue-producing positions but rather by the
management of the relevant control function.
Consistent with prior years, for 2020 certain employees
receive a portion of their variable remuneration as an equity-
based award that is subject to a number of terms and
conditions that could result in forfeiture or recapture. For
further details, see “Structure of Remuneration” below.
In the 2020 annual compensation-related risk assessment
presented to the Compensation Committee, meeting jointly
with the Risk Committee of the GS Board, GS Group’s
CRO confirmed that the various components of the firm’s
remuneration programmes and policies (for example,
process, structure and governance) balanced risk and
incentives in a manner that does not encourage imprudent
risk-taking. In addition, the CRO stated that the firm has a
risk management process that, among other things, is
consistent with the safety and soundness of the firm and
focuses on our:
(i) Risk management culture: the firm’s culture emphasises
continuous and prudent risk management
(ii) Risk-taking authority: there is a formal process for
identifying employees who, individually or as part of a
group, have the ability to expose the firm to material
amounts of risk
(iii) Upfront risk management: the firm has tight controls on
the allocation, utilisation and overall management of
risk-taking, as well as comprehensive profit and loss
and other management information which provide
ongoing performance feedback. In addition, in
determining variable remuneration, the firm reviews
performance metrics that incorporate ex-ante risk
adjustments; and
(iv) Governance: the oversight of the GS Group Board,
management structure and the associated processes all
contribute to a strong control environment and control
functions have input into remuneration structure and
design
Structure of Remuneration
In accordance with a resolution of the shareholders of
GSBE, the variable component of remuneration paid to all
employees identified under Article 92(3) of Directive
2013/36/EU as “Risk Taker” of GSBE shall not exceed
200% of the fixed component. Control functions shall not
exceed 50% of the fixed component. The resolution
concluded that the variable compensation ratio does not
incentivise inappropriate risk taking and is consistent with
GOLDMAN SACHS BANK EUROPE SE
Pillar 3 Disclosures
December 2020 | Pillar 3 Disclosures 56
the prudential management of fixed remuneration.
Employees who meet the criteria set out in Section 25a(5b)
Kreditwesengesetz (“KWG”) and all Supervisory Board and
Executive Board members of GSBE (Section 1(21) KWG)
have been identified as Risk Takers.
Fixed Remuneration
The firm has a global salary approach to ensure consistency
in salary levels and to achieve an appropriate balance
between fixed and variable remuneration.
For certain employees additional fixed remuneration is
awarded in the form of an allowance generally paid in cash.
The selection of recipients and the value of allowances
awarded are determined as a result of an evaluation of
professional experience, role and level of organisational
responsibility.
Variable Remuneration
For employees with total remuneration and variable
remuneration above specific thresholds, variable
remuneration is generally paid in a combination of cash and
equity-based remuneration. In general, the portion paid in
the form of an equity-based award increases as variable
remuneration increases.
The variable remuneration programme is flexible to allow
the firm to respond to changes in market conditions and to
maintain its pay-for-performance approach. Variable
remuneration is discretionary (even if paid consistently over
a period of years).
Equity-Based Remuneration
The firm believes that remuneration should encourage a
long-term, firmwide approach to performance and
discourage imprudent risk-taking. Paying a significant
portion of variable remuneration in the form of equity-based
remuneration that delivers over time, changes in value
according to the price of shares of common stock (shares) of
GS Group, and is subject to forfeiture or recapture
encourages a long-term, firmwide focus because its value is
realised through long-term responsible behaviour and the
financial performance of the firm.
The firm imposes transfer restrictions, retention
requirements, and anti-hedging policies to further align the
interests of the firm’s employees with those of the firm’s
shareholders. The firm’s retention and transfer restriction
policies, coupled with the practice of paying senior
employees a significant portion of variable remuneration in
the form of equity-based awards, leads to a considerable
investment in shares of GS Group over time. For equity-
based awards granted to certain employees, performance
conditions may also be applicable.
Deferral Policy: The deferred portion of fiscal year 2020
annual variable remuneration was generally awarded in
the form of RSUs. An RSU is an unfunded, unsecured
promise to deliver a share on a predetermined date. RSUs
awarded in respect of fiscal year 2020 generally deliver in
three equal instalments on or about each of the first,
second and third anniversaries of the grant date, assuming
the employee has satisfied the terms and conditions of the
award at each such date.
Transfer Restrictions: The firm generally requires all
individuals to hold, until the expiration of a period of up
to five years from grant, a material portion of the shares
they receive in respect of RSUs granted as part of their
year-end remuneration according to the firm’s global
deferral table. These transfer restrictions apply to the
lower of 50% of the shares delivered before reduction for
tax withholding, or the number of shares received after
reduction for tax withholding.
An employee generally cannot sell, exchange, transfer,
assign, pledge, hedge or otherwise dispose of any RSUs
or shares that are subject to transfer restrictions.
Forfeiture and Recapture Provisions: The RSUs and
shares delivered thereunder in relation to variable
remuneration are subject to forfeiture or recapture if the
Compensation Committee or its delegate(s) determine(s)
that during 2020 the employee participated (or otherwise
oversaw or was responsible for, depending on the
circumstances, another individual’s participation) in the
structuring or marketing of any product or service, or
participated on behalf of the firm or any of its clients in
the purchase or sale of any security or other property, in
any case without appropriate consideration of the risk to
the firm or the broader financial system as a whole (for
example, if the employee were to improperly analyse risk
or fail sufficiently to raise concerns about such risk) and,
as a result of such action or omission, the Compensation
Committee or its delegate(s) determine(s) there has been,
or reasonably could be expected to be, a material adverse
impact on the firm, the employee’s business unit or the
broader financial system.
This provision is not limited to financial risks and is
designed to encourage the consideration of the full range
of risks associated with the activities (for example, legal,
compliance or reputational). The provision also does not
require that a material adverse impact actually occur, but
rather may be triggered if the firm determines that there is
a reasonable expectation of such an impact.

GOLDMAN SACHS BANK EUROPE SE
Pillar 3 Disclosures
December 2020 | Pillar 3 Disclosures 57
The Compensation Committee previously adopted
guidelines that set forth a formal process regarding
determinations to forfeit or recapture awards for failure to
consider risk appropriately upon the occurrence of certain
pre-determined events (for example, in the event of
annual firmwide, divisional, business unit or individual
losses). The review of whether forfeiture or recapture is
appropriate includes input from the CRO, as well as
representatives from Finance, Legal and Compliance.
Determinations are made by the Compensation
Committee or its delegates, with any determinations made
by delegates reported to the Compensation Committee.
An employee’s RSUs may also be forfeited, and shares
delivered thereunder recaptured if the employee engages
in conduct constituting “cause” at any time before the
RSUs are delivered and any applicable transfer
restrictions lapse. Cause includes, among other things,
any material violation of any firm policy, any act or
statement that negatively reflects on the firm’s name,
reputation or business interests and any conduct
detrimental to the firm.
With respect to all of the forfeiture conditions, if the firm
determines after delivery or release of transfer restrictions
that an RSU or share delivered thereunder should have
been forfeited or recaptured, the firm can require return of
any shares delivered or repayment to the firm of the fair
market value of the shares when delivered (including
those withheld to pay taxes) or any other amounts paid or
delivered in respect thereof.
Hedging: The firm’s anti-hedging policy ensures
employees maintain the intended exposure to the firm’s
stock performance. In particular, all employees are
prohibited from hedging RSUs, shares that are subject to
transfer restrictions, and, to the extent applicable,
retention shares. In addition, executive officers of GS
Group (as defined under the Securities Exchange Act of
1934) are prohibited from hedging any shares that they
can freely sell. Employees, other than executive officers,
may hedge only shares that they can otherwise sell.
However, no employee may enter into uncovered hedging
transactions or sell short any shares. Employees may only
enter into transactions or otherwise make investment
decisions with respect to shares during applicable
“window periods”.
Treatment upon Termination or Change-in-Control:
As a general matter, delivery schedules are not
accelerated, and transfer restrictions are not removed,
when an employee leaves the firm. The limited exceptions
include death and “conflicted employment.” A change in
control alone is not sufficient to trigger acceleration of
any deliveries or removal of transfer restrictions; only if
the change in control is followed within 18 months by a
termination of employment by the firm without “cause” or
by the employee for “good reason” will delivery and
release of transfer restrictions be accelerated.
Quantitative Disclosures
The following tables show aggregate quantitative
remuneration information for 40 individuals, categorised as
Risk Takers for the purposes of the KWG.
Risk Takers are also eligible to receive certain general non-
discretionary ancillary payments and benefits on a similar
basis to other employees. These payments and benefits are
not included in the disclosures below.
Aggregate remuneration: split between fixed and variable
remuneration and forms of variable remuneration
Remuneration paid or awarded for the financial year ended
December 31, 2020 comprised fixed remuneration (salaries,
allowances and director fees) and variable remuneration.
The figures are split into two tables showing “Senior
Management” and “Other Risk Takers” according to the
following definitions:
Senior Management: members of the Supervisory
Board and Executive Board of GSBE, and employees
of the management level directly below the Executive
Board.
Other Risk Takers: other employees whose activities
have a material impact on the risk profile of the firm.
The quantitative information referred to in Article 450(1)(h)
of CRR has been provided on an aggregate basis, due to
data privacy considerations. The amounts relate only to
those employees who were Risk Takers at the end of the
fiscal year, December 31, 2020.

GOLDMAN SACHS BANK EUROPE SE
Pillar 3 Disclosures
December 2020 | Pillar 3 Disclosures 58
Table 36: Senior Management and Other Risk Takers
Senior Manage
ment
Other Risk Takers –
Investment Bank
Number of members of Senior Management 24 16
2020 Fixed Remuneration awarded in cash (€ in millions) 12.97 5.44
2020 Fixed Remuneration awarded in RSUs (number of RSUs in 000s) - -
2020 Variable Remuneration awarded in cash (€ in millions) 4.91 3.03
2020 Variable Remuneration awarded in RSUs (number of RSUs in 000s) 36.33 11.56
Variable to Fixed Remuneration Ratio 1.09 1.10
Outstanding unvested as at 1 January 2020 (number of RSUs in 000s)28 - -
Awarded during 2020 (number of RSUs in 000s) 30.25 9.79 Paid out during 2020 (number of RSUs in 000s) - -
Reduced through performance adjustments during 2020 (number of RSUs in 000s) - -
Outstanding unvested as at 31 December 2020 (number of RSUs in 000s)28 30.25 9.79
28All elements of deferred remuneration are settled immediately when due,
and so there are no amounts of outstanding vested deferred remuneration
Sign-on and Severance Payments 1.
There were no sign-on payments or severance payments
made to Risk Takers during 2020.
Risk Takers with Total Remuneration of One Million
Euros or above
The following table shows the number of Risk Takers with
total remuneration of EUR 1 million or above arranged by
remuneration band for the remuneration period ended
December 31, 2020.
Table 37: Remuneration Band
Total Remuneration Band (EUR)
Number of
Individuals
> 1,000,000 to < 1,500,000 3
> 1,500,000 to < 2,000,000 5
> 2,000,000 6
Total 14

GOLDMAN SACHS BANK EUROPE SE
Pillar 3 Disclosures
December 2020 | Pillar 3 Disclosures 59
Cautionary Note on Forward-Looking Statements
We have included in these disclosures, and our management
may make, statements that may constitute “forward-looking
statements.” Forward-looking statements are not historical
facts or statements of current conditions, but instead
represent only our beliefs regarding future events, many of
which, by their nature, are inherently uncertain and outside
our control. These statements include statements other than
historical information or statements of current conditions.
It is possible that our actual results and financial condition
may differ, possibly materially, from the anticipated results
and financial condition indicated in these forward-looking
statements. Important factors that could cause our actual
results and financial condition to differ from those indicated
in the forward-looking statements include, among others,
those discussed in “Forecast and Opportunities Report”
within “Management Report” of GSBE’s 2020 Financial
Statements.

GOLDMAN SACHS BANK EUROPE SE
Pillar 3 Disclosures
December 2020 | Pillar 3 Disclosures 60
Glossary
Advanced Internal Ratings-Based (AIRB). The AIRB
approach of CRR provides a methodology for banks,
subject to supervisory approval, to use various risk
parameters to determine the EAD and risk-weights for
regulatory capital calculations. Other risk parameters
used in the determination of risk weights are each
counterparty’s Probability of Default (PD), Loss Given
Default (LGD) and the effective maturity of the trade or
portfolio of trades.
Central Counterparty (CCP). A counterparty, such as a
clearing house, that facilitates trades between
counterparties.
Credit Correlation Position. A securitisation position
for which all or substantially all of the value of the
underlying exposures is based on the credit quality
of a single company for which a two-way market
exists, or indices based on such exposures for which a
two-way market exists, or hedges of these positions
(which are typically not securitisation positions).
Credit Risk. The potential for loss due to the default or
deterioration in credit quality of a counterparty
(e.g., an OTC derivatives counterparty or a borrower)
or an issuer of securities or other instruments we hold.
Credit Valuation Adjustment (CVA). An adjustment
applied to uncollateralised OTC derivatives to cover the
risk of mark-to-market losses of bilateral credit risk (i.e.
counterparty and own) in uncollateralised derivatives.
Default. A default is considered to have occurred when
either or both of the two following events have taken
place: (i) we consider that the obligor is unlikely to pay
its credit obligations to us in full; or (ii) the obligor has
defaulted on a payment and/or is past due more than 90
days.
Default Risk. The risk of loss on a position that could
result from failure of an obligor to make timely
payments of principal or interest on its debt
obligation, and the risk of loss that could result from
bankruptcy, insolvency, or similar proceedings.
Effective Expected Positive Exposure (EEPE). The time-
weighted average of non-declining positive credit
exposure over the EE simulation. EEPE is used in
accordance with the IMM as the exposure measure that
is then risk weighted to determine counterparty risk
capital requirements.
Event Risk. The risk of loss on equity or hybrid equity
positions as a result of a financial event, such as the
announcement or occurrence of a company merger,
acquisition, spin-off, or dissolution.
Expected Exposure (EE). The expected value of the
probability distribution of non-negative credit risk
exposures to a counterparty at any specified future date
before the maturity date of the longest term transaction
in a netting set.
Exposure at Default (EAD). The exposure amount that is
risk weighted for regulatory capital calculations. For on-
balance-sheet assets, such as receivables and cash, EAD
is generally based on the balance sheet value. For the
calculation of EAD for off-balance-sheet exposures,
including commitments and guarantees, an equivalent
exposure amount is calculated based on the notional
amount of each transaction multiplied by a credit
conversion factor designed to estimate the net additions
to funded exposures that would be likely to occur over a
one-year horizon, assuming the obligor were to default.
For substantially all of the counterparty credit risk
arising from OTC derivatives, exchange-traded
derivatives and securities financing transactions, internal
models calculate the distribution of exposure upon
which the EAD calculation is based.
Idiosyncratic Risk. The risk of loss in the value of a
position that arises from changes in risk factors
unique to that position.
Incremental Risk. The potential loss in value of non-
securitised positions due to the default or credit
migration of issuers of financial instruments over a one-
year time horizon. This measure is calculated at a
99.9% confidence level over a one-year time horizon
using a multi-factor model.
Internal Models Methodology (IMM). The IMM
establishes a methodology for entities to use their
internal models to estimate exposures arising from OTC
derivatives, securities financing transactions and cleared
transactions, subject to qualitative and quantitative
requirements and supervisory approval.
Loss Given Default (LGD). An estimate of the economic
loss rate if a default occurs during economic downturn
conditions.
Market Risk. The risk of loss in the value of our inventory,
investments, loans and other financial assets and
liabilities accounted for at fair value, due to changes in
market conditions.

GOLDMAN SACHS BANK EUROPE SE
Pillar 3 Disclosures
December 2020 | Pillar 3 Disclosures 61
Operational Risk. The risk of an adverse outcome
resulting from inadequate or failed internal processes,
people, systems or from external events.
Other Systemically Important Institutions. Institutions
identified by national regulators as those whose failure
or malfunction could potentially lead to serious negative
consequences for the domestic financial systems and
real economy.
Prudent Valuation Adjustment (PVA). A deduction from
CET1 capital where the prudent value of trading assets
or other financial assets measured at fair value is
materially lower than the fair value recognised in the
financial information.
Probability of Default (PD). Estimate of the probability
that an obligor will default over a one-year horizon.
Ratings Based Approach. Under the ratings based method,
the risk weighted exposure amount of a rated
securitisation position or resecuritisation position are
calculated by applying to the exposure value the risk
weight associated with the credit quality step as
prescribed in CRR multiplied by 1.06.
Regulatory Value-at-Risk (VaR). The potential loss in
value of trading positions due to adverse market
movements over a 10-day time horizon with a 99%
confidence level.
Regulatory VaR Backtesting. Comparison of daily
positional loss results to the Regulatory VaR measure
calculated as of the end of the prior business day.
Resecuritisation Position. Represents an on or off-balance-
sheet transaction in which the risk associated with an
underlying pool of exposures is tranched and at least one
of the underlying exposures is a securitisation position.
Securitisation Position. Represents a transaction or scheme
in which the credit risk associated with an exposure or
pool of exposures is tranched and both payments in the
transaction or scheme are dependent upon the
performance of the exposure or pool of exposures and
the subordination of tranches determines the
distribution of losses during the ongoing life of the
transaction or scheme.
Specific Risk. The risk of loss on a position that could
result from factors other than broad market movements
and includes event risk, default risk and idiosyncratic
risk. The specific risk add-on is applicable for both
securitisation positions and for certain non-securitised
debt and equity positions, to supplement the model-
based measures.
Stress Testing. Stress testing is a method of determining
the effect of various hypothetical stress scenarios.
Stressed VaR (SVaR). The potential loss in value of
trading assets and liabilities, as well as certain
investments, loans, and other financial assets and
liabilities, during a period of significant market stress.
SVaR is calculated at a 99% confidence level over a 10-
day horizon using market data inputs from a
continuous 12-month period of stress.
Synthetic Securitisation. Defined as a securitisation
transaction in which the tranching is achieved by the
use of credit derivatives or guarantees, and the pool of
exposures is not removed from the balance sheet of the
originator.
Traditional Securitisation. Defined as a securitisation
transaction which involves the economic transfer of the
exposures being securitised to a securitisation special
purpose entity which issues securities; and so that this
must be accomplished by the transfer of ownership of
the securitised exposures from the originator or through
sub-participation; and the securities issued do not
represent payment obligations of the originator.
Value-at-Risk (VaR). The potential loss in value of
trading assets and liabilities, certain investments, loans,
and other financial assets and liabilities accounted for at
fair value, due to adverse market movements over a
defined time horizon with a specified confidence
level. Risk management VaR is calculated at a 95%
confidence level over a one-day horizon.
Wholesale Exposure. A term used to refer collectively to
credit exposures to companies, sovereigns or
government entities (other than Securitisation, Retail or
Equity exposures).
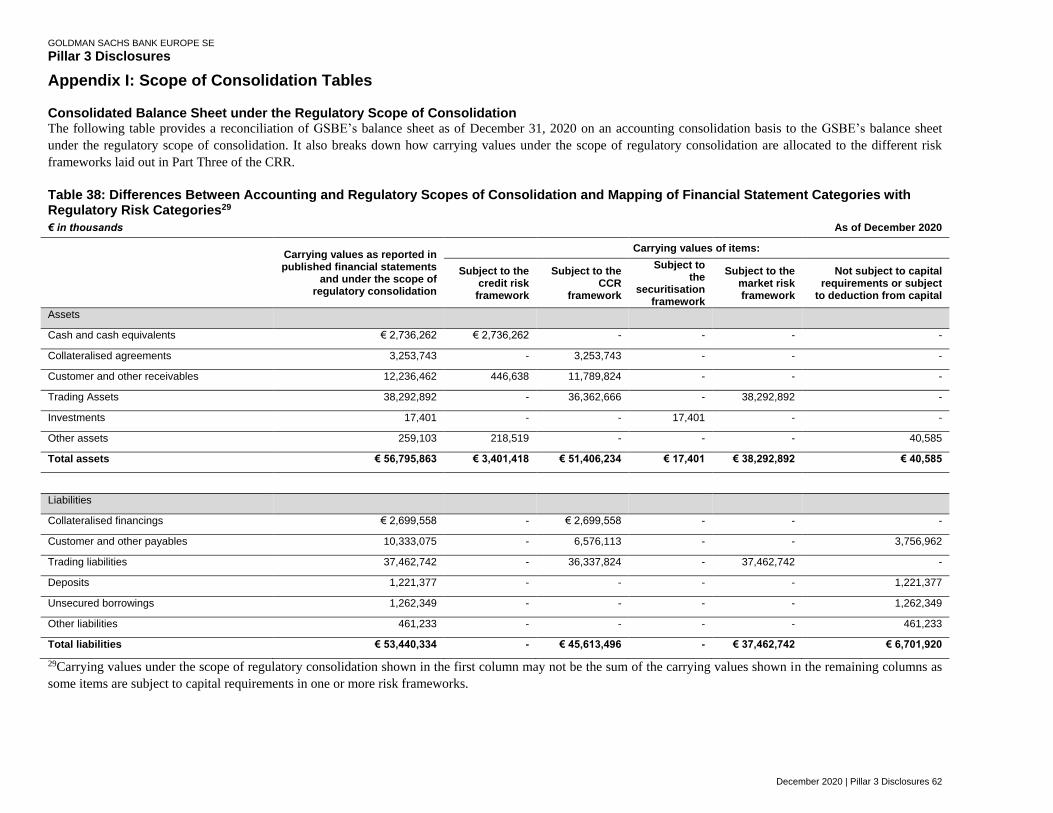
GOLDMAN SACHS BANK EUROPE SE
Pillar 3 Disclosures
December 2020 | Pillar 3 Disclosures 62
Appendix I: Scope of Consolidation Tables
Consolidated Balance Sheet under the Regulatory Scope of Consolidation The following table provides a reconciliation of GSBE’s balance sheet as of December 31, 2020 on an accounting consolidation basis to the GSBE’s balance sheet
under the regulatory scope of consolidation. It also breaks down how carrying values under the scope of regulatory consolidation are allocated to the different risk
frameworks laid out in Part Three of the CRR.
Table 38: Differences Between Accounting and Regulatory Scopes of Consolidation and Mapping of Financial Statement Categories with Regulatory Risk Categories29
€ in thousands
As of December 2020
Carrying values as reported in published financial statements
and under the scope of regulatory consolidation
Carrying values of items:
Subject to the
credit risk framework
Subject to the CCR
framework
Subject to the
securitisation framework
Subject to the market risk framework
Not subject to capital requirements or subject
to deduction from capital
Assets
Cash and cash equivalents € 2,736,262 € 2,736,262 - - - -
Collateralised agreements 3,253,743 - 3,253,743 - - -
Customer and other receivables 12,236,462 446,638 11,789,824 - - -
Trading Assets 38,292,892 - 36,362,666 - 38,292,892 -
Investments 17,401 - - 17,401 - -
Other assets 259,103 218,519 - - - 40,585
Total assets € 56,795,863 € 3,401,418 € 51,406,234 € 17,401 € 38,292,892 € 40,585
Liabilities
Collateralised financings € 2,699,558 - € 2,699,558 - - -
Customer and other payables 10,333,075 - 6,576,113 - - 3,756,962
Trading liabilities 37,462,742 - 36,337,824 - 37,462,742 -
Deposits 1,221,377 - - - - 1,221,377
Unsecured borrowings 1,262,349 - - - - 1,262,349
Other liabilities 461,233 - - - - 461,233
Total liabilities € 53,440,334 - € 45,613,496 - € 37,462,742 € 6,701,920
29Carrying values under the scope of regulatory consolidation shown in the first column may not be the sum of the carrying values shown in the remaining columns as
some items are subject to capital requirements in one or more risk frameworks.

GOLDMAN SACHS BANK EUROPE SE
Pillar 3 Disclosures
December 2020 | Pillar 3 Disclosures 63
Regulatory Balance Sheet Assets Reconciliation to Exposure at Default (EAD)
The following table present a reconciliation of the consolidated regulatory balance sheet to EAD for items subject to credit risk, CCR and securitisation frameworks.
Table 39: Main Sources of Differences Between Regulatory Exposures Amounts and Carrying Values in Financial Statements
€ in thousands As of December 2020
Items subject to
Credit risk framework CCR framework Securitisation
framework
1 Assets carrying value amount under the scope of regulatory consolidation (as per template EU LI1) € 3,401,418 € 51,408,412 € 17,401
2 Liabilities carrying value amount under the regulatory scope of consolidation (as per template EU LI1) - (45,613,496) -
3 Total net amount under the regulatory scope of consolidation 3,401,418 5,794,916 17,401
4 Off-balance-sheet amounts30 564,180 - -
5 Differences due to credit conversion factor (259,350) - -
6 Differences due to netting of collateral, haircut and EAD modelling (45,480) 4,451,489 -
7 Exposure amounts considered for regulatory purposes € 3,660,768 € 10,246,406 € 17,401
30Off balance sheet amounts: Off balance sheet amounts are stated gross and primarily consist of undrawn committed facilities and guarantees.
Explanations of differences between accounting and regulatory exposure amounts
The carrying value of assets is usually measured at amortised cost or fair value as at the balance sheet date. For on-balance-sheet assets, such as receivables and cash,
the EAD is generally based on the carrying value. For the calculation of EAD for off-balance-sheet exposures, including commitments and guarantees, a credit
equivalent exposure amount is calculated based on the notional amount of each transaction multiplied by a credit conversion factor in accordance with Article 166 of
CRR.
As GSBE calculates the majority of its credit exposure under the IMM, the impacts of netting and collateral are integral to the calculation of the exposure. The
exposures considered for regulatory purposes are presented on a net and collateralised basis where there is a legally enforceable netting and collateral opinion. Under
IFRS, netting is required if legal right of set-off exists and the cash flows are intended to be settled on a net basis.

GOLDMAN SACHS BANK EUROPE SE
Pillar 3 Disclosures
December 2020 | Pillar 3 Disclosures 64
Appendix II: Credit Risk Tables
The following three tables present GSBE’s net values of on-balance-sheet and off-balance-sheet exposures by geographical areas and exposure classes as of December
31, 2020.
Table 40: Geographical Breakdown of Exposures
€ in thousands As of December 2020
Net value
EMEA Germany France United
Kingdom Other
countries Americas
United States
Other countries
Asia Thailan
d Other
countries Total
6 Total IRB approach - - - - - - - - - - - -
7 Central governments or central banks
2,635,011 2,587,815 - - 47,196 - - - - - - 2,635,011
8 Regional governments or local authorities
- - - - - - - - - - - -
9 Public sector entities 112 112 - - - - - - - - - 112
10 Multilateral development banks
- - - - - - - - - - - -
11 International organisations
- - - - - - - - - - - -
12 Institutions 421,831 226,295 6,876 67,997 120,663 83,898 83,564 334 12,788 - 12,788 518,517
13 Corporates 377,326 71,706 181,251 25,273 99,097 324,041 303,358 20,682 4,966 3,736 1,230 706,333
14 Retail - - - - - - - - - - - -
16 Exposures in default - - - - - - - - - - - -
17 Items associated with particularly high risk
- - - - - - - - - - - -
21 Equity exposures 2,092 2,092 - - - - - - - - - 2,092
22 Other exposures 103,154 103,154 - - - - - - - - - 103,154
23 Total standardised approach
€ 3,539,525 € 2,991,173 € 188,127 € 93,270 € 266,955 € 407,939 € 386,922 € 21,017 € 17,754 € 3,736 € 14,018 € 3,965,218
24 Total € 3,539,525 € 2,991,173 € 188,127 € 93,270 € 266,955 € 407,939 € 386,922 € 21,017 € 17,754 € 3,736 € 14,018 € 3,965,218

GOLDMAN SACHS BANK EUROPE SE
Pillar 3 Disclosures
December 2020 | Pillar 3 Disclosures 65
The following table presents GSBE’s net values of on-balance-sheet and off-balance-sheet exposures by industry or counterparty types and exposure classes as of
December 31, 2020.
Table 41: Concentration of Exposures by Industry or Counterparty Types
€ in thousands
As of December 2020
Sovereigns (including
Central Banks)
Banks CCPs and
Exchanges Other
Financials Real
Estate Manufact
uring
Transport, Utilities &
Storage
Retail / Wholesale
trade
Services and other Industries
Total
6 Total IRB approach - - - - - - - - - -
7 Central governments or central banks 2,633,131 - - - - - - - 1,880 2,635,011
8 Regional governments or local authorities
- - - - - - - - - -
9 Public sector entities - 112 - - - - - - - 112
10 Multilateral development banks - - - - - - - - - -
11 International organisations - - - - - - - - - -
12 Institutions - 154,951 7,588 355,978 - - - - - 518,517
13 Corporates 1,570 13,468 158 426,215 12 48,285 128,757 183 87,685 706,333
14 Retail - - - - - - - - - -
16 Exposures in default - - - - - - - - - -
17 Items associated with particularly high risk
- - - - - - - - - -
21 Equity exposures - - - 2,067 - - - - 25 2,092
22 Other exposures - - - - - - - - 103,154 103,154
23 Total standardised approach € 2,634,701 € 168,531 € 7,746 € 784,259 € 12 € 48,285 € 128,757 € 183 € 192,744 € 3,965,218
24 Total € 2,634,701 € 168,531 € 7,746 € 784,259 € 12 € 48,285 € 128,757 € 183 € 192,744 € 3,965,218

GOLDMAN SACHS BANK EUROPE SE
Pillar 3 Disclosures
December 2020 | Pillar 3 Disclosures 66
The following table presents GSBE’s net values of on-balance-sheet and off-balance-sheet exposures by industry or counterparty types and exposure classes as of
December 31, 2020.
Table 42: Maturity of Exposures
€ in thousands As of December 2020
On demand < = 1 year > 1 year < = 5
years > 5 years No stated maturity Total
6 Total IRB approach - - - - - -
7 Central governments or central banks 2,594,759 - - 40,252 - 2,635,011
8 Regional governments or local authorities - - - - - -
9 Public sector entities - 112 - - - 112
10 Multilateral development banks - - - - - -
11 International organisations - - - - - -
12 Institutions 168,888 344,085 - 5,543 - 518,517
13 Corporates 106,317 199,185 314,118 86,713 - 706,333
14 Retail - - - - - -
16 Exposures in default - - - - - -
17 Items associated with particularly high risk - - - - - -
21 Equity exposures - - - - 2,092 2,092
22 Other exposures - - - - 103,154 103,154
23 Total standardised approach € 2,869,965 € 543,382 € 314,118 € 132,508 € 105,246 € 3,965,218
24 Total € 2,869,965 € 543,382 € 314,118 € 132,508 € 105,246 € 3,965,218

GOLDMAN SACHS BANK EUROPE SE
Pillar 3 Disclosures
December 2020 | Pillar 3 Disclosures 67
Table 43: Credit Quality of Exposures by Exposure Class and Instrument
€ in thousands As of December 2020
Gross carrying values of Specific
credit risk adjustment
General credit risk
adjustment
Accumulated write-offs
Credit risk adjustment
charges of the period
Net values Defaulted
exposures
Non-defaulted exposures
15 Total IRB approach - - - - - - -
16 Central governments or central banks - 2,635,011 - - - - 2,635,011
17 Regional governments or local authorities - - - - - - -
18 Public sector entities - 112 - - - - 112
19 Multilateral development banks - - - - - - -
20 International organisations - - - - - - -
21 Institutions - 518,517 - - - - 518,517
22 Corporates - 706,713 (380) - - - 706,333
24 Retail - - - - - - -
28 Exposures in default - - - - - - -
29 Items associated with particularly high risk - - - - - - -
33 Equity exposures - 2,092 - - - - 2,092
34 Other exposures - 103,154 - - - - 103,154
35 Total standardised approach - € 3,965,598 € (380) - - - € 3,965,218
36 Total - € 3,965,598 € (380) - - - € 3,965,218
37 Of which: Loans - - - - - - -
38 Of which: Debt securities - - - - - - -
39 Of which: Off- balance-sheet exposures - 564,560 (380) - - - 564,180

GOLDMAN SACHS BANK EUROPE SE
Pillar 3 Disclosures
December 2020 | Pillar 3 Disclosures 68
Table 44: Credit Quality of Exposures by Industry or Counterparty Types
€ in thousands As of December 2020
Gross carrying values of Specific credit
risk adjustment
General credit risk
adjustment
Accumulated write-offs
Credit risk adjustment
charges of the period
Net values
Defaulted exposures
Non-defaulted exposures
1 Central governments or central banks - 2,634,701 - - - - 2,634,701
2 Services and other Industries - 192,747 (3) - - - 192,744
3 Banks - 168,531 - - - - 168,531
4 Other Financials - 784,587 (328) - - - 784,259
5 CCPs and Exchanges - 7,746 - - - - 7,746
6 Manufacturing - 48,291 (5) - - - 48,285
7 Transport, Utilities & Storage - 128,800 (44) - - - 128,757
8 Retail / Wholesale trade - 183 - - - - 183
9 Real Estate - 12 - - - - 12
Total - € 3,965,598 € (380) - - - € 3,965,218
Table 45: Credit Quality of Exposures by Geography
€ in thousands As of December 2020
Gross carrying values of Specific credit
risk adjustment
General credit risk
adjustment
Accumulated write-offs
Credit risk adjustment
charges of the period
Net values
Defaulted exposures
Non-defaulted exposures
1 EMEA - € 3,539,905 € (380) - - - € 3,539,525
2 Germany - 2,991,178 (5) - - - 2,991,173
3 France - 188,174 (47) - - - 188,127
4 United Kingdom - 93,598 (328) - - - 93,270
5 Other Countries - 266,955 - - - - 266,955
6 Americas - 407,939 - - - - 407,939
7 United States - 386,922 - - - - 386,922
8 Other Countries - 21,017 - - - - 21,017
9 Asia - 17,754 - - - - 17,754
Total - € 3,965,598 € (380) - - - € 3,965,218
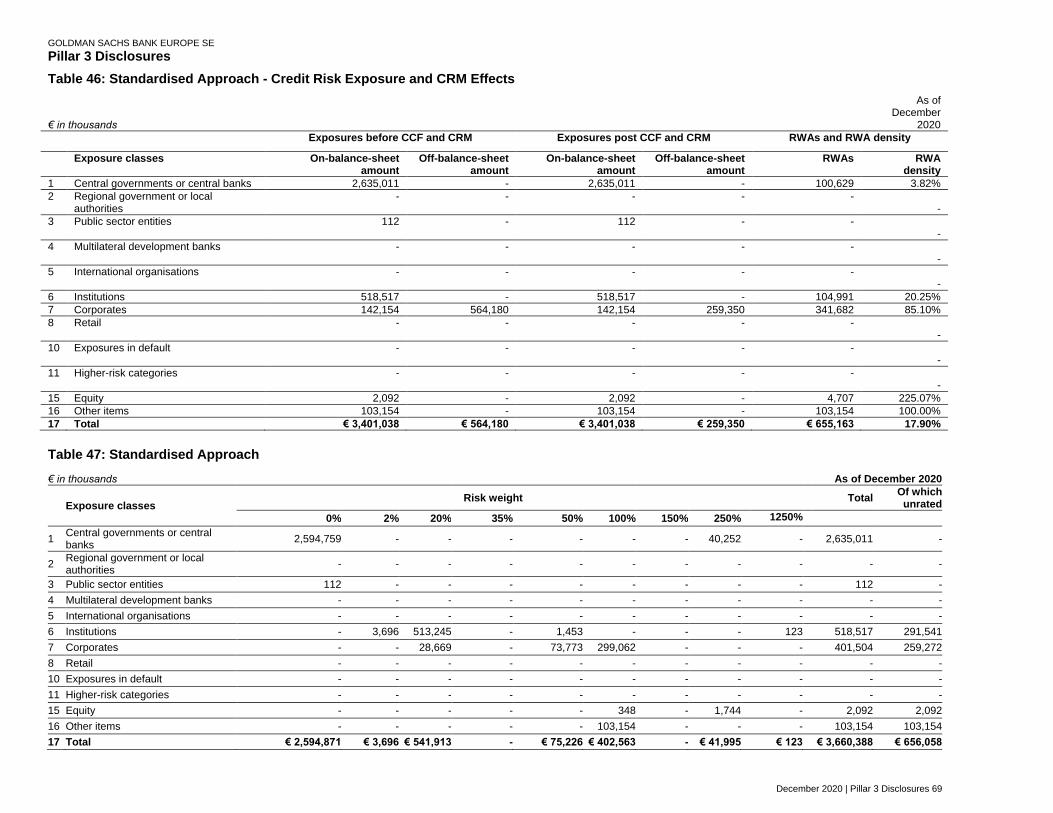
GOLDMAN SACHS BANK EUROPE SE
Pillar 3 Disclosures
December 2020 | Pillar 3 Disclosures 69
Table 46: Standardised Approach - Credit Risk Exposure and CRM Effects
€ in thousands
As of December
2020
Exposures before CCF and CRM Exposures post CCF and CRM RWAs and RWA density
Exposure classes On-balance-sheet amount
Off-balance-sheet amount
On-balance-sheet amount
Off-balance-sheet amount
RWAs RWA density
1 Central governments or central banks 2,635,011 - 2,635,011 - 100,629 3.82%
2 Regional government or local authorities
- - - - - -
3 Public sector entities 112 - 112 - - -
4 Multilateral development banks - - - - - -
5 International organisations - - - - - -
6 Institutions 518,517 - 518,517 - 104,991 20.25%
7 Corporates 142,154 564,180 142,154 259,350 341,682 85.10%
8 Retail - - - - - -
10 Exposures in default - - - - - -
11 Higher-risk categories - - - - - -
15 Equity 2,092 - 2,092 - 4,707 225.07%
16 Other items 103,154 - 103,154 - 103,154 100.00%
17 Total € 3,401,038 € 564,180 € 3,401,038 € 259,350 € 655,163 17.90%
Table 47: Standardised Approach
€ in thousands As of December 2020
Exposure classes
Risk weight
Total Of which
unrated
0% 2% 20% 35% 50% 100% 150% 250% 1250%
1 Central governments or central banks
2,594,759 - - - - - - 40,252 - 2,635,011 -
2 Regional government or local authorities
- - - - - - - - - - -
3 Public sector entities 112 - - - - - - - - 112 -
4 Multilateral development banks - - - - - - - - - - -
5 International organisations - - - - - - - - - - -
6 Institutions - 3,696 513,245 - 1,453 - - - 123 518,517 291,541
7 Corporates - - 28,669 - 73,773 299,062 - - - 401,504 259,272
8 Retail - - - - - - - - - - -
10 Exposures in default - - - - - - - - - - -
11 Higher-risk categories - - - - - - - - - - -
15 Equity - - - - - 348 - 1,744 - 2,092 2,092
16 Other items - - - - - 103,154 - - - 103,154 103,154
17 Total € 2,594,871 € 3,696 € 541,913 - € 75,226 € 402,563 - € 41,995 € 123 € 3,660,388 € 656,058

GOLDMAN SACHS BANK EUROPE SE
Pillar 3 Disclosures
December 2020 | Pillar 3 Disclosures 70
Table 48: Credit quality of performing and non-performing exposures by past due days
€ in thousands
As of December 2020
Gross carrying amount / Nominal amount
Performing exposures Non-performing exposures
Not past due or Past due <= 30
days
Past due > 30 days <= 90
days
Unlikely to pay that are not past-due or past-due <= 90 days
Past due >
90 days <= 180 days
Past due > 180 days <= 1 year
Past due > 1 year <= 2 years
Past due > 2 year <= 5 years
Past due > 5 year <= 7 years
Past due > 7 years
Of which defaulted
010 Loans and advances € 15,568,127 € 15,568,127 - - - - - - - - - -
020 Central banks 168 168 - - - - - - - - - -
030 General governments 11,980 11,980 - - - - - - - - - -
040 Credit institutions 2,809,310 2,809,310 - - - - - - - - - -
050 Other financial corporations
12,354,906 12,354,906 - - - - - - - - - -
060 Non-financial corporations
344,124 344,124 - - - - - - - - - -
070 Of which SMEs - - - - - - - - - - - -
080 Households 47,639 47,639 - - - - - - - - - -
090 Debt Securities 17,401 17,401 - - - - - - - - - -
100 Central banks - - - - - - - - - - - -
110 General governments - - - - - - - - - - - -
120 Credit institutions - - - - - - - - - - - -
130 Other financial corporations
17,401 17,401 - - - - - - - - - -
140 Non-financial corporations
- - - - - - - - - - - -
150 Off-balance sheet exposures
519,080 - -
160 Central banks - - -
170 General governments - - -
180 Credit institutions - - -
190 Other financial corporations
64,962 - -
200 Non-financial corporations
454,118 - -
210 Households - - -
220 Total € 16,104,608 € 15,585,528 - - - - - - - - - -

GOLDMAN SACHS BANK EUROPE SE
Pillar 3 Disclosures
December 2020 | Pillar 3 Disclosures 71
Table 49: Performing and non-performing exposures and related provisions
€ in thousands
As of December 2020
Gross carrying amount/nominal amount
Accumulated impairment, accumulated negative changes in fair value due to credit risk and provisions
Accumulated partial write-off
Collateral and financial guarantees received
Performing exposures Non-performing exposures
Performing exposures – accumulated
impairment and provisions
Non-performing exposures – accumulated impairment,
accumulated negative changes in fair value due to credit risk
and provisions
On performing exposures
On non-performing exposures
Of which stage 1
Of which stage
2
Of which stage
2
Of which stage
3
Of which stage
1
Of which stage
2
Of which stage
2
Of which stage 3
1
Loans and advances € 15,568,127 € 15,568,127 - - - - - - - - - - - € 3,871,533 -
2
Central banks 168 168 - - - - - - - - - - - - -
3
General governments 11,980 11,980 - - - - - - - - - - - - -
4
Credit institutions 2,809,310 2,809,310 - - - - - - - - - - - 130,041 -
5
Other financial corporations 12,354,906 12,354,906 - - - - - - - - - - - 3,683,664 -
6
Non-financial corporations 344,124 344,124 - - - - - - - - - - - 18,215 -
7
Of which SMEs - - - - - - - - - - - - - - -
8
Households 47,639 47,639 - - - - - - - - - - - 39,613 -
9
Debt securities 17,401 17,401 - - - - - - - - - - - - -
10
Central banks - - - - - - - - - - - - - - -
11
General governments - - - - - - - - - - - - - - -
12
Credit institutions - - - - - - - - - - - - - - -
13
Other financial corporations 17,401 17,401 - - - - - - - - - - - - -
14
Non-financial corporations - - - - - - - - - - - - - - -
15
Off-balance-sheet exposures 519,080 519,080 - - - - 380 380 - - - - - -
16
Central banks - - - - - - - - - - - - - -
17
General governments - - - - - - - - - - - - - -
18
Credit institutions - - - - - - - - - - - - - -
19
Other financial corporations 64,962 64,962 - - - - 328 328 - - - - - -
20
Non-financial corporations 454,118 454,118 - - - - 52 52 - - - - - -
21
Households - - - - - - - - - - - - - -
22
Total € 16,104,608 € 16,104,608 - - - - €
380 € 380 - - - - - € 3,871,533 -

GOLDMAN SACHS BANK EUROPE SE
Pillar 3 Disclosures
December 2020 | Pillar 3 Disclosures 72
Appendix III: Counterparty Credit Risk Tables
Table 50: Impact of Netting and Collateral Held on Exposure Values31
€ in thousands As of December 2020
Gross positive fair value or
net carrying amount Netting benefits Netted current
credit exposure Collateral held Net credit exposure32
1 Derivatives € 36,362,666 € (27,656,463) € 8,706,203 € 11,549,608 € 1,905,406
2 SFTs 5,055,982 (1,276,241) 3,779,741 4,521,268 46,343
3 Cross-product netting - - - - -
4 Total € 41,418,648 € (28,932,704) € 12,485,944 € 16,070,876 € 1,951,749
31 GSBE does not have cross-product netting where both derivatives and SFTs are netted at a counterparty level.
32 Net credit exposure for derivatives and SFTs represents the current exposure component of the modelled EAD, and takes into account legally enforceable collateral
received.
Table 51: Composition of Collateral for Exposures to CCR
€ in thousands As of December 2020
Collateral used in derivative transactions Collateral used in SFTs
Fair value of collateral received Fair value of posted collateral Fair value of
collateral received Fair value of posted
collateral
Segregated Unsegregated Segregated Unsegregated
Sovereign € 2,436,281 € 188,184 € 450,103 - € 3,599,568 € 1,381,754
Equities 51 - 165 - 657,916 1,109,236
Corporate Bonds 605,912 - - - 248,393 299,245
Cash 81,016 8,238,165 793,569 8 15,390 -
Other - 1 - - - -
Total € 3,123,258 € 8,426,350 € 1,243,837 € 8 € 4,521,268 € 2,790,236

GOLDMAN SACHS BANK EUROPE SE
Pillar 3 Disclosures
December 2020 | Pillar 3 Disclosures 73
Table 52: Standardised approach – CCR exposures by regulatory portfolio and risk
€ in thousands
As of December 2020
Exposure classes Risk weight Total
Of which unrated
0% 2% 4% 10% 20% 50% 70% 75% 100% 150% Others
1 Central governments or central banks
€ 78,853 - - - - - - - € 1,511 - - € 80,364 € 72,553
2 Regional government or local authorities
1,839,507 - - - - - - - - - - 1,839,507 1,441,453
3 Public sector entities 138,537 - - - 242 - - - - - - 138,779 138,779
4 Multilateral development banks - - - - - - - - - - - - -
5 International organisations 2,616 - - - - - - - - - - 2,616 2,616
6 Institutions - 1,568,518 - - 2,218,626 1,988,888 - - 78,304 8,766 - 5,863,102 3,185,551
7 Corporates - - - - 53,640 40,223 - - 2,228,175 - - 2,322,038 1,947,715
8 Retail - - - - - - - - - - - - -
9 Exposures in Default - - - - - - - - - - - - -
10 Higher Risk Categories - - - - - - - - - - - - -
11 Equity - - - - - - - - - - - - -
12 Institutions and corporates with a short-term credit assessment
- - - - - - - - - - - - -
13 Other items - - - - - - - - - - - - -
14 Total € 2,059,513 € 1,568,518 - - € 2,272,508 € 2,029,111 - - € 2,307,990 € 8,766 - €
10,246,406 €
6,788,668

GOLDMAN SACHS BANK EUROPE SE
Pillar 3 Disclosures
December 2020 | Pillar 3 Disclosures 74
Appendix IV: Past Due Exposures, Impaired Exposures and Impairment Provisions Tables
Table 53: Changes in the Stock of General and Specific Credit Risk Adjustments33
€ in thousands As of December 2020
Accumulated specific credit risk adjustment
Accumulated general credit risk adjustment
1 Opening balance as of 31 December 2019 € 19 -
2 Increases due to amounts set aside for estimated loan losses during the period - -
3 Decreases due to amounts reversed for estimated loan losses during the period (16) -
6 Impact of exchange rate differences - -
8a Position and valuation changes 376 -
9 Closing balance as of 31 December 2020 € 380 -
33 Changes in specific credit risk adjustment are due to position and valuation changes rather than changes in amounts set aside for estimated loan losses, transfers between credit risk
adjustments, exchange rate differences or business combinations (such as acquisitions and disposals of subsidiaries).

GOLDMAN SACHS BANK EUROPE SE
Pillar 3 Disclosures
December 2020 | Pillar 3 Disclosures 75
Appendix V: Index of Tables to EBA Templates
Table EBA Template
Full name Page
38 Template 1 EU LI1 - Differences between accounting and regulatory scopes of consolidation and the mapping of financial statement categories with regulatory risk categories
62
39 Template 2 EU L12 - Main sources of differences between regulatory exposure amounts and carrying values in financial statements
63
N/A Template 334 EU L13 - Outline of the differences in the scopes of consolidation (entity by entity) N/A
5 Template 4 EU OV1 - Overview of RWAs 14
N/A Template 535 EU CR10 - IRB (specialised lending and equities) N/A
N/A Template 636 EU INS1 - Non-deducted participations in insurance undertakings N/A
10 Template 7 EU CRB-B - Total and average net amount of exposures 18
40 Template 8 EU CRB-C - Geographical breakdown of exposures 64
41 Template 9 EU CRB-D - Concentration of exposures by industry or counterparty types 65
42 Template 10 EU CRB-E - Maturity of exposures 66
43 Template 11 EU CR1-A - Credit quality of exposures by exposure class and instrument 67
44 Template 12 EU CR1-B - Credit quality of exposures by industry or counterparty types 68
45 Template 13 EU CR1-C - Credit quality of exposures by geography 68
N/A Template 14 EU CR1-D - Ageing of past-due exposures N/A
N/A Template 15 EU CR1-E - Non-performing and forborne exposures N/A
53 Template 16 EU CR2-A - Changes in the stock of general and specific credit risk adjustments 75
N/A Template 1735 EU CR2-B - Changes in the stock of defaulted and impaired loans and debt securities N/A
11 Template 18 EU CR3 - CRM techniques - Overview 21
46 Template 19 EU CR4 - Standardised approach - Credit risk exposure and CRM effects 69
47 Template 20 EU CR5 - Standardised approach 69
N/A Template 2134 EU CR6 - IRB approach - Credit risk exposures by exposure class and PD range N/A
N/A Template 2234 EU CR7 - IRB approach - Effect on the RWAs of credit derivatives used as CRM techniques N/A
N/A Template 2334 EU CR8 - RWA flow statements of credit risk exposures under the IRB approach N/A
N/A Template 2434 EU CR9 - IRB approach – Backtesting of PD per exposure class N/A
6 Template 25 EU CCR1 - Analysis of CCR exposure by approach 17
8 Template 26 EU CCR2 - CVA VaR capital charge 18
7 Template 27 EU CCR8 - Exposures to CCPs 17
52 Template 28 EU CCR3 - Standardised approach - CCR exposures by regulatory portfolio and risk 74
N/A Template 2934 EU CCR4 - IRB approach - CCR exposures by portfolio and PD scale N/A
9 Template 30 EU CCR7 - RWA flow statements of CCR exposures under the IMM 18
50 Template 31 EU CCR5-A - Impact of netting and collateral held on exposure values 72
51 Template 32 EU CCR5-B - Composition of collateral for exposures to CCR 73

GOLDMAN SACHS BANK EUROPE SE
Pillar 3 Disclosures
December 2020 | Pillar 3 Disclosures 76
12 Template 33 EU CCR6 - Credit derivatives exposures 21
19 Template 34 EU MR1 - Market risk under the standardised approach 29
16 Template 35 EU MR2-A - Market Risk under the IMA 28
17 Template 36 EU MR2-B- RWA flow statements of market risk exposures under the IMA 28
15 Template 37 EU MR3 - IMA values for trading portfolios 27
18 Template 38 EU MR4 - Comparison of VaR estimates with gains/losses 29
34 Template 3 (The disclosure on differences in the scopes of consolidation) has been disclosed within the Basis of Consolidation
section of the document
35 Templates 5, 21, 22, 23, 24 and 29 (Disclosures pertaining to IRB) have not been disclosed as GSBE does not have permission
to use IRB
36 Template 6 (Non-deducted participation in insurance undertakings) and Template 17 (Changes in the stock of defaulted and
impaired loans and debt securities) has not been disclosed as GSBE do not have material exposures