Embed Size (px)
Citation preview

Goldman Sachsemerging leadersconferenceApril 2021
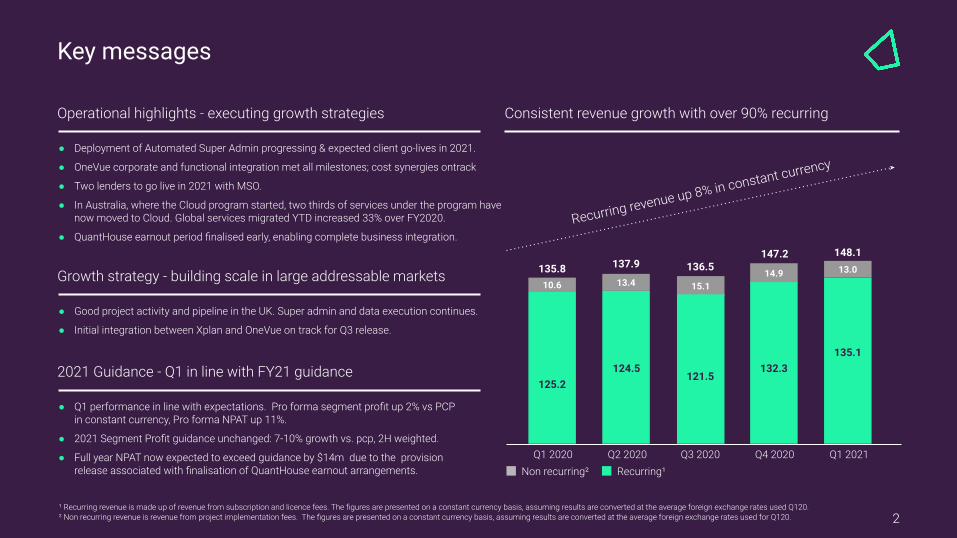
● Deployment of Automated Super Admin progressing & expected client go-lives in 2021.
● OneVue corporate and functional integration met all milestones; cost synergies ontrack
● Two lenders to go live in 2021 with MSO.
● In Australia, where the Cloud program started, two thirds of services under the program have now moved to Cloud. Global services migrated YTD increased 33% over FY2020.
● QuantHouse earnout period finalised early, enabling complete business integration.
Key messages
¹ Recurring revenue is made up of revenue from subscription and licence fees. The figures are presented on a constant currency basis, assuming results are converted at the average foreign exchange rates used Q120.² Non recurring revenue is revenue from project implementation fees. The figures are presented on a constant currency basis, assuming results are converted at the average foreign exchange rates used for Q120.
Consistent revenue growth with over 90% recurring
2
Operational highlights - executing growth strategies
Growth strategy - building scale in large addressable markets
● Good project activity and pipeline in the UK. Super admin and data execution continues.
● Initial integration between Xplan and OneVue on track for Q3 release.
2021 Guidance - Q1 in line with FY21 guidance
● Q1 performance in line with expectations. Pro forma segment profit up 2% vs PCPin constant currency, Pro forma NPAT up 11%.
● 2021 Segment Profit guidance unchanged: 7-10% growth vs. pcp, 2H weighted.
● Full year NPAT now expected to exceed guidance by $14m due to the provisionrelease associated with finalisation of QuantHouse earnout arrangements.
10.6 13.4 15.114.9 13.0135.8 137.9 136.5
147.2 148.1
125.2124.5
121.5132.3
135.1
Q1 2021
Recurring revenue up 8% in constant currency
Q4 2020Q3 2020 Q2 2020 Q1 2020Non recurring² Recurring¹
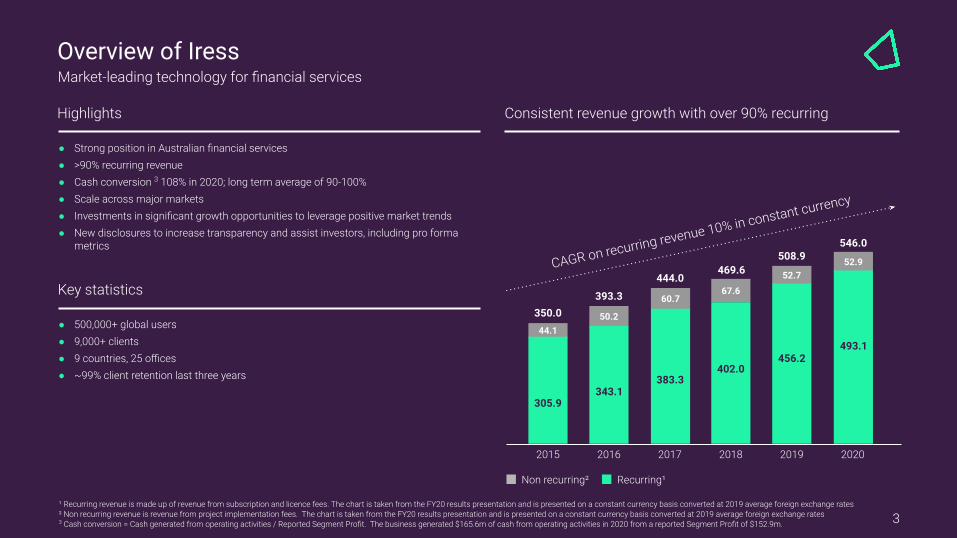
● Strong position in Australian financial services ● >90% recurring revenue ● Cash conversion 3 108% in 2020; long term average of 90-100%● Scale across major markets● Investments in significant growth opportunities to leverage positive market trends● New disclosures to increase transparency and assist investors, including pro forma
metrics
Overview of Iress
Consistent revenue growth with over 90% recurring
3
Highlights
Key statistics
● 500,000+ global users● 9,000+ clients● 9 countries, 25 offices● ~99% client retention last three years
Market-leading technology for financial services
44.150.2
60.767.6
52.752.9
350.0393.3
444.0469.6
508.9546.0
305.9343.1
383.3402.0
456.2493.1
2015 2016 2017 2018 2019 2020
Non recurring² Recurring¹
CAGR on recurring revenue 10% in constant currency
¹ Recurring revenue is made up of revenue from subscription and licence fees. The chart is taken from the FY20 results presentation and is presented on a constant currency basis converted at 2019 average foreign exchange rates ² Non recurring revenue is revenue from project implementation fees. The chart is taken from the FY20 results presentation and is presented on a constant currency basis converted at 2019 average foreign exchange rates 3 Cash conversion = Cash generated from operating activities / Reported Segment Profit. The business generated $165.6m of cash from operating activities in 2020 from a reported Segment Profit of $152.9m.

We help our clients find better ways to
4
Manage and administerinvestments
Find and compare insurance
Simplify mortgage applications
Navigate financialmarkets
Deliver high quality financial advice
Administer super funds and service members
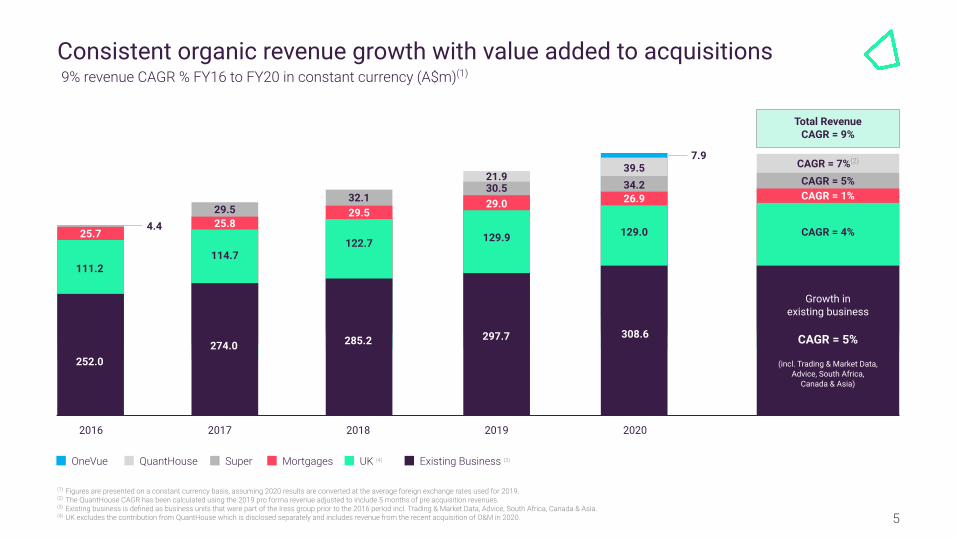
4.4
252.0
2016
(1) Figures are presented on a constant currency basis, assuming 2020 results are converted at the average foreign exchange rates used for 2019.(2) The QuantHouse CAGR has been calculated using the 2019 pro forma revenue adjusted to include 5 months of pre acquisition revenues.(3) Existing business is defined as business units that were part of the Iress group prior to the 2016 period incl. Trading & Market Data, Advice, South Africa, Canada & Asia.(4) UK excludes the contribution from QuantHouse which is disclosed separately and includes revenue from the recent acquisition of O&M in 2020.
2017 2018 2019 2020
65.1 65.1 65.165.1274.0
65.1
285.2
65.1
Growth inexisting business
CAGR = 5%
(incl. Trading & Market Data, Advice, South Africa,
Canada & Asia)
297.7
111.2114.7
122.7 129.9 129.0 CAGR = 4%
CAGR = 1%CAGR = 5%
CAGR = 7%(2)
26.934.239.5
7.9
308.6
29.030.521.9
29.532.1
25.825.7
OneVue QuantHouse Super Mortgages UK (4) Existing Business (3)
29.5
Total RevenueCAGR = 9%
5
Consistent organic revenue growth with value added to acquisitions 9% revenue CAGR % FY16 to FY20 in constant currency (A$m)(1)
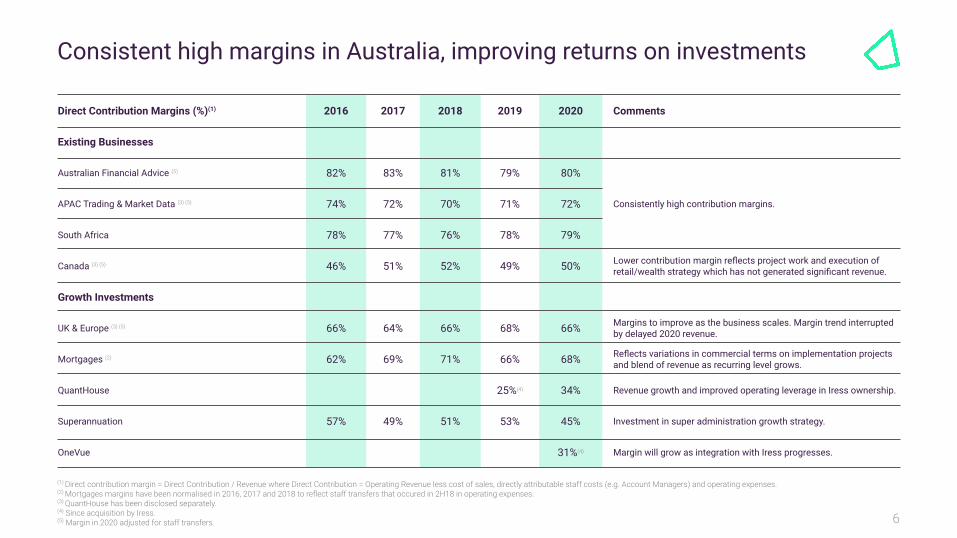
Direct Contribution Margins (%)(1) 2016 2017 2018 2019 2020 Comments
Existing Businesses
Australian Financial Advice (5) 82% 83% 81% 79% 80%
Consistently high contribution margins.APAC Trading & Market Data (3) (5) 74% 72% 70% 71% 72%
South Africa 78% 77% 76% 78% 79%
Canada (3) (5) 46% 51% 52% 49% 50% Lower contribution margin reflects project work and execution of retail/wealth strategy which has not generated significant revenue.
Growth Investments
UK & Europe (3) (5) 66% 64% 66% 68% 66% Margins to improve as the business scales. Margin trend interrupted by delayed 2020 revenue.
Mortgages (2) 62% 69% 71% 66% 68% Reflects variations in commercial terms on implementation projects and blend of revenue as recurring level grows.
QuantHouse 25%(4) 34% Revenue growth and improved operating leverage in Iress ownership.
Superannuation 57% 49% 51% 53% 45% Investment in super administration growth strategy.
OneVue 31%(4) Margin will grow as integration with Iress progresses.
(1) Direct contribution margin = Direct Contribution / Revenue where Direct Contribution = Operating Revenue less cost of sales, directly attributable staff costs (e.g. Account Managers) and operating expenses.(2) Mortgages margins have been normalised in 2016, 2017 and 2018 to reflect staff transfers that occured in 2H18 in operating expenses.(3) QuantHouse has been disclosed separately.(4) Since acquisition by Iress.(5) Margin in 2020 adjusted for staff transfers. 6
Consistent high margins in Australia, improving returns on investments
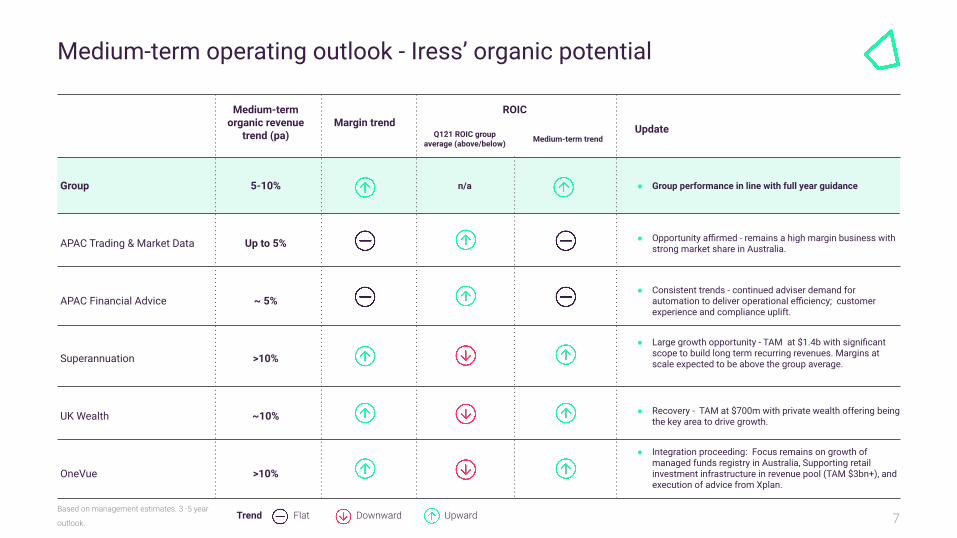
Medium-term organic revenue
trend (pa)Margin trend
ROIC Update
Group 5-10% n/a ● Group performance in line with full year guidance
APAC Trading & Market Data Up to 5% ● Opportunity affirmed - remains a high margin business with strong market share in Australia.
APAC Financial Advice ~ 5%● Consistent trends - continued adviser demand for
automation to deliver operational efficiency; customer experience and compliance uplift.
Superannuation >10%● Large growth opportunity - TAM at $1.4b with significant
scope to build long term recurring revenues. Margins at scale expected to be above the group average.
UK Wealth ~10% ● Recovery - TAM at $700m with private wealth offering being the key area to drive growth.
OneVue >10%
● Integration proceeding: Focus remains on growth of managed funds registry in Australia, Supporting retail investment infrastructure in revenue pool (TAM $3bn+), and execution of advice from Xplan.
Based on management estimates. 3 -5 year
outlook.Flat Downward UpwardTrend
Q121 ROIC groupaverage (above/below) Medium-term trend
7
Medium-term operating outlook - Iress’ organic potential
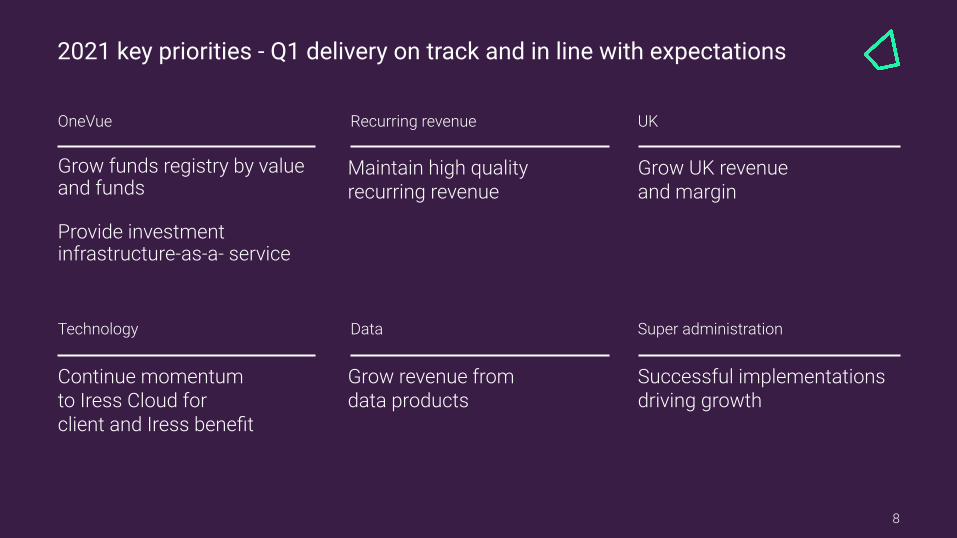
Grow funds registry by value and funds
Provide investment infrastructure-as-a- service
Continue momentum to Iress Cloud for client and Iress benefit
OneVue
Technology
Maintain high quality recurring revenue
Grow UK revenueand margin
Grow revenue fromdata products
Successful implementationsdriving growth
8
Recurring revenue UK
Data Super administration
2021 key priorities - Q1 delivery on track and in line with expectations

Financialperformance update
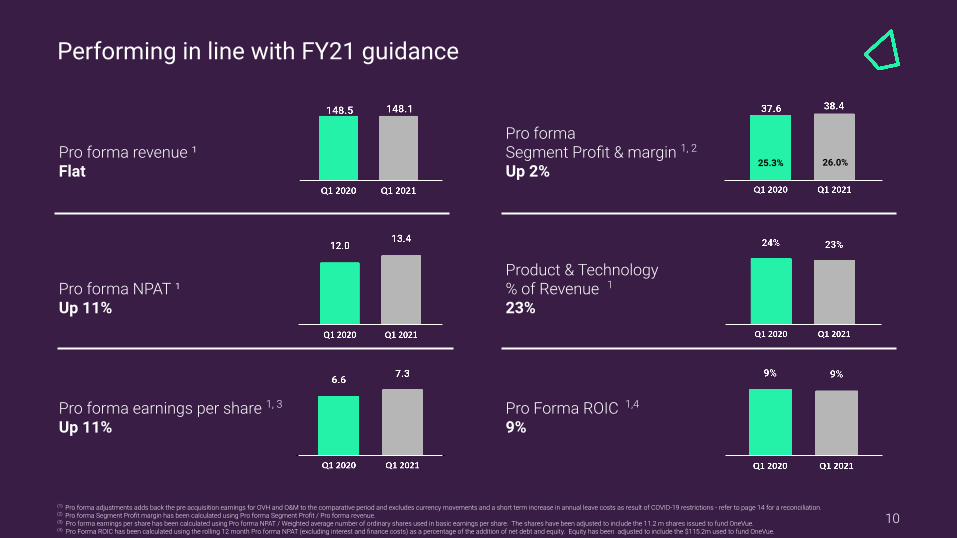
(1) Pro forma adjustments adds back the pre acquisition earnings for OVH and O&M to the comparative period and excludes currency movements and a short term increase in annual leave costs as result of COVID-19 restrictions - refer to page 14 for a reconciliation.(2) Pro forma Segment Profit margin has been calculated using Pro forma Segment Profit / Pro forma revenue.(3) Pro forma earnings per share has been calculated using Pro forma NPAT / Weighted average number of ordinary shares used in basic earnings per share. The shares have been adjusted to include the 11.2 m shares issued to fund OneVue.(4) Pro Forma ROIC has been calculated using the rolling 12 month Pro forma NPAT (excluding interest and finance costs) as a percentage of the addition of net debt and equity. Equity has been adjusted to include the $115.2m used to fund OneVue.
Pro forma revenue ¹Flat
Pro forma NPAT ¹Up 11%
Pro forma earnings per share 1, 3
Up 11%
Pro forma Segment Profit & margin 1, 2
Up 2%
Product & Technology% of Revenue 123%
Pro Forma ROIC 1,4
9%
25.3% 26.0%
Performing in line with FY21 guidance
10
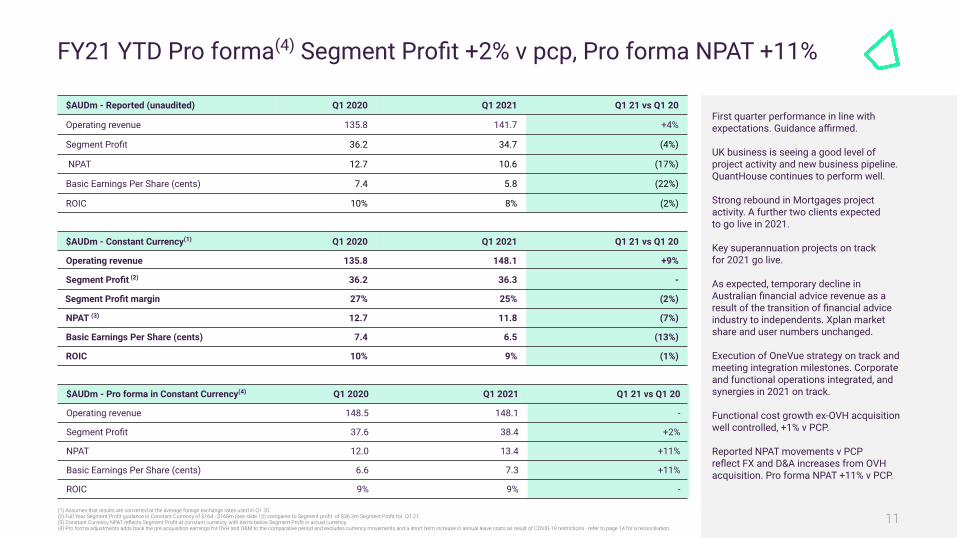
$AUDm - Constant Currency(1) Q1 2020 Q1 2021 Q1 21 vs Q1 20
Operating revenue 135.8 148.1 +9%
Segment Profit (2) 36.2 36.3 -
Segment Profit margin 27% 25% (2%)
NPAT (3) 12.7 11.8 (7%)
Basic Earnings Per Share (cents) 7.4 6.5 (13%)
ROIC 10% 9% (1%)
$AUDm - Pro forma in Constant Currency(4) Q1 2020 Q1 2021 Q1 21 vs Q1 20
Operating revenue 148.5 148.1 -
Segment Profit 37.6 38.4 +2%
NPAT 12.0 13.4 +11%
Basic Earnings Per Share (cents) 6.6 7.3 +11%
ROIC 9% 9% -
(1) Assumes that results are converted at the average foreign exchange rates used in Q1 20.(2) Full Year Segment Profit guidance in Constant Currency of $164 - $168m (see slide 12) compares to Segment profit of $36.3m Segment Profit for Q1 21.(3) Constant Currency NPAT reflects Segment Profit at constant currency, with items below Segment Profit in actual currency.(4) Pro forma adjustments adds back the pre acquisition earnings for OVH and O&M to the comparative period and excludes currency movements and a short term increase in annual leave costs as result of COVID-19 restrictions - refer to page 14 for a reconciliation.
$AUDm - Reported (unaudited) Q1 2020 Q1 2021 Q1 21 vs Q1 20
Operating revenue 135.8 141.7 +4%
Segment Profit 36.2 34.7 (4%)
NPAT 12.7 10.6 (17%)
Basic Earnings Per Share (cents) 7.4 5.8 (22%)
ROIC 10% 8% (2%)
First quarter performance in line with expectations. Guidance affirmed.
UK business is seeing a good level of project activity and new business pipeline. QuantHouse continues to perform well.
Strong rebound in Mortgages project activity. A further two clients expectedto go live in 2021.
Key superannuation projects on trackfor 2021 go live.
As expected, temporary decline in Australian financial advice revenue as a result of the transition of financial advice industry to independents. Xplan market share and user numbers unchanged.
Execution of OneVue strategy on track and meeting integration milestones. Corporate and functional operations integrated, and synergies in 2021 on track.
Functional cost growth ex-OVH acquisition well controlled, +1% v PCP.
Reported NPAT movements v PCPreflect FX and D&A increases from OVH acquisition. Pro forma NPAT +11% v PCP.
FY21 YTD Pro forma(4) Segment Profit +2% v pcp, Pro forma NPAT +11%
11
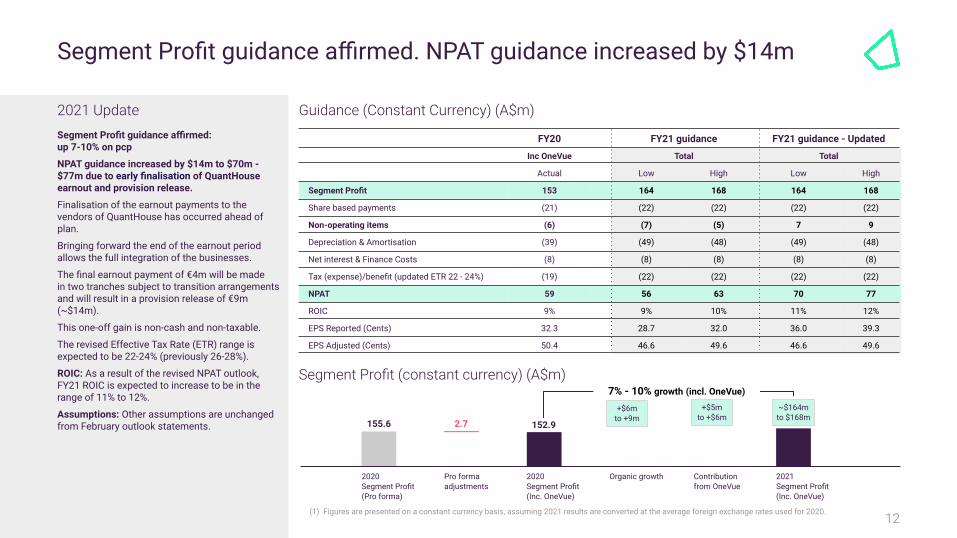
FY20 FY21 guidance FY21 guidance - Updated
Inc OneVue Total Total
Actual Low High Low High
Segment Profit 153 164 168 164 168
Share based payments (21) (22) (22) (22) (22)
Non-operating items (6) (7) (5) 7 9
Depreciation & Amortisation (39) (49) (48) (49) (48)
Net interest & Finance Costs (8) (8) (8) (8) (8)
Tax (expense)/benefit (updated ETR 22 - 24%) (19) (22) (22) (22) (22)
NPAT 59 56 63 70 77
ROIC 9% 9% 10% 11% 12%
EPS Reported (Cents) 32.3 28.7 32.0 36.0 39.3
EPS Adjusted (Cents) 50.4 46.6 49.6 46.6 49.6
Guidance (Constant Currency) (A$m)Segment Profit guidance affirmed:up 7-10% on pcp
NPAT guidance increased by $14m to $70m - $77m due to early finalisation of QuantHouse earnout and provision release.
Finalisation of the earnout payments to the vendors of QuantHouse has occurred ahead of plan.
Bringing forward the end of the earnout period allows the full integration of the businesses.
The final earnout payment of €4m will be madein two tranches subject to transition arrangements and will result in a provision release of €9m (~$14m).
This one-off gain is non-cash and non-taxable.
The revised Effective Tax Rate (ETR) range is expected to be 22-24% (previously 26-28%).
ROIC: As a result of the revised NPAT outlook, FY21 ROIC is expected to increase to be in the range of 11% to 12%.
Assumptions: Other assumptions are unchanged from February outlook statements.
2021 Update
Segment Profit (constant currency) (A$m)
155.6
2020Segment Profit(Pro forma)
Pro formaadjustments
2020Segment Profit(Inc. OneVue)
Organic growth Contributionfrom OneVue
2021Segment Profit(Inc. OneVue)
2.7 152.9
7% - 10% growth (incl. OneVue)
+$6mto +9m
+$5mto +$6m
~$164mto $168m
(1) Figures are presented on a constant currency basis, assuming 2021 results are converted at the average foreign exchange rates used for 2020.
Segment Profit guidance affirmed. NPAT guidance increased by $14m
12

Appendix
13
14
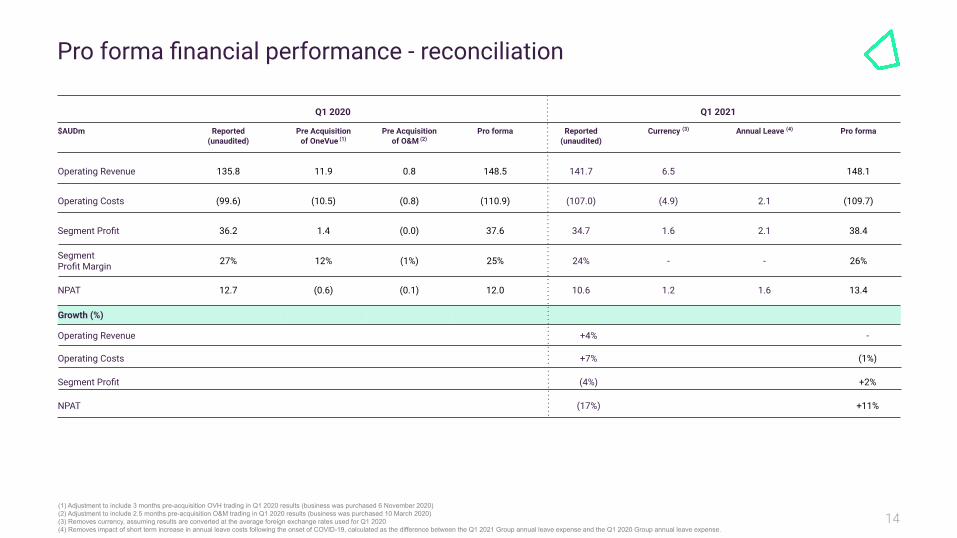
Q1 2020
Q1 2021
$AUDm Reported(unaudited)
Pre Acquisitionof OneVue (1)
Pre Acquisitionof O&M (2)
Pro forma Reported(unaudited)
Currency (3) Annual Leave (4) Pro forma
Operating Revenue 135.8 11.9 0.8 148.5 141.7 6.5 148.1
Operating Costs (99.6) (10.5) (0.8) (110.9) (107.0) (4.9) 2.1 (109.7)
Segment Profit 36.2 1.4 (0.0) 37.6 34.7 1.6 2.1 38.4
SegmentProfit Margin 27% 12% (1%) 25% 24% - - 26%
NPAT 12.7 (0.6) (0.1) 12.0 10.6 1.2 1.6 13.4
Growth (%)
Operating Revenue +4% -
Operating Costs +7% (1%)
Segment Profit (4%) +2%
NPAT (17%) +11%
(1) Adjustment to include 3 months pre-acquisition OVH trading in Q1 2020 results (business was purchased 6 November 2020)(2) Adjustment to include 2.5 months pre-acquisition O&M trading in Q1 2020 results (business was purchased 10 March 2020)(3) Removes currency, assuming results are converted at the average foreign exchange rates used for Q1 2020(4) Removes impact of short term increase in annual leave costs following the onset of COVID-19, calculated as the difference between the Q1 2021 Group annual leave expense and the Q1 2020 Group annual leave expense.
Pro forma financial performance - reconciliation
15
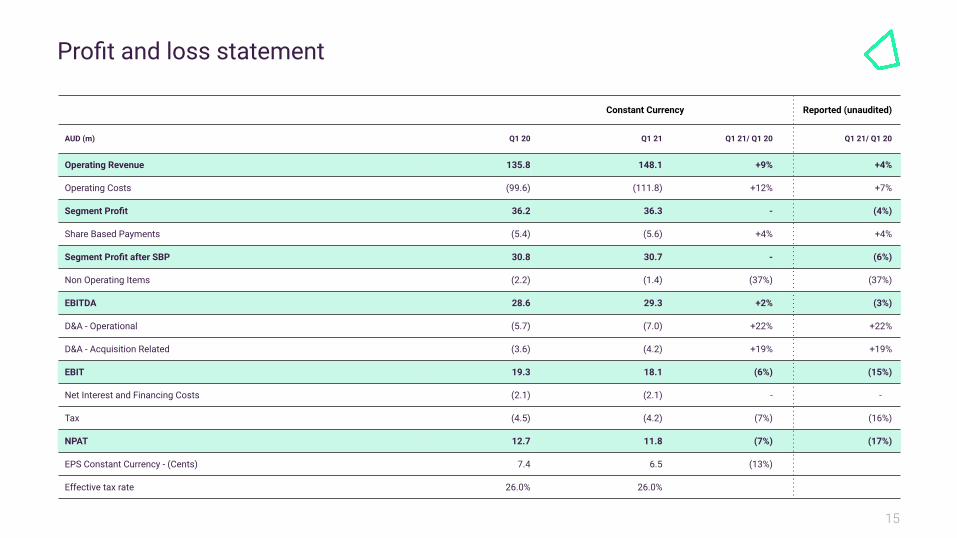
Constant Currency Reported (unaudited)
AUD (m) Q1 20 Q1 21 Q1 21/ Q1 20 Q1 21/ Q1 20
Operating Revenue 135.8 148.1 +9% +4%
Operating Costs (99.6) (111.8) +12% +7%
Segment Profit 36.2 36.3 - (4%)
Share Based Payments (5.4) (5.6) +4% +4%
Segment Profit after SBP 30.8 30.7 - (6%)
Non Operating Items (2.2) (1.4) (37%) (37%)
EBITDA 28.6 29.3 +2% (3%)
D&A - Operational (5.7) (7.0) +22% +22%
D&A - Acquisition Related (3.6) (4.2) +19% +19%
EBIT 19.3 18.1 (6%) (15%)
Net Interest and Financing Costs (2.1) (2.1) - -
Tax (4.5) (4.2) (7%) (16%)
NPAT 12.7 11.8 (7%) (17%)
EPS Constant Currency - (Cents) 7.4 6.5 (13%)
Effective tax rate 26.0% 26.0%
Profit and loss statement
16
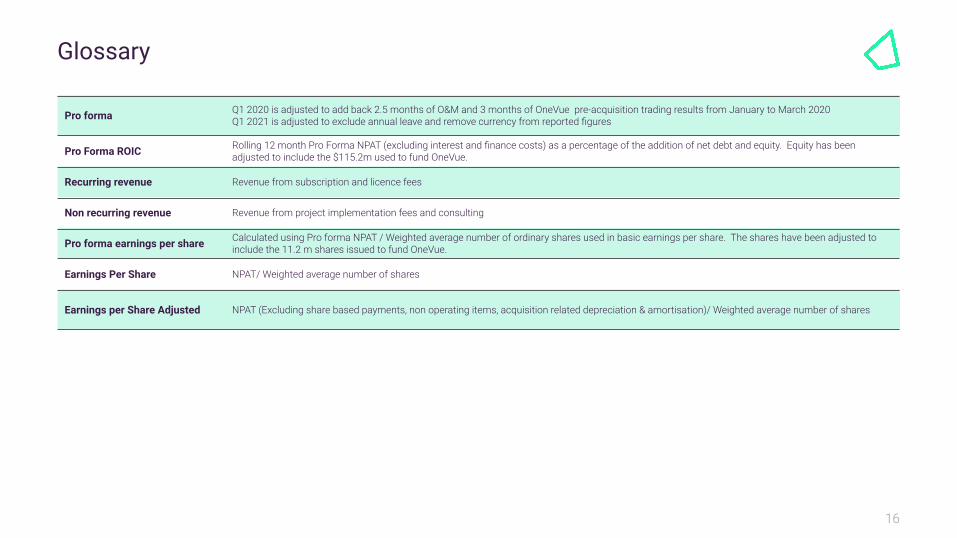
Glossary
Pro forma Q1 2020 is adjusted to add back 2.5 months of O&M and 3 months of OneVue pre-acquisition trading results from January to March 2020Q1 2021 is adjusted to exclude annual leave and remove currency from reported figures
Pro Forma ROIC Rolling 12 month Pro Forma NPAT (excluding interest and finance costs) as a percentage of the addition of net debt and equity. Equity has been adjusted to include the $115.2m used to fund OneVue.
Recurring revenue Revenue from subscription and licence fees
Non recurring revenue Revenue from project implementation fees and consulting
Pro forma earnings per share Calculated using Pro forma NPAT / Weighted average number of ordinary shares used in basic earnings per share. The shares have been adjusted to include the 11.2 m shares issued to fund OneVue.
Earnings Per Share NPAT/ Weighted average number of shares
Earnings per Share Adjusted NPAT (Excluding share based payments, non operating items, acquisition related depreciation & amortisation)/ Weighted average number of shares

17
Disclaimer
The material in this presentation is intended to be general background information on Iress Limited and its activities, current at the date of the presentation. The information is provided in summary form and does not purport to be complete. It is not intended to be relied upon as advice to investors or potential investors and does not consider the individual circumstances of any particular investor. Prior to making a decision in relation to Iress’ securities, products or services, investors or potential investors should consider their own investment objectives, financial situation and needs and obtain professional advice. The material contained in this presentation may include information derived from publicly available sources that have not been independently verified. No representation or warranty is made as to the accuracy, completeness or reliability of the information. This presentation contains forward-looking statements, which may be identified by words such as ‘anticipate’, ‘believe’, ‘estimate’, ‘expect’, intend’, ‘will’, ‘plan’, ‘may’, ‘could’ and similar expressions. Such forward-looking statements are based on Iress’ current views and assumptions and involve known and unknown risks and uncertainties, many of which are beyond Iress’ control, and which may cause actual results to differ materially from those projected in the forward-looking statements contained in this presentation. These risks and uncertainties could cause actual results, performance or events to differ materially from those expressed or implied. Forward-looking statements contained in this presentation are not guarantees or representations of future performance and should not be relied upon as such. Readers should not place undue reliance on these forward-looking statements, which speak only as of the date of this presentation. Iress undertakes no obligation to publicly release the result of any revisions to these forward-looking statements to reflect events or circumstances after the date of this presentation, subject to applicable disclosure requirements. For further information visit: iress.com

ContactAndrew Walsh, CEOJohn Harris, CFO
+61 3 9018 5800iress.com