Embed Size (px)
Citation preview
Public
Patrick Jany, CFO
11 June 2015
Goldman SachsEuropean Chemicals 2020 Vision ConferenceLONDON, 11 JUNE 2015
Public
Patrick Jany, CFO
11 June 2015
Highlights Q1 2015
Patrick Jany, CFO, 11 June 2015
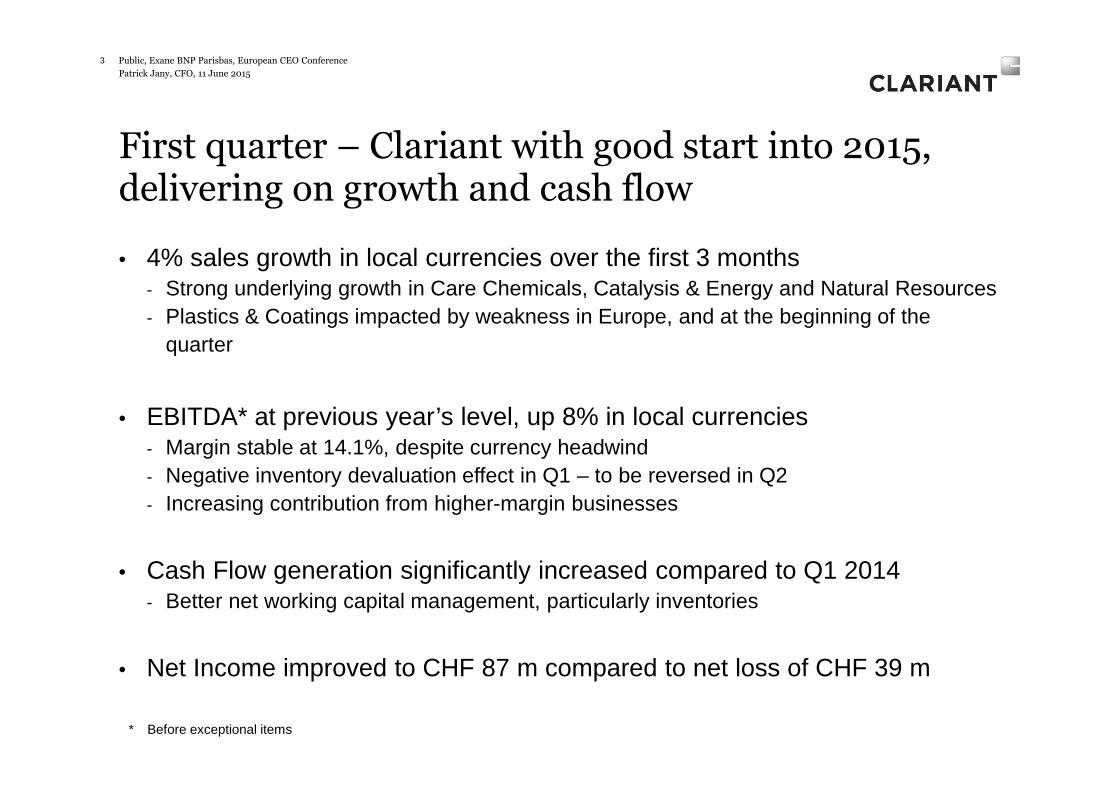
First quarter – Clariant with good start into 2015, delivering on growth and cash flow
• 4% sales growth in local currencies over the first 3 months - Strong underlying growth in Care Chemicals, Catalysis & Energy and Natural Resources- Plastics & Coatings impacted by weakness in Europe, and at the beginning of the
quarter
• EBITDA* at previous year’s level, up 8% in local currencies- Margin stable at 14.1%, despite currency headwind- Negative inventory devaluation effect in Q1 – to be reversed in Q2- Increasing contribution from higher-margin businesses
• Cash Flow generation significantly increased compared to Q1 2014- Better net working capital management, particularly inventories
• Net Income improved to CHF 87 m compared to net loss of CHF 39 m
3
* Before exceptional items
Public, Exane BNP Parisbas, European CEO Conference

Patrick Jany, CFO, 11 June 2015
Sales growth driven by volumes – despite slow start
and FX volatility
Public, Exane BNP Parisbas, European CEO Conference4
Sales mix Q1 2015 Sales growth in local currenciesVolume
5%
Price-1%
Acq./Div.0%
Currency-6%
− Organic sales growth in LC driven by 5% higher volumes
− Double-digit sales growth in LATAM
− Good growth in Asia driven by smaller economies
− NORAM solid, continued weakness in Europe
Sales Q1 2015: CHF 1 465 m / +4%
Latin America239 / +23%
Europe518 / -2%
North America 277 / +3%
Asia / Pacific 336 / +8%
Middle East& Africa 95 / -6%
Germany 173 / −13%
China 106 / -4%
Brazil 87 / +8%
Emerging Markets Mature Markets
all figures continuing operations
Patrick Jany, CFO, 11 June 2015
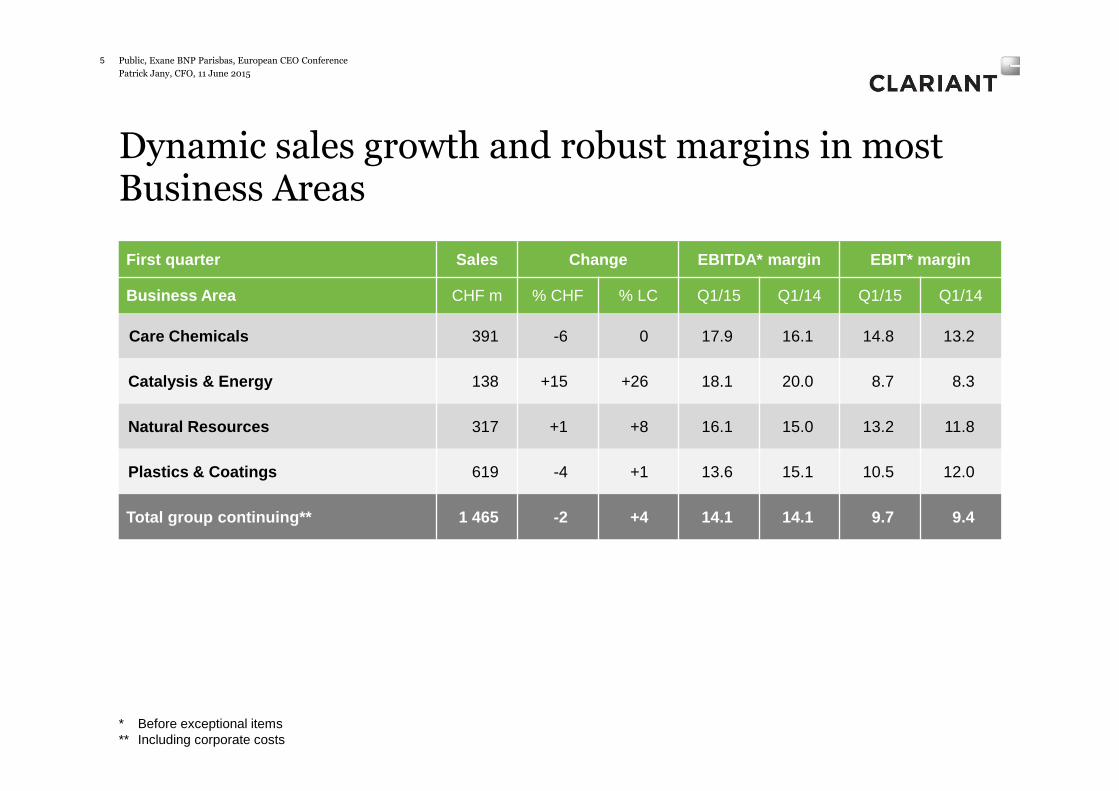
Dynamic sales growth and robust margins in most Business Areas
Public, Exane BNP Parisbas, European CEO Conference5
First quarter Sales Change EBITDA* margin EBIT* margin
Business Area CHF m % CHF % LC Q1/15 Q1/14 Q1/15 Q1/14
Care Chemicals 391 -6 0 17.9 16.1 14.8 13.2
Catalysis & Energy 138 +15 +26 18.1 20.0 8.7 8.3
Natural Resources 317 +1 +8 16.1 15.0 13.2 11.8
Plastics & Coatings 619 -4 +1 13.6 15.1 10.5 12.0
Total group continuing** 1 465 -2 +4 14.1 14.1 9.7 9.4
* Before exceptional items** Including corporate costs
Public
Patrick Jany, CFO
11 June 2015
Focus On Performance, Growth & Innovation
Patrick Jany, CFO, 11 June 2015
7
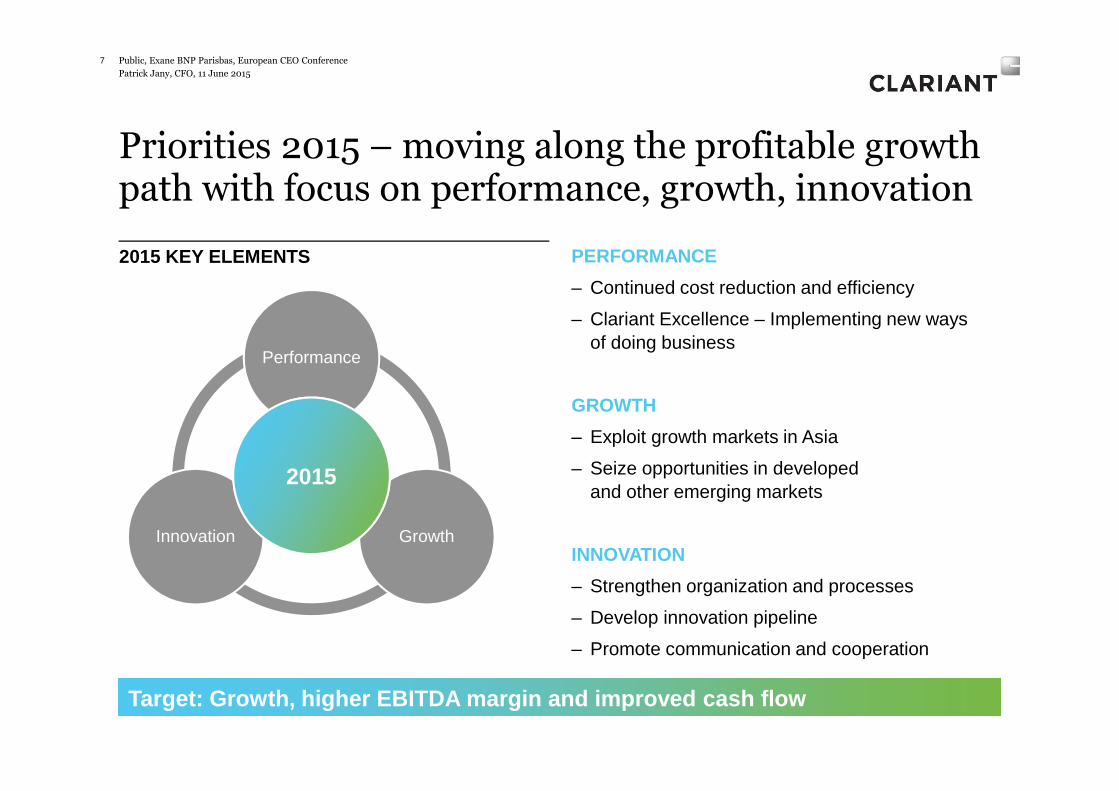
Priorities 2015 – moving along the profitable growth path with focus on performance, growth, innovation
GrowthInnovation
Performance
2015
2015 KEY ELEMENTS PERFORMANCE
– Continued cost reduction and efficiency
– Clariant Excellence – Implementing new ways of doing business
GROWTH
– Exploit growth markets in Asia
– Seize opportunities in developed and other emerging markets
INNOVATION
– Strengthen organization and processes
– Develop innovation pipeline
– Promote communication and cooperation
Target: Growth, higher EBITDA margin and improved c ash flow
Public, Exane BNP Parisbas, European CEO Conference
Patrick Jany, CFO, 11 June 2015
Four Business Areas
THE RIGHT PORTFOLIO FOR FUTURE GROWTH
Public, Exane BNP Parisbas, European CEO Conference8
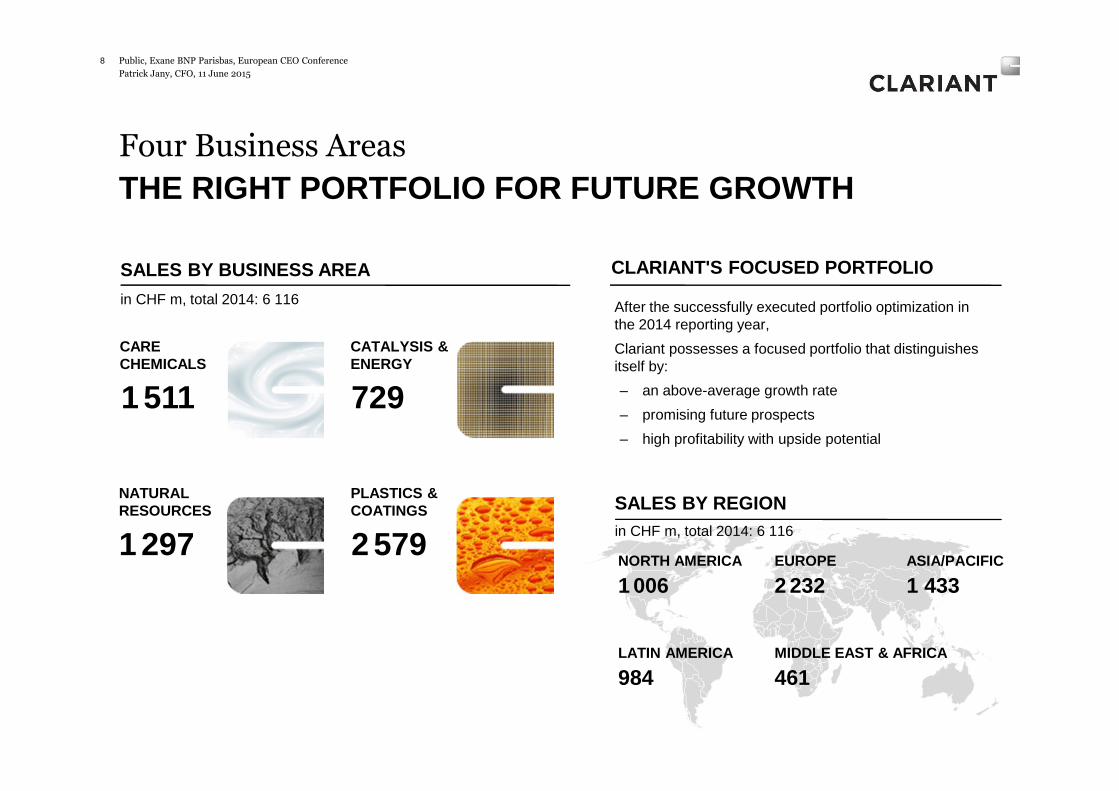
SALES BY BUSINESS AREA
in CHF m, total 2014: 6 116
CLARIANT'S FOCUSED PORTFOLIO
SALES BY REGION in CHF m, total 2014: 6 116
461MIDDLE EAST & AFRICA
984LATIN AMERICA
2 232EUROPE
1 433ASIA/PACIFIC
1 006NORTH AMERICA
1 511 729
1 297 2 579
CARE CHEMICALS
CATALYSIS & ENERGY
NATURAL RESOURCES
PLASTICS & COATINGS
After the successfully executed portfolio optimization in the 2014 reporting year,
Clariant possesses a focused portfolio that distinguishes itself by:
– an above-average growth rate
– promising future prospects
– high profitability with upside potential
Patrick Jany, CFO, 11 June 2015
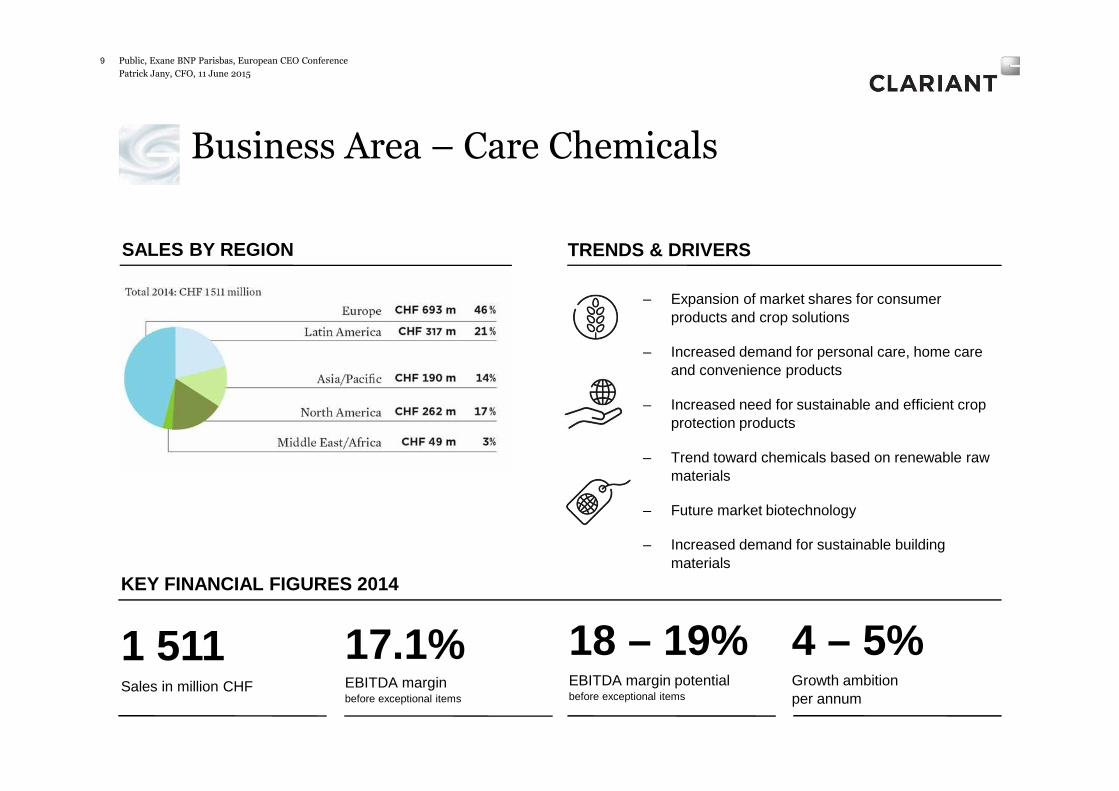
Business Area – Care Chemicals
Public, Exane BNP Parisbas, European CEO Conference9
– Expansion of market shares for consumer products and crop solutions
– Increased demand for personal care, home care and convenience products
– Increased need for sustainable and efficient crop protection products
– Trend toward chemicals based on renewable raw materials
– Future market biotechnology
– Increased demand for sustainable building materials
TRENDS & DRIVERS
4 – 5%Growth ambition per annum
SALES BY REGION
18 – 19%EBITDA margin potentialbefore exceptional items
KEY FINANCIAL FIGURES 2014
Sales in million CHF
1 511EBITDA marginbefore exceptional items
17.1%

Patrick Jany, CFO, 11 June 2015
Business Area – Catalysis
10
– Expansion of a leading market position in all areas of operation
– Well positioned for applications based on shale gas in the US and coal in China
– Continue to foster partnership with leading technology providers
– Concentration on the portfolio and shifting of the resources towards core activities
KEY FINANCIAL FIGURES 2014
Sales in million CHF
729 6 – 7%Growth ambition per annum
24 – 26%EBITDA margin potentialbefore exceptional items
EBITDA marginbefore exceptional items
23.5%
Public, Exane BNP Parisbas, European CEO Conference
TRENDS & DRIVERSSALES BY REGION
Patrick Jany, CFO, 11 June 2015
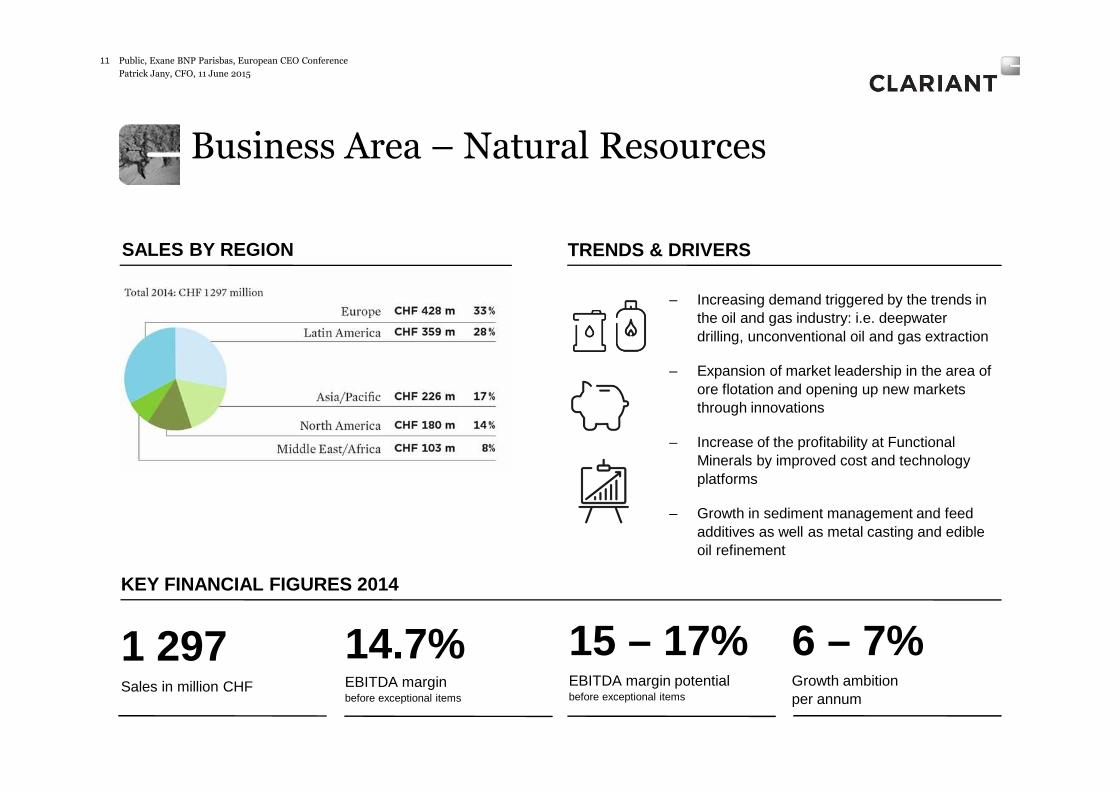
Business Area – Natural Resources
11
– Increasing demand triggered by the trends in the oil and gas industry: i.e. deepwater drilling, unconventional oil and gas extraction
– Expansion of market leadership in the area of ore flotation and opening up new markets through innovations
– Increase of the profitability at Functional Minerals by improved cost and technology platforms
– Growth in sediment management and feed additives as well as metal casting and edible oil refinement
6 – 7%Growth ambition per annum
KEY FINANCIAL FIGURES 2014
Sales in million CHF
1 297 15 – 17% EBITDA margin potentialbefore exceptional items
EBITDA marginbefore exceptional items
14.7%
Public, Exane BNP Parisbas, European CEO Conference
TRENDS & DRIVERSSALES BY REGION
Patrick Jany, CFO, 11 June 2015
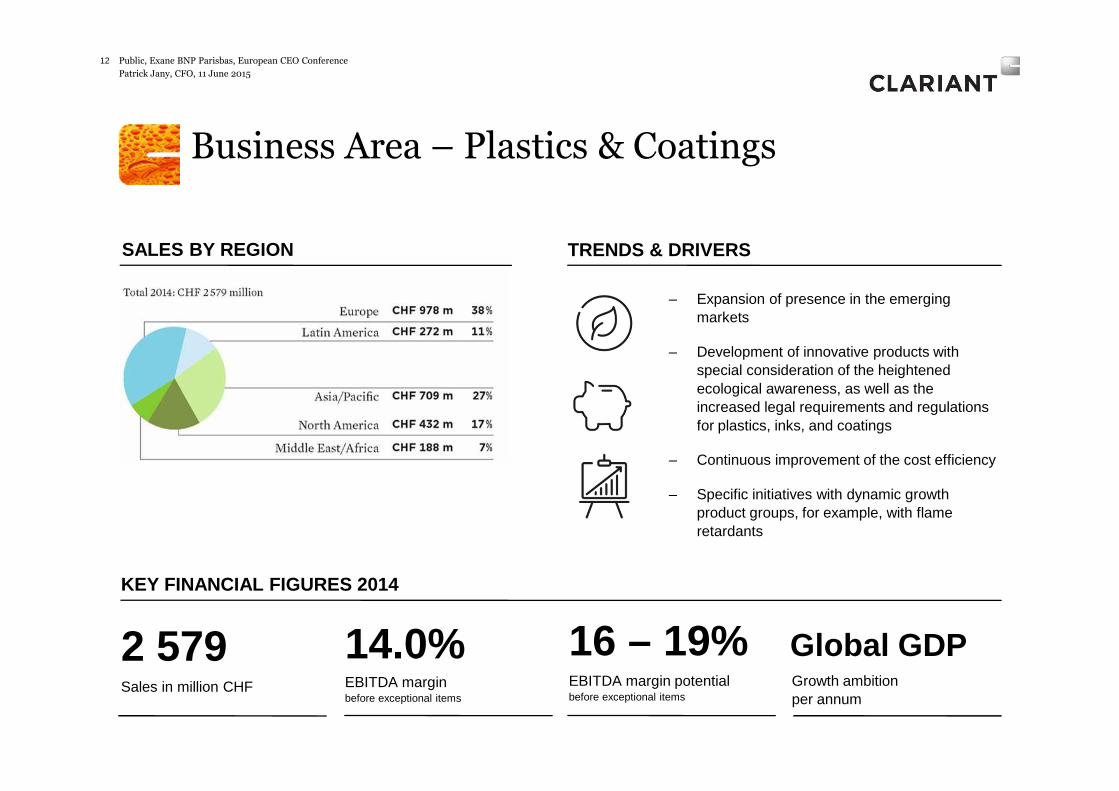
Business Area – Plastics & Coatings
12
Global GDPGrowth ambition per annum
KEY FINANCIAL FIGURES 2014
Sales in million CHF
2 579
– Expansion of presence in the emerging markets
– Development of innovative products with special consideration of the heightened ecological awareness, as well as the increased legal requirements and regulations for plastics, inks, and coatings
– Continuous improvement of the cost efficiency
– Specific initiatives with dynamic growth product groups, for example, with flame retardants
16 – 19% EBITDA margin potentialbefore exceptional items
EBITDA marginbefore exceptional items
14.0%
Public, Exane BNP Parisbas, European CEO Conference
TRENDS & DRIVERSSALES BY REGION
Patrick Jany, CFO, 11 June 2015
Innovation – active management of innovation portfolio drives growth and profitability
Public, Exane BNP Parisbas, European CEO Conference13
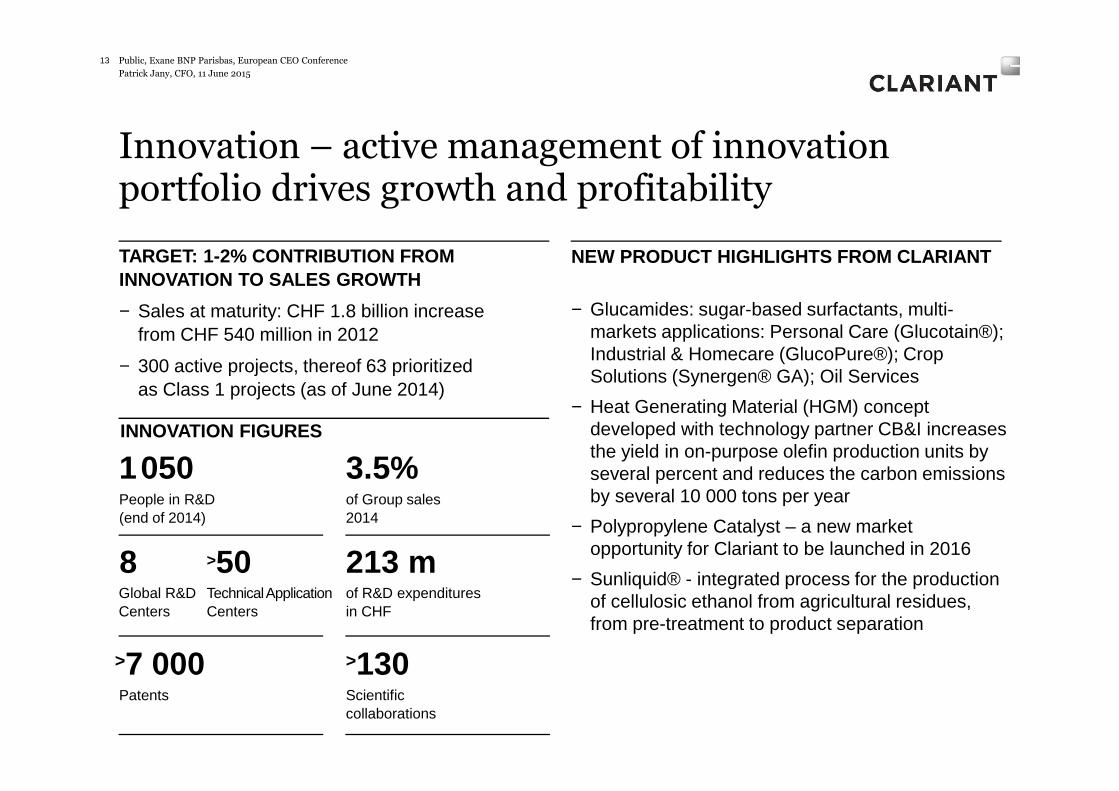
TARGET: 1-2% CONTRIBUTION FROM INNOVATION TO SALES GROWTH
− Sales at maturity: CHF 1.8 billion increase from CHF 540 million in 2012
− 300 active projects, thereof 63 prioritized as Class 1 projects (as of June 2014)
NEW PRODUCT HIGHLIGHTS FROM CLARIANT
− Glucamides: sugar-based surfactants, multi-markets applications: Personal Care (Glucotain®); Industrial & Homecare (GlucoPure®); Crop Solutions (Synergen® GA); Oil Services
− Heat Generating Material (HGM) concept developed with technology partner CB&I increases the yield in on-purpose olefin production units by several percent and reduces the carbon emissions by several 10 000 tons per year
− Polypropylene Catalyst – a new market opportunity for Clariant to be launched in 2016
− Sunliquid® - integrated process for the production of cellulosic ethanol from agricultural residues, from pre-treatment to product separation
INNOVATION FIGURES
1050
>7 000
3.5%of Group sales2014
213 mof R&D expendituresin CHF
>130
People in R&D (end of 2014)
Patents Scientificcollaborations
Global R&D Centers
8Technical Application Centers
>50

Public
Patrick Jany, CFO
11 June 2015
Outlook

Patrick Jany, CFO, 11 June 2015
Macroeconomic view
− Clariant expects the challenging environment to continue, which is characterized by an increased volatility in commodity prices and currencies
− The combined effect of the appreciation of the Swiss franc with the weakening of the euro will impact Clariant’s sales and profitability in absolute terms, but will be fairly neutral in terms of relative margins
− In the emerging markets the economic environment is expected to remain favorable but at a lower level and with increased volatility; moderate growth is expected in the United States, however, growth in Europe is expected to remain weak
Outlook 2015 –heterogeneous macroeconomic environment
15 Public, Exane BNP Parisbas, European CEO Conference
Patrick Jany, CFO, 11 June 2015
2015 – Clariant will further progress in local curre ncy and profitability
− Clariant will focus on profitably growing the four Business Areas and on cost efficiency
– For full-year 2015, Clariant expects low to mid-single digit sales growth in local currencies, an EBITDA margin before exceptional items above full-year 2014 and an increased cash flow generation
… and beyond
− 2015 will mark a further progress towards our mid-term target of becoming a leading company for specialty chemicals, achieving a position in the top tier of the industry. This corresponds to an EBITDA margin range before exceptional items of 16% to 19% and a return on invested capital (ROIC) above peer group average
16
Outlook confirmed –further progress in sales and profitability
Public, Exane BNP Parisbas, European CEO Conference
Patrick Jany, CFO, 11 June 2015
Public, Exane BNP Parisbas, European CEO Conference17
Public
Patrick Jany, CFO
11 June 2015
Back-up slides
Patrick Jany, CFO, 11 June 2015
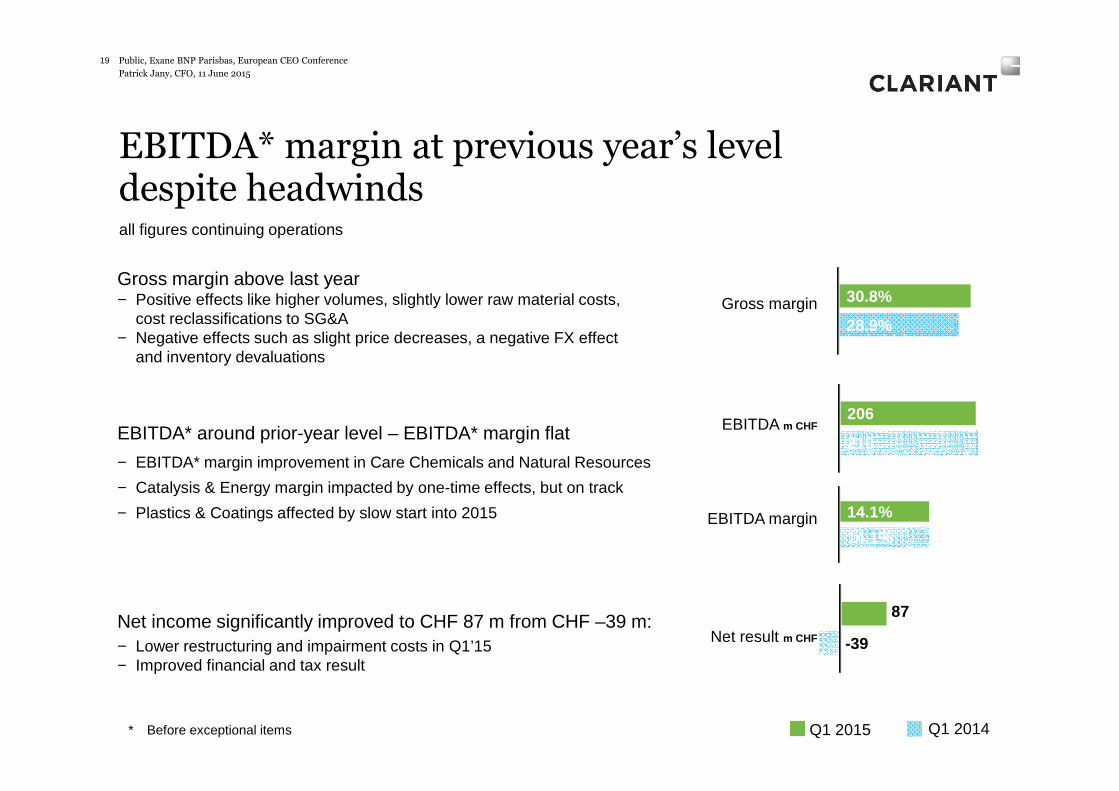
Gross margin above last year− Positive effects like higher volumes, slightly lower raw material costs,
cost reclassifications to SG&A− Negative effects such as slight price decreases, a negative FX effect
and inventory devaluations
EBITDA* around prior-year level – EBITDA* margin flat
− EBITDA* margin improvement in Care Chemicals and Natural Resources
− Catalysis & Energy margin impacted by one-time effects, but on track
− Plastics & Coatings affected by slow start into 2015
Net income significantly improved to CHF 87 m from CHF –39 m:− Lower restructuring and impairment costs in Q1’15− Improved financial and tax result
-39
87
EBITDA* margin at previous year’s level despite headwinds
Public, Exane BNP Parisbas, European CEO Conference19
28.9%
30.8%
14.1%
14.1%
Net result m CHF
all figures continuing operations
Q1 2015 Q1 2014* Before exceptional items
210
206EBITDA m CHF
Gross margin
EBITDA margin
Patrick Jany, CFO, 11 June 2015
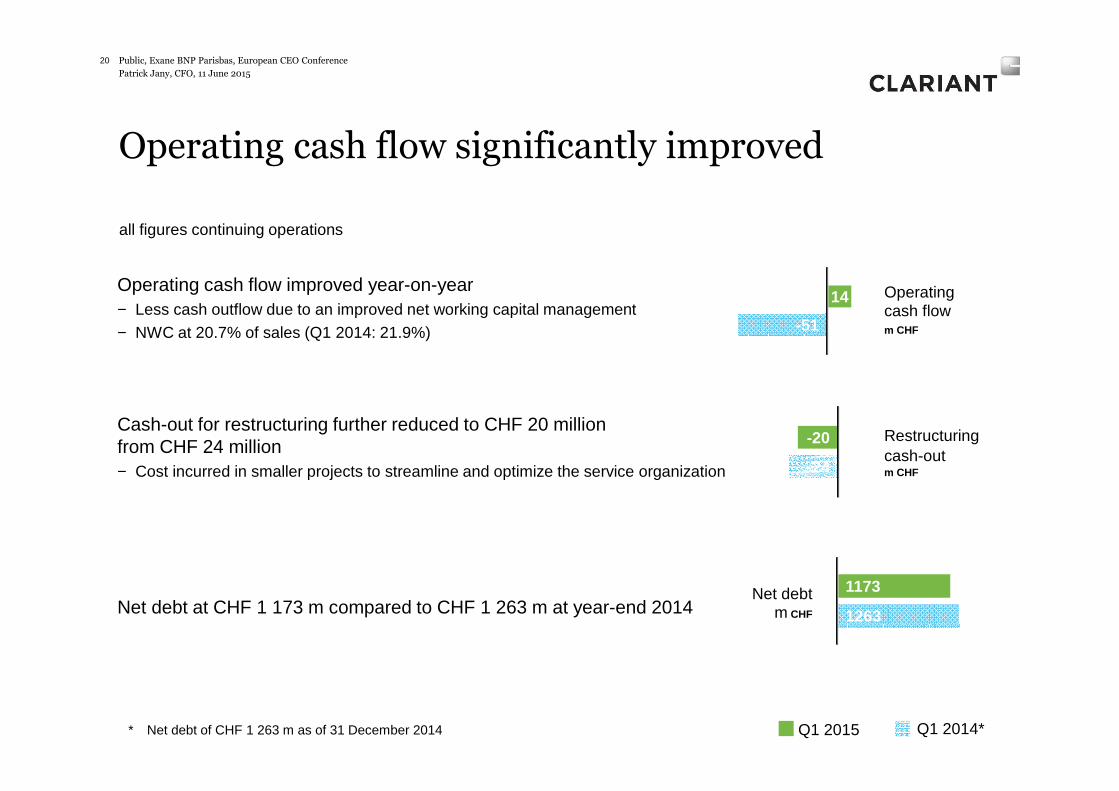
Operating cash flow improved year-on-year − Less cash outflow due to an improved net working capital management
− NWC at 20.7% of sales (Q1 2014: 21.9%)
Cash-out for restructuring further reduced to CHF 20 million from CHF 24 million− Cost incurred in smaller projects to streamline and optimize the service organization
Net debt at CHF 1 173 m compared to CHF 1 263 m at year-end 2014
Operating cash flow significantly improved
Public, Exane BNP Parisbas, European CEO Conference20
-51
14 Operatingcash flowm CHF
-24
-20 Restructuringcash-outm CHF
1263
1173Net debtm CHF
all figures continuing operations
Q1 2015 Q1 2014** Net debt of CHF 1 263 m as of 31 December 2014

Patrick Jany, CFO, 11 June 2015
Key financials – first quarter
Public, Exane BNP Parisbas, European CEO Conference21
First quarter results2015 2014
CHF m % of sales CHF m % of sales
Sales 1 465 100% 1 492 100%
Local currency growth (LC) 4%
- Organic growth rate* 4%
- Acquisitions/Divestments 0%
Currencies −6%
Gross profit 451 30.8% 431 28.9%
EBITDA before exceptionals 206 14.1 % 210 14.1%
EBITDA 203 13.9% 198 13.3%
Operating income before exceptionals 142 9.7 % 140 9.4%
Operating income 139 9.5% 41 2.7%
Net result from continuing operations 87 5.9 % −39 −2.6%
Net income/loss1 87 −48
Operating cash flow1 14 −51
Sales from discontinued operations − 66
Net result from discontinued operations − −9
* Organic growth: volume and price effects excluding the impact of changes in foreign currency exchange rates and acquisitions/divestments.1 Total Group, including discontinued operations.
Patrick Jany, CFO, 11 June 2015
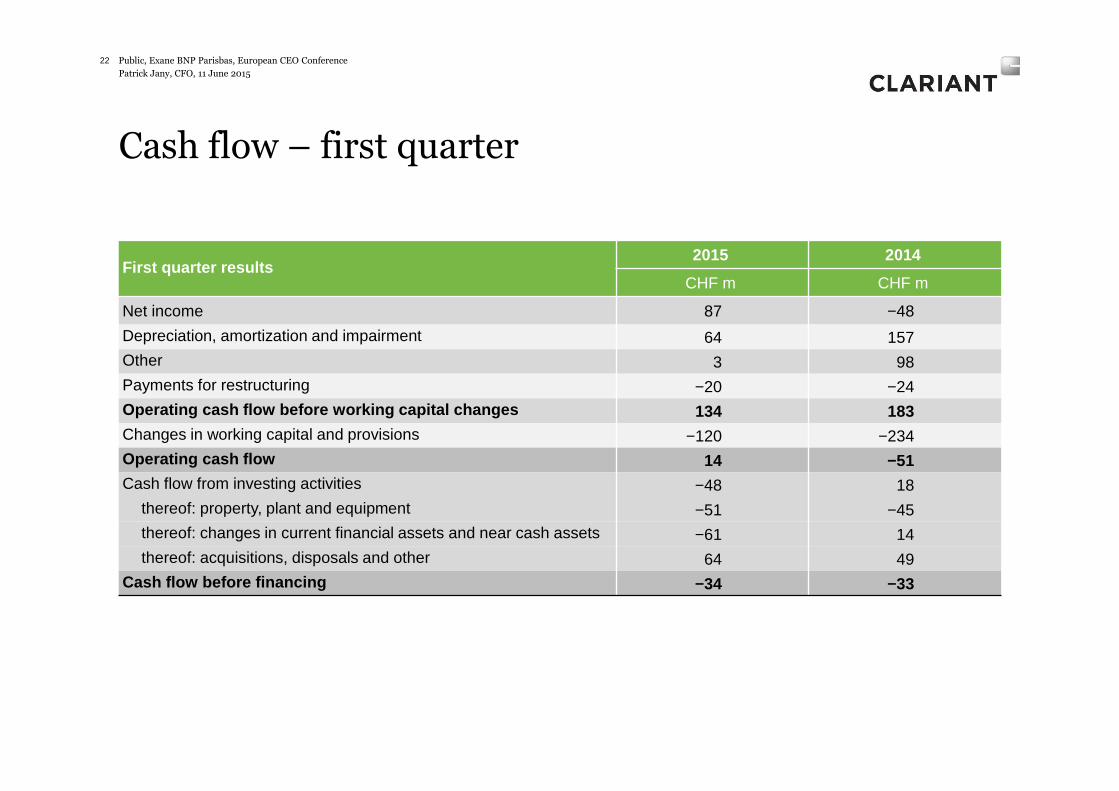
Cash flow – first quarter
Public, Exane BNP Parisbas, European CEO Conference22
First quarter results2015 2014
CHF m CHF m
Net income 87 −48
Depreciation, amortization and impairment 64 157Other 3 98Payments for restructuring −20 −24Operating cash flow before working capital changes 134 183Changes in working capital and provisions −120 −234Operating cash flow 14 −51Cash flow from investing activities −48 18
thereof: property, plant and equipment −51 −45thereof: changes in current financial assets and near cash assets −61 14thereof: acquisitions, disposals and other 64 49
Cash flow before financing −34 −33
Patrick Jany, CFO, 11 June 2015
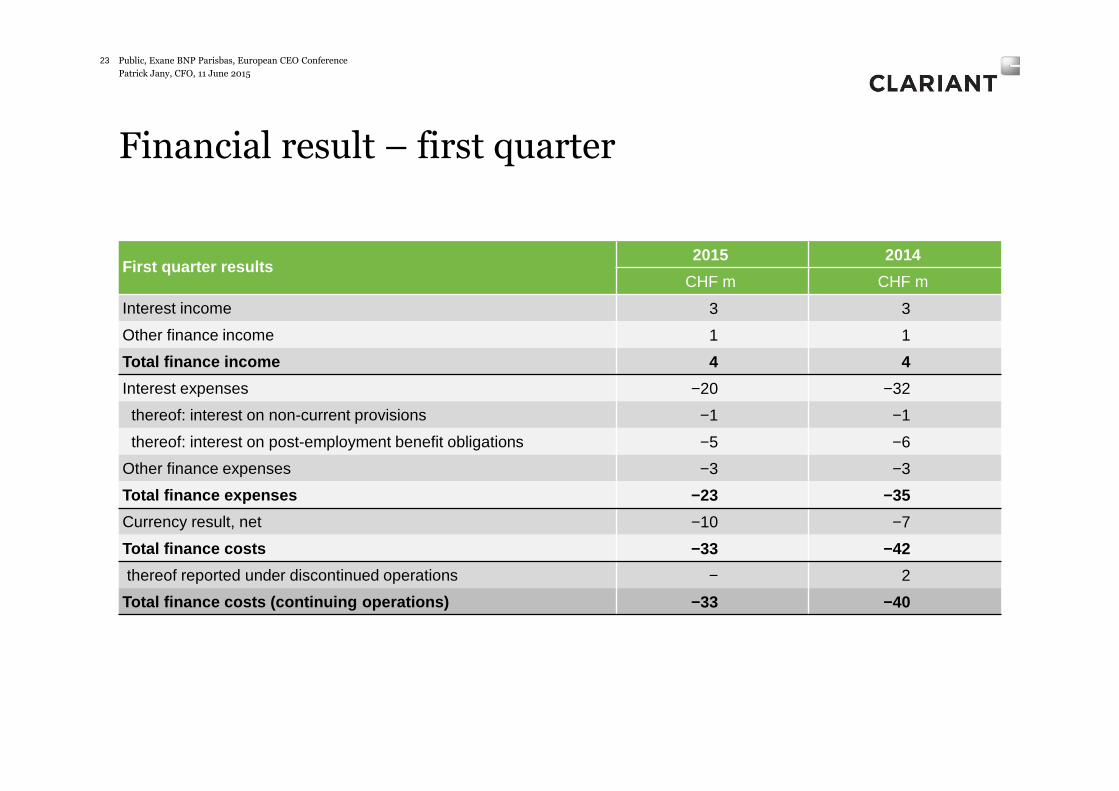
Financial result – first quarter
Public, Exane BNP Parisbas, European CEO Conference23
First quarter results2015 2014
CHF m CHF m
Interest income 3 3
Other finance income 1 1
Total finance income 4 4
Interest expenses −20 −32
thereof: interest on non-current provisions −1 −1
thereof: interest on post-employment benefit obligations −5 −6
Other finance expenses −3 −3
Total finance expenses −23 −35
Currency result, net −10 −7
Total finance costs −33 −42
thereof reported under discontinued operations − 2
Total finance costs (continuing operations) −33 −40

Patrick Jany, CFO, 11 June 2015
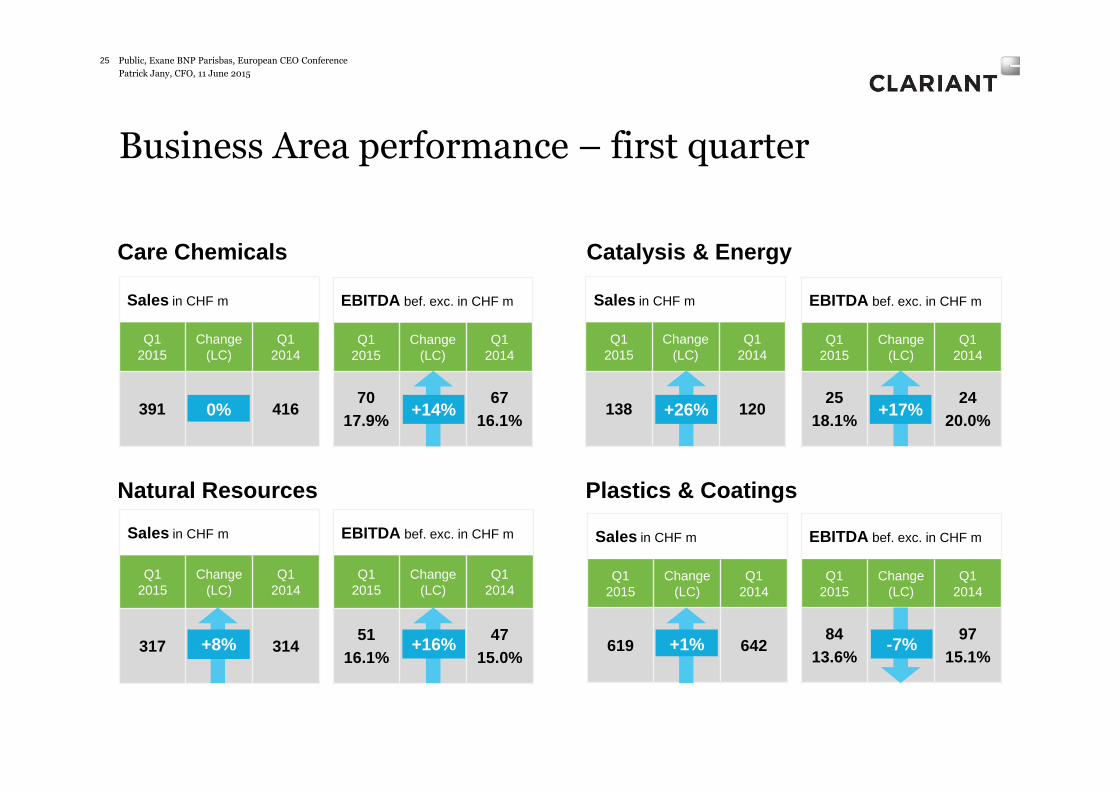
Sales and EBITDA margins by Business Area –first quarter
Public, Exane BNP Parisbas, European CEO Conference24
First quarter resultsBusiness Area:
Sales EBITDA* EBITDA margin*
CHF m % LC % of total BA Q1/15 Q1/14
Care Chemicals 391 0 30 17.9 16.1
Catalysis & Energy 138 26 11 18.1 20.0
Natural Resources 317 8 22 16.1 15.0
Plastics & Coatings 619 1 37 13.6 15.1
Total continuing 1 465 4 100 14.1 14.1
EBITDA*Sales in % of Group
Care Chemicals
27%
Catalysis & Energy
9%
Natural Resources
22%
Plastics & Coatings
42%
Care Chemicals
30%
Catalysis & Energy
11%Natural
Resources22%
Plastics & Coatings
37%
* Before exceptional items
Patrick Jany, CFO, 11 June 2015
Sales in CHF m
Q1 2015
Change (LC)
Q1 2014
138 120
Business Area performance – first quarter
Public, Exane BNP Parisbas, European CEO Conference25
Sales in CHF m
Q1 2015
Change (LC)
Q1 2014
391 416
Sales in CHF m
Q1 2015
Change (LC)
Q1 2014
317 314
EBITDA bef. exc. in CHF m
Q1 2015
Change (LC)
Q1 2014
7017.9%
6716.1%
EBITDA bef. exc. in CHF m
Q1 2015
Change (LC)
Q1 2014
5116.1%
4715.0%
Care Chemicals
Natural Resources
EBITDA bef. exc. in CHF m
Q1 2015
Change (LC)
Q1 2014
2518.1%
2420.0%
Catalysis & Energy
0%
Sales in CHF m
Q1 2015
Change (LC)
Q1 2014
619 642
EBITDA bef. exc. in CHF m
Q1 2015
Change (LC)
Q1 2014
8413.6%
9715.1%
Plastics & Coatings
+14%
+8% +16%
+17%
-7%
+26%
+1%

Patrick Jany, CFO, 11 June 2015
LC sales growth EBITDA* margin
Care Chemicals• Underlying sales growth of 4% in local currencies, reported sales
lower due to pruning of exposure to low-margin products
• Good growth in Personal Care, Crop Solutions and Aviation (incl. Aerochem acquisition)
• EBITDA* margin improved significantly due to a positive mix-effect, with higher contributions from Personal Care, Crop Solutions and Aviation overcompensating for negative inventory devaluation effect
0% 17.9%
Catalysis & Energy• Strong sales growth in all regions due to good underlying demand
and a shift of orders from Q2 into Q1
• EBITDA* margin decreased due to several one-time effects
• Catalysts business expects to achieve targeted profitability in 2015, with more evenly allocated EBITDA contribution
+26% 18.1%
Sales rose in Catalysis & Energy, mix-effect diluted Care Chemicals
Public, Exane BNP Parisbas, European CEO Conference26
* Before exceptional items
Patrick Jany, CFO, 11 June 2015
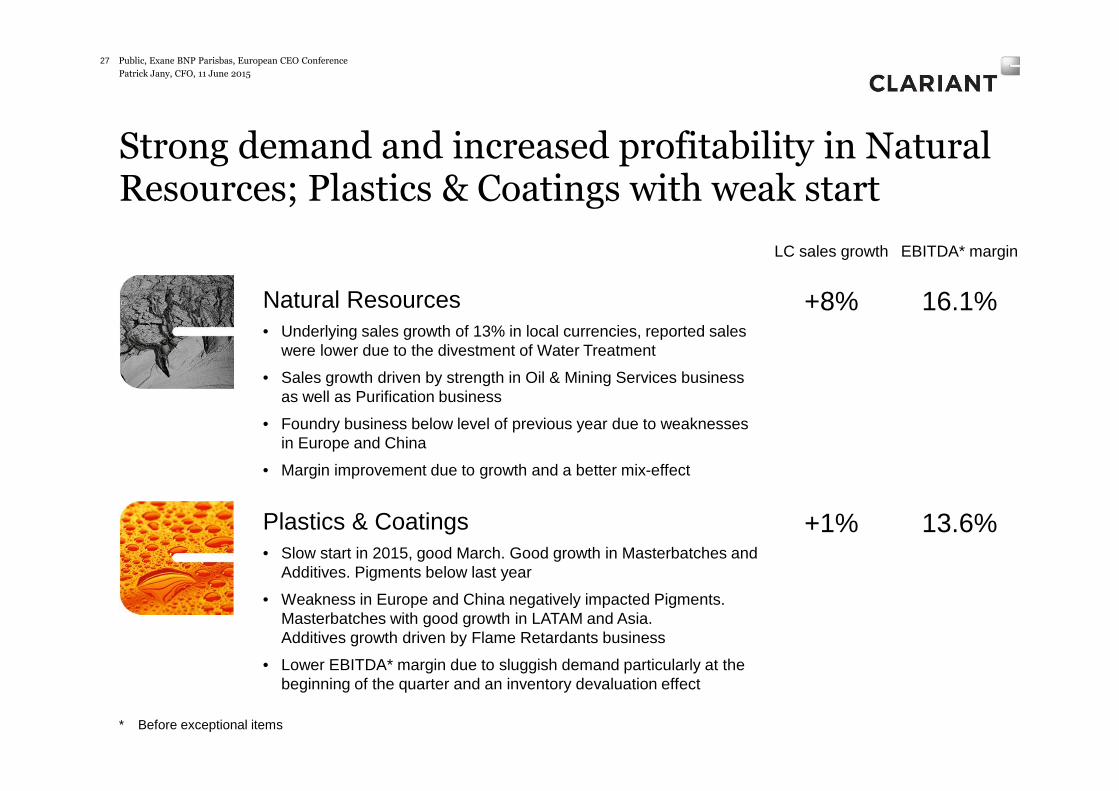
LC sales growth EBITDA* margin
Natural Resources• Underlying sales growth of 13% in local currencies, reported sales
were lower due to the divestment of Water Treatment
• Sales growth driven by strength in Oil & Mining Services business as well as Purification business
• Foundry business below level of previous year due to weaknesses in Europe and China
• Margin improvement due to growth and a better mix-effect
+8% 16.1%
Plastics & Coatings• Slow start in 2015, good March. Good growth in Masterbatches and
Additives. Pigments below last year
• Weakness in Europe and China negatively impacted Pigments. Masterbatches with good growth in LATAM and Asia. Additives growth driven by Flame Retardants business
• Lower EBITDA* margin due to sluggish demand particularly at the beginning of the quarter and an inventory devaluation effect
+1% 13.6%
Strong demand and increased profitability in Natural Resources; Plastics & Coatings with weak start
Public, Exane BNP Parisbas, European CEO Conference27
* Before exceptional items
Patrick Jany, CFO, 11 June 2015
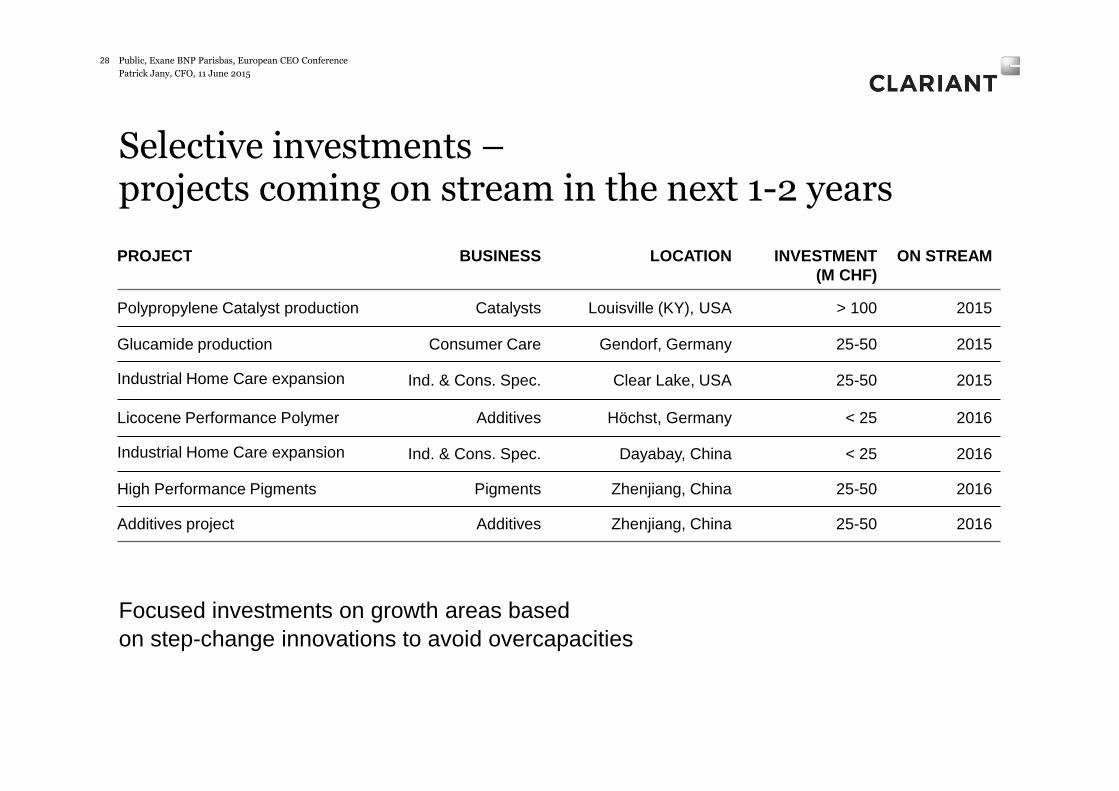
Selective investments –projects coming on stream in the next 1-2 years
Focused investments on growth areas based on step-change innovations to avoid overcapacities
Public, Exane BNP Parisbas, European CEO Conference28
PROJECT BUSINESS LOCATION INVESTMENT (M CHF)
ON STREAM
Polypropylene Catalyst production Catalysts Louisville (KY), USA > 100 2015
Glucamide production Consumer Care Gendorf, Germany 25-50 2015
Industrial Home Care expansion Ind. & Cons. Spec. Clear Lake, USA 25-50 2015
Licocene Performance Polymer Additives Höchst, Germany < 25 2016
Industrial Home Care expansion Ind. & Cons. Spec. Dayabay, China < 25 2016
High Performance Pigments Pigments Zhenjiang, China 25-50 2016
Additives project Additives Zhenjiang, China 25-50 2016
Patrick Jany, CFO, 11 June 2015
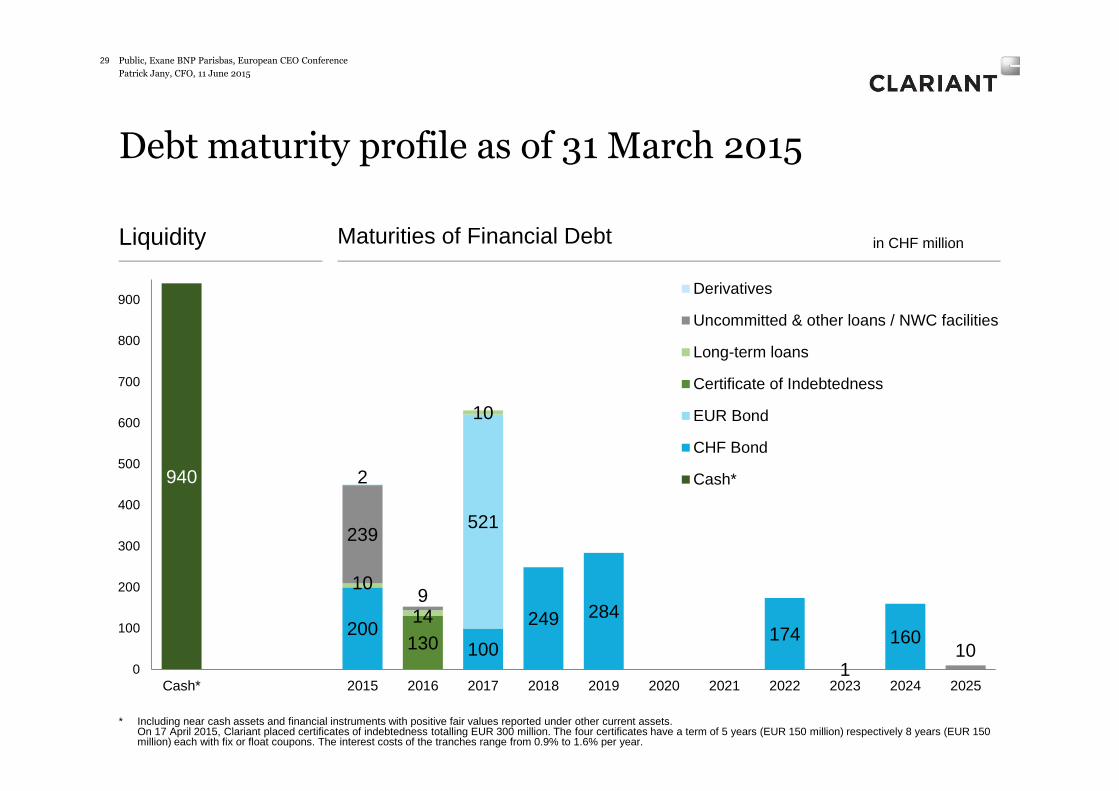
Debt maturity profile as of 31 March 2015
Public, Exane BNP Parisbas, European CEO Conference29
Liquidity
940
200100
249 284174 160
521
130
10
14
10
239
9
110
2
0
100
200
300
400
500
600
700
800
900
Cash* 2015 2016 2017 2018 2019 2020 2021 2022 2023 2024 2025
Derivatives
Uncommitted & other loans / NWC facilities
Long-term loans
Certificate of Indebtedness
EUR Bond
CHF Bond
Cash*
Maturities of Financial Debt in CHF million
* Including near cash assets and financial instruments with positive fair values reported under other current assets.On 17 April 2015, Clariant placed certificates of indebtedness totalling EUR 300 million. The four certificates have a term of 5 years (EUR 150 million) respectively 8 years (EUR 150 million) each with fix or float coupons. The interest costs of the tranches range from 0.9% to 1.6% per year.

Patrick Jany, CFO, 11 June 2015
Appreciation of Swiss franc basically a translation impact as transactional effects are fairly neutral
TRANSACTIONAL IMPACT OF CURRENCIES– Since 2011 Swiss franc cost base reduced by more
than 50% through to 4% of cost ~ CHF 250 million– Favorable effect of European manufacturing base– Remnant risk through volatile emerging market
currencies
NATURAL HEDGE FURTHER IMPROVED– 54% of investments in emerging markets and North
America to further improve the natural hedge, i.e: Polypropylene Catalyst facility in USA, Industrial Home Care expansion, USA. Bolt-on acquisitions in Asia etc.
30 Public, Exane BNP Parisbas, European CEO Conference
Patrick Jany, CFO, 11 June 2015
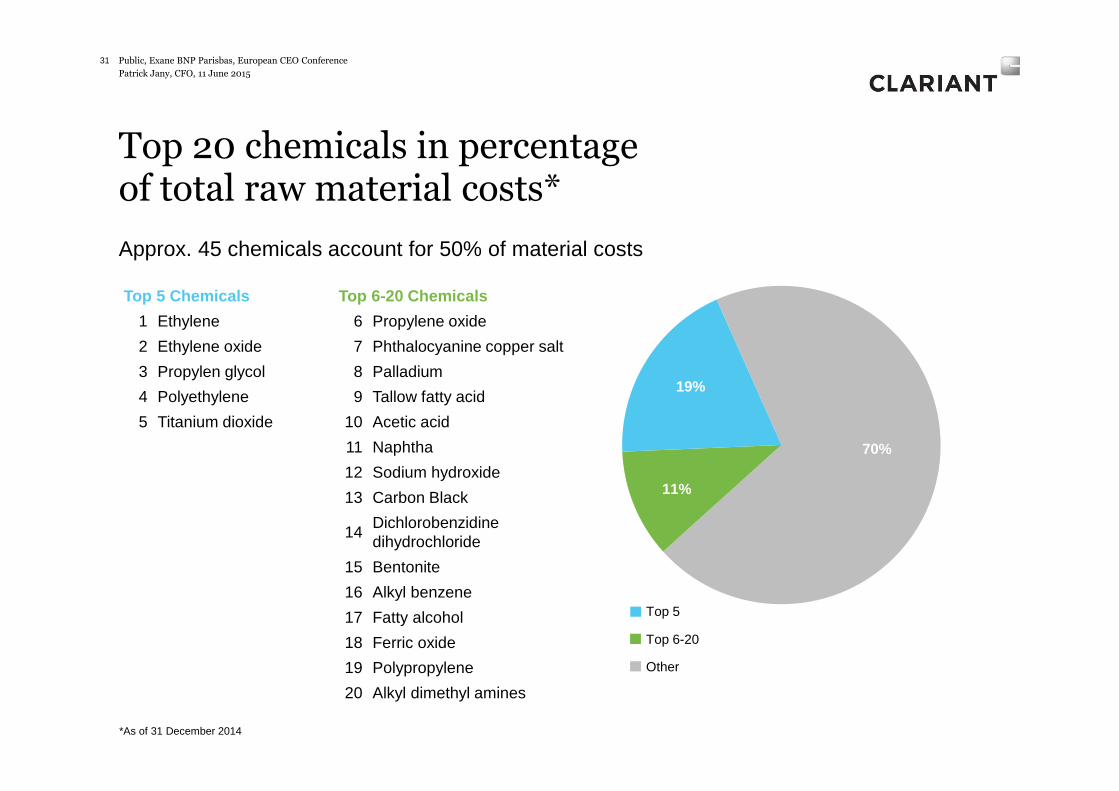
70%
11%
19%
31 Public, Exane BNP Parisbas, European CEO Conference
Top 20 chemicals in percentage of total raw material costs*
Top 5 Chemicals
1 Ethylene
2 Ethylene oxide
3 Propylen glycol
4 Polyethylene
5 Titanium dioxide
Approx. 45 chemicals account for 50% of material costs
Top 6-20
Top 5
Other
*As of 31 December 2014
Top 6-20 Chemicals
6 Propylene oxide
7 Phthalocyanine copper salt
8 Palladium
9 Tallow fatty acid
10 Acetic acid
11 Naphtha
12 Sodium hydroxide
13 Carbon Black
14Dichlorobenzidinedihydrochloride
15 Bentonite
16 Alkyl benzene
17 Fatty alcohol
18 Ferric oxide
19 Polypropylene
20 Alkyl dimethyl amines
Patrick Jany, CFO, 11 June 2015
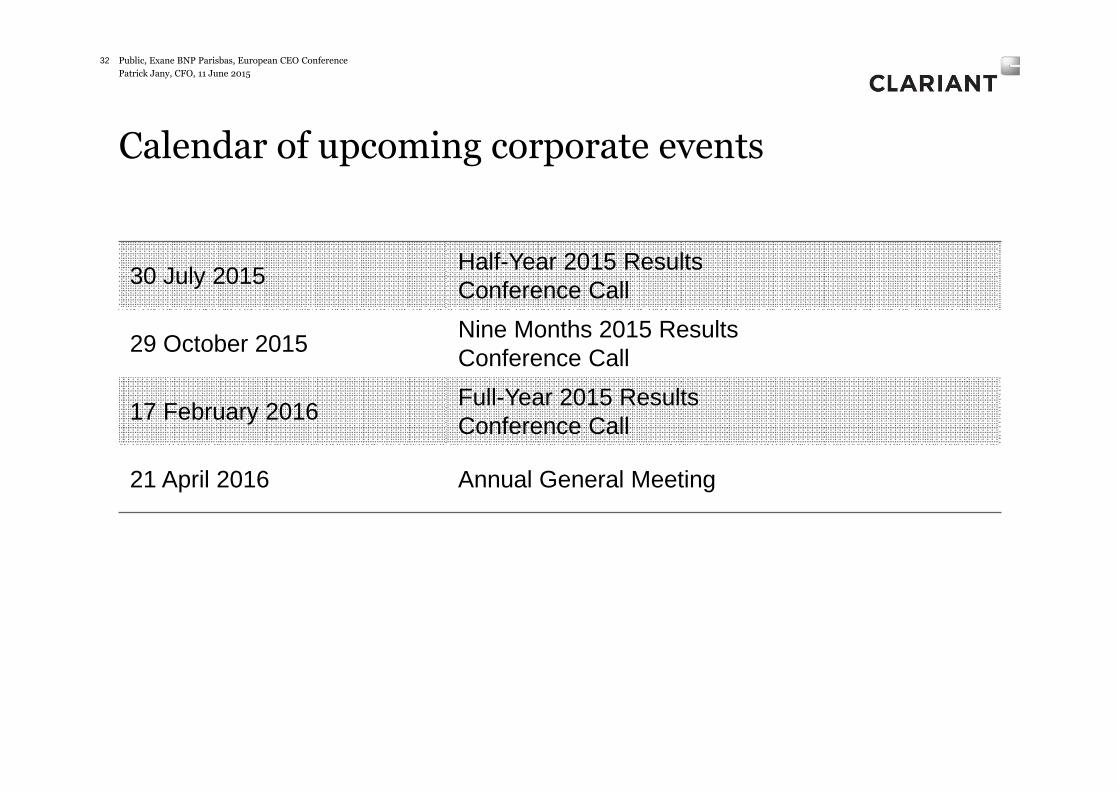
Calendar of upcoming corporate events
30 July 2015Half-Year 2015 ResultsConference Call
29 October 2015Nine Months 2015 ResultsConference Call
17 February 2016Full-Year 2015 ResultsConference Call
21 April 2016 Annual General Meeting
32 Public, Exane BNP Parisbas, European CEO Conference
Patrick Jany, CFO, 11 June 2015
IR contacts
33
Dr. Siegfried SchwirzerSenior Investor Relations Officer
Phone +41 61 469 67 49Mobile +41 79 718 45 98 E-mail [email protected]
Marco FerraroInvestor Relations Officer
Phone +41 61 469 64 11Mobile +41 79 931 03 98E-mail [email protected]
Edith Schwab
Phone +41 61 469 67 48E-mail [email protected]
Mirjam Grieder
Phone +41 61 469 67 66E-mail [email protected]
Public, Exane BNP Parisbas, European CEO Conference

Patrick Jany, CFO, 11 June 2015
iPad App: www.clariant.com/IRapp
Our Publications
Public, Exane BNP Parisbas, European CEO Conference34
Factbook: www.clariant.com/factbook

Patrick Jany, CFO, 11 June 2015
This presentation contains certain statements that are neither reported financial results nor other historical information. This presentation also includes forward-looking statements.
Because these forward-looking statements are subject to risks and uncertainties, actual future results may differ materially from those expressed in or implied by the statements. Many of these risks and uncertainties relate to factors that are beyond Clariant’s ability to control or estimate precisely, such as future market conditions, currency fluctuations, the behavior of other market participants, the actions of governmental regulators and other risk factors such as: the timing and strength of new product offerings; pricing strategies of competitors; the Company's ability to continue to receive adequate products from its vendors on acceptable terms, or at all, and to continue to obtain sufficient financing to meet its liquidity needs; and changes in the political, social and regulatory framework in which the Company operates or in economic or technological trends or conditions, including currency fluctuations, inflation and consumer confidence, on a global, regional or national basis.
Readers are cautioned not to place undue reliance on these forward-looking statements, which speak only as of the date of this document. Clariant does not undertake any obligation to publicly release any revisions to these forward-looking statements to reflect events or circumstances after the date of these materials.
35
Disclaimer
Public, Exane BNP Parisbas, European CEO Conference