Embed Size (px)
Citation preview

Golkonda, Jyothi
Gowda, Ramesh
Moore, Charles
Roberts, Glen
May 27, 2012

Community Hospital of Chicago (CHC)
Background
CHC is a non-profit organization located in suburbs of
Chicago for the last three decades.
CHC is a 500-bed facility with only one location
CHC is a Level 1 Trauma Center recognized for clinical
excellence with more than 25 specialties
2

Annual revenue is $400 million
3000 employees 350 Administrative
500 Physicians
1000 Registered Nurses
400 Technicians
150 Information Technology
600 Other Services
Utilization(yearly) Inpatient Admissions: 40,000
Outpatient visits: 500,000
Emergency room visits: 50,000
Births: 5,000
Inpatient surgeries: 4,500
CHC – Key Statistics
3

Has a Dashboard which is limited to MU quality measures.
Clinical focused.
Limited view, no drill-down capability.
Doesn’t address all of IOM aims
Current Dashboard Capabilities
4

Disparate and disjointed data silos across hospital departments.
Need for 360-degree snapshot of the hospital performance for the
management strategic decisions.
Delay in performance reports due to delay due to integration issues.
Planning and Tracking for improved productivity and efficiency
Visibility and Forecasts to prevent revenue leakage and improve the
revenue cycle
Benefits across the value chain for improved patient satisfaction, better
profit margins and higher return on investments.
P4P program bonuses - ACO and Value-based purchasing
Employee empowerment
Reasons for the Comprehensive Dashboard
5
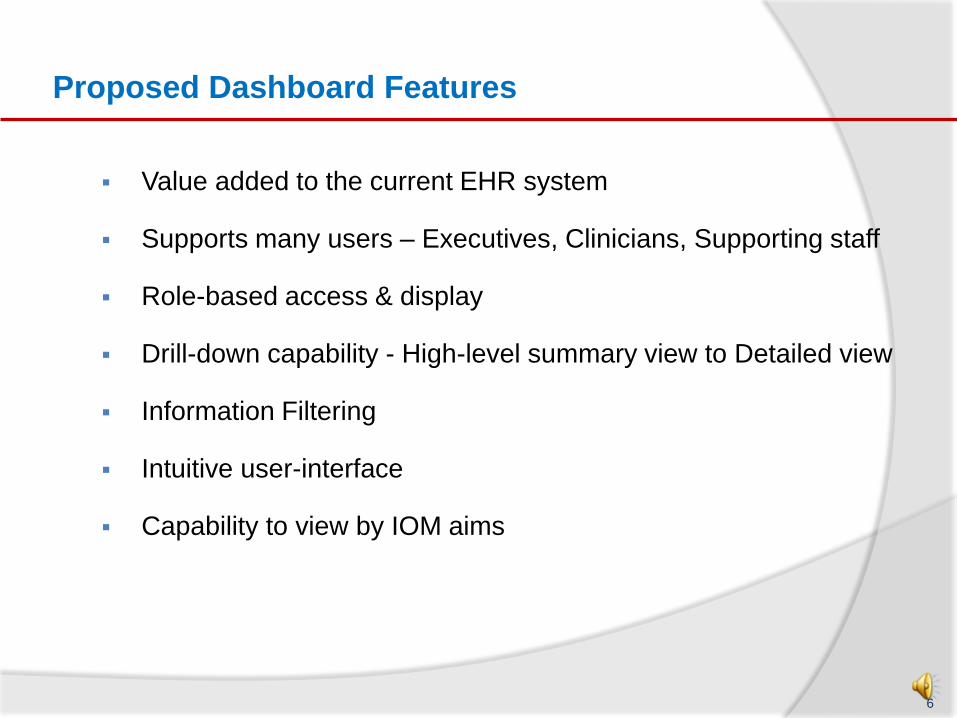
Value added to the current EHR system
Supports many users – Executives, Clinicians, Supporting staff
Role-based access & display
Drill-down capability - High-level summary view to Detailed view
Information Filtering
Intuitive user-interface
Capability to view by IOM aims
Proposed Dashboard Features
6

Assess IOM aims with respect to clinical quality, patient
experience and outcomes
While all financial and risk management elements are important,
key on facilities/equipment/IT and employee costs as they
represent the majority of operating costs
Be the brand in the market that is patient-centered and “bed-
ready” while preparing for a value-based purchasing
environment
All dashboard elements tie back to the overall execution of
mission
COO - Dashboard Element Focus
7

Allow for assessment of information beyond EMR dashboard
Monitor tangible best practices elements to include Lean, Six
Sigma (if applicable,) stated project management goals and input
from the Chief Medical Quality and Information Technology
Officers, as well as financial and risk departments
Coordination/Continuity of Care: IOM measures monitored and
achieved throughout the patient experience
Compare leading indicators and outcomes data to percentile
rankings relative to peers, quality and patient satisfaction –
HCAHPS Survey
Make decisions based on relational databases that include
interactive data extracted from real-time sources
Empower COO to transition from a tactical role of managing day-
to-day to a more strategic thinker with a strategic vision
COO - Operational perspective of dashboard
8

Some measures that may be considered are:
Payer mix trend changes segregated by payer
Bed turnover and availability data
Charge capture efficiency/accuracy
FTEs to adjusted occupied beds over rolling periods
Procedure cost comparisons versus other local hospitals,
full-service
Outpatient facilities and specialists
In-patient vs. out patient revenue volume
COO - Operations Measures
9
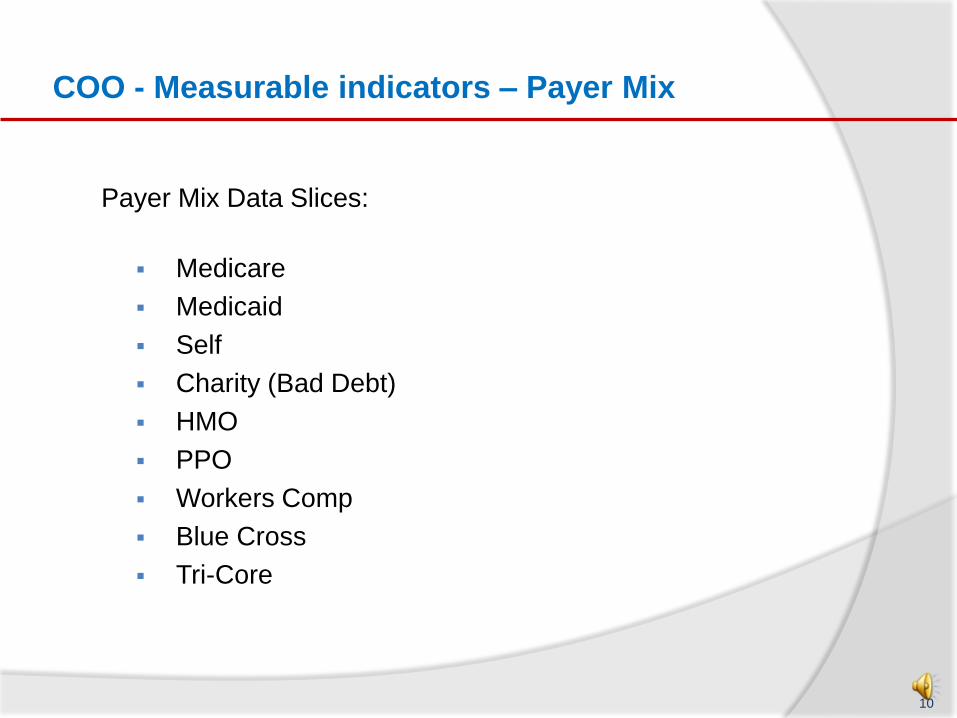
Payer Mix Data Slices:
Medicare
Medicaid
Self
Charity (Bad Debt)
HMO
PPO
Workers Comp
Blue Cross
Tri-Core
COO - Measurable indicators – Payer Mix
10

COO – Dashboard Example
11
Bed Occupancy
Avg. LOS
Compliance
85%
75%
Clinical
Safety
Staff Optimization
Avg. Patient Waits
85%
90%
20 min
Operations
Cost Per Bed
Revenue Per Bed
On-time Reimb.
$3,000
$2,500
75%
Financials
Joe Smith, COO May 27, 2012 CHC Hospital Dashboard – COO View
All Units Month Q1 2012 Yearly
00
0
2
1
3
4
5
Jan ‘12 Feb‘12 Mar‘12
Hospital Target
Average Length of Stay (LOS) in
Days
GO
Alerts
Cardiology Gross
New CMS guidelines
Drill down
For Daily
LOS Print
Reports
3.1

COO - Measurable indicators – ED Admissions
12

The executive team can quickly assess performance and track
progress for mission-critical benchmarks.
Clinical staff (care management team, physicians and nurses)
can monitor clinical performance in real-time.
Quality directors can turn to one source to isolate and monitor
all quality initiatives, respond to AHRQ PSI opportunities.
A consistent source of critical, empirical, and evidence-based
insight that connects the quality of care to patient safety and
satisfaction.
Resources – effective resource utilization, utilization rates
Capital management – assets maintenance and replacement,
age, type and cost of assets in use and those requiring upgrade
Risk management – legal or ethical issues, % of staff engaged
in continuing education efforts
CMO – Clinical Perspective
13

IOM aims - focus on critical measures to meet organization’s mission and quality goals set in tandem with the IOM aims
Prioritize focus area - comparison of organization against self and among peers.
Measures the organization’s progress toward its targets, consider raw accounts of critical incidents and frequency of use of assets and resources.
Drill-down and roll up capabilities
Snapshot of the clinical performance at hospital level or at unit level.
CMO – Dashboard Element Focus
14

CMO – Dashboard Example
15
Dr. James, CMO May 27, 2012 Clinical Performance
All Units Month Quarter 2012
00
0
20
10
30
40
50
Jan ‘12 Feb‘12 Mar‘12
Hospital Target
Number of Falls (expressed in 1000 patient days)
GO
Alerts
Fall rate decreased
New CMS guidelines
April ‘12
Drill
down
By
Location
Reports
Stage 2 or higher PU
Patient Falls
AMI
19
xx
xx
Acute Stroke Mgt . xx
Influenza Imm. Medicine Recon. xx
Patient Education xx
Cancer Diag. Pain xx
Result of Fall
Reasons for Fall
Location of Fall
xx

CMO – Dashboard Example – Drill-down
16
Stage 2 or higher PU
Patient Falls
AMI
19
xx
xx
Dr. James, CMO May 27, 2012 Clinical Performance – Patient Fall
All Units Month Quarter 2012 GO
Alerts
Fall rate decreased
New CMS guidelines
Acute Stroke Mgt. xx
Influenza Imm. xx Medicine Recon. xx
Patient Education xx
Cancer Diag. Pain xx
Result of Fall
Reasons for Fall
Reports

High Level Architecture
EMR Lab Radiology Pharmacy Claims
Reimbursement Operations Financial
ETL (extract Transform & Load), Business Rules, Mapping Layer
Clinical Analytics Operational Analytics Financial Analytics
Role based, Security Layer
17

Role based will be enforced upon user login (single sign-on)
Privacy & Security will be HIPAA compliant
Dashboards can be accessed securely on desktop as well as mobile devices (smart phone, tablets)
Role based implementation
18

Development:
Requirements from stakeholders
Risk & impact analyses
Evaluate in-house or COTS with customized solution
Scalable & Flexible architecture
Customizable
4 months for development & 1 month testing
Implementation:
Phase implementation by units and selected users
Training - in-person and through short videos of screen shots
Technical help will be provided through our current tech support team
Development & Implementation Strategy
19

Human Resources: 1 project manager
1 database architect
2 database resources including DBAs and Database engineers
2 ETL programmers
2 BI/dashboard developers
2 Validation and Verification resources
1 Technical writer for all necessary documentation
Hardware & Software Resources: Servers, Database Management System and Business Intelligence Tool
Financial Resources: Total project costs are estimated at $700,000 for development and
implementation & training
Recurring annual costs will be approximately $200,000
Resource Required
20

Conclusion
Initial resource is about 6% and recurring annual cost is about 1.7% of the annual IT budget of $12M.
Return on the investment (ROI) can be realized within 2 years.
Stay ahead of the completion through VBP payouts, improved operational efficiency and improved patient satisfaction.
The current silo analytic solution cannot answer questions that span across various functions.
21

APPENDIX
22

Some measures that may be considered are:
Risk-adjusted % of patients who experienced a fall in past 30 days of hospitalization
Risk-adjusted % of patients who had a new stage 2 or higher pressure ulcer since their admission to the organization
Acute myocardial infarction (AMI): % of patients with an AMI requiring thrombolysis who receive thrombolytic therapy within 1 hour of presentation to the emergency department, as their primary treatment, during the 6 month time period.
Acute stroke management: % of inpatients with a diagnosis of ischaemic stroke receiving aspirin within 48 hours of presentation to hospital.
Influenza immunization: % of patients 50 years or older who received the flu vaccine during the flu season
CMO – Dashboard Clinical Measures
23

Medication reconciliation - % of patients whose medication list
from admittance to discharge, including interaction, allergy, and
duplication checking is reconciled by pharmacy.
Patient education - % of patients who receive written
information about their immediate condition and treatment
% of patients who receive written follow-up care, and
information about continuing health concerns.
Pain
% of visits for patients with a diagnosis of cancer currently
receiving intravenous chemotherapy or radiation therapy who
report having pain with a documented plan of care to address
pain
CMO – Dashboard Clinical Measures – cont’d
24

Falls:
# of falls in past month in a specified department
# of falls resulting in Emergency Department (ED) visit
# of falls resulting in fracture
# of falls in a bathroom
# of falls associated with medications
Cardiology:
# of admissions diagnosed with AMI
# of these who received tPA within 1 hour of admission
# of who received other thrombolytic agents
# who did not receive thrombolytic agents
CMO – Dashboard Clinical Measures – Detail
25

Surgery:
% of patients undergoing cardiac surgery who received preoperative prophylactic antibiotics for the operation
% of patients who received appropriate Venous Thromboembolism (VTE) Prophylaxis within 24 hours prior to surgery to 24 hours after surgery end time
% of patients who undergo a needle biopsy to establish diagnosis of cancer preceding surgical excision/resection
% of surgery patients on beta blocker therapy prior to admission who received a beta blocker during the perioperative period
% of surgery patients with perioperative temperature management
CMO – Dashboard Clinical Measures – Detail
26