Embed Size (px)
Citation preview

Good ELISA PracticeManual
R-Biopharm – dedicated to food safety

2Good ELISA Practice – Manual

3
Disclaimer
The Good ELISA Practice (GEP) manual provides a comprehensive overview for both - beginners and advanced analysts - in order to improve the quality of performed ELISA analysis. It represents a guideline helping to establish reasonable framework conditions and conditions of use, which have to be complied with to achieve the best possible performance when using R-Biopharm ELISA test kits.
The GEP manual makes no claim to completeness, but describes only certain requirements. The compliance with such minimum standards does not guarantee the achievement of correct
analytical results, but serves to increase the quality of assessment at ELISA-analysis. The manual applies in addition to the respective detailed instructions of each test-kits. For the proper use of test-kits, the respective instruction manual is decisive and shall take priority over this GEP manual.
The GEP manual is continuously up-dated. Please make sure that this is the newest version of the manual prior to performing the ELISA-analysis. The manual can be retrieved, printed and downloaded from https://food.r-biopharm.com/technologies/elisa/
Introduction
The GEP manual provides a comprehensive overview for both beginners and advanced analysts in order to improve the quality of performed ELISA analysis.
The enzyme-linked immunosorbent assay (ELISA) is an antibody-based test method. This widespread technology is easy to use, sensitive, fast and reliable. Additionally, ELISA is robust and mostly used for quantitative analysis.
With more than 30 years of experience in developing ELISA test kits, R-Biopharm relies
on a well-established analytical method that meets the requirements of modern laboratories. RIDASCREEN® tests show a high sensitivity and are characterized by robustness. These test systems are used by food manufacturers to test raw materials or finished goods.
Furthermore, ELISA requires only basic lab equipment and is easy to use compared to HPLC and/or LC-MS/MS.
This manual is divided into three chapters, which follow the workflow of an ELISA based analysis:
Chapter 3:explaining the process of data evaluation from measurement to interpretation.
Chapter 2:describing the implementation of the analysis consisting of sample preparation and ELISA procedure.
Chapter 1:basic knowledge about the test principle, ELISA components and required laboratory equipment is given.
For any comments or feedback please contact your local distributor
4Good ELISA Practice – Manual
Content
ELISA Basics 6
1.1 Antibody – Antigen Detection 61.2 Analyte 61.3 ELISA Formats 6
1.3.1 Sandwich-ELISA 71.3.2 Competitive ELISA (formats) 8
1.4 ELISA components 81.4.1 Microtiter plate (MTP) 91.4.2 Conjugate and Substrate 91.4.3 Standards (Calibrator) 91.4.4 Buffers 91.4.5 Stop-solution 101.4.6 Additional components 10
1.5 Lab equipment and its maintenance 101.5.1 Pipettes 101.5.2 ELISA plate washer - automated systems 111.5.3 Microtiter plate (MTP) reader for ELISA 111.5.4 Automation 121.5.5 Additional equipment 121.5.6 General words of advice 12
1.6 Good laboratory practice (GLP) 131.7 Test kit labeling 13
Sample preparation and test implementation 14
2.1 Pipetting techniques 142.1.1 General pipetting instructions 142.1.2 Forward pipetting using lab pipettes 152.1.3 Reverse pipetting using lab pipettes 152.1.4 Pipetting of organic solvents 162.1.5 Good pipetting techniques to improve the pipetting performance 17
1
2

5
2.2 Handling of samples 182.2.1 Storage of samples 182.2.2 Sample drawing 182.2.3 Sample preparation 182.2.4 Use of frozen samples 192.2.5 Certified reference material 19
2.3 Preparation and handling of components 202.3.1 Storage of kits 202.3.2 First in – first out 202.3.3 Pre-Warming 212.3.4 Temperature control 212.3.5 Avoiding of contamination and sample mix-up 222.3.6 General test handling 232.3.7 Time management for pipetting 242.3.8 Correct washing 252.3.9 Storage of unused components for further experiments 262.3.10 Interchange of reagents between tests and batches 262.3.11 Security references 27
2.4 Stopping and measuring of the ELISA 272.5 Parallel performance of tests 28
Data evaluation and interpretation of results 29
3.1 Determination of unknown samples by standard curve 293.2 Standard curve fittings 293.3 Standard curves of sandwich and competitive ELISAs 303.4 Spectrophotometer and Software 313.5 Determination of analyte concentration 323.6 Measuring range and dilution factor 323.7 Units and dimensions 333.8 Limit of detection and quantification 333.9 Trueness and recovery 343.10 Specificity and cross reactivity 353.11 Interferences and matrix effects 36
3

6Good ELISA Practice – Manual
ELISA Basics
1.1 Antibody – Antigen Detection
Antibodies are proteins produced in plasma cells of vertebrates as part of the adaptive immune system against structures (antigens) which are recognized as foreign to the body.
Antibodies bind to their antigens by a distinct pattern of ionic and hydrophobic interactions, hydrogen bridge linkages and Van-der Waals forces. The interaction between antibody and its antigen is selective and highly specific, similar to a lock and key. The Enzyme Linked Immunosorbent Assay (ELISA) is based on this selective and specific antibody-antigen recognition. Many formats of qualitative or quantitative ELISA tests have been established, a selection of them are illustrated in the following chapters.
Performing an ELISA involves at least one specific antibody for a particular antigen. A main principle is that one of these immunological components is immobilized to a solid phase, the cavities of a microtiter plate. The analyte (antigen) from the sample interacts with the antibody-antigen system. This interaction can be visualized by enzymes, linked to secondary antibodies or antigens, and indicate if an antibody-antigen binding has occurred. An added substrate is converted by the coupled enzyme resulting in a change of color, which can be measured with a spectrophotometer.
1
1.2 Analyte
The claimed (antigen) analyte of an ELISA could be:
A defined chemical substance e.g. aflatoxin B1
A group of defined chemical substances e.g. aflatoxins B1, B2, G1 and G2
A specific protein e.g. staphyloenterotoxin A
A group of specific proteins e.g. staphyloenterotoxins A, B, C, D, and E
A more or less defined group of proteins from a food commodity e.g. caseins (as a part of milk proteins)
A food commodity e.g. peanut protein
1.3 ELISA Formats
Currently the following three different systems exist (see page 8 Figure 2-4). In each system, the result is measured on the basis of the optical density.
1
4
5
6
2
3
7
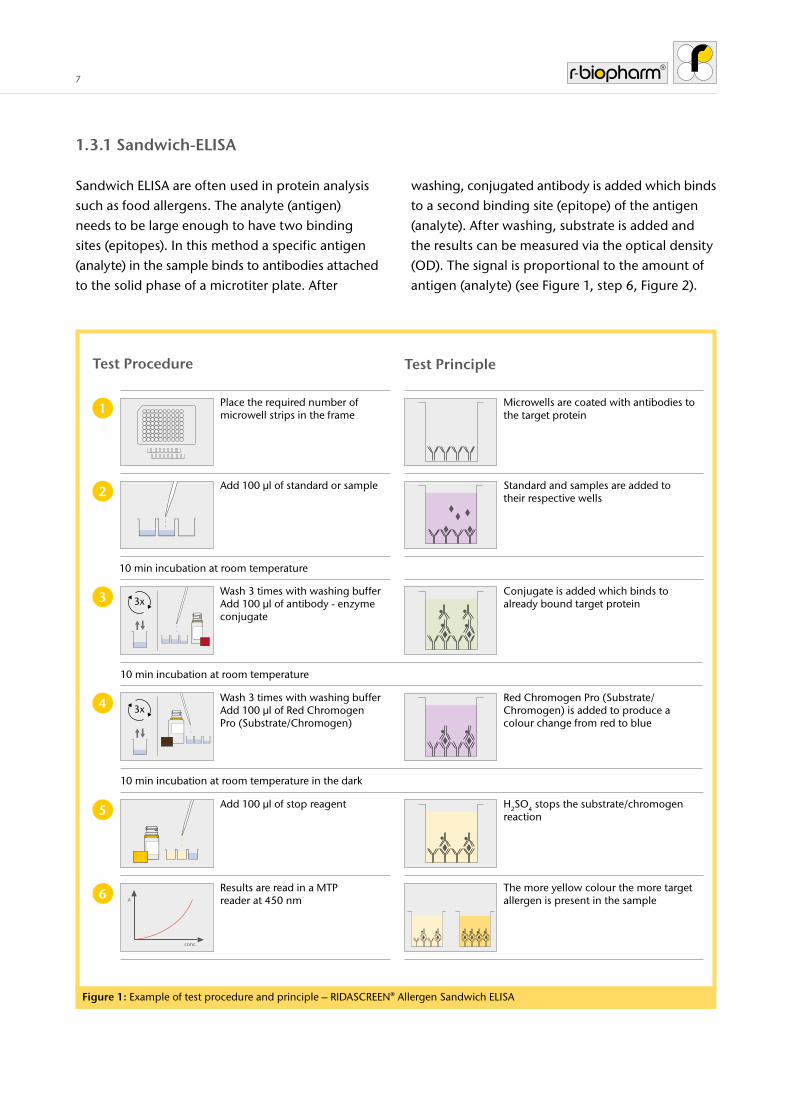
1.3.1 Sandwich-ELISA
Sandwich ELISA are often used in protein analysis such as food allergens. The analyte (antigen) needs to be large enough to have two binding sites (epitopes). In this method a specific antigen (analyte) in the sample binds to antibodies attached to the solid phase of a microtiter plate. After
washing, conjugated antibody is added which binds to a second binding site (epitope) of the antigen (analyte). After washing, substrate is added and the results can be measured via the optical density (OD). The signal is proportional to the amount of antigen (analyte) (see Figure 1, step 6, Figure 2).
10 min incubation at room temperature
10 min incubation at room temperature
10 min incubation at room temperature in the dark
Test Procedure Test Principle
Place the required number of microwell strips in the frame
Microwells are coated with antibodies to the target protein
Add 100 µl of standard or sample Standard and samples are added to their respective wells
Add 100 µl of stop reagent H2SO4 stops the substrate/chromogen reaction
Wash 3 times with washing bufferAdd 100 µl of Red Chromogen Pro (Substrate/Chromogen)
Red Chromogen Pro (Substrate/ Chromogen) is added to produce a colour change from red to blue
Wash 3 times with washing bufferAdd 100 µl of antibody - enzyme conjugate
Conjugate is added which binds to already bound target protein
Results are read in a MTP reader at 450 nm
The more yellow colour the more target allergen is present in the sample
Figure 1: Example of test procedure and principle – RIDASCREEN® Allergen Sandwich ELISA
1
4
5
6
2
3
A
conc.
3x
3x

8Good ELISA Practice – Manual
Figure 3: Schematic structure of competitive ELISA
Figure 2: Schematic structure of sandwich ELISA
Figure 4: Schematic structure of indirect competitive ELISA
1.3.2 Competitive ELISA (formats)
There are different formats for a competitive ELISA.
The competitive ELISA (Figure 3) consists of a microtiterplate where the antibody is bound to the surface of the well. The analyte from the sample and the enzyme-analyte conjugate are added to the well. The competition on antibody binding sites starts. After washing, substrate is added and the measured OD value is inversely proportional to the amount of analyte in the sample. The more analyte is present, the smaller the OD value. This
method is suitable to measure samples with just one epitope as well as small analytes such as mycotoxins or antibiotics.
The difference of the direct to the indirect competitive ELISA (Figure 4) is that an additional catcher antibody is bound to the microtiter plate.
There are also competitive ELISA in which the antigen is bound to the MTP well. This is the case for RIDASCREEN® Gliadin competitive (R7021).
1.4 ELISA components
Several components are needed for an ELISA test system: Microtiter plates (MTP), conjugate and substrate, standards (calibrators), buffers and stop-solution. Furthermore, it is essential to use controls to be sure that the test procedure is working correctly.
ESubstrate
AntigenSubstrate
SubstrateE
E

9
1.4.1 Microtiter plate (MTP)
The MTP (96 or 48 wells), is the basis for the analysis. In every well the antibody or antigen (depends on the format) is bound to the surface. A common plate material is polystyrene although other materials can be used. The material is activated by β- or γ-radiation by the manufacturer
of these plates. Without this activation no or only minor binding of antibodies or antigens occurs. In every well the antigen-antibody reaction and the conjugate-substrate reaction takes place. Lastly, the reaction is stopped with a specific stop-solution and the optical density is measured.
1.4.2 Conjugate and Substrate
Antibodies or analytes linked to an enzyme are called conjugates. The linked enzyme converts its specific substrate into a colored bluish product. The substrate is usually a hydrogen peroxide/
chromogenic mix which reacts with the conjugate enzyme. The result is a colored solution of which the optical density can be measured.
1.4.3 Standards (Calibrator)
All quantitative ELISA systems are calibrated by the use of standards. Therefore, the samples with unknown concentrations and a set of standards with known concentrations are analyzed in parallel on one plate. The result will be a calibration curve (with the associated mathematic formula) built out of the measured OD values and the concentrations of the standard (Figure 5). Based on this, the analyte concentration in the sample can be calculated. Figure 5: Calibration curve of a sandwich ELISA
Q U A L I T Y A S S U R A N C E C E R T I F I C A T E
RIDASCREEN GliadinArt. No.: R7001 Lot: 14383 Expiry: 2014-12
R-Biopharm AG, Darmstadt, Germany certifies that this batch has been approved by the QualityAssurance Department and conforms with specifications
0.0
0.2
0.4
0.6
0.8
1.0
1.2
1.4
1.6
1.8
2.0
2.2
2.4
5.00 10.00 20.00 40.00 80.00
Standard curve
Concentration (ppb)
Standards
Std. nConc.(ppb) mean
CV(%)
Std1 80.00 0.0589.3
Std2 85.00 0.2945.7
Std3 810.00 0.6354.2
Std4 820.00 1.0942.8
Std5 840.00 1.6832.2
Std6 880.00 2.3662.1
Absorbance
ExpiryLot No.Microwell plate 2014-1215043Standards 2015-0411353Conjugate 2015-0411353Buffer1 2015-0312173Substrate/Chromogen 2015-1015183Stop solution 2018-0415183Washing buffer 2015-1111243
Please note:
The absorbance for the standards may decrease during the shelf life of the kit. The general shape of thecurve will remain similar, while the slope might change slightly. Furthermore refer to product leaflet 8.Indication of instability or deterioration of reagents.
sign.: Edda Rohm Date: 2013-09-19Quality Assurance Representative
Remark: This document has been created electronically and is therefore valid without a signature.
www.r-biopharm.comThe R-Biopharm group is DIN EN ISO 9001 certified.
1.4.4 Buffers
All ELISA systems contain components of biological origin. For long term storage of these components and for proper function during the testing procedure, pH-value and ionic strength needs to be constant. Often the kind of buffer component
has also an influence on test kit performance. For the convenience of test kit users, these buffer are included ready-to-use or as concentrates. They are also used for sample preparation and washing procedures of the microtiter plates.
10Good ELISA Practice – Manual
1.4.5 Stop-solution
The stop-solution terminates the enzyme- conjugate-reaction. In most cases, sulphuric acid at low concentrations is used. By stopping the
reaction, the color will change from blue to yellow and will remain stable until measurement within 10 min.
1.4.6 Additional components
For most systems a positive and negative control is recommended, for example a spiking solution.
This gives the opportunity to control the test system.
1.5 Lab equipment and its maintenance
Depending on the requirements of the test system, various specialized laboratory equipment are needed for the different steps e.g. pipettes, equipment for plate washing, incubator for constant temperature, ELISA reader and a software
to calculate concentrations. However, not all of the equipment mentioned here is needed for all test systems. In every case, regular maintenance and calibration is required for machine and lab equipment which are used.
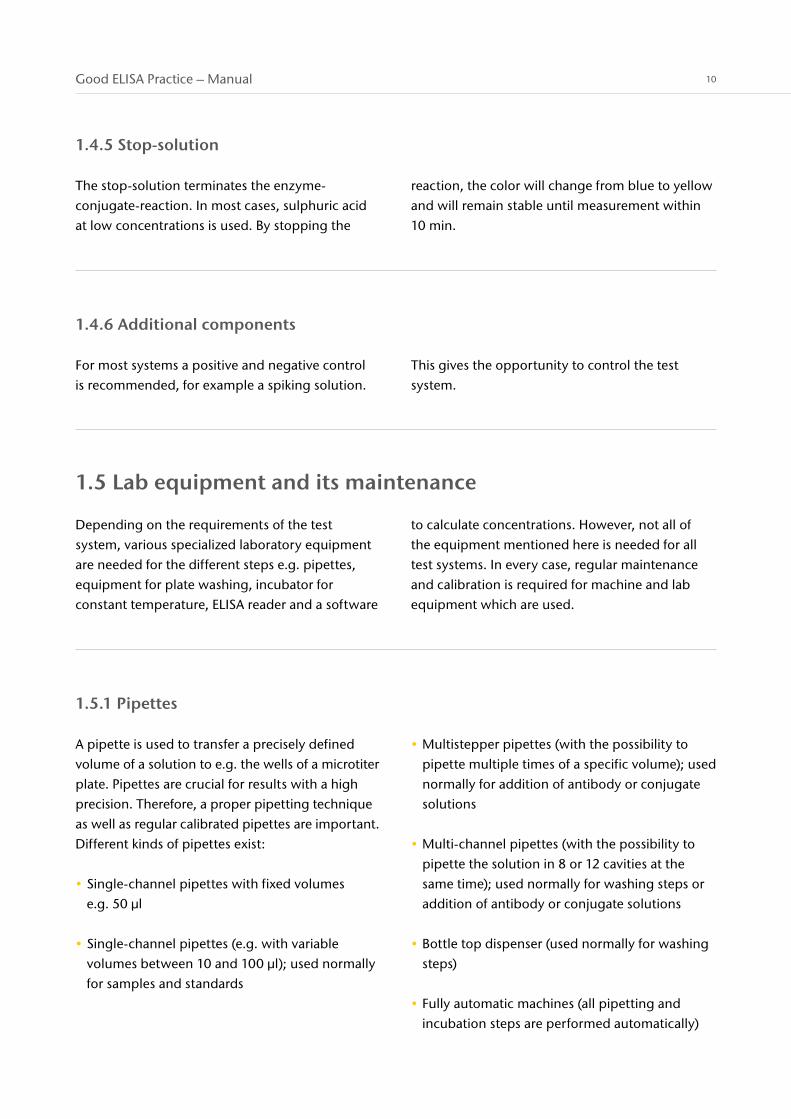
1.5.1 Pipettes
A pipette is used to transfer a precisely defined volume of a solution to e.g. the wells of a microtiter plate. Pipettes are crucial for results with a high precision. Therefore, a proper pipetting technique as well as regular calibrated pipettes are important. Different kinds of pipettes exist:
• Single-channel pipettes with fixed volumes e.g. 50 µl
• Single-channel pipettes (e.g. with variable volumes between 10 and 100 µl); used normally for samples and standards
• Multistepper pipettes (with the possibility to pipette multiple times of a specific volume); used normally for addition of antibody or conjugate solutions
• Multi-channel pipettes (with the possibility to pipette the solution in 8 or 12 cavities at the same time); used normally for washing steps or addition of antibody or conjugate solutions
• Bottle top dispenser (used normally for washing steps)
• Fully automatic machines (all pipetting and incubation steps are performed automatically)

11
1.5.2 ELISA plate washer - automated systems
After every incubation step (except the incubation with the substrate) the ELISA plate has to be washed with washing buffer. Washing is a crucial step when performing an ELISA to obtain results with high precision.
Washing can be done manually with an 8-channel pipette or an 8 channel manifold (see Figure 15).
Sometimes customers use automated ELISA plate washers. These washers are laboratory instruments
where users load a plate and select a program. The washers then dispense, soak and aspirate wash buffer from the plate in seconds. When using such instruments thorough cleaning of the washer is important to avoid cross contamination. Refer to the manufacturer’s instructions referring cleaning between different runs.
The washing procedure is an important step and has to be validated if deviated from the described product information.
Figure 6: RIDA®ABSORBANCE 96, Art. No. ZRA96FF
1.5.3 Microtiter plate (MTP) reader for ELISA
The ELISA reader is a spectrophotometer, which allows to measure the optical density (OD – The ‘OD’ is the amount of attenuation, or intensity lost, when light passes through an optical component. The term ‘absorption’ is also used). To calculate the concentration of a sample a calibration curve is used. Regular maintenance by experts is essential for exact results. The RIDA®ABSORBANCE 96 (Art. No. ZRA96FF) is ideal for the R-Biopharm test kits.

12Good ELISA Practice – Manual
1.5.4 Automation
One possibility for working with an ELISA is the use of an automated system which allows you to test your samples without any manual steps. Therefore, the automated system has to
be validated and calibrated for your test system. Examples for automation are the ThunderBolt® and Bolt™. For further information please contact: [email protected].
Figure 7: Bolt™, Art. No. ZBOLT Figure 8: ThunderBolt®, Art. No. ZTB
1.5.5 Additional equipment
In some tests, an incubator is required to guarantee a stable temperature during the test run. Sometimes, a seal or a protecting plate cover are necessary to prevent evaporation or contamination.
1.5.6 General words of advice
To ensure a high precision of the results, the equipment should be calibrated regularly. Please ask the manufacturer for the calibration interval and include this in quality control plans.
13
1.6 Good laboratory practice (GLP)
Dependent on the toxicities and contagiousness of the used materials, different levels of protective actions are necessary to guarantee health and safety of the user. However, basic protective clothing is already required to avoid contamination of the samples, which would lead to incorrect results. The following equipment is a minimum requirement for every lab:
However, it is necessary to study the Safety Data Sheets (SDSs) carefully for all chemicals substances used. The SDS contains information about the dangers when working with a particular substance, required protective measures, as well as required actions in case of emergencies. The SDS is available on request for each product. Please contact: [email protected].
• Lab coat • Gloves
• Eye protection • Fume hood (occasionally)
• Product name • Lot number
• Article number • Storage temperature
• Name of the component
• Concentration
1.7 Test kit labeling
To ensure the correct handling and storage of your components please read the Instructions for Use (IFU) or the test kit insert. On all components the follow information is stated (if applicable):
The expiry date is particularly important, as the specified behavior can only be guaranteed until then. After expiration the ingredients can degrade and the results can decrease in accuracy.
14Good ELISA Practice – Manual
Sample preparation and test implementation
2.1 Pipetting techniques
Accurate and precise pipetting is crucial in ELISA analytics, particularly at high sensitivity levels where a small mistake in pipetting can induce large differences in the final test results. Be consistent during pipetting and do not change the technique while pipetting an assay. Be prepared before starting pipetting e.g. put all standards in a row and arrange all samples in a consistent way to allow uniform pipetting. Ensure that enough pipette tips are prepared and a waste container is in place.
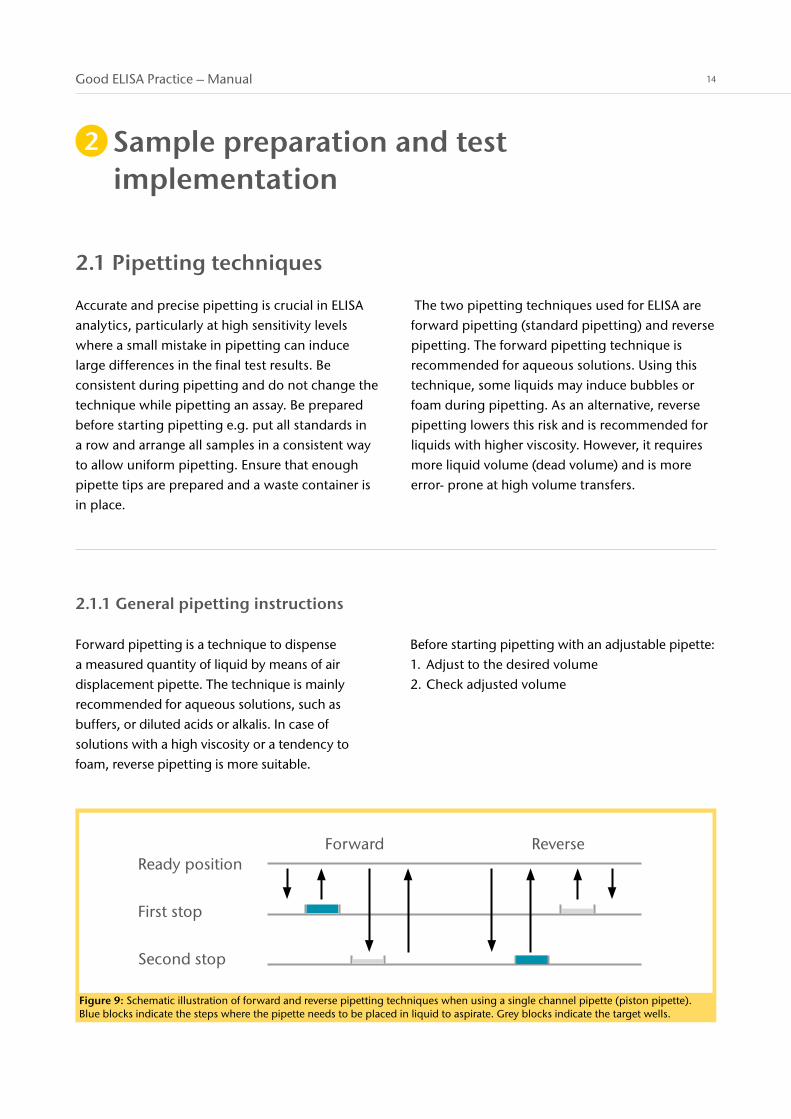
The two pipetting techniques used for ELISA are forward pipetting (standard pipetting) and reverse pipetting. The forward pipetting technique is recommended for aqueous solutions. Using this technique, some liquids may induce bubbles or foam during pipetting. As an alternative, reverse pipetting lowers this risk and is recommended for liquids with higher viscosity. However, it requires more liquid volume (dead volume) and is more error- prone at high volume transfers.
2
Figure 9: Schematic illustration of forward and reverse pipetting techniques when using a single channel pipette (piston pipette). Blue blocks indicate the steps where the pipette needs to be placed in liquid to aspirate. Grey blocks indicate the target wells.
Ready position
First stop
Second stop
Forward Reverse
2.1.1 General pipetting instructions
Forward pipetting is a technique to dispense a measured quantity of liquid by means of air displacement pipette. The technique is mainly recommended for aqueous solutions, such as buffers, or diluted acids or alkalis. In case of solutions with a high viscosity or a tendency to foam, reverse pipetting is more suitable.
Before starting pipetting with an adjustable pipette: 1. Adjust to the desired volume 2. Check adjusted volume

15
2.1.3 Reverse pipetting using lab pipettes
1 Put a new tip on your pipette and check for a firm fit.
1 Press the operation button to the second stop.
1 Immerse the pipette into the liquid. Slowly release the operating button to ready position and wait until the desired liquid volume has been aspirated. Ensure that not bubbles or foam occurs in the pipette.
1 Remove excessive liquid from the outside of the tip.
1 Dispense the liquid into the desired well by pressing the operation button to the first stop. Ensure that no liquid remains on the outside of the tip.
1 For repetitive liquid pipetting, press the operation button to the first stop and repeat steps 3 - 5.
1 Remove the tip to waste.
2.1.2 Forward pipetting using lab pipettes
1 Put a new tip on your pipette and check for a firm fit.
1 Press the operation button to the first stop.
1 Flush pipette tips before use. Pipette tips from some manufacturers need to be flushed before aspiration and dispensing of the appropriate liquid. Please check the according manual. In case of any doubt, flush the tip before pipetting.
1 Put the pipette tip approx. 1 cm deep into the liquid. Slowly release the operation button to the ready position and wait until the desired liquid volume has been aspirated. Ensure that no bubbles or foam occurs in the pipette.
1 Remove excessive liquid from the outside of the tip by touching the test tube with the tip.
1 Dispense the liquid into the desired well by pressing the operation button to the second stop.
1 Remove the tip to waste.
1 1
44
2 2
5
5
3 3
6
6
7
7
16Good ELISA Practice – Manual
2.1.4 Pipetting of organic solvents
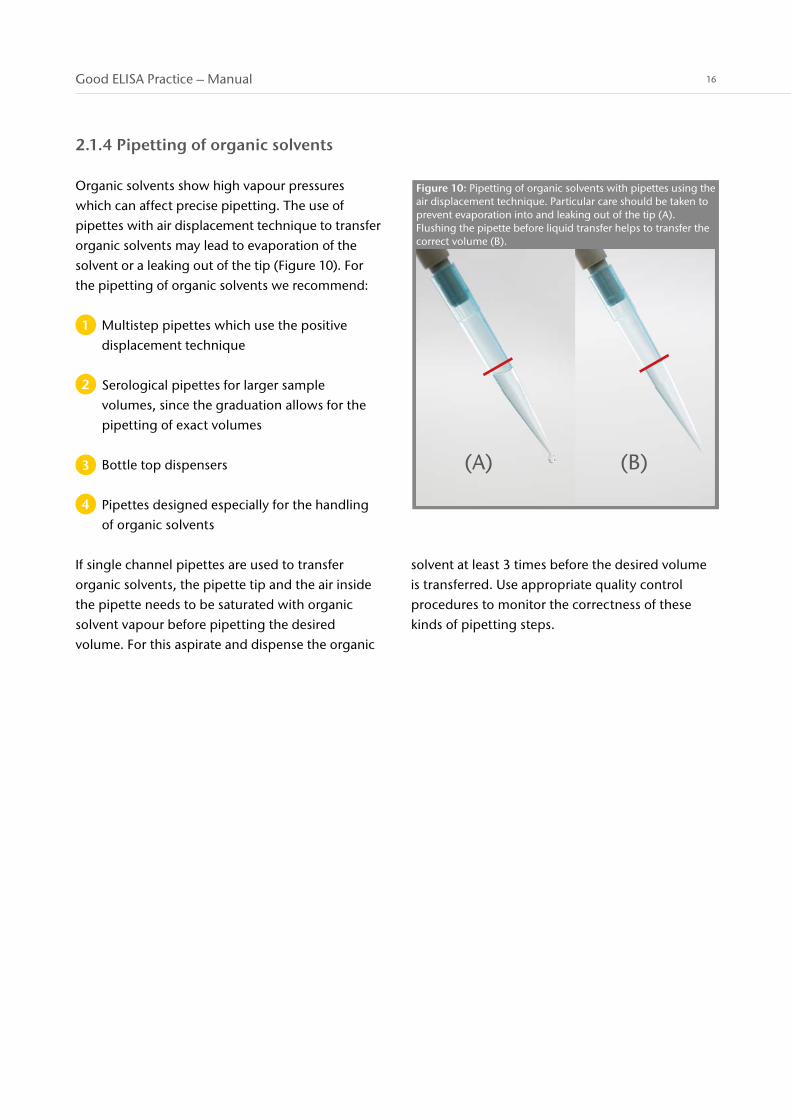
Organic solvents show high vapour pressures which can affect precise pipetting. The use of pipettes with air displacement technique to transfer organic solvents may lead to evaporation of the solvent or a leaking out of the tip (Figure 10). For the pipetting of organic solvents we recommend:
Multistep pipettes which use the positive displacement technique
Serological pipettes for larger sample volumes, since the graduation allows for the pipetting of exact volumes
Bottle top dispensers
Pipettes designed especially for the handling of organic solvents
Figure 10: Pipetting of organic solvents with pipettes using the air displacement technique. Particular care should be taken to prevent evaporation into and leaking out of the tip (A). Flushing the pipette before liquid transfer helps to transfer the correct volume (B).
(A) (B)
If single channel pipettes are used to transfer organic solvents, the pipette tip and the air inside the pipette needs to be saturated with organic solvent vapour before pipetting the desired volume. For this aspirate and dispense the organic
solvent at least 3 times before the desired volume is transferred. Use appropriate quality control procedures to monitor the correctness of these kinds of pipetting steps.
1
4
2
3

17
2.1.5 Good pipetting techniques to improve the pipetting performance
Immersion depth Only the top of the pipette tip is immersed into the standard or sample solution (see Figure 11 a). When immersing too deep, then too much liquid is aspirated. When the pipette tip is too close to the surface, then air can be aspirated.
Rhythm and speed A consistent pipetting rhythm helps to avoid jerky air aspiration (see Figure 11 b). Press the operating button and then slowly release the button. This avoids jerky air aspiration and liquid rocketing upwards contaminating the interior of the pipette.
Pre-rinsing Pre-rinsing equalizes the air temperature and pressure inside the tip with the temperature of the sample. During pre-rinsing the plunger is pressed and released 2 to 3 times (Figure 11 c).
Immersion angle Best is to hold the pipette close to vertical. Anything greater than 20 ° of vertical reduces accuracy of pipetting (see Figure 11 d)
Dispensing To release sample or standard solution hold the pipette tip close to the well wall (see Figure 11 e). Figure 11: Best practice pipetting
a
d e
c
a Only the top of the tip is immersed b A consistent pipetting helps to avoid jerky air aspirationc During pre-rinsing the plunger is pressed and released 2-3 timesd The pipette is hold close to vertical during pippetinge During releasing the top of the pipette is close to the well wall
<20 °
b
airbubble
Do not touch well wall

18Good ELISA Practice – Manual
2.2 Handling of samples
2.2.1 Storage of samples
Unwanted contamination of samples can influence test results significantly. If there are signs of unwanted contamination or spoilage do not use the sample and request a new one. Store the sample according to the test kit manufacturer or according to the best scientific knowledge.Generally, samples should be prepared and tested
immediately whenever possible. If storage cannot be avoided, check for optimal storage conditions and analyze them as soon as possible. All samples need to be correctly labelled and sealed to avoid evaporation or dry-out. Inappropriate storage conditions may influence later analysis and alter test results.
2.2.2 Sample drawing
The drawing of a representative sample is a crucial step. For some parameters, legislations apply on how to take a representative sample (e.g. mycotoxins). Please follow these rules precisely. If there are no rules, samples should
be homogenized as much as possible. Inform a customer beforehand about a minimum sample amount. State in the test report that the result refers to the sample as it was sent.
2.2.3 Sample preparation
For sample preparation please follow the instructions for use provided with the test kit. Sample preparation involves typically homogenisation and extraction of the analyte. Sample preparation involves typically homogenisation and extraction of the analyte. Changes or variations may lead to incorrect test results. Make sure to use only suitable and
maintained equipment for sample preparation. For any related questions please contact R-Biopharm.
Depending on the parameter to be tested, instructions for use may contain information on how prepared samples can be stored for later analysis. Please follow these instructions carefully or prepare samples directly before analysis.

19
2.2.4 Use of frozen samples
Before further use, samples must be completely thawed. Thawing of frozen samples should be performed at 4°C or at room temperature, dependent on analyte stability.
In case of unprepared, non-liquid samples check the instructions for use for further sample preparation and homogenization.
Liquid samples must be thoroughly mixed before they can be used for analysis. To achieve a homogeneous sample carefully vortex or invert the sample. Foam formation or intensive mixing
should be avoided since it may denature proteins. A further sample preparation of liquid samples (e.g. in case of milk) may be necessary before analysis. Please check the instructions for use for further information.
Depending on the sample, freezing and thawing can lead to crystallization or coagulation. Avoid freeze-thaw cycles wherever possible, since it can change sample integrity and alter test results. If possible, aliquot liquid samples before storage at -20 °C to avoid freeze-thaw cycles.
2.2.5 Certified reference material
Certified reference materials (CRM) are naturally contaminated, homogeneous matrices whose analyte content has been exactly and reliably determined (Figure 12). The regular use of CRMs is recommended for quality assurance to establish traceability. This allows checking the trueness and precision of experimental procedures and for the testing of handling skills. If no reference material is available, the use of control samples or matrices spiked with defined analyte concentrations are recommended.
Trilogy® Analytical Laboratory is one of the few producers of certified, naturally contaminated reference materials and certified mycotoxin standards. Additionally, naturally contaminated quality control materials and analytical standards for daily quality assurance are available.
Figure 12: R-Biopharm offers a wide range of CRMs for mycotoxin analysis
20Good ELISA Practice – Manual
2.3 Preparation and handling of components
2.3.1 Storage of kits
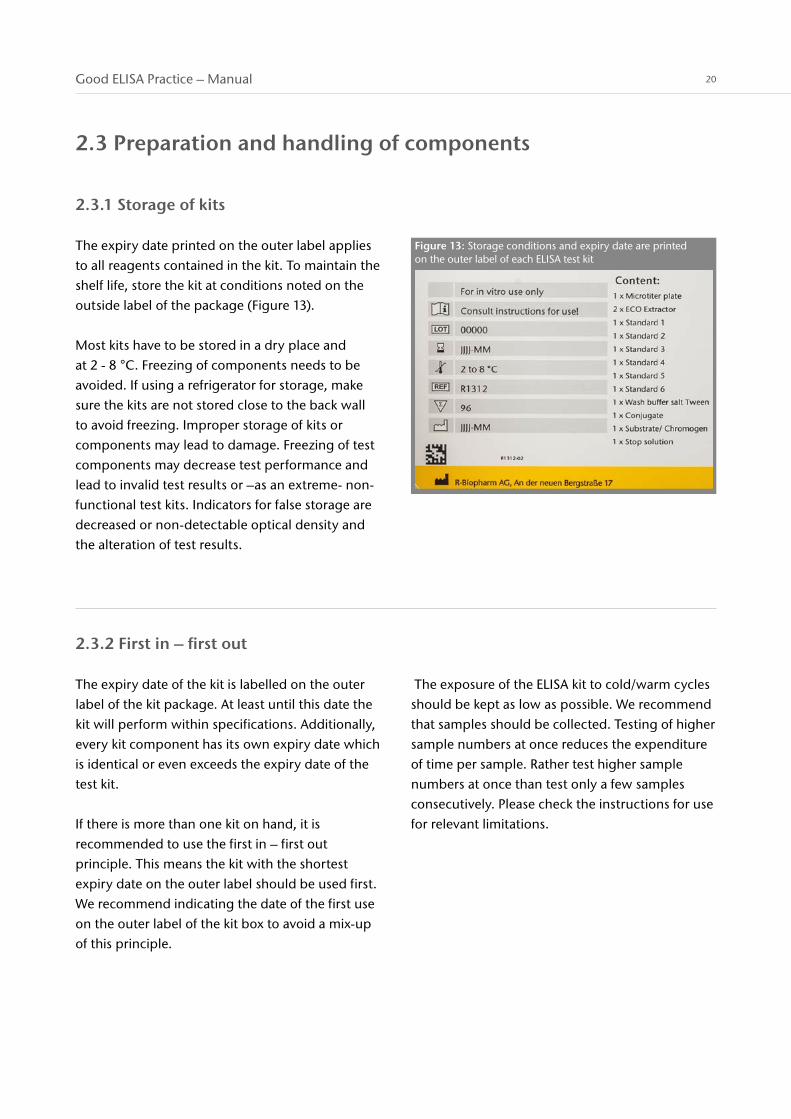
The expiry date printed on the outer label applies to all reagents contained in the kit. To maintain the shelf life, store the kit at conditions noted on the outside label of the package (Figure 13).
Most kits have to be stored in a dry place and at 2 - 8 °C. Freezing of components needs to be avoided. If using a refrigerator for storage, make sure the kits are not stored close to the back wall to avoid freezing. Improper storage of kits or components may lead to damage. Freezing of test components may decrease test performance and lead to invalid test results or –as an extreme- non-functional test kits. Indicators for false storage are decreased or non-detectable optical density and the alteration of test results.
2.3.2 First in – first out
The expiry date of the kit is labelled on the outer label of the kit package. At least until this date the kit will perform within specifications. Additionally, every kit component has its own expiry date which is identical or even exceeds the expiry date of the test kit.
If there is more than one kit on hand, it is recommended to use the first in – first out principle. This means the kit with the shortest expiry date on the outer label should be used first.We recommend indicating the date of the first use on the outer label of the kit box to avoid a mix-up of this principle.
The exposure of the ELISA kit to cold/warm cycles should be kept as low as possible. We recommend that samples should be collected. Testing of higher sample numbers at once reduces the expenditure of time per sample. Rather test higher sample numbers at once than test only a few samples consecutively. Please check the instructions for use for relevant limitations.
Figure 13: Storage conditions and expiry date are printed on the outer label of each ELISA test kit

21
2.3.3 Pre-Warming
All reagents need to be at room temperature before they can be used in the test. Take all components out of the kit package before use and allow them to reach room temperature (20 - 25 °C). Larger bottles and greater volumes may require more time to reach room temperature. Check the temperature of the components in any case of doubt (Figure 14).
After use it is recommended that all components are put back into the kit box to avoid the unintended mixture of components with components from other kits or lots. Return the kit back to the recommended storage conditions as soon as possible (see outer kit label for storage conditions).
Figure 14: Bring all test kit components to room temperature before use and perform the test at 20 - 25 °C (68 - 77 °F)
20 - 25 °C/68 - 77 °F
2.3.4 Temperature control
ELISA tests are sensitive to temperature fluctuations. Therefore, try to stabilize and control laboratory conditions. This includes the temperature during photometric analysis. Perform ELISA tests between 20 and 25 °C and avoid conditions that are able to drastically change the temperature or increase evaporation. ELISA tests
should be prevented from direct exposure to sunlight and ventilations. Cold lab ware and cold benches may also influence the temperature. It is helpful to isolate the microtiter plate from the bench surface by performing the test on a suitable underlay. A cheap and easy solution is the use of paper towels.

22Good ELISA Practice – Manual
2.3.5 Avoiding of contamination and sample mix-up
A clean and reproducible way of working is crucial for optimal results in food and feed analysis. A very common source of contamination is insufficiently cleaned re-usable lab ware. To avoid this, it is highly recommended to use solvent-resistant single- use lab ware. If this is not possible, re-usable lab ware should be laboratory sterile and free of contamination. We recommend using a laboratory dishwasher or equivalent. Use quality control blank samples to check for contamination.
Reagents should be handled with calibrated devices, clean pipettes and containers. Only take the amount of reagent needed and do not put reagents back into the container once it has been removed. Use separate containers and pipette tips for every reagent to prevent cross contamination.
Make sure to label all containers correctly (Figure 15). Exchange the single use lab ware as often as needed.
Figure 15: Carefully label all used containers and document your labelling.

23
Figure 16: The ‘pre-plate’ contains at least 150 µl of standard or sample per well. To the 7 strips of the pre-plate 5 standards and 23 samples have been added in duplicate (i.e. 56 wells in total). Using an 8-channel multi pipette, exactly 100 µl of
standards or samples are transferred quickly to the coated plate. The pipette tips are flushed with the standard or sample solution, each tip is only used once.
2.3.6 General test handling
Before you start, read the instructions for use enclosed in the kit. Prepare all extraction solutions and buffers according to these instructions and follow the described procedures to obtain optimal results. To allow an unobstructed test procedure it is helpful to prepare a pipetting scheme before you start with your experiment.
Depending on the ELISA, antibody and conjugate solution may need to be diluted prior to use. These dilutions should be prepared directly before use and should not be stored for further use. Contaminated or incorrectly stored conjugate solutions may have a reduced enzyme activity or may induce a background signal.
To obtain optimal results, test samples and control samples (standards, reference samples) have to be available in the same diluent. Strictly following the sample preparation protocol ensures this. The pipetting into the plate needs to be performed quickly and without interruptions at every step of
the test procedure. For the transfer of samples we recommend single channel pipettes, or, if a pre-dilution plate is used, a multi-channel pipette. For the pipetting of antibody and enzyme solutions, multistep pipettes are the best option.
Between handling steps a dry-out of the wells has to be prevented.
Use of pre-plate: In the case of the RIDASCREEN®FAST Allergen test kits do not use more than three strips (24 wells) at a time. If more than three strips are needed, a second uncoated plate (e.g. low binding from Greiner bio-one Cat.-No. 655101) should be used as a pre-plate to avoid a time shift over the microtiter plate. All standards and samples are pipetted into the uncoated plate (at least 150 μl per well) and then quickly transferred to the coated microtiter plate with an 8-channel pipette (see Figure 16). Remember: the reaction starts when the first solution is added to the coated plate.

24Good ELISA Practice – Manual
2.3.7 Time management for pipetting
In general, keep the pipetting technique as consistent as possible and the absolute pipetting time to a minimum. Pipetting of standards and samples is general the most time consuming and laborious step when performing an ELISA.
Let’s consider the following example using the sandwich ELISA RIDASCREEN® Gliadin (Art. No. R7001). Standards and samples, altogether 6 strips (6 x 8 wells) are pipetted, in 6 minutes. Thereafter the plate is incubated for 30 minutes. Please note:
• Well A1 will be incubated for 6 + 30 minutes because it was pipetted first
• Well H6 is incubated for only 30 minutes because it was pipetted last (so results might be lower).
• It is crucial to understand the underlying ELISA principle to identify ‘time sensitive’ pipetting steps.
• In the sandwich ELISA RIDASCREEN® Gliadin (Art. No. R7001) the ‘antigen-antibody-reaction’ starts when the sample is added to the wells. So the ‘time sensitive’ step is the sample pipetting.
• In the competitive ELISA RIDASCREEN® Ochratoxin A (R1311) the plate is already coated with the specific antibody and the reaction starts when the sample is added. So the ‘time sensitive’ step is the sample pipetting.
• In the competitive ELISA RIDASCREEN®FAST Fumonisin (Art. No. R5602) the reaction starts when the enzyme conjugate is added. To avoid an ‘optical density (OD) shift’ from the first to the last well, it is recommended to use a stepper pipette.
However, it is not recommended to pipette in a rush as mistakes such as pipetting into wrong wells, etc. may occur.
It is very important that all samples are handled in a comparable way. Strictly follow the pipetting order and the incubation times noted in the instructions for use. To obtain comparable results in all wells, the incubation time of each single well needs to be identical.
To achieve this, start the clock after having pipetted a component starting a reaction (standards or samples, antibody solution, conjugate solution) into the last well. In case of substrate/chromogen solution, start the clock before pipetting the solution into the first well. Stop the substrate/chromogen reaction after the defined time by adding stop solution in the same order substrate/chromogen solution has been added. It is very important to meet the incubation times noted in the instructions for use.
The activity of the chromogen may be influenced by light. Cover the plate to protect the chromogen from light and store it in the brown flask in which it is delivered. To stop the reaction use the stop solution delivered with the kit.
25
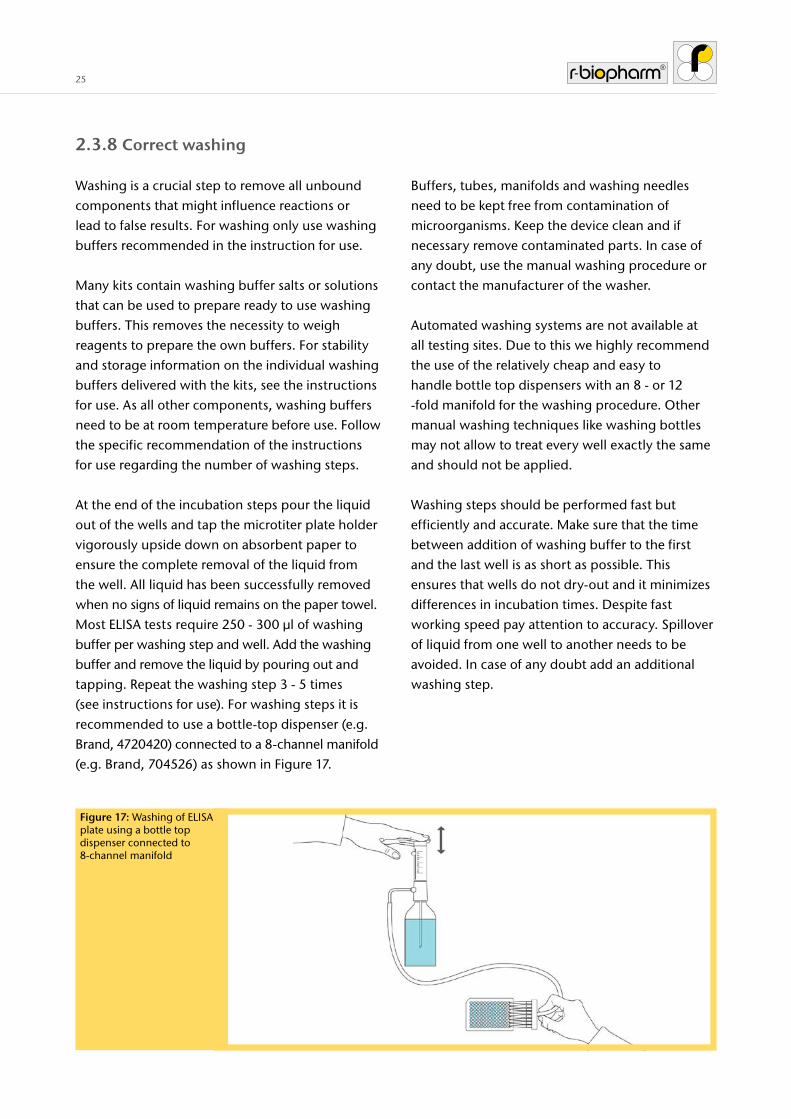
2.3.8 Correct washing
Washing is a crucial step to remove all unbound components that might influence reactions or lead to false results. For washing only use washing buffers recommended in the instruction for use.
Many kits contain washing buffer salts or solutions that can be used to prepare ready to use washing buffers. This removes the necessity to weigh reagents to prepare the own buffers. For stability and storage information on the individual washing buffers delivered with the kits, see the instructions for use. As all other components, washing buffers need to be at room temperature before use. Follow the specific recommendation of the instructions for use regarding the number of washing steps.
At the end of the incubation steps pour the liquid out of the wells and tap the microtiter plate holder vigorously upside down on absorbent paper to ensure the complete removal of the liquid from the well. All liquid has been successfully removed when no signs of liquid remains on the paper towel. Most ELISA tests require 250 - 300 µl of washing buffer per washing step and well. Add the washing buffer and remove the liquid by pouring out and tapping. Repeat the washing step 3 - 5 times (see instructions for use). For washing steps it is recommended to use a bottle-top dispenser (e.g. Brand, 4720420) connected to a 8-channel manifold (e.g. Brand, 704526) as shown in Figure 17.
Buffers, tubes, manifolds and washing needles need to be kept free from contamination of microorganisms. Keep the device clean and if necessary remove contaminated parts. In case of any doubt, use the manual washing procedure or contact the manufacturer of the washer.
Automated washing systems are not available at all testing sites. Due to this we highly recommend the use of the relatively cheap and easy to handle bottle top dispensers with an 8 - or 12 -fold manifold for the washing procedure. Other manual washing techniques like washing bottles may not allow to treat every well exactly the same and should not be applied.
Washing steps should be performed fast but efficiently and accurate. Make sure that the time between addition of washing buffer to the first and the last well is as short as possible. This ensures that wells do not dry-out and it minimizes differences in incubation times. Despite fast working speed pay attention to accuracy. Spillover of liquid from one well to another needs to be avoided. In case of any doubt add an additional washing step.
Figure 17: Washing of ELISA plate using a bottle top dispenser connected to 8-channel manifold
26Good ELISA Practice – Manual
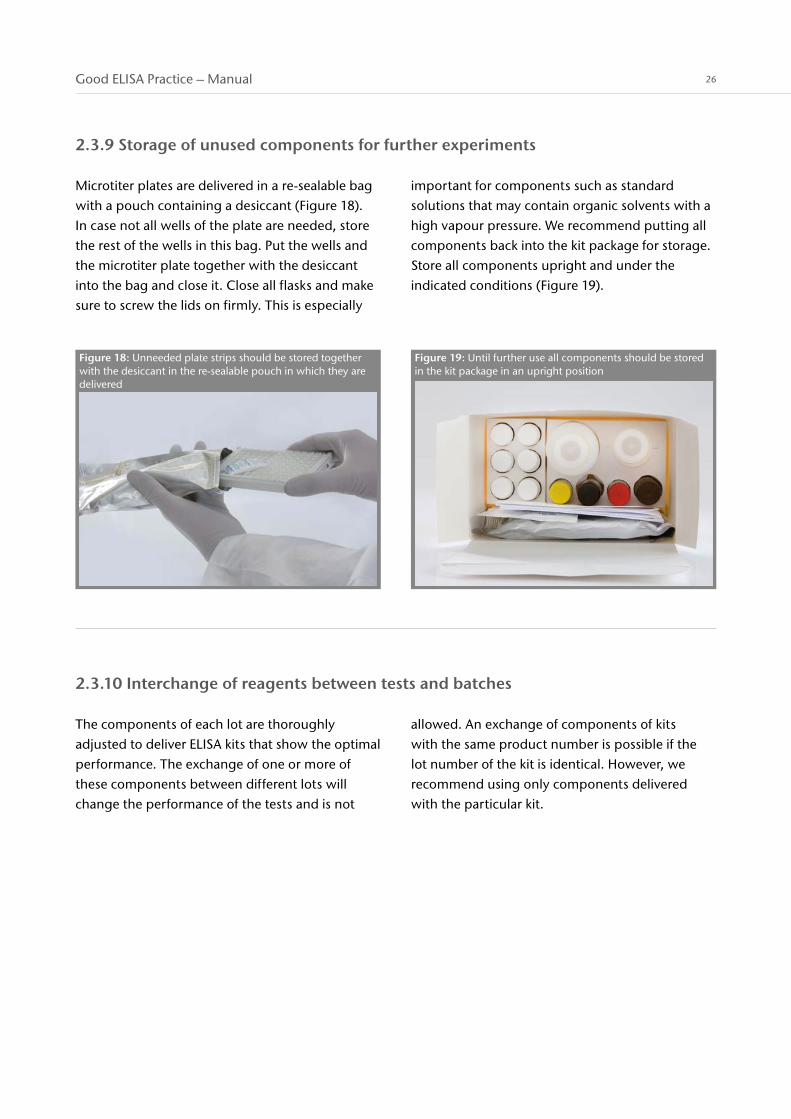
2.3.9 Storage of unused components for further experiments
Microtiter plates are delivered in a re-sealable bag with a pouch containing a desiccant (Figure 18). In case not all wells of the plate are needed, store the rest of the wells in this bag. Put the wells and the microtiter plate together with the desiccant into the bag and close it. Close all flasks and make sure to screw the lids on firmly. This is especially
important for components such as standard solutions that may contain organic solvents with a high vapour pressure. We recommend putting all components back into the kit package for storage. Store all components upright and under the indicated conditions (Figure 19).
Figure 18: Unneeded plate strips should be stored together with the desiccant in the re-sealable pouch in which they are delivered
Figure 19: Until further use all components should be stored in the kit package in an upright position
2.3.10 Interchange of reagents between tests and batches
The components of each lot are thoroughly adjusted to deliver ELISA kits that show the optimal performance. The exchange of one or more of these components between different lots will change the performance of the tests and is not
allowed. An exchange of components of kits with the same product number is possible if the lot number of the kit is identical. However, we recommend using only components delivered with the particular kit.

27
2.3.11 Security references
ELISA test kits may contain hazardous substances. For information on hazards contained in the substances take note of the warnings on the labels of the components and refer to the appropriate safety data sheets (SDS). Generally, handle all components with care and take all usual
laboratory security precautions. While performing the test procedure use laboratory gloves, wear a lab coat, do not eat, drink or smoke and keep all components away from sources of ignition. Disposal of waste may differ from country to country. Please refer to local disposal rules.
2.4 Stopping and measuring of the ELISA
Most ELISAs are measured at a wavelenght of 450 nm. The correct wavelength for reading can be found in the test kit manual under point 3. test principle. At the end of the test implementation, stop solution which contains sulfuric acid is added to each microtiter well. The acid denatures all proteins including the antibodies and thus stops the reaction (Figure 20).
Nevertheless it is recommended to read the microtiter plate directly after addition of stop solution or at least within the time stated in the instructions for use. A large delay may still cause a shift of the absolute values measured.
Figure 20: Addition of stop solution causes a color change from blue to yellow

28Good ELISA Practice – Manual
2.5 Parallel performance of tests
If several ELISA tests are performed in parallel, extraordinary care should be taken. Label microtiter plates and reagents properly to avoid mistakes and mixing of reagents between assays. Use a separate lab timer for each microtiter plate (Figure 21). Take care, that handling steps of different assays do not overlap, e.g. washing of one microtiter plate when a second one has to be stopped.
Schedule the pipetting, washing and OD reading activities before starting different ELISA.
Automation of parallel analysis is possible by using automates like the Thunder Bolt® or BOLTTM.
Please contact us for a list with tests, which are already validated on biochemistry analyzers.
Figure 21: Parallel performance of several ELISA tests must be carefully scheduled and organized

29
Data evaluation and interpretation of results
3.1 Determination of unknown samples by standard curve
The concentration of the analyte in an “unknown” sample can be determined by comparing the measured signal of the sample with the signal of standards containing known concentrations of the analyte. In ELISAs usually 5 - 7 standards are
used to generate a standard curve covering the concentration range of interest. There are also ELISAs which use single calibration technology (SC), where a single standard is used to check compliance with a deposited standard curve.
3.2 Standard curve fittings
Depending on the assay, the standard curve is calculated by different curve fittings such as linear regression, logit-log, cubic spline, 4 parameter and 2nd order polynomial (Figure 22).
Figure 22: Overview about standard curve fittings
Linear regression Logit-log Cubic spline 4 parameter
Q U A L I T Y A S S U R A N C E C E R T I F I C A T E
RIDASCREEN Histamin (enzymatic)®
Art. No.: R1605 Lot: 12184 Expiry: 2014-11
Lot No. ExpiryMicrowell plate 2014-1114463Standards 2015-0112084Buffer1 2015-0113084Enzyme Solution 2015-0113084Spike Solution 2015-0212124
R-Biopharm AG, Darmstadt, Germany certifies that this batch has been approved by the QualityAssurance Department and conforms with specifications
sign.: Edda Rohm Date: 2014-04-29Quality Assurance Representative
Remark: This document has been created electronically and is therefore valid without a signature.
0.0
0.2
0.4
0.6
0.8
1.0
1.2
1.4
1.6
1.8
2.0
0.00 5.00 10.00 15.00 20.00
Standard curve
Concentration (mg/L)
Standards
Std. nConc.(mg/L) mean
CV(%)
Std1 20.00 0.0097.9
Std2 21.00 0.1060.0
Std3 25.00 0.4840.6
Std4 210.00 0.9380.6
Std5 215.00 1.3990.9
Std6 220.00 1.8440.5
A
b
s
o
r
b
a
n
c
e
Corr.Coeff.: 0.9999slope = 0.0918
www.r-biopharm.com
The R-Biopharm group is DIN EN ISO 9001 certified.
Q U A L I T Y A S S U R A N C E C E R T I F I C A T E
RIDASCREEN FAST DON®
Art. No.: R5901 Lot: 13504 Expiry: 2015-10
R-Biopharm AG, Darmstadt, Germany certifies that this batch has been approved by the QualityAssurance Department and conforms with specifications
Lot No. ExpiryMTP M 2017-0415464Standards 2016-0512494Conjugate 2015-1011484Antibody 2016-0411484Red Chromogen Pro 2016-0314413Stop solution 2019-0214114Washing buffer salt 2016-06051M8211
Please note:
The absorbance for the standards may decrease during the shelf life of the kit. The general shape of the curve will remain similar, while the slope might change slightly. Furthermore refer to product leaflet 8. Indication of instability or deterioration of reagents.
sign.: N. Stork-Heininger Date: 2014-12-10Quality Assurance Representative
Remark: This document has been created electronically and is therefore valid without a signature.
-3.5
-3.0
-2.5
-2.0
-1.5
-1.0
-0.5
0.0
0.5
1.0
1.5
2.0
2.5
3.0
3.5
0.222 0.666 2.00 6.00
Standard curve
Concentration (ppm)
Standards
Std. nConc.(ppm) mean
CV(%) B/B0
Std1 40.00 1.9370.2 100.0
Std2 40.222 1.3282.4 68.6
Std3 40.666 0.8622.0 44.5
Std4 42.00 0.4223.9 21.8
Std5 46.00 0.2044.7 10.5
L
o
g
i
t
Corr.Coeff.: 0.998350% inhibition = 0.519
www.r-biopharm.com
The R-Biopharm group is DIN EN ISO 9001 certified.
Q U A L I T Y A S S U R A N C E C E R T I F I C A T E
RIDASCREEN GliadinArt. No.: R7001 Lot: 14383 Expiry: 2014-12
R-Biopharm AG, Darmstadt, Germany certifies that this batch has been approved by the QualityAssurance Department and conforms with specifications
0.0
0.2
0.4
0.6
0.8
1.0
1.2
1.4
1.6
1.8
2.0
2.2
2.4
5.00 10.00 20.00 40.00 80.00
Standard curve
Concentration (ppb)
Standards
Std. nConc.(ppb) mean
CV(%)
Std1 80.00 0.0589.3
Std2 85.00 0.2945.7
Std3 810.00 0.6354.2
Std4 820.00 1.0942.8
Std5 840.00 1.6832.2
Std6 880.00 2.3662.1
Absorbance
ExpiryLot No.Microwell plate 2014-1215043Standards 2015-0411353Conjugate 2015-0411353Buffer1 2015-0312173Substrate/Chromogen 2015-1015183Stop solution 2018-0415183Washing buffer 2015-1111243
Please note:
The absorbance for the standards may decrease during the shelf life of the kit. The general shape of thecurve will remain similar, while the slope might change slightly. Furthermore refer to product leaflet 8.Indication of instability or deterioration of reagents.
sign.: Edda Rohm Date: 2013-09-19Quality Assurance Representative
Remark: This document has been created electronically and is therefore valid without a signature.
www.r-biopharm.comThe R-Biopharm group is DIN EN ISO 9001 certified.
Concentration
OD
The relationship between variable y and variable x is linear. Thus, simple linear regression is applied using the formula: y = mx + b
Concentration (logarithmic)
Logit of concentration
In Logit-log is used to linearize curved plots for further analysis by linear regression models.
Concentration (logarithmic)
OD
4 parameter is a nonlinear regression model with 4 parameters:• bottom of the curve • top of the curve • EC50 • slope at the inflection point of the curve =EC50
Concentration (logarithmic)
OD
Cubic spline is a numeric function that is piecewise-defined by 3 polynomial functions with high degree of smoothness at the connections of the polynomial pieces (knots).
X-axis
Y-axis
Page 2 of 2
Datasheet
2010-10-01
RIDASCREEN® Calprotectin / One-Point Calibration and 4 Parameter
conc. of calprotectin and corresponding OD
values of mean standard curve
mg/kg stool OD0 0,010
19,5 0,09133 0,16956 0,37095 0,733
160 1,188275 2,015470 2,704800 3,113
Negative controlNegative control QC specification:Diluent 3 OD < 0,05
CalibratorThe target value of the Calibrator has been determined to be:
Calibrator OD 1, 188
The range (target value ± 3 SD) should be within: OD 0,651 – 1,725
Positive control
The target value of the Positive control has been determined to be:
Control + 145,1 mg/kg
The range (target value ± 3 SD) should be within: 113,3 – 176,9 mg/kg
Low positive control
The Low positive control can optionally be tested.
The target value of the Low positive control has been determined to be:
Low control + 54,4 mg/kg
The range (target value ± 3 SD) should be within: 41,5 – 67,3 mg/kg
calculated values of the4-parameter logistic-log-
model (4PL)
A 0,0251
B 1,5776
C 5,4862
D 3,6030
0.000
0.500
1.000
1.500
2.000
2.500
3.000
3.500
1 10 100 1000
OD
[450
nm
; R
ef. 6
20 n
m]
[mg Calprotectin/kg stool]
Calprotectin mean Standard Curve
Q U A L I T Y A S S U R A N C E C E R T I F I C A T E
RIDASCREEN FAST DON®
Art. No.: R5901 Lot: 13504 Expiry: 2015-10
R-Biopharm AG, Darmstadt, Germany certifies that this batch has been approved by the QualityAssurance Department and conforms with specifications
Lot No. ExpiryMTP M 2017-0415464Standards 2016-0512494Conjugate 2015-1011484Antibody 2016-0411484Red Chromogen Pro 2016-0314413Stop solution 2019-0214114Washing buffer salt 2016-06051M8211
Please note:
The absorbance for the standards may decrease during the shelf life of the kit. The general shape of the curve will remain similar, while the slope might change slightly. Furthermore refer to product leaflet 8. Indication of instability or deterioration of reagents.
sign.: N. Stork-Heininger Date: 2014-12-10Quality Assurance Representative
Remark: This document has been created electronically and is therefore valid without a signature.
-3.5
-3.0
-2.5
-2.0
-1.5
-1.0
-0.5
0.0
0.5
1.0
1.5
2.0
2.5
3.0
3.5
0.222 0.666 2.00 6.00
Standard curve
Concentration (ppm)
Standards
Std. nConc.(ppm) mean
CV(%) B/B0
Std1 40.00 1.9370.2 100.0
Std2 40.222 1.3282.4 68.6
Std3 40.666 0.8622.0 44.5
Std4 42.00 0.4223.9 21.8
Std5 46.00 0.2044.7 10.5
L
o
g
i
t
Corr.Coeff.: 0.998350% inhibition = 0.519
www.r-biopharm.com
The R-Biopharm group is DIN EN ISO 9001 certified.
0.0
1.5
0.5
2.0
3.0
1.0
2.5
3.5
3
30Good ELISA Practice – Manual
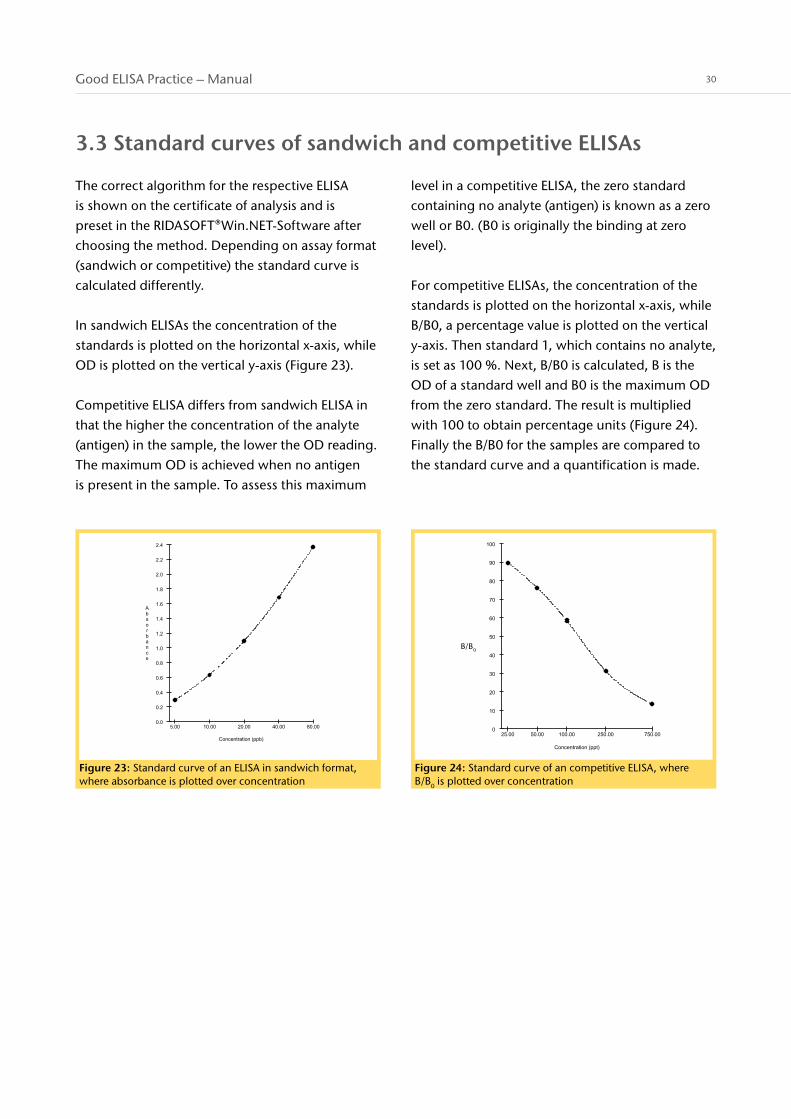
Figure 23: Standard curve of an ELISA in sandwich format, where absorbance is plotted over concentration
Q U A L I T Y A S S U R A N C E C E R T I F I C A T E
RIDASCREEN GliadinArt. No.: R7001 Lot: 14383 Expiry: 2014-12
R-Biopharm AG, Darmstadt, Germany certifies that this batch has been approved by the QualityAssurance Department and conforms with specifications
0.0
0.2
0.4
0.6
0.8
1.0
1.2
1.4
1.6
1.8
2.0
2.2
2.4
5.00 10.00 20.00 40.00 80.00
Standard curve
Concentration (ppb)
Standards
Std. nConc.(ppb) mean
CV(%)
Std1 80.00 0.0589.3
Std2 85.00 0.2945.7
Std3 810.00 0.6354.2
Std4 820.00 1.0942.8
Std5 840.00 1.6832.2
Std6 880.00 2.3662.1
Absorbance
ExpiryLot No.Microwell plate 2014-1215043Standards 2015-0411353Conjugate 2015-0411353Buffer1 2015-0312173Substrate/Chromogen 2015-1015183Stop solution 2018-0415183Washing buffer 2015-1111243
Please note:
The absorbance for the standards may decrease during the shelf life of the kit. The general shape of thecurve will remain similar, while the slope might change slightly. Furthermore refer to product leaflet 8.Indication of instability or deterioration of reagents.
sign.: Edda Rohm Date: 2013-09-19Quality Assurance Representative
Remark: This document has been created electronically and is therefore valid without a signature.
www.r-biopharm.comThe R-Biopharm group is DIN EN ISO 9001 certified.
Figure 24: Standard curve of an competitive ELISA, where B/B0 is plotted over concentration
Q U A L I T Y A S S U R A N C E C E R T I F I C A T E
RIDASCREEN ChloramphenicolArt. No.: R1505 Lot: 11084 Expiry: 2015-04
R-Biopharm AG, Darmstadt, Germany certifies that this batch has been approved by the QualityAssurance Department and conforms with specifications
0
10
20
30
40
50
60
70
80
90
100
25.00 50.00 100.00 250.00 750.00
Standard curve
Concentration (ppt)
Standards
Std. nConc.(ppt) mean
CV(%) B/B0
Std1 80.00 2.3022.3 100.0
Std2 825.00 2.0682.8 89.8
Std3 850.00 1.7513.1 76.1
Std4 8100.00 1.348
3.0 58.6
Std5 8250.00 0.719
3.4 31.2
Std6 8750.00 0.306
4.2 13.3
Absorbance
(%)
50% inhibition = 132.2
ExpiryLot No.Microwell plate 2015-0415313Standards 2015-0912034Conjugate 2015-0714064Buffer1 2015-1212044Red Chromogen Pro 2015-0511113Stop solution 2018-0811373Washing buffer salt 2016-06051M8211
Please note:
The absorbance for the standards may decrease during the shelf life of the kit. The general shape ofthe curve will remain similar, while the slope might change slightly. Furthermore refer to product leaflet8. Indication of instability or deterioration of reagents.
sign.: Edda Rohm Date: 2014-02-17Quality Assurance Representative
Remark: This document has been created electronically and is therefore valid without a signature.
www.r-biopharm.comThe R-Biopharm group is DIN EN ISO 9001 certified.
B/B0
3.3 Standard curves of sandwich and competitive ELISAs
The correct algorithm for the respective ELISA is shown on the certificate of analysis and is preset in the RIDASOFT®Win.NET-Software after choosing the method. Depending on assay format (sandwich or competitive) the standard curve is calculated differently.
In sandwich ELISAs the concentration of the standards is plotted on the horizontal x-axis, while OD is plotted on the vertical y-axis (Figure 23).
Competitive ELISA differs from sandwich ELISA in that the higher the concentration of the analyte (antigen) in the sample, the lower the OD reading. The maximum OD is achieved when no antigen is present in the sample. To assess this maximum
level in a competitive ELISA, the zero standard containing no analyte (antigen) is known as a zero well or B0. (B0 is originally the binding at zero level).
For competitive ELISAs, the concentration of the standards is plotted on the horizontal x-axis, while B/B0, a percentage value is plotted on the vertical y-axis. Then standard 1, which contains no analyte, is set as 100 %. Next, B/B0 is calculated, B is the OD of a standard well and B0 is the maximum OD from the zero standard. The result is multiplied with 100 to obtain percentage units (Figure 24). Finally the B/B0 for the samples are compared to the standard curve and a quantification is made.

31
3.4 Spectrophotometer and Software
The optical density is read by a microtiter plate spectrophotometer at a certain wavelength. There are many different spectrophotometers from different manufacturers available. R-Biopharm offers spectrophotometers and a software, called RIDASOFT® Win.NET, which is tailor-made for the analysis of ELISAs from R-Biopharm (Figure 25, 26). For the use of the software a manual (Art. No. R9996) is available on request. If a spectrophotometer is already available, please do not hesitate to contact us, to check if your spectrophotometer can be used in conjunction with the software and our assays.
Figure 26: Screenshots of RIDA®SOFT Win.net: plate layout, standard curve, results
Figure 25 RIDA®ABSORBANCE 96, Art. No. ZRA96FF

32Good ELISA Practice – Manual
Figure 27: Determination of analyte concentration from unknown sample through standard curve
Q U A L I T Y A S S U R A N C E C E R T I F I C A T E
RIDASCREEN ChloramphenicolArt. No.: R1505 Lot: 11084 Expiry: 2015-04
R-Biopharm AG, Darmstadt, Germany certifies that this batch has been approved by the QualityAssurance Department and conforms with specifications
0
10
20
30
40
50
60
70
80
90
100
25.00 50.00 100.00 250.00 750.00
Standard curve
Concentration (ppt)
Standards
Std. nConc.(ppt) mean
CV(%) B/B0
Std1 80.00 2.3022.3 100.0
Std2 825.00 2.0682.8 89.8
Std3 850.00 1.7513.1 76.1
Std4 8100.00 1.348
3.0 58.6
Std5 8250.00 0.719
3.4 31.2
Std6 8750.00 0.306
4.2 13.3
Absorbance
(%)
50% inhibition = 132.2
ExpiryLot No.Microwell plate 2015-0415313Standards 2015-0912034Conjugate 2015-0714064Buffer1 2015-1212044Red Chromogen Pro 2015-0511113Stop solution 2018-0811373Washing buffer salt 2016-06051M8211
Please note:
The absorbance for the standards may decrease during the shelf life of the kit. The general shape ofthe curve will remain similar, while the slope might change slightly. Furthermore refer to product leaflet8. Indication of instability or deterioration of reagents.
sign.: Edda Rohm Date: 2014-02-17Quality Assurance Representative
Remark: This document has been created electronically and is therefore valid without a signature.
www.r-biopharm.comThe R-Biopharm group is DIN EN ISO 9001 certified.
measured
contentration obtained through standard curve
Figure 28: A milk sample was diluted 1:4 before applying to the microtiter well. The results have to multiplied by 4 to obtain the correct concentration: The concentration of the analyte in the sample is 100 ng/kg x 4 = 400 ng/kg.
Q U A L I T Y A S S U R A N C E C E R T I F I C A T E
RIDASCREEN ChloramphenicolArt. No.: R1505 Lot: 11084 Expiry: 2015-04
R-Biopharm AG, Darmstadt, Germany certifies that this batch has been approved by the QualityAssurance Department and conforms with specifications
0
10
20
30
40
50
60
70
80
90
100
25.00 50.00 100.00 250.00 750.00
Standard curve
Concentration (ppt)
Standards
Std. nConc.(ppt) mean
CV(%) B/B0
Std1 80.00 2.3022.3 100.0
Std2 825.00 2.0682.8 89.8
Std3 850.00 1.7513.1 76.1
Std4 8100.00 1.348
3.0 58.6
Std5 8250.00 0.719
3.4 31.2
Std6 8750.00 0.306
4.2 13.3
Absorbance
(%)
50% inhibition = 132.2
ExpiryLot No.Microwell plate 2015-0415313Standards 2015-0912034Conjugate 2015-0714064Buffer1 2015-1212044Red Chromogen Pro 2015-0511113Stop solution 2018-0811373Washing buffer salt 2016-06051M8211
Please note:
The absorbance for the standards may decrease during the shelf life of the kit. The general shape ofthe curve will remain similar, while the slope might change slightly. Furthermore refer to product leaflet8. Indication of instability or deterioration of reagents.
sign.: Edda Rohm Date: 2014-02-17Quality Assurance Representative
Remark: This document has been created electronically and is therefore valid without a signature.
www.r-biopharm.comThe R-Biopharm group is DIN EN ISO 9001 certified.
Figure 29: A meat sample was concentrated by factor 2 during sample preparation 1. The result has to be multiplied with 0.5 to obtain the correct concentration: The concentration of the analyte in the sample is 100 ng/kg x 0.5 = 50 ng/kg.
Q U A L I T Y A S S U R A N C E C E R T I F I C A T E
RIDASCREEN ChloramphenicolArt. No.: R1505 Lot: 11084 Expiry: 2015-04
R-Biopharm AG, Darmstadt, Germany certifies that this batch has been approved by the QualityAssurance Department and conforms with specifications
0
10
20
30
40
50
60
70
80
90
100
25.00 50.00 100.00 250.00 750.00
Standard curve
Concentration (ppt)
Standards
Std. nConc.(ppt) mean
CV(%) B/B0
Std1 80.00 2.3022.3 100.0
Std2 825.00 2.0682.8 89.8
Std3 850.00 1.7513.1 76.1
Std4 8100.00 1.348
3.0 58.6
Std5 8250.00 0.719
3.4 31.2
Std6 8750.00 0.306
4.2 13.3
Absorbance
(%)
50% inhibition = 132.2
ExpiryLot No.Microwell plate 2015-0415313Standards 2015-0912034Conjugate 2015-0714064Buffer1 2015-1212044Red Chromogen Pro 2015-0511113Stop solution 2018-0811373Washing buffer salt 2016-06051M8211
Please note:
The absorbance for the standards may decrease during the shelf life of the kit. The general shape ofthe curve will remain similar, while the slope might change slightly. Furthermore refer to product leaflet8. Indication of instability or deterioration of reagents.
sign.: Edda Rohm Date: 2014-02-17Quality Assurance Representative
Remark: This document has been created electronically and is therefore valid without a signature.
www.r-biopharm.comThe R-Biopharm group is DIN EN ISO 9001 certified.
3.5 Determination of analyte concentration
The software creates the standards curve and calculates the concentration of an analyte in an unknown sample as shown in figure 27. Outside the measurement range the software will calculate no values.
3.6 Measuring range and dilution factor
If an absorbance or a B/B0 value is obtained which is below or above the standard curve, the RIDASOFT® Win.NET software gives a results ‘<’ (below) or ‘>’ (above) standard range. The software provides the option to extrapolate the concentration value. In general, these extrapolated values are only estimates and are not reliable. The further the sample is below the lowest or above the highest standard, the bigger the uncertainty of the calculated concentration is. It is advised, to dilute samples that are above the largest standard and to repeat the analysis until the result is within the concentration range of the standard curve. The measuring range of the ELISA is determined
by the concentration of the standards, and by the dilution factor of the sample preparation method. For example, if milk is diluted 1:4 (1+3) before applying to the microtiter well, the dilution factor is 4. This means, that the results read from the standard curve have to be multiplied by 4 to obtain the correct concentration of the analyte in the sample. If the analyte in a sample is concentrated by a factor of 2 during sample preparation, e.g. by evaporation or column clean-up, the dilution factor is 0.5. This means, that the results read from the standard curve have to be multiplied by 0.5 to obtain the correct concentration of the analyte in the sample (Figure 28, 29).

33
3.7 Units and dimensions
Concentrations are sometimes not expressed in SI units, but in miscellaneous dimensionless quantity ‘part per’ annotation (Figure 30). We strongly recommend to follow SI units.
3.8 Limit of detection and quantification
The Limit of Detection (LOD) is the lowest concentration of an analyte, which can be clearly distinguished from blank sample readings. The LOD is determined experimentally by measuring the concentration of at least 20 blank matrix samples and then calculated by the formula: Mean concentration of blank samples + 3-fold standard deviation of the concentrations of blank samples.
The Limit of Quantification (LOQ) is the lowest concentration of an analyte which can be detected quantitatively. The LOQ is determined experimentally by measuring the concentration of at least 20 blank matrix samples and then calculated by the formula: Mean concentration of blank samples + (most often but not necessarily 9-fold standard deviation of the concentrations of blank samples (Figure 31).
It is recommended to verify these values by spiking experiment with the sample matrix and laboratory equipment.
Results below the LOD indicate that a sample is negative or that the concentration of the analyte(s) is below the LOD.
Results, which are above the LOD and below the LOQ are qualitative (negative/positive) results only. This means, that the sample contains the analyte, but the exact amount cannot be quantified, as the value is below the LOQ.
SI-units decimal parts per symbol
g/kg 10-3 parts per mille ‰
mg/kg 10-6 parts per million ppm
µg/kg 10-9 parts per billion ppb
ng/kg 10-12 parts per trillion ppt
pg/kg 10-15 parts per quadrillion ppq
Figure 30: Overview about SI-unit and the miscellaneous dimensionless quantities ‘part per’ annotation
Figure 31: 20 blank samples were analyzed. Mean of blank samples = 18 ng/kg with a standard deviation of 5,7 ng/kgLOD = 18 ng/kg + 3 x 5,7 ng/kg = 35 ng/kgLOQ = 18 ng/kg + 9 x 5,7 ng/kg = 69 ng/kg
80
60
40
20
con
cen
trat
ion
samples
LOQ; 69
LOD; 35
MeanBlank; 18
0
70
50
30
10
1 7 134 10 162 8 145 11 17 193 9 156 12 18 20
34Good ELISA Practice – Manual
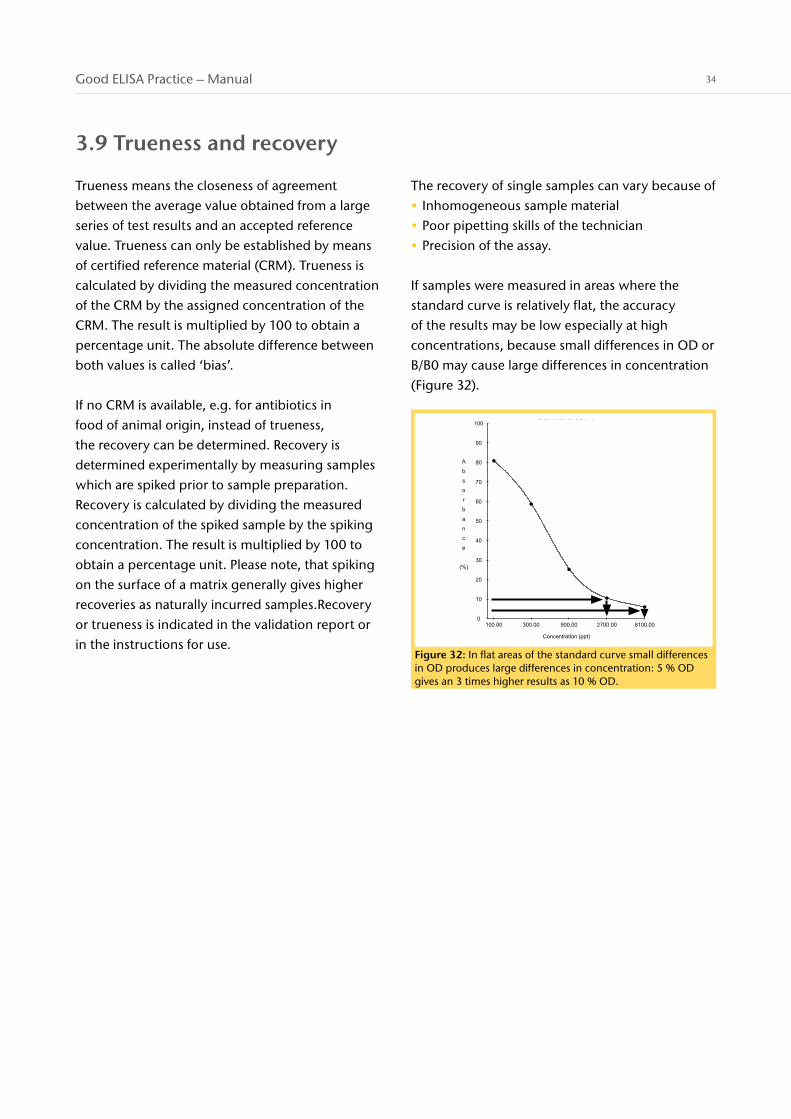
Figure 32: In flat areas of the standard curve small differences in OD produces large differences in concentration: 5 % OD gives an 3 times higher results as 10 % OD.
Q U A L I T Y A S S U R A N C E C E R T I F I C A T E
RIDASCREEN Clenbuterol Fast®
Art. No.: R1701C Lot: 16213 Expiry: 2015-04
R-Biopharm AG, Darmstadt, Germany certifies that this batch has been approved by the QualityAssurance Department and conforms with specifications
Lot No. ExpiryMTP K 2015-0814113Standards 2015-0411193Conjugate 2015-0414193Antibody 2015-0416193Buffer1 2015-0412173Red Chromogen Pro 2015-0511113Stop solution 2018-0311163
Please note:
The absorbance for the standards may decrease during the shelf life of the kit. The general shape of the curve will remain similar, while the slope might change slightly. Furthermore refer to product leaflet 8. Indication of instability or deterioration of reagents.
sign.: N. Stork-Heininger Date: 2014-09-08Quality Assurance Representative
Remark: This document has been created electronically and is therefore valid without a signature.
0
10
20
30
40
50
60
70
80
90
100
100.00 300.00 900.00 2700.00 8100.00
Standard curve
Concentration (ppt)
Standards
Std. nConc.(ppt) mean
CV(%) B/B0
Std1 80.00 1.6426.5 100.0
Std2 8100.00 1.327
2.0 80.8
Std3 8300.00 0.964
1.7 58.7
Std4 8900.00 0.414
3.2 25.2
Std5 82700.00 0.173
5.3 10.5
Std6 88100.00 0.098
5.1 6.0
A
b
s
o
r
b
a
n
c
e
(%)
50% inhibition = 399.1
www.r-biopharm.com
The R-Biopharm group is DIN EN ISO 9001 certified.
3.9 Trueness and recovery
Trueness means the closeness of agreement between the average value obtained from a large series of test results and an accepted reference value. Trueness can only be established by means of certified reference material (CRM). Trueness is calculated by dividing the measured concentration of the CRM by the assigned concentration of the CRM. The result is multiplied by 100 to obtain a percentage unit. The absolute difference between both values is called ‘bias’.
If no CRM is available, e.g. for antibiotics in food of animal origin, instead of trueness, the recovery can be determined. Recovery is determined experimentally by measuring samples which are spiked prior to sample preparation. Recovery is calculated by dividing the measured concentration of the spiked sample by the spiking concentration. The result is multiplied by 100 to obtain a percentage unit. Please note, that spiking on the surface of a matrix generally gives higher recoveries as naturally incurred samples.Recovery or trueness is indicated in the validation report or in the instructions for use.
The recovery of single samples can vary because of • Inhomogeneous sample material• Poor pipetting skills of the technician• Precision of the assay.
If samples were measured in areas where the standard curve is relatively flat, the accuracy of the results may be low especially at high concentrations, because small differences in OD or B/B0 may cause large differences in concentration (Figure 32).

35
Specificity or cross reactivity =50 % – dose of analyte or cross reactive substance
50 % – dose of standard substancex 100 %
3.10 Specificity and cross reactivity
Antibodies are highly specific to a single analyte, but sometimes they can also bind other molecules with different affinities. In the case of food allergens, the cross-reactivity in food samples (like lentils or quinoa) are evaluated as a pure commodity (100 % level). Samples well below the LOQ show no cross-reactivity.
The specificity or cross reactivity is determined by the measurement of a standard curve consisting of the analyte or cross reactive substance in a suitable concentration series (Figure 33). After calculation of the 50 %-dose of the analyte or cross reactive substance, the specificity or cross reactivity is calculated as follows:
If the binding of the antibody affects a substance that is included in the scope of the method, this is called specificity of the method. If this binding is related to unwanted substances that are not within the scope of the method it is called cross reactivity.
1st Example: The scope of an ELISA describes that the system was developed to quantify aflatoxin M1 in milk. Therefore, the specificity for aflatoxin M1 is 100 %. Furthermore it is stated that a cross-reactivity of 10 % to aflatoxin M2 exists.
Due to the principle of an ELISA system, the antibody is not able to discriminate between the specificity to aflatoxin M1 and the cross-reactivity related to aflatoxin M2. If both are present in an unknown sample, the result is the sum of both substances. But, due to the low cross-reactivity of 10 %, a 10-fold higher concentration of aflatoxin M2 (compared to M1) is necessary to resulting in a signal comparable to aflatoxin M1. An exact quantification is only possible if only one analyte
or one cross-reacting substance is present in the sample.
2nd example: The scope of a Tetracycline-ELISA is the determination of tetracycline and its derivatives like chlortetracycline, rolitetracycline and demeclocycline in different matrices to a certain degree. The calibrator material is tetracycline with a specificity of 100 %. The specificity of derivatives differs, e.g. the specificity of chlortetracycline is 70 % in this system. Assuming the testing of a milk sample, which is spiked with chlortetracycline, reveals a measured concentration of 10 μg/L. The real concentration is calculated to be 14 μg chlortetracycline per L of milk, because the specificity of chlortetracycline is 70 %.
The specificity of the (tetracycline) ELISA was determined by analyzing the cross-reactivities to corresponding substances in buffer system. In samples, the specificity may deviate from those determined in the buffer system due to matrix
Figure 33: The 50%-dose of the standard curve of the standard substance (blue) is more sensitive (170 µg/kg) as the 50%-dose of the standard curve of the cross reactive substance (210 µg/kg).
The cross reactivity of the cross reactive substance is therefore: (170 µg/kg / 210 µg/kg) x 100 % = 81 %
100
80
60
40
20
20 200
concentration of standards [µg/kg]
standardsubstance
crossreactivesubstance
B/B
0 [%
]
0
90
70
50
30
10
36Good ELISA Practice – Manual
effects. Prior to the analysis of cross-reactive substances, the user has to determine the Limit of Detection and the Recovery for the substance in the respective sample matrix. The test cannot discriminate between analytes and cross-reactive substances.
Nevertheless, ELISA tests are often used as screening methods. Any positive results or concentration higher than specified threshold should be verified by a confirmatory method e.g. LC-MS/MS.
In case of an unknown matrix and/or another
specific analyte which are not included in the scope of the method, the user must determine the Limit of Detection and the Recovery of the specific analyte in the particular sample matrix. Please note that the specificities and cross reactivity’s were experimentally determined in the buffer system only, as it is very time consuming and laborious to determine every specificity or cross reactivity of any analyte or cross reactive substance in every matrix.
3.11 Interferences and matrix effects
In general, food and feed are considered as ‘highly difficult’ sample matrices, due to their complex composition. The recovery of a single sample varies depending on the nature of the food matrix.The composition (e.g. ingredients, preservatives, colorants), processing and physical properties of the matrix material surrounding the analyte has the largest impact on the recovery. Ingredients such as high-fat or high-sugar-foods can cause
different types of interferences compared to low-fat or low-sugar food. Processing like heat treatment or hydrolysis can modify the analyte in such a way that it is no longer recognized by the antibody. Therefore, the complexity of the food matrix has the largest influence on the recovery, this is also called ‘matrix-effects’. A trouble shooting guide for allergens and validation reports are available on request.

37

R-Biopharm An der neuen Bergstraße 1764297 Darmstadt, GermanyPhone: +49 61 51 - 81 02-0Fax: +49 61 51 - 81 02-40E-mail: [email protected] 06
/202
0
R-Biopharm – dedicated to food safety