Embed Size (px)
Citation preview

Good Practices Manual Green House Gases Emission Reduction
Cement Sector
Prepard by
Prepared by
National Productivity Council
Supported by
Department of Industry and Policy Promotion

©
Prepared by
National Productivity Council, India Supported by
Department of Industrial Policy and Promotion Ministry of Commerce and Industry Government of India
Copyright 2017 National Productivity Council
This manual is the property of Department of Industrial Policy and Promotion, Ministry of Commerce and Industry, Government of India. No part of this publication may be reproduced, distributed, stored in retrieval system, or transmitted in any form or by any means, including photocopying or other electronic or mechanical methods, without the prior written permission of the Publisher.
TABLE OF CONTENTS
ACKNOWLEDGEMENT ....................................................................................................... 1
PREFACE ................................................................................................................................. 2
STUDY TEAM ......................................................................................................................... 3
1. INTRODUCTION ............................................................................................................ 4
1.1 BACKGROUND ............................................................................................................. 4 1.2 ABOUT THE PROJECT................................................................................................... 5 1.3 METHODOLOGY .......................................................................................................... 5 1.4 GREENHOUSE GASES AND ITS IMPACT .................................................................. 6 1.5 Outline of Energy Scenario in India ....................................................................... 9 1.6 GHG EMISSION FACTORS ........................................................................................ 13 2. CEMENT SECTOR PROFILE ..................................................................................... 14
2.1 INTRODUCTION ......................................................................................................... 14 2.2 TYPES OF CEMENT PRODUCED IN INDIA ............................................................ 14 2.3 ENERGY CONSUMPTION OVERVIEW ................................................................... 15 2.4 Various Sources of GHG Emissions in Cement Sector ................................................. 17 2.5 PRODUCTIVITY ASPECTS AND INDICATORS IN CEMENT SECTOR .............. 18 3. CEMENT MANUFACTURING PROCESS ................................................................ 27
3.1 Overview of CEMENT Production ......................................................................... 27 3.2 TYPES OF PROCESS .................................................................................................... 29 3.3 Raw Materials ................................................................................................................ 31 3.4 Crushing ......................................................................................................................... 31 3.5 Pre-homogenisation ....................................................................................................... 31 3.6 Grinding ......................................................................................................................... 31 3.7 Pyroprocessing ........................................................................................................... 35 3.8 Coolers ......................................................................................................................... 36 4. BEST PRACTICES ........................................................................................................ 40
4.1 Waste Heat Recovery System ........................................................................................ 40 4.2 Use of Alternate Fuels and Biomass .............................................................................. 40 4.3 Clinker Substitution ....................................................................................................... 42 4.4 Improvements in Electrical & Thermal Energy Consumption ...................................... 43 4.5 Producing Composite Cement ....................................................................................... 43 4.6 Limestone Based Cement/Low Carbon Cement ............................................................ 44 4.7 Emerging Technologies ................................................................................................. 46 5. CASE STUDIES .............................................................................................................. 49
5.1 Installation of New High Efficiency SF Cooler in Line-1 ............................................. 49 5.2 Installation of Raw Mill-1 Classifer with Energy Efficient Classifier with Vortex Rectifier.................................................................................................................................... 50 5.3 Installation of Steam Tracer for DG Aux instead of Electrical Heating ........................ 51 5.4 Installation of VFD for Line-2 Cement Mill Bag Filer Fan and Pre-heater ID Fan ...... 52 5.5 Optimisation of Pressure Drop in Ducts Using CFD in Cement Mill-1 & 2 ................. 54 5.6 Modification of Line-2 Raw Mill Fan Inlet Duct .......................................................... 55 5.7 Installation of Rotary airlock in Line-2 Coal Mill ......................................................... 56

5.8 Removal of Silencer for Cooler Fans and Arresting Leakages of Cooler ..................... 56 5.9 Optimization of Coal Handling Plant by Modifying the Belt Feeder Drive Arrangement 57 5.10 Utilisation of Alternate Fuels ................................................................................. 58 5.11 Logic Modification for Idle Running of Coal Handling Plant Belts ...................... 60 5.12 Conversion of Delta Connected Under Loaded LT Motors to Permanently Star Mode 60 5.13 Optimization of Compressed Air Usage at Packing Plant ..................................... 61 5.14 Installation of Waste Heat Recovery System for Power Generation ..................... 62 5.15 Installation of IKN’s Pendulum Cooler for Upgradation ....................................... 63 6. INTERNET OF THINGS (IOT) ................................................................................... 64
7. ABBREVIATIONS ......................................................................................................... 65
8. BIBLIOGRAPHY ........................................................................................................... 66
1
ACKNOWLEDGEMENT
Vasavadatta Cements
Management and executives of Vasavadatta cements
Kesoram Cements
Management and executives of Kesoram cements
The Ramco Cements Limited, Alathiyur
Management and executives of Ramco cements.
Bureau Of Indian Standards
Mr.B. RamaKrishna Rao, Scientist-F and Head
FL Smidth Private Limited Cement Project Division
Mr.S.Sridhar, General Manager Mr.Jaleel Rahman, Dy.Manager
Clair Engineers, Hyderabad
Mr.K.S.R.Naidu,Director
2
PREFACE
It is now widely accepted that we have to limit the temperature rise to 2oC to mitigate effects
of climate change. This requires changing the portfolio of energy basket from fossils to non-
renewable energy, reduce energy use through energy efficiency and conservation and reduce
GHG emissions.
The broad intent and its goals can only be achieved by co-ordinated actions at various level
by society, business, industry and government. As part of its endeavor the Government of
India is formulating policies, action plans to support and guide industry and entrusted
National Productivity Council to prepare of Best Practices Manual for Reducing GHG
Emissions in various sectors namely, Thermal Power Plant, Chlor Alkali, Cement, Pulp
and Paper and Iron and Steel.
This manual is expected to serve as reference manual for
• Identifying sources of GHG emissions
• Assess and quantify emissions.
• Evaluate and assess potential to improve energy efficiency and reduce GHG
emissions.
• Propose a menu of options which industry can consider for assessment and
implementation.
The scope of this manual covers GHG emissions in the plant boundary and does not include
transportation of raw materials, products and wastes to secured landfills, emissions from
domestic waste treatment and emissions from sales and other offices.
It is hoped the manual will be handy reference and guide for all levels of engineers and
managers working in the sector.
3
STUDY TEAM
Project Coordinator
Mr. R Virendra, Dy. Director General, National Productivity Council
Team Coordinator
Dr.B.Hemat Kumar Rao, Regional Director National Productivity Council
Team Members
Mr. D Rajani kant, Dy. Director National Productivity Council Mr. B. Durgaji, Dy. Director National Productivity Council Mr.Lalith Kamde, Asst. Director National Productivity Council Mr.P.Raj Kamal, Asst. Director National Productivity Council Mr.P.Vinod Kumar, Asst. Director National Productivity Council
Advisors
Dr.K.N.Rao, Director (Energy and Environment) ACC Limited Dr. Sainath, Managing Director Clair Engineers Pvt Ltd, Hyderabad Shri.K.R.Chary, Operations Department Birla Institute of Management and Technology
4
1. INTRODUCTION
1.1 BACKGROUND
Energy is a major driver of economy and the per capita consumption of energy is a lead indicator of its development. The fossil fuels, constituting 72.4% of the energy basket as of 20131
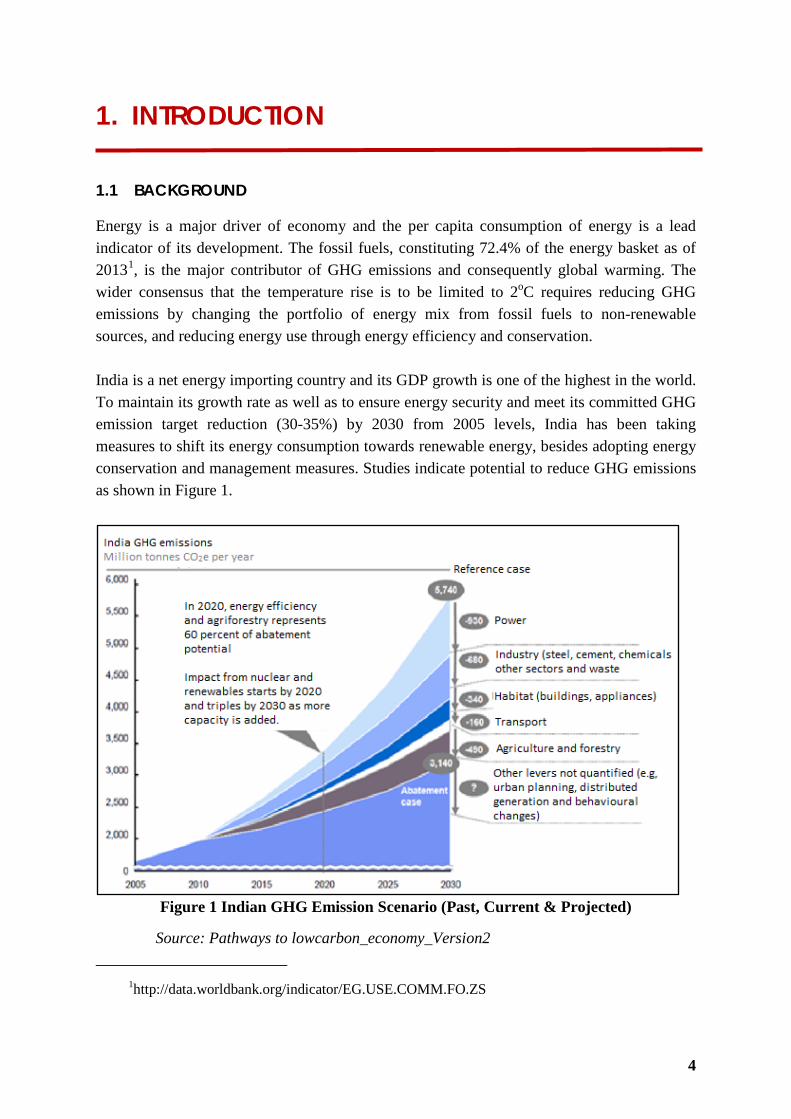
, is the major contributor of GHG emissions and consequently global warming. The wider consensus that the temperature rise is to be limited to 2oC requires reducing GHG emissions by changing the portfolio of energy mix from fossil fuels to non-renewable sources, and reducing energy use through energy efficiency and conservation. India is a net energy importing country and its GDP growth is one of the highest in the world. To maintain its growth rate as well as to ensure energy security and meet its committed GHG emission target reduction (30-35%) by 2030 from 2005 levels, India has been taking measures to shift its energy consumption towards renewable energy, besides adopting energy conservation and management measures. Studies indicate potential to reduce GHG emissions as shown in Figure 1.
Figure 1 Indian GHG Emission Scenario (Past, Current & Projected)
Source: Pathways to lowcarbon_economy_Version2
1http://data.worldbank.org/indicator/EG.USE.COMM.FO.ZS
5
As can be seen, industrial sector’s GHG reduction potential is about 680 million tonnes CO2e per year. In line with these projections provided by various studies, Government of India has evolved policies, action plans and mission oriented programs to address the following objectives and issues.
• Energy security – to meet present and future needs • Environmental impact-to address local emissions & global climate change • Economic development – to create a sustainable development • Ease of implementation
1.2 ABOUT THE PROJECT
To ensure effective translation of policy and implementation of action plans, Department of Industrial Policy & Promotion (DIPP), under Ministry of Commerce & Industry, Government of India has entrusted National Productivity Council of India (NPC) with the project titled “Preparation of Good Practices Manuals for Green House Gas Emission Reduction in Five Energy Intensive Industry Sectors in India” under the 12th Plan period (2012-2017). The scope of the project is to conduct field and questionnaire survey in five selected energy intensive sectors (Thermal Power Plant, Chlor Alkali, Cement, Pulp and Paper and Iron and Steel) of Indian economy, and bringing out manuals on Good Practices for GHG Emission reduction in the selected energy intensive sectors. Out of these five energy intensive sectors, this manual highlights the best practices involved for reducing Green House Gases Emission Reduction in the cement sector. This manual brings out sources and trends driving India’s greenhouse gas emissions in the cement sector, outlining present situation and technologies that offer potential for significant emission reductions through enhanced energy efficiency that will put India on a sustained low-carbon path without sacrificing economic growth. It also highlights the Government of India policies and interventions that spur energy efficiency and GHG reduction activities in the sector eventually leading to improving energy security.
1.3 METHODOLOGY
For preparing this manual, the following methodology was adopted:
• Sector reports were prepared with inputs from questionnaire survey, detailed field visits and audits, workshops and guidance from steering committee.

6
• The synopses of the reports were extracted to prepare this manual for comprehensive presentation of information and provide guidelines for implementation of GHG emission reduction options.
• Feedback on the manual contents and the material was sought and received from industries, sector association, and other stakeholders and the same was incorporated in the final manual
1.4 GREENHOUSE GASES AND ITS IMPACT
Over the last 100 years, it has been found out that the earth is getting warmer and warmer, unlike previous 8000 years when temperatures have been relatively constant. The present temperature is 0.3−0.6 °C warmer than it was 100 years ago. The key greenhouse gas (GHG) causing global warming through human enhanced GHG effect is carbon dioxide. The natural greenhouse effect is the process by which radiation from the earth's atmosphere warms its surface to a temperature above what it would be without its greenhouse gases naturally present in the atmosphere. The greenhouse gases naturally present in the atmosphere include carbon dioxide, water vapor, methane, nitrous oxide, and ozone. Certain human activities add to the levels of most of the naturally occurring gases. For example, carbon dioxide is released to the atmosphere when fossil fuels such as oil, natural gas, coal, wood etc are burned. The enhanced greenhouse gas effect is the further rise in average earth’s temperature due to increase in the amount of carbon dioxide and other greenhouse gases in the earth's atmosphere due to human activities. Both these effects are depicted in Figure 2.
Figure 2 Natural and Human Enhanced Greenhouse Effect
Green House Gases (GHG) is of two types namely direct and indirect. Direct GHG contribute directly to the greenhouse effect in the atmosphere by trapping the infrared radiation near the earth’s surface. The major GHG gases identified by Intergovernmental Panel on Climatic

7
Change (IPCC) are carbon dioxide, methane, nitrous oxide, hydrogen fluorocarbons, per fluorocarbons, sulphur hexafluoride. Indirect GHG control the oxidising capacity of the troposphere by reducing the hydroxyl radical distribution thereby increasing the residence time of direct greenhouse gases, such as methane and ozone. Although there are a number of ways of measuring the strength of different greenhouse gases in the atmosphere, the Global Warming Potential (GWP) is the most used indicator. GWP depends upon the greenhouse gas ability to absorb heat in the atmosphere. HFCs and PFCs are the most heat-absorbent. Methane traps over 21 times more heat per molecule than carbon dioxide, and nitrous oxide absorbs 270 times more heat per molecule than carbon dioxide. The GWPs for different GHGs are presented in Table 1.
Table 1 Direct and Indirect Green House Gases and its GWP
GHG Name Common Sources Atmospheric Lifetime (years)*
Global Warming Potential
CO2 Carbon Dioxide Fossil fuel combustion, forest clearing, cement production etc.
50-200
1
CH4 Methane
Landfills, production and distribution of natural gas and petroleum, fermentation from the digestive system of livestock, rice cultivation, fossil fuel combustion, etc.
12 21
N2O Nitrous Oxide Fossil fuel combustion, fertilizers, nylon production, manure, etc.
150 310
HFC's Hydro fluorocarbons
Refrigeration gases, aluminum smelting, semiconductor manufacturing, etc.
264
Up to 11,700
PFC's Per fluorocarbons Aluminum production, semiconductor industry, etc.
10,000
Up to 9200
H2 Hydrogen Chloro alkali production etc 100 5.8
The Figure 3 shows comparison of per capita CO2 emission for the top five GHG emitting countries of the world and EU. India—owing to higher population—per capita CO2 emission is the least. However, in terms of absolute emissions India is the third largest CO2 emitting

8
country, behind the US and China (2015) and contributing about 6 % (2.3 Gt CO2) of global emissions (WEO 2015).
Figure 3 Per capita CO2 Emissions
Impacts of Global Warming Rise in Global Temperature Observations show that global temperatures have risen by about 0.6 °C over the 20th century. There is strong evidence now that most of the observed warming over the last 50 years is caused by human activities. The various climate models predict that the global temperature will rise by about 6 °C by the year 2100. Rise in Sea Level In general, the faster the climatic change, the greater will be the risk of damage. The mean sea level is expected to rise 9−88 cm by the year 2100, causing flooding of low lying areas and other damages. Food Shortages and Hunger Water resources will be affected as precipitation and evaporation patterns change around the world. This will affect agricultural output. Food security is likely to be threatened and some regions are likely to experience severe food shortages and hunger. Models also predict an average increase in temperature in India of 2.3−4.8oC for the benchmark doubling of carbon dioxide scenario. It is estimated that 7 million people would be displaced, 5700 km2 of land and 4200 km of road would be lost, and wheat yields could decrease significantly.

9
Due to rising energy demand, India’s CO2 emissions are expected to grow at the rate of 7% and surpass the present EU-28 emissions by 2020. As a part of mitigation effort, India is committed to increase its share of non-fossil energy sources from current 19% to 40% by 2030. However, combustion of fossil fuel will continue to be the single major contributor to the global warming in the coming years and hence the focus is on efforts to opt for renewable energy and enhance energy efficiency.
1.5 OUTLINE OF ENERGY SCENARIO IN INDIA
The energy mix of India for 2013 presented in the pie chart (Figure 4) indicates fossil fuel is the main stay of India’s energy mix.
Figure 4 Primary Energy Demand in India for 775 MTOE
(Source : IEA, 2015)
Industrial energy demand has almost doubled over the 2000-2013 period, with strong growth from coal and electricity. Large expansion in the energy-intensive sectors is anticipated in the future. The present energy consumption in these energy intensive sectors in the country is high compared to the developed world. The major energy consuming sectors in the country are Iron & Steel, Chemicals, Textiles, Aluminium, Fertilizers, Cement & Paper. These sectors account for about 60% of the total energy consumption in industry. The energy consumption in manufacturing is relatively high in India which is reflected in the Specific Energy Consumption (SEC). This, therefore, provides an opportunity to reduce energy consumption and thereby GHG emissions. The typical SECs in different manufacturing sectors is presented in Table 2.
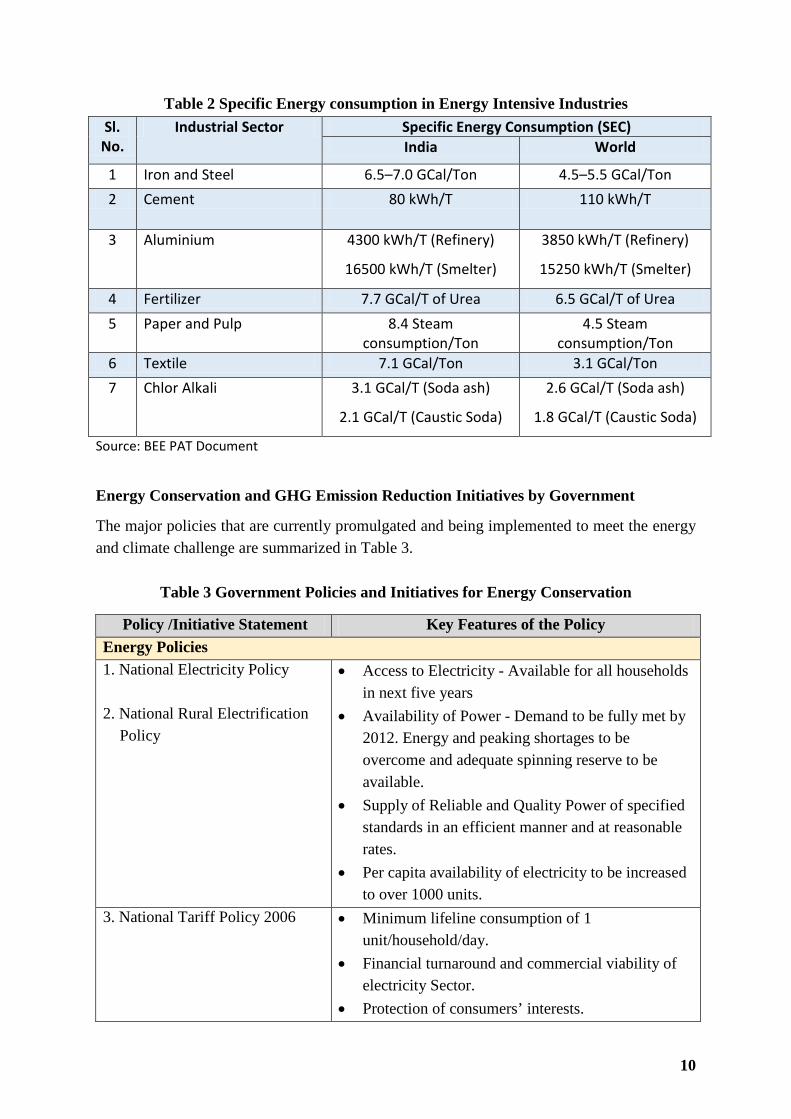
10
Table 2 Specific Energy consumption in Energy Intensive Industries Sl.
No. Industrial Sector Specific Energy Consumption (SEC)
India World
1 Iron and Steel 6.5–7.0 GCal/Ton 4.5–5.5 GCal/Ton 2 Cement 80 kWh/T 110 kWh/T
3 Aluminium 4300 kWh/T (Refinery)
16500 kWh/T (Smelter)
3850 kWh/T (Refinery)
15250 kWh/T (Smelter)
4 Fertilizer 7.7 GCal/T of Urea 6.5 GCal/T of Urea 5 Paper and Pulp 8.4 Steam
consumption/Ton 4.5 Steam
consumption/Ton 6 Textile 7.1 GCal/Ton 3.1 GCal/Ton 7 Chlor Alkali 3.1 GCal/T (Soda ash)
2.1 GCal/T (Caustic Soda)
2.6 GCal/T (Soda ash)
1.8 GCal/T (Caustic Soda)
Source: BEE PAT Document
Energy Conservation and GHG Emission Reduction Initiatives by Government
The major policies that are currently promulgated and being implemented to meet the energy and climate challenge are summarized in Table 3.
Table 3 Government Policies and Initiatives for Energy Conservation
Policy /Initiative Statement Key Features of the Policy Energy Policies 1. National Electricity Policy 2. National Rural Electrification
Policy
• Access to Electricity - Available for all households in next five years
• Availability of Power - Demand to be fully met by 2012. Energy and peaking shortages to be overcome and adequate spinning reserve to be available.
• Supply of Reliable and Quality Power of specified standards in an efficient manner and at reasonable rates.
• Per capita availability of electricity to be increased to over 1000 units.
3. National Tariff Policy 2006 • Minimum lifeline consumption of 1 unit/household/day.
• Financial turnaround and commercial viability of electricity Sector.
• Protection of consumers’ interests.
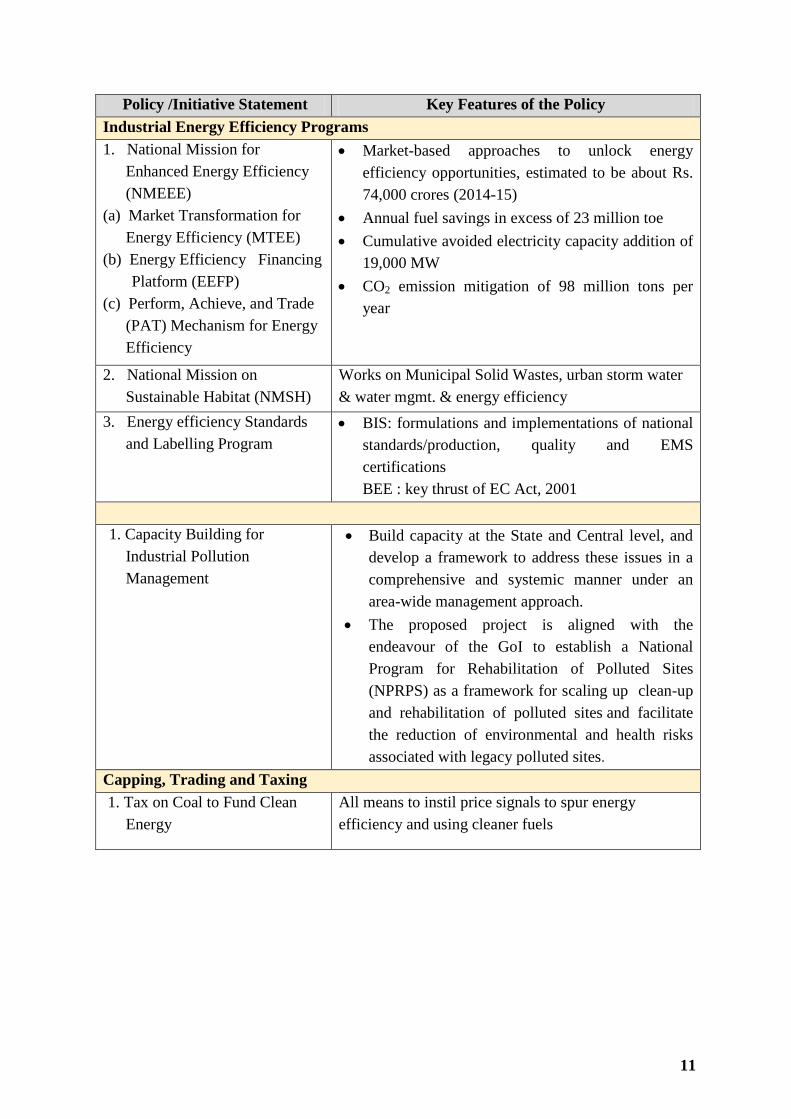
11
Policy /Initiative Statement Key Features of the Policy Industrial Energy Efficiency Programs 1. National Mission for
Enhanced Energy Efficiency (NMEEE)
(a) Market Transformation for Energy Efficiency (MTEE)
(b) Energy Efficiency Financing Platform (EEFP)
(c) Perform, Achieve, and Trade (PAT) Mechanism for Energy Efficiency
• Market-based approaches to unlock energy efficiency opportunities, estimated to be about Rs. 74,000 crores (2014-15)
• Annual fuel savings in excess of 23 million toe • Cumulative avoided electricity capacity addition of
19,000 MW • CO2 emission mitigation of 98 million tons per
year
2. National Mission on
Sustainable Habitat (NMSH) Works on Municipal Solid Wastes, urban storm water & water mgmt. & energy efficiency
3. Energy efficiency Standards and Labelling Program
• BIS: formulations and implementations of national standards/production, quality and EMS certifications
BEE : key thrust of EC Act, 2001 1. Capacity Building for
Industrial Pollution Management
• Build capacity at the State and Central level, and develop a framework to address these issues in a comprehensive and systemic manner under an area-wide management approach.
• The proposed project is aligned with the endeavour of the GoI to establish a National Program for Rehabilitation of Polluted Sites (NPRPS) as a framework for scaling up clean-up and rehabilitation of polluted sites and facilitate the reduction of environmental and health risks associated with legacy polluted sites.
Capping, Trading and Taxing 1. Tax on Coal to Fund Clean
Energy All means to instil price signals to spur energy efficiency and using cleaner fuels

12
Policy /Initiative Statement Key Features of the Policy 2. Renewable portfolio
standards/obligation • Renewable Purchase
Obligation (RPO) under the Electricity Act 2003 is mandated at the state level (discussed below in “National Policies Implemented at the State Level”)
• States can choose to apply the RPS requirement to all its utilities or only the investor owned utilities.
• States can also define what technologies are eligible to count towards the RPS requirements.
3. RECS (Renewable Energy certificate System)
• Aimed at addressing the mismatch between availability of RE resources in state and the requirement of the obligated entities to meet the renewable purchase obligation (RPO)
• Cost of electricity generation from renewable energy sources is classified as cost of electricity generation equivalent to conventional energy sources and the cost for environmental attributes.
• Two categories of certificates, viz., solar certificates issued to eligible entities for generation of electricity based on solar as renewable Cost of Electricity Generation by Renewable Sources Cost Equivalent to Conventional Source Cost for Environmental Attributes energy source, and non-solar certificates issued to eligible entities for generation of electricity based on renewable energy sources other than solar
Subsidies for Energy Conservation 1. Financial incentives through the
Jawaharlal Nehru National Solar Mission
• Creating capacity in the area of solar, wind, bio-mass and other forms of renewal energy generation
• Supports financially as well as technically to promote solar heater other solar applications widely in the country and particularly in the areas where conventional energy is not possible to supply
• Long term energy security • Ecologically sustainable growth • Set target-20,000MW
2. Financial incentives by the Ministry of New and Renewable Energy through the Indian Renewable Energy Development Agency

13
Policy /Initiative Statement Key Features of the Policy Energy Conservation in Buildings and Municipalities Energy Conservation Building Code
• Provide technical support to BEE to implement the ECBC in a rigorous manner
• Develop reference material and documentation to support the Code
• Develop ECBC Training material for workshops and training programs
• Develop a road map for ECBC implementation 1. Municipal Demand-Side
Management
2. State Energy Conservation Fund
Municipal Demand Side Management (MuDSM) is devised to take care of the most common and other issues which are seen as a hurdle by the Municipality to shift itself towards the energy efficient zone from the existing situation of high amount of energy consumption.
Energy Conservation in Agriculture and Forestry Activities Agriculture, forestry, and other land use policies 1. Agricultural Demand - Side
Management (AgDSM) 2. National Mission for
Sustainable Agriculture 3. National Mission for a Green
India
• Consists of those activities, methodologies, awareness, policy and technologies that influence consumer (farmers) behaviour and changes their (farmers) consumption patterns.
• The objective of the AgDSM programme is to reduce peak demand, shift the time during which electricity is consumed to off-peak hours and to reduce the total quantum of consumption.
1.6 GHG EMISSION FACTORS
The emission factors considered for calculations in this manual are tabulated in Table 4 (CEA, 2014).
Table 4 GHG Emission Factors
No. Parameter Units Factor
1 Grid Electricity T CO2/MWh 0.82
2 CPP Electricity
a) Coal Fired T CO2/MWh 1.03
b) Diesel Fired T CO2/MWh 0.62
c) Gas Fired T CO2/MWh 0.49
3 Coal (Sub-bituminous) kg CO2/TJ 96100
4 Gas/ Diesel kg CO2/TJ 74100
Source :CO2 database, CEA, Ver. 10, 2014, IPCC Guidelines, 2006
14
2. CEMENT SECTOR PROFILE
2.1 INTRODUCTION
The Indian cement industry is the second largest producer in the world accounting for about 6% of the World’s cement production, with installed capacity of around 390 MTPA and annual production of 270 MTPA in 2014-15. To meet the Govt. plans on development of highways, smart cities, affordable housing and other infrastructure, the projected demand for cement in 2019–2020 is 415 MTPA, implying installed capacity of at least 460 MTPA at 90 % utilization. The Indian cement industry is expected to continue its fast-paced growth and attain installed capacity of 850 MTPA a by 2030 and 1350 MTPA by 2050. There are 178 (DIPP, 2012) large cement plants accounting for 97% of the total installed capacity of the country with 365 small plants accounts for the list. Per-capita cement consumption in India is 190 kg which is much lower than the world’s average of around 396kg. Average kiln capacity is currently 4500 TPD, with the largest kilns reaching a capacity of 13500 TPD. Small cement plants in India account for a small share of the total installed capacity (less than 5%). Availability of fly-ash (from thermal power plants) and use of advance technology has increased production of blended cement. The environment-friendly blended cement is more cost-efficient to produce, as it requires lesser input of clinker and energy.
2.2 TYPES OF CEMENT PRODUCED IN INDIA
The different types of cement are manufacturing to cater various needs of the customers. • Portland Blast Furnace slag cement • Sulphate Resisting Portland cement • Rapid Hardening Portland cement • Ordinary Portland cement (OPC) • Portland Pozzolana cement (PPC) • Oil Well Cement • Clinker Cement • White Cement

15
Apart from these, some of the other types of cement available in India can also be classified as:
− Low heat cement − High early strength cement − Hydrophobic cement
− High aluminium cement − Masonry cement
2.3 ENERGY CONSUMPTION OVERVIEW
Cement industry is an energy intensive industry and third largest coal consumer in the country after power and steel industry requiring both electrical & thermal energy for its operation. Cement industry accounts for around 10% of the coal and 6% of the electricity consumed by the Indian industrial sector. Energy cost is considered as a major factor in pricing of the cement. On an average, cement plants spend about 35 – 50% of the total manufacturing cost of cement to meet their energy demands. Around 25% of the manufacturing cost is spent on raw materials for cement manufacturing. The rest of the cost is shared among the manpower and factory overheads. The cost break-up in cement manufacturing is shown in Figure 5.
Figure 5 Break-up of Cement Manufacturing Costs
Cement manufacturing is an energy-intensive process. The kiln process consumes around 90 percent of the cement manufacturing energy. The remaining 10 percent is consumed in almost equal amounts by activities related to fuel and raw materials preparation, grinding of clinker and the blending of materials to prepare the finished cement product.

16
Electrical Energy
Modern cement plants on an average consume about 78 kWh2
of electrical energy for producing one Ton of cement. Cement plant requires electrical energy to its mill drives (kiln, coal mill, cement mill), fans, conveyors, packers and for lighting systems. Kiln and mills are major electrical power consuming areas of the cement plant consuming about 60% of the total electrical energy requirement. For older cement plants, the energy consumption is normally in the range of 80-100 kW per Ton of cement. The typical section wise electrical energy consumption is shown in Figure 6
Figure 6 Break-up of Electrical Energy Consumption
Source: (CMA, 2015)
Thermal Energy
The cement industry relies heavily on carbon-intensive fossil fuels. Coal and petroleum coke products are mostly used as primary fuel to burn raw mix. Liquid petroleum products like HSD is used only during start-up of the kiln while tire-derived fuels, solid waste, liquid waste and other alternative energy sources are also being used to reduce the primary fuel i.e. coal consumption. On an average, Indian cement plants requires 726 kcal/kg clinker of thermal energy for producing one kg of clinker. The major use of thermal energy is in the kiln and pre-calciner systems. Thermal energy is needed for the raw meal processing specifically for converting the raw mix to clinker. Pyro processing—conversion of raw meal to clinker— is the most energy concentrated stage in cement production. The number of stages in the pre-heater system has major bearing on the thermal energy consumption in kiln system. Continuous technological upgradation and assimilation of latest technologies have been steady increasing
2 14th NCB International Seminar on Cement and Building Materials
31
30
26
7
4 2 Kiln and Cooler
Cement Mill
Raw Mill
Others
Coal Mill
Crushing

17
in the cement industry. Today 99% of the plans use dry process technology compared to 6% in 1960. Indian cement industry has always been a trend setter for adopting the best available energy efficient technologies. The best thermal and electrical energy consumption presently achieved in India is 670 kcal/kg clinker and 68 kWh/T cement. The specific energy consumption of the Indian cement plants has been reducing with continuous up-gradation of technologies and the change in process technologies. The Table 5 shows the progressive reduction in specific energy consumption by Indian cement Industry (CII.2015).
Table 5 Heat and Power Consumption Trends
Parameters Year
1950-60 1970s 1980s 1990s Post 2000 Heat Consumption (kcal/kg clk)
1300-1600 900-1000 800-900 750-800 650-750
Power Consumption (kWh/MT cement)
115-130 110-125 105-115 95-105 80-100
Source : CII, 2015
2.4 VARIOUS SOURCES OF GHG EMISSIONS IN CEMENT SECTOR
About 30 to 40% of CO2 emissions are produced by burning fossil fuels, mainly to reach the required high temperatures in the kiln and associated equipment. The remaining 10% of CO2 emissions result from transportation and the generation of electricity necessary for other plant processes. About 50 to 60% of cement production−related CO2 emissions are generated during the decomposition of limestone and other calcareous material to produce clinker. Emissions related to clinker production are difficult to reduce because production of clinker (cement intermediary) is produced with calcination of lime that releases CO2. The thermal energy required for calcination is provided by coal/lignite. The various GHG emitting processes are as follows. • The clinker production through calcination emits 525 kg CO2 / t clinker (as per IPCC
default value). • Use of fossil fuel in the kiln for calcination of lime to cement clinker is one of the key
energy input. The cement plants in India are operating with a thermal specific energy consumption (SEC) ranging between 658 – 1269 kcal/kg clinker. Based on data collected

18
from 10 plants, the thermal SEC is around 767 kcal/kg clinker on average which translate into 308 kg CO2 / t clinker based on emission factor of 0.402 kg CO2 / kcal.
• The electricity consumption varies from 67 kWh/t cement for the best plant and over 100
kWh/t cement for older plants with inefficient technologies. The average power consumption is 73.6 kWh/t cement based on data received from 10 cement plants. This electrical input translates to 0.0604 t CO2 / t cement.
• The overall GHG for ton of cement depends on clinker factor (i.e. fraction of clinker used in one unit of cement production). The following table details the GHG computation based on clinker factor of 0.75.
The GHG emission factors for energy use are given in Table 6.
Table 6 GHG Emission Factors
Calcination kg CO2/t clinker 525 t CO2/t cement 0.394
Thermal SEC kcal/kg clinker 767
kg CO2/t clinker 309.868 t CO2/t cement 0.232
Electrical SEC kWh/t cement 73.600 t CO2/t cement 0.0604
Total GHG t CO2/t cement 0.687 Energy related GHG t CO2/t cement 0.292 Proportion of CO2 from Energy use % 43 Proportion of CO2 from calcination % 57
As may be seen from Table 5, 687 kg CO2/t cement on average is released out of which 57% is from calcination process and balance 43% is from use of energy. While CO2 release from the process cannot be reduced directly as long as lime is used as the raw material, the use of alternate raw materials such as fly ash, petcoke etc would reduce quantity of clinker in cement (denoted by clinker factor) would result in reduced CO2 contribution from the process in cement manufacturing. The SEC shows a wide variation indicating opprtunity for improving energy efficiency and use of alternate fuels in order to reduce GHG emissions from cement manufacturing.
2.5 PRODUCTIVITY ASPECTS AND INDICATORS IN CEMENT SECTOR
Productivity Indicators
Ratio of output to particular inputs may be termed as “partial productivity” measures. There are as many indices of partial productivity as there are factors of production. The most important and most often used are the partial productivity indices of labour and capital respective1y. These indices are:

19
𝐴𝐴𝐴𝐴𝐿𝐿 =𝑄𝑄𝐿𝐿
𝐴𝐴𝐴𝐴𝐾𝐾 =QK
Where,
APL and APK are average productivity of labour and capital
Q is the total output/value added
L is the labour
K is the capital.
While the partial productivity indices of labour and capital are simply the average product of labour and capital, the total factor productivity, often referred to as the index of “technical progress", is defined as output per unit of all factors of production combined. It is the composite measure of productivity which relates output to all the conventional inputs simultaneously. The concept of total factor productivity defined as the ratio between real product or output and real factor input (a weighted sum of the different inputs).
Labour and Capital Productivity
The term ‘Labour Productivity’ is generally defined as “the ratio of physical amount of output achieved in a given period to the corresponding amount of labour expended”. In any business organization wage payments are directly or indirectly based on the skill and productivity of the workers, therefore labour productivity is considered as the most important factors in productivity computations.
There are many methods to determine labour productivity. One simple method using the above definition is input in terms of cost/expenses and capacity and utilization and input in terms of man-hours.
Determinants of Labour Productivity Growth
Factors such as economies of scale, increasing capital labour ratio and increase in wage rate have considerable influence on labour productivity growth. Generally, more capital-intensive industries are more productive and efficient than the less capital intensive ones.
The productivity growth function is expressed as:
ln (APLG) = á + ln (CAPG) + ln (EMOLG) + ln (GVAG) + u (1)
Where,
APLG = growth of labour productivity
CAPG = growth of capital intensity
EMOLG = growth of emoluments per employee
GVAG = growth of gross value added
u = error term

20
Labour productivity growth is regressed on growth of value added, capital labour ratio and emoluments per worker. A positive and significant relationship is expected between growth of labour productivity and value added. Growth in labour productivity can also be due to increase in capital intensity through the substitution of capital for labour or the availability of more machines per worker. Increase in growth of emoluments per worker could positively influence the productivity of labour, particularly where emoluments paid are very low.
Some suggestions for cost reduction and performance improvement and improving business effectiveness include,
• Control over operating expenses and cost of goods sold. • Maximize capacity utilization to reduce overheads. • Reduce interest burden and increasing own funds • Use long-term funds to finance core current assets. • Prefer plant location close to raw materials
PAT Targets for Cement Sector Cement sector has been categorized on the basis of their product/process in to seven subsectors i.e. Portland Pozzolana Cement(PPC), Ordinary Portland Cement(OPC), Portland Slag Cement (PSC), Wet Plants, White Plants, Grinding Plants and only Clinkerization Plants. The total reported energy consumption of all the designated consumers put together is about 15.01 MTOE in the baseline year. The threshold limit of 30000 TOE has been defined in PAT for cement sector, and 85 nos. of designated consumers have been identified out of total 148 cement plants existed during 2007-08. PAT Target Status By the end of the first PAT cycle, the energy savings of 0.816 MTOE /year is expected to be achieved, which is around 12% of total national energy saving targets assessed under PAT (BEE, 2012). It is estimated that 3 Million tons of GHG equivalent emissions would be reduced at the end of PAT cycle-1. However, since it is expected that the cumulative GHG reduction for all 85 cement plants of PAT cycle-1 would exceed 5 Million tonnes of CO2 which is more than the PAT target, BEE has notified more cement plants as part of PAT cycle-2. The proposed target would be around 7% keeping in view India’s commitment for GHG reduction through INDCs.

21
A sample of targets achieved by cement plants with their energy reduction and Equivalent GHG reduction as part of PAT cyle-1 is given in Table 7.
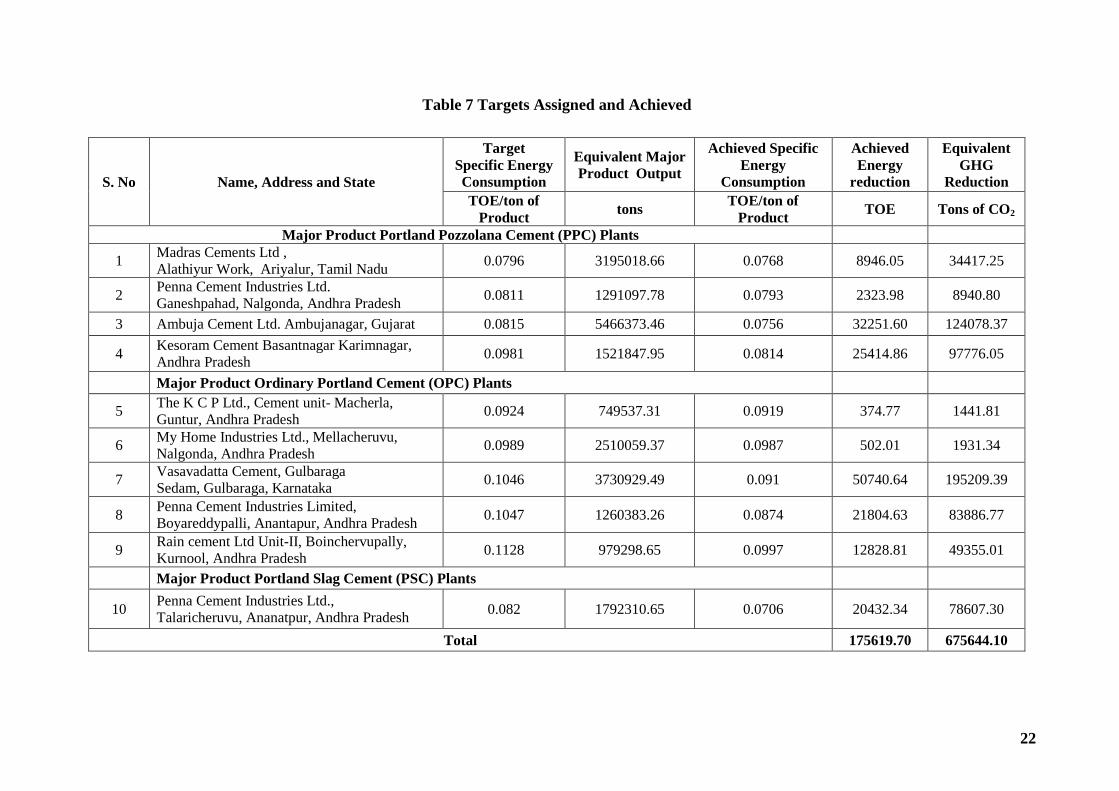
22
Table 7 Targets Assigned and Achieved
S. No Name, Address and State
Target Specific Energy Consumption
Equivalent Major Product Output
Achieved Specific Energy
Consumption
Achieved Energy
reduction
Equivalent GHG
Reduction TOE/ton of
Product tons TOE/ton of Product TOE Tons of CO2
Major Product Portland Pozzolana Cement (PPC) Plants
1 Madras Cements Ltd , Alathiyur Work, Ariyalur, Tamil Nadu 0.0796 3195018.66 0.0768 8946.05 34417.25
2 Penna Cement Industries Ltd. Ganeshpahad, Nalgonda, Andhra Pradesh 0.0811 1291097.78 0.0793 2323.98 8940.80
3 Ambuja Cement Ltd. Ambujanagar, Gujarat 0.0815 5466373.46 0.0756 32251.60 124078.37
4 Kesoram Cement Basantnagar Karimnagar, Andhra Pradesh 0.0981 1521847.95 0.0814 25414.86 97776.05
Major Product Ordinary Portland Cement (OPC) Plants
5 The K C P Ltd., Cement unit- Macherla, Guntur, Andhra Pradesh 0.0924 749537.31 0.0919 374.77 1441.81
6 My Home Industries Ltd., Mellacheruvu, Nalgonda, Andhra Pradesh 0.0989 2510059.37 0.0987 502.01 1931.34
7 Vasavadatta Cement, Gulbaraga Sedam, Gulbaraga, Karnataka 0.1046 3730929.49 0.091 50740.64 195209.39
8 Penna Cement Industries Limited, Boyareddypalli, Anantapur, Andhra Pradesh 0.1047 1260383.26 0.0874 21804.63 83886.77
9 Rain cement Ltd Unit-II, Boinchervupally, Kurnool, Andhra Pradesh 0.1128 979298.65 0.0997 12828.81 49355.01
Major Product Portland Slag Cement (PSC) Plants
10 Penna Cement Industries Ltd., Talaricheruvu, Ananatpur, Andhra Pradesh 0.082 1792310.65 0.0706 20432.34 78607.30
Total 175619.70 675644.10

23
Renewable Purchase Obligation Targets for Cement Industry Introduction of Renewable based electricity generation started in India in 1990s. While Government of India continues to promote Renewable power generation through various financial and fiscal instruments, the major shift has come from Renewable Purchase Obligation (RPO) incorporated in Electricity Act (EA) 2003. The Act lays responsibility on State Electricity Regulatory Commissions (SERCs) to specify percentage of Electricity to be purchased out of total electricity consumption within its area of distribution licensee. The RPO targets and potential GHG reductions for cement industry is determined based on average specific electricity consumption and production. For the purpose of GHG reduction calculation all India grid emission factor of 0.82 t CO2/MWh is taken despite the plants use most of its electricity from CPPs with higher emission factor. The GHG reductions from RPO is 1.079 MT CO2 based on 2014-15 production as can be seen from Table 8.
Table 8 Target GHG Reduction from RPO
Parameter Units Value
Total Cement Production (2014-15) MTPA 270
Average Electricity Consumption kWh/Ton of Cement 73.6
Total Electricity Consumed MUs 19872
RPO @ 6.62% MUs 1315.17
Avg. all India Grid Emission Factor Ton/MWh 0.82
Total GHG Reduction Targeted from RPO T CO2 1078732
Total GHG Reduction Targeted from RPO MT CO2 1.079
For cement sector, reliance on captive power is much more than grid power. The data from 10 cement plants studied indicates that out of their net electricity requirement (excluding WHR power), captive power constitutes 77% and grid power constitutes 23%. RPO targets and Achievements for 10 cement plants are given in Table 9.
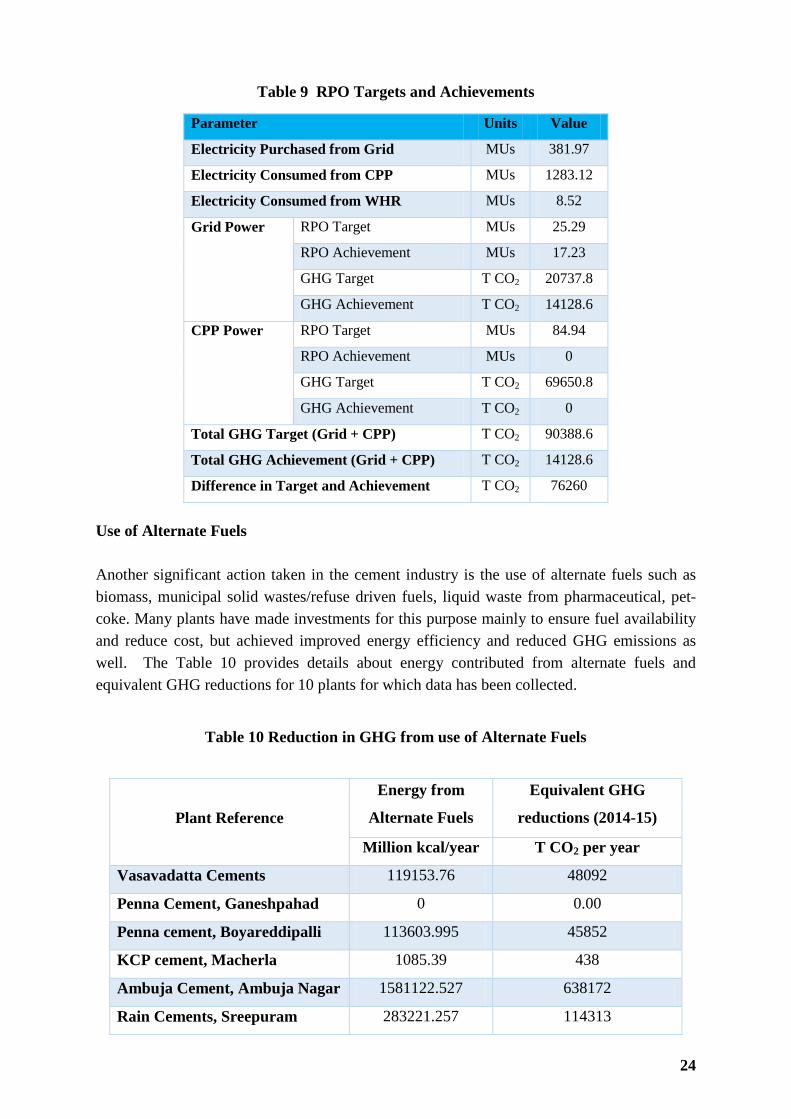
24
Table 9 RPO Targets and Achievements
Parameter Units Value
Electricity Purchased from Grid MUs 381.97
Electricity Consumed from CPP MUs 1283.12
Electricity Consumed from WHR MUs 8.52
Grid Power RPO Target MUs 25.29
RPO Achievement MUs 17.23
GHG Target T CO2 20737.8
GHG Achievement T CO2 14128.6
CPP Power RPO Target MUs 84.94
RPO Achievement MUs 0
GHG Target T CO2 69650.8
GHG Achievement T CO2 0
Total GHG Target (Grid + CPP) T CO2 90388.6
Total GHG Achievement (Grid + CPP) T CO2 14128.6
Difference in Target and Achievement T CO2 76260
Use of Alternate Fuels Another significant action taken in the cement industry is the use of alternate fuels such as biomass, municipal solid wastes/refuse driven fuels, liquid waste from pharmaceutical, pet-coke. Many plants have made investments for this purpose mainly to ensure fuel availability and reduce cost, but achieved improved energy efficiency and reduced GHG emissions as well. The Table 10 provides details about energy contributed from alternate fuels and equivalent GHG reductions for 10 plants for which data has been collected.
Table 10 Reduction in GHG from use of Alternate Fuels
Plant Reference
Energy from
Alternate Fuels
Equivalent GHG
reductions (2014-15)
Million kcal/year T CO2 per year
Vasavadatta Cements 119153.76 48092
Penna Cement, Ganeshpahad 0 0.00
Penna cement, Boyareddipalli 113603.995 45852
KCP cement, Macherla 1085.39 438
Ambuja Cement, Ambuja Nagar 1581122.527 638172
Rain Cements, Sreepuram 283221.257 114313
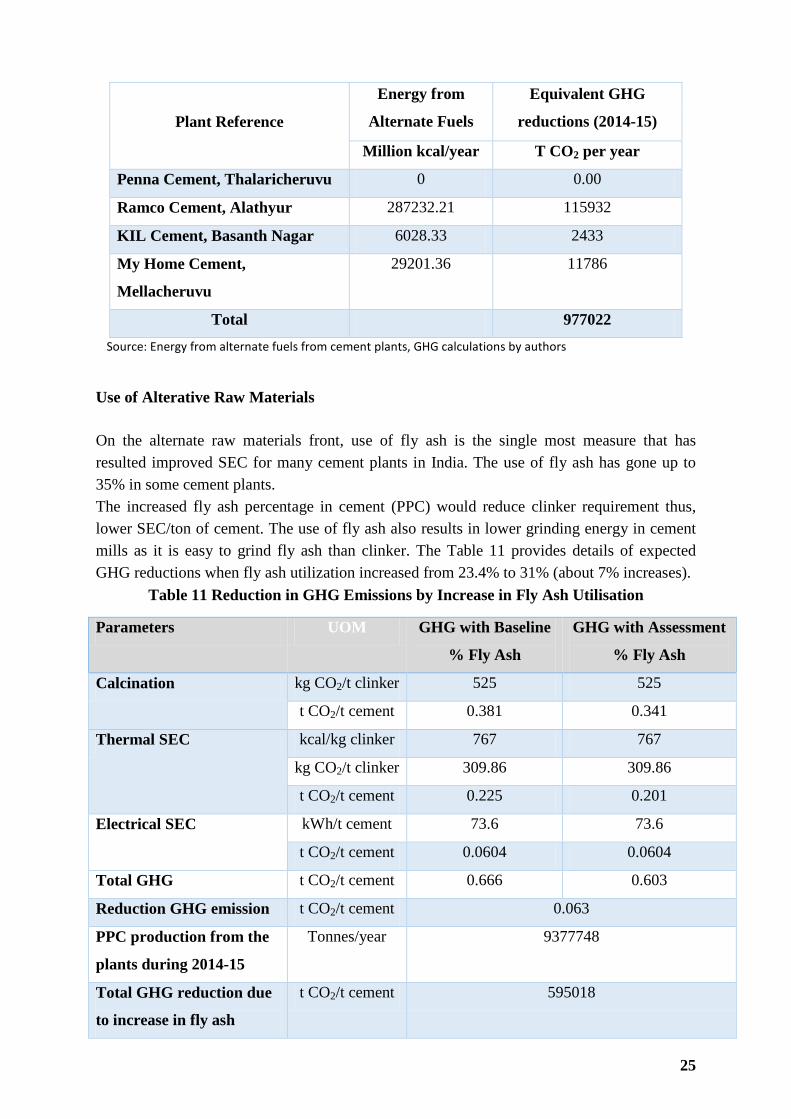
25
Plant Reference
Energy from
Alternate Fuels
Equivalent GHG
reductions (2014-15)
Million kcal/year T CO2 per year
Penna Cement, Thalaricheruvu 0 0.00
Ramco Cement, Alathyur 287232.21 115932
KIL Cement, Basanth Nagar 6028.33 2433
My Home Cement,
Mellacheruvu
29201.36 11786
Total 977022 Source: Energy from alternate fuels from cement plants, GHG calculations by authors
Use of Alterative Raw Materials On the alternate raw materials front, use of fly ash is the single most measure that has resulted improved SEC for many cement plants in India. The use of fly ash has gone up to 35% in some cement plants. The increased fly ash percentage in cement (PPC) would reduce clinker requirement thus, lower SEC/ton of cement. The use of fly ash also results in lower grinding energy in cement mills as it is easy to grind fly ash than clinker. The Table 11 provides details of expected GHG reductions when fly ash utilization increased from 23.4% to 31% (about 7% increases).
Table 11 Reduction in GHG Emissions by Increase in Fly Ash Utilisation
Parameters UOM GHG with Baseline
% Fly Ash
GHG with Assessment
% Fly Ash
Calcination kg CO2/t clinker 525 525
t CO2/t cement 0.381 0.341
Thermal SEC kcal/kg clinker 767 767
kg CO2/t clinker 309.86 309.86
t CO2/t cement 0.225 0.201
Electrical SEC kWh/t cement 73.6 73.6
t CO2/t cement 0.0604 0.0604
Total GHG t CO2/t cement 0.666 0.603
Reduction GHG emission t CO2/t cement 0.063
PPC production from the
plants during 2014-15
Tonnes/year 9377748
Total GHG reduction due
to increase in fly ash
t CO2/t cement 595018

26
Parameters UOM GHG with Baseline
% Fly Ash
GHG with Assessment
% Fly Ash
utilisation
Energy related GHG t CO2/t cement 0.285 0.262
Proportion of CO2 from
Energy use
% 42.81 43.41
Proportion of CO2 from
calcination
% 57.19 56.59
Source: Fly ash & PPC production data from cement plants and calculations by authors.
As seen from the above data that when fly ash utilization increased by 7%, the GHG emissions are reduced by about 10%. Thus, making fly ash available to cement plants is one of the key factors in GHG reduction.

27
3. CEMENT MANUFACTURING PROCESS
3.1 OVERVIEW OF CEMENT PRODUCTION
Cement manufacturing involves mining of the raw material, crushing, pre-blending, raw material & coal grinding, pyro-processing, clinker grinding and cement packing. The raw materials required for cement manufacturing process are extracted through mining. The extracted material is crushed in primary and secondary crushers to get the required size for further processing. The crushed material is pre-blended and then is transported to grinding operations.
In grinding operation material is ground to the required fineness and sent to pyro-processing section for burning to form clinker. The clinker is transported to clinker grinding operation where it is ground with about 5% of gypsum to form cement.
The final product cement is stored in cement silos and then sent to packing plant. Cement is transported by rail/ road or by ship to various destinations.
A typical process flow sheet is given in Figure 7

28
Figure 7 Process flow sheet of a typical Cement Plant

29
3.2 TYPES OF PROCESS
The main process prevalent in cement industry is dry process where the raw material is in dry powder form unlike older wet process where raw material is in slurry form. The main equipment in a cement plant is the rotary kiln where most of the reactions take place. The rotary kiln in dry process can be of the following types: • The long dry process rotary kiln without internal installation. • The long dry process rotary kiln with internal heat exchangers, such as chains, refractory
bridges, etc., • The short dry process rotary kiln working in conjunction with pre-heaters, such as
suspension pre-heaters or lepol kiln. • The dry process rotary kiln with waste heat boiler.
From Table 12, it can be seen that earlier long wet process /dry process kilns the capacity was 0.45-0.8 TPD/m3 where as the latest short pre-heater/pre-calciner kilns the capacities are > 3.5 TPD/m3. Wet process kilns consumes around 1300-1650 kcal/kg clinker when compared to dry process kiln where thermal energy is around 700-850 kcal/kg clinker thereby gaining a net savings on fuel combustion and thereby reduction in CO2 generation.

30
Table 12 Comparison of Different Kiln Systems
KILN SYSTEMS RPM TPD/m3 L/D kcal/kg kWh/t Residence
time, min
Kiln system
exit T, °C
∆P,
MM H2O
Exit gas,
NM3/KG
CLINKER
LONG WET 1 0.45- 0.8 30-35 1300-1650 17-25 180-240 150-230 150-180 3.4
LONG DRY 1 0.5-0.8 30-35 1100-1300 20-30 180-240 380-400 150-200 1.8
LEPOL 1.5 1.5-2.2 12-15 950-1200 20-25 30 100-120 250-400 2.0
CYCLONE
PREHEATER
2.0 1.5-2.2 14-16 750-900 25 30-40 350 500-700 1.5
PRE-CALCINER 3.6- 5.0 3.5-5.0 14-16 700-850 25 20-30 280-360 500-700 1.4

31
3.3 RAW MATERIALS
Raw material required for cement manufacturing are calcareous materials (source of lime) mostly limestone and argillaceous materials (source of silica, alumina and iron oxide) mostly clay or shale. The raw materials (raw mix) are heated using coal in the kiln to a high temperature and coal ash is absorbed by the clinker and becomes one of the raw materials.
3.4 CRUSHING
Cement raw materials blasted in the quarry are reduced in size for further processing. The size reduction is carried out in crushers and grinding mills. Crushing is size reduction in coarse range whereas grinding refers to size reduction in fine range. Crushers are used to reduce the particle size from 1200 mm to about 80 / 20mm. The crushing may be completed in one or more stages. The following equipment for size reduction in coarse range are used: • Jaw crushers • Gyratory crushers • Roll crushers
3.5 PRE-HOMOGENISATION
Pre-homogenisation of raw materials— for limestone and clay— is carried out in cases where the raw material chemical composition varies greatly. With the increasing variation in the grades of coal used for coal firing installations, there is a growing need for pre-homogenisation and storage of coal. Stacker and Reclaimer systems are used for both pre-homogenisation and buffer storage and designed for heavy-duty operations. The stackers and reclaimers are controlled by state-of-the-art PLC-based technology designed for fully automatic operation.
3.6 GRINDING
Grinding mills are used for raw material, coal and clinker grinding. About 75% of the plant electrical energy is consumed by grinding operation alone. The types of grinding mill are of the following:
• Ball Mill • Vertical Roller Mill • Roller Press

32
Ball Mills
Ball or tube mills are horizontally rotating steel cylinders where size reduction of the mill feed is performed by motion of the grinding media. Rotation of the mill cylinder raises the pile of mill feed and grinding media to an optimum height, necessary for grinding operation. Grinding is performed by impact and friction between the grinding balls which hit one against another, as well as between the grinding media and the mill lining itself. Ball mill circuits for raw meal, coal and clinker grinding are of the following types: • Open circuit • Closed circuit • Air swept
Open circuit The material to be ground passes once through the ball mill. Open circuit mills are used only in cement grinding. Open circuit mill is used for cement grinding. Closed circuit The material discharge from the mill is separated by classifying into fines and coarse particles. The fines are taken out as product and the course is being return to the ball mill for further reduction. Closed circuit mill is used for raw material grinding. Air swept In air swept ball mill the air/gas velocity is kept high enough to extract ground material from the mill. The extracted material is separated in dust collectors. Air swept mill is used for coal grinding. Vertical Roller Mills
The Vertical Roller mills use pressure and shear generated between the rollers and the rotating table to crush and grind materials. Feed material is directed on to the grinding table by the feed chute. The rotation of the grinding table accelerates the material towards the grinding track and passes it under the rollers.
Partially ground material passes over into the hot gas stream and the moisture in the materials is evaporated almost immediately while the finer portion of material is carried by the gas stream to a separator. The separator allows material that has reached the required fineness to leave the mill, while it rejects oversized material and sends it back to the table for further grinding.
Vertical Roller Mill (VRM) for Coal Grinding
Air-swept vertical roller mill is widely used for coal grinding installations. It can dry all types of coal, while providing excellent economy in terms of specific energy consumption. Equipped with the high-efficiency dynamic separator, the VRM coal mill will grind any type of coal to the required fineness at the highest efficiency. When provided with a

33
variable speed mill motor, the VRM will also grind pet coke and anthracite down to fineness below 5% +90 μm. Vertical Roller Mill for Raw Meal Preparation
The operating principle for raw meal grinding is similar to that coal grinding. The features are the following:
• From very easy-to-grind to very hard-to-grind material – roughly from less than 3 kWh/t to more than 11 kWh/t.
• From less than 1% moisture to more than 20% moisture in feed material • From non-abrasive to very abrasive materials. • From non-sticky to very sticky feed material.
Fan System There are a number of arrangements for raw material grinding systems involving vertical roller mills. However the most common solution today is the so called three-fan system. The three-fan system provides the best operational control with less interaction between operation of mill and kiln respectively. The three-fan system uses cyclones to de-dust the mill vent gas. This arrangement reduces the operating suction and usually also the gas volume for the filter, which may be either electrostatic precipitator or bag house filter.
As the mill requires significantly more gas than supplied by the kiln, a certain part of the gas flow is guided from the mill fan through the recirculation duct back to the mill. The raw material feeding system is equipped with a magnet separator and metal detector for protection of the mill parts. In case the raw material is significantly contaminated with metal, an optional secondary refinery system can be adopted. OK Vertical Roller Mill for Cement Grinding The OK series is the premier roller mill for finish grinding of Portland cement, slag, and blended cements. Vertical roller mills use 30-50% less energy than ball mill systems. It has low footprint and reduces civil construction costs. Excellent drying makes the mill well suited for grinding blast furnace slag or blended cements from one or more wet components. Table 13 shows the electrical energy saving potential when VRM is used over a conventional ball mill when cement is ground.

34
Table 13 SEC for VRM and Ball Mills
Specific Energy Consumption (kWh/t)
Portland Cement Slag*
3300 4000 4000 5000
OK
Mill
Ball
Mill
OK
Mill
Ball
Mill
OK
Mill
Ball
Mill
OK Mill Ball
Mill
Mill 17.6 34.2 21.3 44.9 25.7 51.8 32.2 71.1
Fan etc. 6.9 3.2 8.3 4.9 9.4 7.6 13 12.3
Total 24.5 37.4 29.6 49.8 35.1 59.4 45.2 83.4
*Slag with 8% moisture Source :( FLS Brochures)
Roller Press
In roller press (Figure 8), comminution of the material is effected under extremely high pressure in the gap between two contra rotating rollers. The material fed in between two rollers is completely fractioned and leaves the pair of rolls as a tightly packed cake. Roller presses are normally used particularly in upgrading the existing ball mill circuits either to increase production or to reduce specific power consumption. High-pressure roller grinding of cement clinker and hard brittle materials is a modern and very energy-efficient process.
Figure 8 Roller Press
Separators
In the closed circuit operation, separators are used to separate the fine particles to qualify as “finished product” from the coarser particles (oversize) in the product discharged from the grinding mill. In the dry system of closed-circuit grinding the separation is effected in devices called as the air separator.

35
Types of Separators
• Static air separator • Dynamic air separator • Cyclone air separator • High efficiency Separators
3.7 PYROPROCESSING
In pyro process, the raw mix is burnt to about 14500C in the kiln to form clinker, which passes through the grade cooler. The outlet temperature of clinker is around 70-1000C.
The Figure 9 shows the pyro processing comprising pre-heater, pre-calciner, kiln and cooling system.
Figure 9 Pre-heater, Pre-Calciner, Kiln and Cooler System
Dry Process Kiln System
In modern cement plants, raw meal is preheated to calcination temperature in a multi-stage cyclone preheater and most of the calcination process takes place in a separately fired calciner. The remaining calcination and clinkerization process takes place in a short length-to-diameter rotary kiln without internals.

36
In pre calcination kilns calcining of the raw mix is performed separately in a calciner. The supply of fuel is divided between two firing units one burner in kiln and the other in suspension preheater. The combustion air for pre-calciner is drawn through separate duct from cooler. There are different types of pre-heater / pre-calcinator systems available like 4 stage and 5 stage with inline calciner or separate line calciner of FLS system. The advantages of 6 stage pre-heater over 4 stage and 5 stage preheater is that even though there is slight increase in pressure drop and power consumption there is a considerable reduction in thermal energy as shown in Table 14.
Table 14 Performance of Different Pre-heater Systems
Parameters 4-STAGES 5-STAGES 6-STAGES
Pressure drop across preheater and
calciner
100% 114% 127%
Fuel consumption 100% 97% 95%
Preheater id-fan specific power
consumption
100% 104% 111%
Installed cost of the pyro processing
system
100% 111% 122%
Rotary Kiln Firing Burners are used for firing different types of fuels in the kiln. The different types of burners used range from simple single-tube burner modern multi-channel burners. The multi-channel burners offer better flame shape control because of separate primary air channels. Dual-fuel Burners Dual-fuel burners use pulverised coal or coke, oil, natural gas or any mixture of these fuels. The burner may be fitted with extra ducts for secondary fuels such as plastic chips, wood chips, sewage sludge, etc. Standard types are available for any fuel combination and a maximum capacity ranging from 20 to 250 MW, catering for even the largest of rotary cement kilns. The key benefits include low primary air combustion, central fuel injection and adjustable air nozzle area.
3.8 COOLERS
Coolers are used to transport clinker from the kiln to the clinker delivery system. The clinker cooler serves to cool clinker from 14000C at which it leaves the kiln to less than

37
1000C by exchange of heat with ambient air which is thereby preheated before entering the kiln or pre-calciner as combustion air. Types of Coolers • Rotary cooler • Planetary cooler • Reciprocating grate cooler Rotary Cooler
The rotary cooler consists of a revolving cylinder, following the rotary kiln. Rotary kilns of 60 - 90 m length are supplied with rotary coolers of 2 - 5 m diameter and 20 - 50 m length. The slope of rotary coolers is in the range from 4-7º to the horizontal; they are mostly arranged in opposition to the kiln's slope, since they are frequently located underneath the rotary kiln. Rotary coolers are operated with revolutions in the range from 0 to 8 rpm. About to 70% of the drum's length is refractory lined. Rotary coolers are supplied with flights for lifting and dropping the clinker to get a thorough contact with the cooling air, and thus to increase the efficiency of the cooler.
The negative pressure in the rotary kiln induces suction of cold air through the open end of the rotary cooler; the cooling air passes the rotary cooler in cross-current to the motion of the clinker. The temperature of the cooling air entering the rotary kiln is about 400-750°C.
The clinker leaving the rotary kiln with a temperature of 1300 – 1350°C enters the rotary cooler. The temperature of the clinker leaving the rotary cooler is in the range of 150-300°C.
Planetary Cooler
The planetary coolers consist of several, mostly 10 or 11 sheet metal cylinders arranged along the circumference of the hot kiln end, forming an integral part of the rotary kiln. These coolers revolve together with the rotary kiln, with separate drive. The cooling tubes are refractory lined, up to about 25 % of their length; for better heat transfer, the remainder of the length is supplied with chains or flights. Cooling occurs cross-currently. The total cooling air enters the kiln as combustion air. The motion of the clinker in the planetary coolers is mostly parallel to the motion of the clinker in the rotary kiln; however, there are also satellite coolers supplied with internal construction, capable of conveying the clinker in the opposite direction.
In this cooler tubes are mounted on the kiln shell and they rotate along with the kiln. The clinker leaving the kiln enters the cooler tubes wherein it is cooled before leaving the cooler.

38
Grate Cooler
The clinker grate cooler with air quenching effect, also known as the Fuller-cooler, is operated in conjunction with the rotary kiln. Fuller grate cooler
The objective of Fuller cooler is to improve cement quality resulting from rapid cooling of the clinker as well as provide good heat exchange between the hot clinker and the cooling air.Compared to the rotary cooler, the Fuller cooler as such requires about 20 % less space. The Fuller cooler enables complete control of the secondary air and the clinker temperature. The heat losses of this cooler by radiation and convection are extremely low.
The Fuller cooler develops a fast initial cooling of the clinker; this fact is of great importance for the formation of tri-calcium silicate. This cooler allows for clinker input temperatures of about 1360 - 1400 ºC, which increases the thermal efficiency up to 72-75 %. The application of excess cooling air results in cooling of the clinker down to 65 °C this temperature allows an immediate grinding of the clinker to finished cement.
In contrast to the rotary and planetary coolers where cooling of clinker is predominantly performed by transverse air current the Fuller cooler, cools with a combination of cross-current and counter-current air.
The comparison between conventional grate coolers vs. modern grate coolers is presented in Table 15.
Table 15 Comparative Ranges of Process Design Parameters
Conventional Grate
Coolers
Modern Grate
Coolers
Clinker loading (tpd / m2) 35 – 50 50 - 65
Cooling air requirement (Nm3/kgcl) 2.2 – 2.6 1.5 - 1.9
Maximum air velocity(Nm3/m2/sec) 1.15 - 1.55 1.15 - 1.55
Source : Training Notes, NCCBM
Compared to conventional grate coolers, modern coolers have higher clinker loading with low cooling air requirement thereby saving in power consumption of cooler fans and cooler efficiency is higher.

39
Table 16: Heat Recuperation in Conventional and Modern Coolers
Cooler Type Clinker
Temp.0C
Cooler Loss
kcal/kgcl
Avg. Air
Temp. 0C
Low Efficiency Grate Cooler 675 155 840
Good conventional Grate Cooler 560 125 930
Cooler based on air beam technology 475 105 1000
Cooler based on improved air beam
technology/ full static grate.
390 85 1065
Source : Training Notes, NCCBM
40
4. BEST PRACTICES
4.1 WASTE HEAT RECOVERY SYSTEM
The adoption of waste heat recovery systems in Indian cement manufacturing facilities has been relatively slower compared to its global peers. Out of over 190 large cement plants in the country, only about 20 cement plants have adopted WHR systems. Estimates indicate that the waste heat recovery potential in Indian cement industry is close to 500 MW while the installed capacity till date is only about 275 MW. This indicates the huge opportunity for adoption of waste heat recovery in Indian cement industry. In case of dry process cement plants, nearly 40% of the total heat input is available as waste heat from the exit gases of the pre-heater and cooler. The quantity of heat from pre-heater exit gases ranges from 180-250 kcal/kg clinker at a temperature range of 300-400°C. In addition, 80-130 kcal/kg clinker heat is available at a temperature range of 200-300°C from the exhaust air of the grate cooler. In some cases, it is observed that although the quantity of thermal energy through pre-heater discharge gases of the grate cooler exhaust is high, the quality of such heat is low. These heats have various applications such as drying of raw material and coal or generation of power.
As raw material drying is important in a cement plant, heat recovery has limited application for plants with higher raw material moisture content. Often drying of other materials such as slag or fly ash requires hot gases from the cooler or pre-heater and, in that case, waste heat recovery potential will be further reduced. Power production utilizing hot gases from the pre-heater and hot air from the cooler requires a heat recovery boiler and a turbine system.
Based on the chosen process and kiln technology, 8-10 kWh/t clinker can be produced from cooler exhaust air and 9-12 kWh/t clinker from the pre-heater gases if the moisture content in the raw material is low and if volume of hot gas/air for drying is less. So in total up to 22 kWh/t clinker or up to 25% of the power consumption of a cement plant can be produced by using WHR technologies without changes in kiln operation. Waste heat recovery technology will result in 0.8 – 1.3 kg CO2 reduction in emissions.
4.2 USE OF ALTERNATE FUELS AND BIOMASS
Fossil fuels and raw materials used by Indian cement plants can be replaced to a large extent with AFR. The carbon intensity of the fuel will depend on the extent of usage of AFR in the total fuel used by the cement plant. It is widely accepted that cement kilns are particularly well suited to manage different kinds of wastes by using them as AFR, considering the high temperature and long residence time available in the cement kiln.
41
Life-cycle assessment (LCA) shows that co-processing of waste as AFR in the cement kiln has a much lower environmental impact than disposal through incineration or landfill.
The global average alternative fuel use in the cement industry is currently 4.3% of total thermal energy consumption. In some countries, the average use is as high as 30%, whereas in India the average is 0.6% (IEA and WBCSD, 2013). Typical wastes streams that can be used as AFR in the Indian cement industry include the following:
• industrial wastes;
• pre-processed industrial wastes;
• sorted municipal solid waste (MSW);
• refuse-derived fuel (RDF) from MSW;
• discarded tires and tire chips;
• expired consumer goods e.g. medicines and fast moving consumer goods (FMCG);
• waste oils and solvents;
• non-recyclable plastics, tex 27-30 tiles and paper residues;
• biomass (such as rice husk, coconut shells and groundnut shells);
• effluent treatment sludges from water and
• wastewater treatments plants; and
• Lime sludges from paper and allied industries. Given the wide range of waste that can be used as AFR, and their different moisture and heat content and given the different fuels that can be displaced by the use of alternatives, it is challenging to quantify the impact of AFR on total electrical and thermal energy consumption. However, their use may have an important impact in reducing the carbon footprint of the cement industry. Currently thermal energy consumption accounts for 31 % of the GHG emissions. Even if efforts are taken to replace the conventional fossil fuel with any of the wastes or alternate fuel by at least 10 %, this will result in reducing the emissions by about 22 kg CO2 /MT cement (CII, 2010).

42
4.3 CLINKER SUBSTITUTION
Replacing the clinker with additive materials such as fly ash / blast furnace slag not only reduces the power consumption, but also protects the environment, conserve the limestone and coal as well as reduce the amount of GHG emissions. It is estimated that for every 1% of increase in blended cement production, CO2 emission will be reduced by approximately 2.2 – 6.0 kg per MT of cement keeping all other parameters constant (CII, 2010).
Bureau of Indian Standards (BIS), as per the latest types of specifications of blended cements allows addition of maximum 35 % of fly ash in PPC (Portland Pozzolana Cement) and blast furnace slag to a maximum of 65% in PSC (Portland Slag Cement) subject to meeting other quality requirements such as setting time, compressive strength etc., Currently the fly ash addition in PPC varies between 15% and 32% with an average of 28% as against the maximum allowed norm of 35%. It is estimated that for every 1% of increase in additives in blended cement production, CO2 emission will be reduced by approximately 4.0 – 6.5 kg per MT of cement keeping all other parameters constant (CII, 2010). Several different clinker substitutes can potentially be used in cement, and their relative merits and availability are presented in Table 17.
Table 17 Characteristics of Clinker Substitutes in India
Clinker substitute
Source Characteristics of the blended product compared to OPC
Positive Limiting Fly ash Coal fired
Power plants Higher long-term strength, increased durability, lower water consumption, better workability.
Relatively lower early strength, logistic barriers (distance between other industries and cement plant)
Ground blast furnace slag (GBFS)
Iron and steel Industry
Improved chemical resistance, higher long-term strength
Relatively lower early strength, logistic barriers (distance between other industries and cement plant)
Other Blending materials
Non- ferrous industries, mineral processing industries
Increased durability Relatively lower early strength, presence of minor constituents(e.g. magnesium oxide[MgO]), logistic barriers (distance between other industries and cement plant)
Limestone Limestone deposits
Increased workability, higher long term strength
none
Source :( IEA and WBCSD, 2013)

43
4.4 IMPROVEMENTS IN ELECTRICAL & THERMAL ENERGY CONSUMPTION
Adopting the latest technologies, actively participating in the energy conservation activities and implementing the projects will result in further reduction of specific power and thermal energy consumption of Indian cement industry.
It is estimated that for every 1 kW/MT of cement reduction in specific power consumption, CO2 emission will be reduced by approximately 0.9 – 1.6 kg CO2 per MT of cement and for every 10 kcal / kg clinker reduction in specific heat consumption, CO2 emission will be reduced by approximately 2.6 – 3.6 kg per MT cement (CII, 2010).
4.5 PRODUCING COMPOSITE CEMENT
One of the latest trend & recent development in the cement industry is to produce composite cement where in clinker is replaced with both blast furnace slag and pozzolonic material like fly ash. Composite cement will have the best properties of cement like low heat of hydration, resistance against chemical attack with the equivalent strength portion. Producing composite cement ensures reduction in specific energy consumption, complete utilization of waste and conservation of limestone and hence greenhouse gas emission reduction. Composite cement can have the highest cement to clinker ratio as high as 3.33 as the cement can be made from 30 % clinker (CII, 2010). Currently there is no quality standard for producing such type of cement in India. EN 197 - 1: 2000 cement type V has two composite cements with the following cement composition (Table 18) comprising higher percentages of blast furnace slag and Pozzolana or fly ash.
Table 18 Composition of Composite Cements
Composition of Composite Cements under EN 197 – 1 : 2000
Cement Cement
Notation
Clinker
content %
Blast Furnace
Slag %
Pozzolana/
Fly Ash %
Gypsum %
Composite
cement
CEM VA 40-64 18-30 18-30 0-5
Composite
cement
CEM VA 20-39 31-50 31-50 0-5
Source :( CII, 2010)

44
4.6 LIMESTONE BASED CEMENT/LOW CARBON CEMENT
Bureau of Indian Standards (BIS) which controls the standards for various types of cements produced in the country, has allowed up to 5 % of limestone/slag/ similar material addition in cement. Presently many cement plants are not adding the filler due to more focus on higher one day strength requirements to maintain competition. The one day strength does not improve quality of construction as a whole and results in higher specific power consumption and reduces the additives. Considering the fact that normal household constructions do not require high grade cement, using limestone (up to 20%) in cement can reduce energy consumption and GHG emissions. It is estimated that increasing the addition of limestone in OPC as filler from the existing level by 10% will result in GHG reduction of 25.0 kg CO2 /MT cement (CII, 2010). A number of low carbon or carbon-negative cements are currently being developed by some companies that expect to build pilot plants in the near future. The physical properties of these cements appear to be similar to those of OPC, and hold equally strong potential for the global and Indian cement industries. These new processes are still at the development stage, but are advancing steadily (IEA and WBCSD, 2013). • AETHER CLINKER PROJECT aims to develop a new class of lower-carbon
clinkers to be used in cement production. The clinker can be made in existing cement plants (after certain process adaptations have been made) with the same raw materials but, crucially, needs less energy. Aether cements are expected to offer similar performances to conventional OPC in various concrete applications, but trials are still underway. During the first industrial trial in February 2011, 5000 tonnes of Aether clinker was produced, confirming the feasibility of industrial-scale production and the expected 25% to 30% fewer CO2 emissions per tonne of cement than OPC.
• CALERA’S KEY PROCESS is the technology associated with carbon capture and
conversion to stable solid minerals. This involves bringing gas from the power plant in contact with alkaline water to form soluble carbonates, which then react with hard water to form solid mineral carbonates and bicarbonates. These solid mineral carbonates and bicarbonates now contain CO2 that would have been emitted into the air. After removal from the water and with further processing, the solids have value in a number of construction applications. However, alone, it does not produce cement or concretes with properties that meet the requirements of cement standards, and is
45
therefore not currently envisaged as a process that would produce a cement-like product for widespread construction use.
• CALIX CEMENT is produced in a reactor by rapid calcinations of dolomitic rock in
superheated steam. The particles of rock are dropped into a vertical tube of superheated steam, which causes the particles to explode into grains, increasing the overall surface area. Those grains then react with the steam, oxidizing the surfaces, and the residue can be ground into a powder and mixed with sand to form a powder. The CO2 emissions from this process can be captured using a separate CO2 scrubbing system.
• CELITEMENT is made through a novel production process, the main stage of which
requires temperatures of about 200°C,compared to 1 450°C for conventional cement manufacture. Its developers claim that the process emits 50% less CO2 than OPC manufacturing. The new cement is characterized by a low consumption of resources: approximately one-third of the amount of limestone is required and it can be done completely without a gypsum additive. Celitement GmbH has engineered a pilot plant now in operation to supply sufficient quantities for testing of basic properties and recipes.
• NOVACEM is based on magnesium silicates rather than limestone (calcium
carbonate) as is used in OPC. Global reserves of magnesium silicates are estimated to be large, but these are not uniformly distributed. Processing would be required before use, for example quarrying and grinding as required for limestone in OPC manufacture. Using a low-carbon, low-temperature process, the technology converts magnesium silicates into magnesium oxide and magnesium carbonate. Production of magnesium carbonate involves CO2 absorption which, combined with the non-carbonate raw material and the ability to utilize low carbon fuels, offers the prospect of carbon negative cement. Makers of Novacem assert that this new cement could be carbon negative as it has the capacity to absorb 30 kgCO2/t cement to 100 kgCO2/t cement whereas OPC manufacturing leads to emissions of around 800 kgCO2/t cement.
In the long term, low-carbon cements may offer opportunities to reduce the CO2 intensity of cement production.

46
4.7 EMERGING TECHNOLOGIES
Emerging technologies that could significantly improve CO2 emissions reduction of the Indian cement industry are at various stages of development: use of mineralisers, fluidized bed advanced cement kiln system (FAKS), carbon capture and carbon use for algal growth for biofuels production, geo-polymer cement and use of nanotechnology in cement production (IEA and WBCSD, 2013). • Use of Mineralisers to Improve Combustion of the Raw Mix
Mineralizers added to raw materials entering the kiln can reduce the clinkerization temperature by about 50°C (or more) without compromising clinker quality, thereby reducing fuel consumption and emissions while also improving the clinker morphology. The selection and use of the mineralizers is generally determined by considerations such as the reaction effects desired, compatibility with a given kiln’s raw materials, the specific process adopted, physical form of the mineralizers and economic viability of using mineralizers.
• Fluidized-bed Advanced Cement Kiln System (FAKS)
The fluidized bed, which is widely used in some other industries, shows promise to improve thermal efficiency in cement production, although its suitability at scale is yet to be proven. With no other breakthrough technologies envisaged to deliver significantly higher thermal or electric efficiency, it is vital to ensure that new plants are fitted with the most efficient technologies, and are then operated and maintained well. Granulation control technology is the most important component in the FAKS system. It offers the first “self-granulation” process, whereby agglomeration of a portion of the raw material generates granule cores to which the remaining raw material adheres and “grows”, there by controlling granulation.
• Algal Growth Promotion and Use of Biofuels
Algae can be used either directly as a fuel or by converting it to biofuels to provide energy for cement production. Algal growth can be promoted by raising CO2 levels in the growing environment, the necessary photosynthesis can be stimulated in either open ponds or closed bioreactor systems in the presence of light. As open pond systems have been deemed commercially unviable, researchers have designed different bioreactors with varying efficiencies. The CO2 needed could be provided either directly from the kiln flue gases or in a more pure form via a CO2 capture plant. Using this biofuels to displace fossil fuels would deliver an associated emission benefit elsewhere in the value chain.

47
• Geo-Polymer Cement Geo-polymer cements are two component binders consisting of a reactive solid
component and an alkaline activator. During the reaction in alkaline media, a three-dimensional inorganic alumino silicate polymer network forms, which is responsible for the relatively high strength of the hardened product. Geo-polymer cements are already in use but not widely.
• Use of Nanotechnology in Cement Production Nano-cements are cements containing Nano-sized particles of cement evenly
distributed among larger particles of mineral admixtures. The Nano-particles are dispersed so finely that even a lower content of cement should be able to provide the desired binding of aggregates and admixture particles, generating the required strength and performance in the final concrete. Nano-cement productions allow for the use of larger quantities of mineral additives, and therefore have the potential to provide significant savings of cement and lower CO2 emissions. Nano-particles can also support mechano-chemical
Activation of raw materials and cements, which may provide enhanced reactivity
during Clinkerization (for raw materials) and hydration (for cement). The most studied and well-reported area is the use of Nano-particles, such as Nano-
silica, in cement mortar and concrete. Potential health hazards associated with the handling and use of Nano-particles need to be studied, understood and mitigated.
• Carbon Capture and Storage
Among the newer technologies for CO2 emissions reduction presented in this roadmap, only CCS is considered to become commercially available over the timeframe analyzed. CO2 capture through post- and oxy-combustion in the cement industry is currently at the pilot stage. If pilot testing is successful, and actions are quickly taken to overcome the barriers to CCS, it could contribute between 86 MtCO2 and 171 MtCO2 of the emissions reduction from the Indian cement industry by 2050. Carbonate looping – an adsorption process in which calcium oxide is put into contact with the combustion gas containing carbon dioxide to produce calcium carbonate – is at conceptual design stage. Several barriers still need to be overcome before CCS can be commercially applied in the cement sector. Post-combustion technologies – end-of pipe mechanisms – will not
48
require fundamental changes in the clinker-burning process, and could be retrofitted to existing plants depending on space restrictions. However, the energy requirements for the regeneration of the capture solvents used in post combustion capture may require additional boilers on site or off-take of steam from a local power plant. Oxy-combustion, which involves the use of an oxygen-enriched combustion environment to produce a pure CO2 flue gas, has been shown to improve cement production efficiency without markedly increasing the fuel consumption of a cement plant. Oxy-combustion technologies have their own disadvantages, however. While they can avoid the high energy costs associated with all post combustion capture techniques, the cost of oxygen gas production is high. Moreover, significant re-engineering of the plant may be needed to accommodate altered thermodynamics and material stress of operation in an oxygen-rich environment.
• Transport Logistics Reducing transport emissions by locating the grinding plant nearer to the fly ash / slag
source, bulk packing instead of retail packing, bulk transport through bulk tankers and rail instead of smaller size lorries and back haulage for cement dispatch and raw material receipt are some other smaller initiatives that can be adopted to reduce the GHG emissions by 0.5 kg CO2 /MT cement.
It can be noted that Road transport releases 2.5 times the GHG emission than rail per
MT of material transported for the same distance because of the bulk transport, better (CII, 2010).

49
5. CASE STUDIES
As part of the study, field studies are conducted at 3 cement plants for preparing detailed case studies of GHG reduction projects in 3 cement plants. The plants for case studies were selected based on their initiatives and performance in terms of implementing several projects that have resulted significant energy savings and GHG emission reductions. The plants have implemented many GHG reduction projects over the period and the key projects in terms of GHG reduction, technological innovation are selected and presented in the following sections.
5.1 INSTALLATION OF NEW HIGH EFFICIENCY SF COOLER IN LINE-1
Background
The Ramco Cements, Alathiyur had the conventional cooler in Line-1 designed for the capacity of 2200 TPD. The Preheater section was continuously upgraded to 3200 TPD with the same cooler. The cooler efficiency has reduced due to high loading on cooler. Description of the project The plant has replaced 3200 TPD conventional grate cooler with FLS cross bar cooler of capacity 3550 TPD. The table shows the operational parameters before and after the cooler upgradation. Productivity increased by 350 TPD of clinker, cooler loss was reduced by 60 kcal/kg clinker, power consumption in cooler section is reduced by 1.35 kWh/T clinker.
Figure 10 New High Efficiency SF Cooler in Line-1
Results Achieved The details of results achieved presented in the following Table: 19

50
Table 19 Results achieved by installation of new high efficiency sf cooler in line-1
Parameter Units Before
installation After installation
Specific Energy Consumption kWh/T clr 7.65 6.30
Thermal Energy Consumption kcal/kg clr 200 140
Power Savings MWh/year 1150
Reduction in Cooler Loss kcal/kg clr 60
Coal savings MT/year 8520 Reduction in GHG emissions (Thermal + Electrical)
T CO2/year 22123
5.2 INSTALLATION OF RAW MILL-1 CLASSIFER WITH ENERGY EFFICIENT CLASSIFIER WITH VORTEX RECTIFIER
Background The plant had installed Loesche mills for raw material. The raw mill was designed for feed moisture of 5% - 10%. Over a period of time the normal feed moisture increased to more than 10% causing the reduced raw mill output to 205-210 tph from 215-220 tph. During monsoon mill output was further reduced to 190 tph. Hot gas generator (HGG) has to be operated to meet clinker production. Since more heat was required for drying the raw material, the gas volume was to be increased in mill and thereby causing higher product residue. Kiln feed had to be reduced as the Raw mill was unable to support the raw meal requirement. At high residue of raw meal on 212 μm and high quartz %, problems related to clinker burning resulted in high free lime of more than 2.5%. Description of the project The plant has replaced the classifier LSKS 52 with LSKS 57 with inbuilt Vortex Rectifier (first time in India). Modified louvre and armour ring to maintain uniform gas flow profile inside the mill.
Figure 11 New Classifier with vortex rectifier
Figure 12 Old Classifier without
vortex rectifier
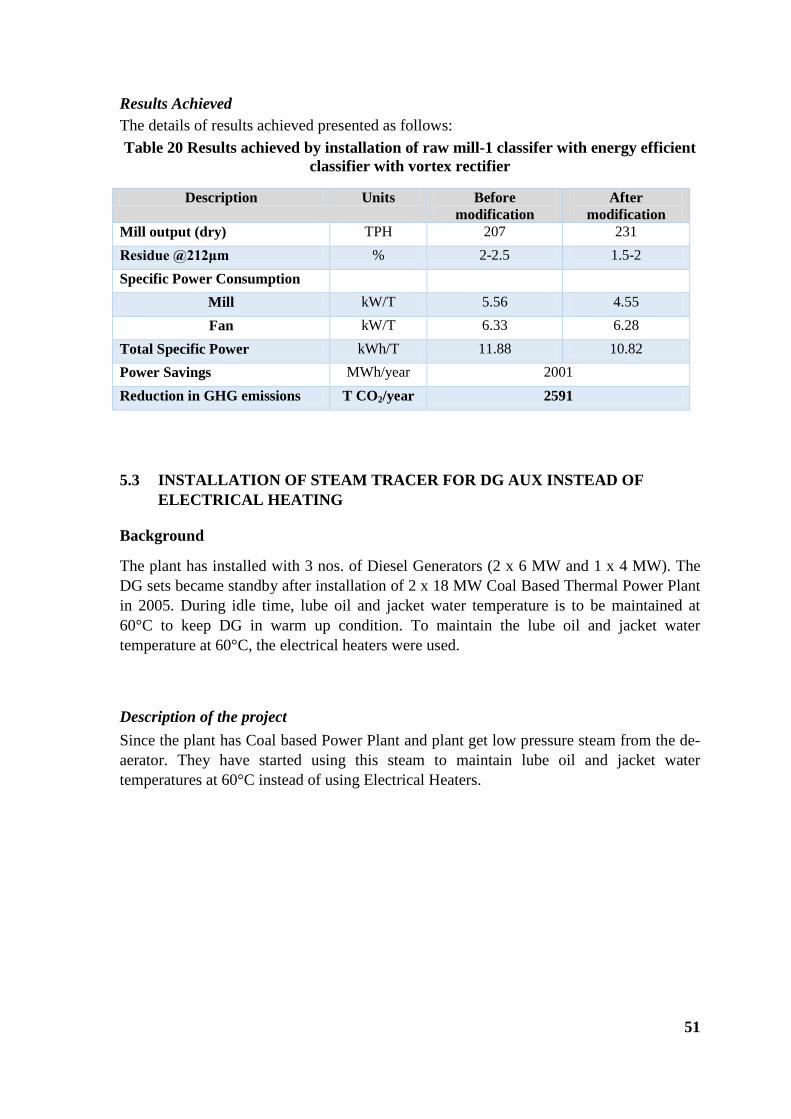
51
Results Achieved The details of results achieved presented as follows: Table 20 Results achieved by installation of raw mill-1 classifer with energy efficient
classifier with vortex rectifier
Description Units Before modification
After modification
Mill output (dry) TPH 207 231 Residue @212μm % 2-2.5 1.5-2 Specific Power Consumption
Mill kW/T 5.56 4.55 Fan kW/T 6.33 6.28
Total Specific Power kWh/T 11.88 10.82 Power Savings MWh/year 2001 Reduction in GHG emissions T CO2/year 2591
5.3 INSTALLATION OF STEAM TRACER FOR DG AUX INSTEAD OF ELECTRICAL HEATING
Background
The plant has installed with 3 nos. of Diesel Generators (2 x 6 MW and 1 x 4 MW). The DG sets became standby after installation of 2 x 18 MW Coal Based Thermal Power Plant in 2005. During idle time, lube oil and jacket water temperature is to be maintained at 60°C to keep DG in warm up condition. To maintain the lube oil and jacket water temperature at 60°C, the electrical heaters were used. Description of the project Since the plant has Coal based Power Plant and plant get low pressure steam from the de-aerator. They have started using this steam to maintain lube oil and jacket water temperatures at 60°C instead of using Electrical Heaters.

52
Figure 13 Steam Heating System
Figure 14 Electrical Heating System
Results Achieve: The details of results achieved presented in the following Table 21
Table 21 Results achieved by installation of steam tracer for dg aux instead of electrical heating
Description Units Before (with Electrical Heating)
After (with Steam Heating)
Average power consumption kWh/day 2400 390
Savings in power kWh/day 2010
Annual savings MWh/year 724
Reduction in GHG emissions T CO2/year 937
5.4 INSTALLATION OF VFD FOR LINE-2 CEMENT MILL BAG FILER FAN AND PRE-HEATER ID FAN
Background Cement Mill bag filter fan and Pre-heater ID Fan in Line-2 were running in GRR mode. The speed of these fans can be controlled by varying the resistance in the rotor circuit results in power loss of the motors. The amount of power lost across the GRR depends on the speed at which the fan is operating which in turn depends on the operating step of GRR.

53
Description of the project The plant has installed VFD for Line-2 Cement Mill bag filter fan and Pre-heater ID Fan to control the speed and avoid the power loss in the GRR to have optimum control on speed. This has resulted in a significant power savings in the fans power consumption.
Figure 15 VFD for Line-2 Cement Mill bag filter fan
Figure 16 VFD Line-2 Pre-heater ID Fan
Results Achieved The details of results achieved presented in the following Tables 21 and 22 1. Line-2 Cement Mill bag filter fan
Table 22 Results achieved by installation of VFD for line-2 cement mill bag filer fan
Description Units Before (with GRR) After (with VFD)
Average power consumption kW/hr 2000 1750
Savings in power kW/hr 250
Annual savings MWh/year 2040
Reduction in GHG emissions T CO2/year 2642
2. Line-2 Pre-heater ID Fan
Table 23 Results achieved by installation of VFD for PreHeater ID Fan
Description Units Before (with GRR) After (with VFD)
Average power consumption kW/hr 2000 1800
Savings in power kW/hr 200
Annual savings MWh/year 1656
Reduction in GHG emissions
T CO2/year 2145

54
5.5 OPTIMISATION OF PRESSURE DROP IN DUCTS USING CFD IN CEMENT MILL-1 & 2
Background Due to uneven duct area in the Line-1 Cement Mill bag house outlet duct and Line-2 Cement Mill fan outlet duct, there was a high pressure drop in both the ducts due to turbulent flow. This led to high electrical power consumption in Line-1 Cement Mill bag house fan and Line-2 Cement Mill fan. Description of the project The plant conducted a CFD analysis of air flow in both the ducts and modified the ducts and reduced the pressure drop. This modification resulted in power savings in Line-1 Cement Mill bag house fan and Line-2 Cement Mill fan.
Figure 17 Line-1 Cement Mill bag house fan
Before Modification After Modification
Figure 18 Line-2 Cement Mill bag house fan outlet duct:
Before Modification
After Modification

55
Results Achieved The details of results achieved presented below table 24
Table 24 Results achieved by optimisation of pressure drop in ducts using cfd in cement mill-1 & 2
Description Units Line-1 Cement Mill bag house fan
Line-2 Cement Mill fan
Power Savings kW/hr 50 27
Annual Energy savings
MWh/year 554
Reduction in GHG emissions
T CO2/year 718
5.6 MODIFICATION OF LINE-2 RAW MILL FAN INLET DUCT
Background There was a high pressure drop across the Line-2 Raw Mill Fan inlet duct due to small suction area. Description of the project The plant has modified fan inlet suction box by increasing its area to reduce pressure drop across fan inlet suction box. This has resulted in Raw Mill Fan power saving of 85 kW.
Figure 19 Raw Mill Fan Inlet Duct
Results Achieved The details of results achieved presented below
Table 25: Results achieved by modification of line-2 raw mill fan inlet duct
Description Units Before Modification
After Modification
Average power consumption kW/hr 1675 1590
Savings in power kW/hr 85
Annual savings MWh/year 612
Reduction in GHG emissions T CO2/year 793

56
5.7 INSTALLATION OF ROTARY AIRLOCK IN LINE-2 COAL MILL
Background There was false air ingression in to the Line-2 Coal Mill inlet which led to the higher power consumption of coal mill Booster fan. Description of the project The plant has installed Rotary Airlock in Line-2 Coal Mill inlet to reduce the false air ingression in to the mill. This measure has resulted the power saving of 20 kW in booster fan consumption. Results Achieved The details of results achieved presented below.
Table 26 Results achieved by installation of rotary airlock in line-2 coal mill
Description Units Value
Power Savings kW/hr 20
Annual Energy savings MWh/year 144
Reduction in GHG emissions T CO2/year 186
5.8 REMOVAL OF SILENCER FOR COOLER FANS AND ARRESTING LEAKAGES OF COOLER
Background Cooler fans in Line-3 & 4 are having silencers, led to higher pressure drop and hence cooler recuperation efficiency was low and higher power consumption in the cooler section. Description of the Project Complete study was conducted and removed all the silencers of all cooler fans and modified the inlet section of the fans. By this measure the pressure drop and the Power consumption of fans has reduced

57
Complete study was conducted and removed all the silencers of all cooler fans and modified the inlet section of the fans. By this measure the pressure drop and the Power consumption of fans has reduced.
Before After
Results Achieved The details of results achieved presented in the following Table 27
Table 27 Results achieved by removal of silencer for cooler fans and arresting leakages of cooler
Description Units Value
Power Savings (after modification) kWh/T clr 2.6
Annual Energy savings MWh/year 5936
Reduction in GHG emissions T CO2/year 7687
5.9 OPTIMIZATION OF COAL HANDLING PLANT BY MODIFYING THE BELT FEEDER DRIVE ARRANGEMENT
Background The plant was getting the coal from the coal handling plant of quantity 100 TPH only (1200 TPD). The power consumption of line-2 group was 338 kW/hr and the group runs for 12 hours. Description of the project The plant optimized the operation of coal handling plant by modifying the belt feeder drive arrangement. With this measure, now the CHP is operating for 7 hours for the same capacity with the reduced power consumption.

58
Results Achieved The details of results achieved presented in the following Table: 28 Table 28 Results achieved by Optimization of Coal Handling Plant by Modifying the
Belt Feeder Drive Arrangement
Description Units Before
optimisation After optimisation
Operational Hours Hr 12 7
Average power consumption kW/hr 338 366
Annual savings MWh/year 359
Reduction in GHG emissions T CO2/year 464
5.10 UTILISATION OF ALTERNATE FUELS
Background Vasavadatta Cement is unit of Kesoram Industries Ltd., situated at Sedam, Karnataka. Plant has 4 kilns of capacities 2400TPD, 3600 TPD, 4500 TPD & 4500 TPD. Description of the project For increasing the thermal substitution rate to feed different types of alternative fuels Vasavadatta Cement has installed HOTDISC in Kiln-3. The HOTDISC is a safe simple and effective combustion device that maximizes the substitution of fossil fuels by alternative fuels in a controlled manner. The HOTDISC is installed at pyro-processing unit-3 in Sep-2012. This state of art technology is first of its kind in India, for cement industry to utilize refused delivered waste & tyres in cement rotary kiln as alternative fuel in efficient way with compliance with all environmental regulations. The HOTDISC is supplied by FLSmidth. The plant is utilizing municipal waste, industrial waste, used tyres of vehicles, etc. The HOTDISC is a simple combustion device, integrated with pre-heater and pre-calciner systems. The HOTDISC gives the flexibility to burn a wide variety of solid waste in sizes up to 1.2 m – from sludge or grains to whole truck tyres.

59
Features of HOTDISC Technology • Combustion of alternative fuels takes place in Oxygen rich atmosphere. • Variable retention time based on the type of alternative fuel is possible to ensure
complete combustion. Working principle: As an integrated part of the kiln system, the HOTDISC is added onto the calciner and functions as a moving furnace. When alternative fuel, preheated raw meal and tertiary air are fed into the HOTDISC, it produces combustion gases, partly calcined meal and combustion residues. These are then processed in the calciner along with the other streams that go into the calciner. The result is calcined meal ready for the kiln and well-controlled emissions. Benefits of HOTDISC:
• Reduction in Calciner coal firing ͠ TPH(TSR>30% based on AF availability) • Reduction in laterite consumption due to steel wires in tires. • NOx reduction (PPM) at main stack from based line test: 35%
AFR feeding rate & other parameters with HOTDISC at Vasavadatta Cement:
• Feed rate of shredded tires : 3.5 TPD • Feed rate of RDF : 10 TPH • Speed of HOTDISC : 4-5 RPH • Pre-heater meal diversion towards HOTDISC : 20%
Results Achieved
Table 29 Results achieved by Utilization of alternative fuels
Description Unit 2014-15
Alternate Fuel usage T/year 23265
GCV of alternate fuel kcal/kg 5500
Thermal Substitution by Alternate fuel Million kcal 127958
Weighted average of coal GCV kcal/kg 5020
Coal Savings T/year 25490
Reduction GHG emissions T CO2/year 51647
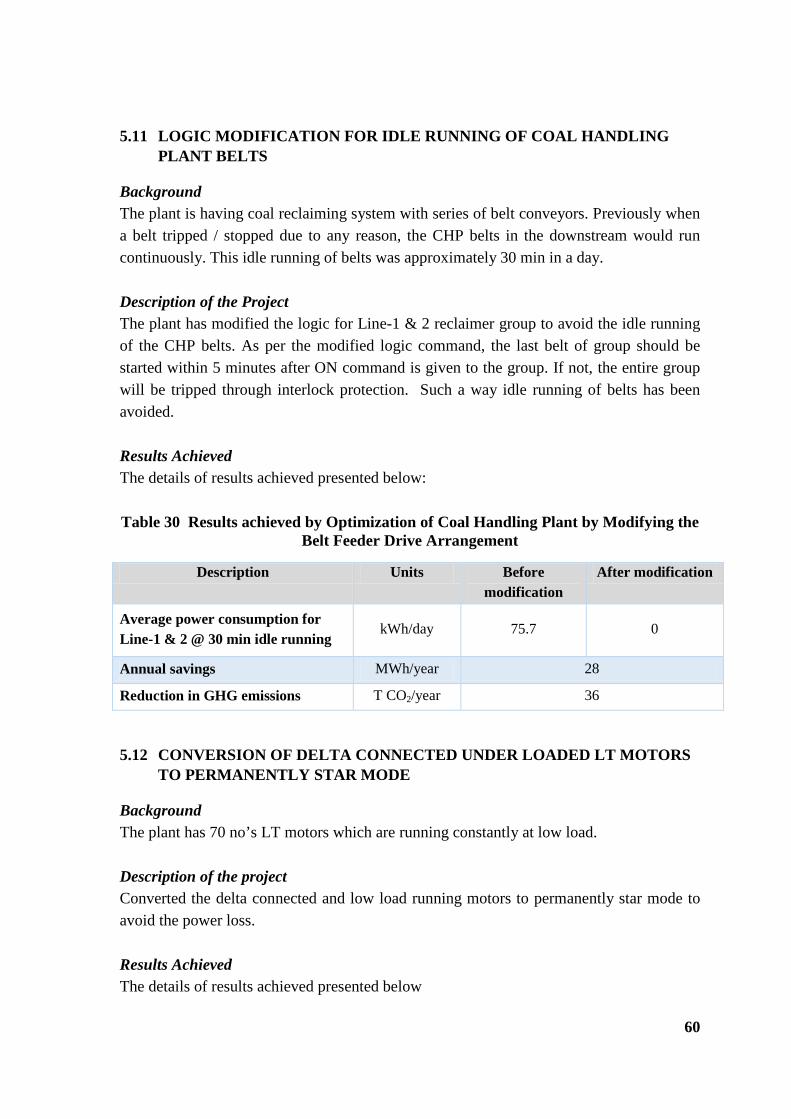
60
5.11 LOGIC MODIFICATION FOR IDLE RUNNING OF COAL HANDLING PLANT BELTS
Background The plant is having coal reclaiming system with series of belt conveyors. Previously when a belt tripped / stopped due to any reason, the CHP belts in the downstream would run continuously. This idle running of belts was approximately 30 min in a day. Description of the Project The plant has modified the logic for Line-1 & 2 reclaimer group to avoid the idle running of the CHP belts. As per the modified logic command, the last belt of group should be started within 5 minutes after ON command is given to the group. If not, the entire group will be tripped through interlock protection. Such a way idle running of belts has been avoided. Results Achieved The details of results achieved presented below: Table 30 Results achieved by Optimization of Coal Handling Plant by Modifying the
Belt Feeder Drive Arrangement
Description Units Before modification
After modification
Average power consumption for Line-1 & 2 @ 30 min idle running
kWh/day 75.7 0
Annual savings MWh/year 28
Reduction in GHG emissions T CO2/year 36
5.12 CONVERSION OF DELTA CONNECTED UNDER LOADED LT MOTORS TO PERMANENTLY STAR MODE
Background The plant has 70 no’s LT motors which are running constantly at low load. Description of the project Converted the delta connected and low load running motors to permanently star mode to avoid the power loss. Results Achieved The details of results achieved presented below
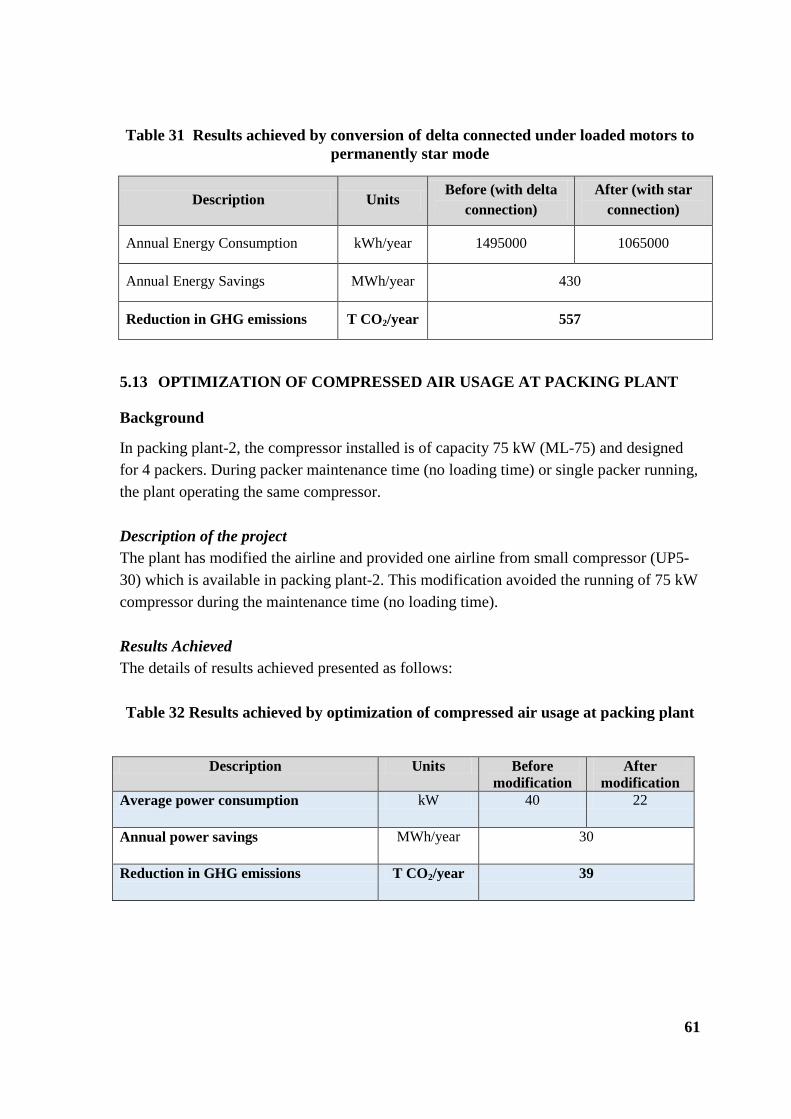
61
Table 31 Results achieved by conversion of delta connected under loaded motors to permanently star mode
Description Units Before (with delta
connection) After (with star
connection)
Annual Energy Consumption kWh/year 1495000 1065000
Annual Energy Savings MWh/year 430
Reduction in GHG emissions T CO2/year 557
5.13 OPTIMIZATION OF COMPRESSED AIR USAGE AT PACKING PLANT
Background
In packing plant-2, the compressor installed is of capacity 75 kW (ML-75) and designed for 4 packers. During packer maintenance time (no loading time) or single packer running, the plant operating the same compressor. Description of the project The plant has modified the airline and provided one airline from small compressor (UP5-30) which is available in packing plant-2. This modification avoided the running of 75 kW compressor during the maintenance time (no loading time). Results Achieved The details of results achieved presented as follows: Table 32 Results achieved by optimization of compressed air usage at packing plant
Description Units Before
modification After
modification Average power consumption kW 40 22
Annual power savings MWh/year 30
Reduction in GHG emissions T CO2/year 39

62
5.14 INSTALLATION OF WASTE HEAT RECOVERY SYSTEM FOR POWER GENERATION
Background The India Cements Ltd, Vishnupuram Unit has two rotary kilns. The first kiln (Kiln-1) of 3000 TPD is equipped with two raw Mills of 100 TPH (Ball Mills with closed circuit, central discharge) and two coal Mills of 12 TPH (Ball Mills with closed circuit).The second kiln (Kiln-2) of 4600 TPD is equipped with Vertical Raw Mill of 300 TPH & Vertical Coal Mill of 45 TPH. Description of the project Waste Heat Recovery System of capacity 7.7 MW was installed in line-2. The operating load is around 8.6 MW. The hot waste gases coming out from the preheater and clinker cooler are used to produce steam and generate power. This has avoided power requirement from grid/ captive power plant. Results Achieved The details of results achieved presented in the following Table 33
Table 33 Results achieved by installation of waste heat recovery for power generation
Parameter Unit Kiln-2
PH Boiler AQC Boiler
Year of Installation Year 2004 2004
Rated Capacity of Steam Generation TPH 28.2 14.63
Operating Capacity TPH 29 14
Net Generation Units/day 188360
Kiln Capacity TPD 4600
Boiler Inlet temp (design) 0C 360 340
Boiler Inlet temp (operating) 0C 358 329
Boiler outlet temp (design) 0C 210 100
Feed Water Temperature 0C 200 200
Turbine Output (designed) MW 7.7
Turbine Output (operating) MW 8.6
Average annual generation on design capacity MWh 60984
Southern grid emission factor t CO2/MWh 0.81
Reduction in GHG emissions t CO2/year 49397
Generation Capacity- 7.7 MW
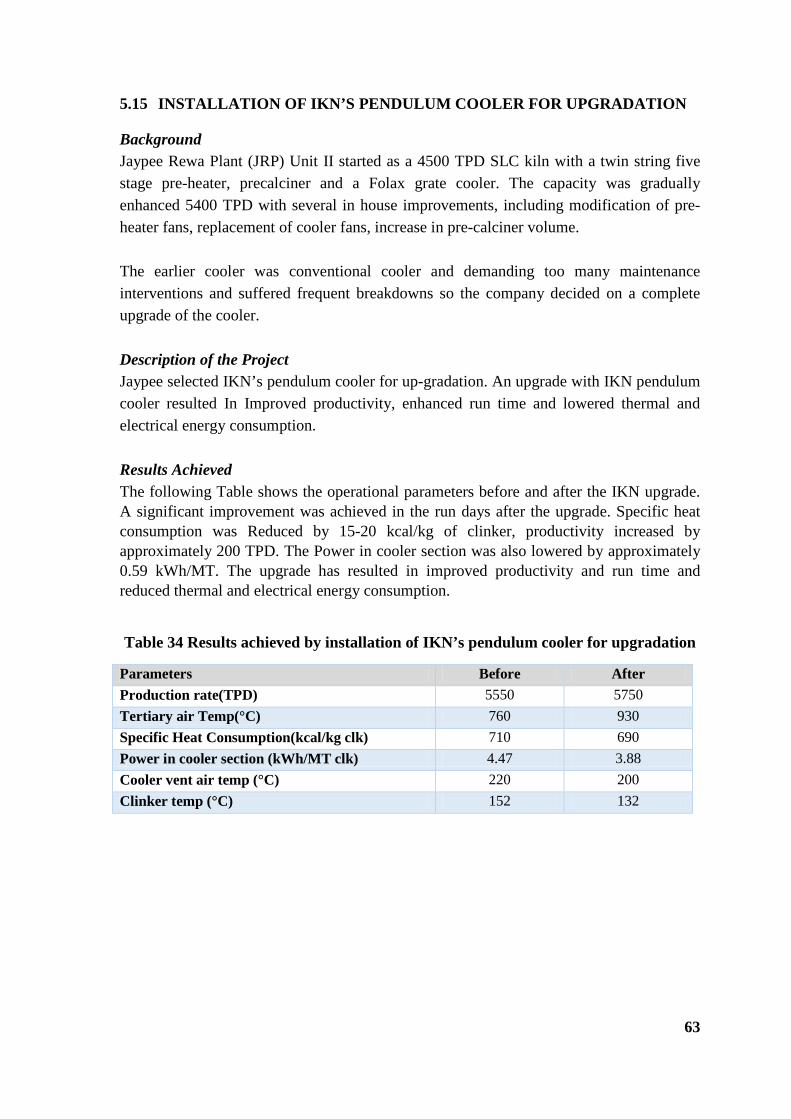
63
5.15 INSTALLATION OF IKN’S PENDULUM COOLER FOR UPGRADATION
Background Jaypee Rewa Plant (JRP) Unit II started as a 4500 TPD SLC kiln with a twin string five stage pre-heater, precalciner and a Folax grate cooler. The capacity was gradually enhanced 5400 TPD with several in house improvements, including modification of pre-heater fans, replacement of cooler fans, increase in pre-calciner volume. The earlier cooler was conventional cooler and demanding too many maintenance interventions and suffered frequent breakdowns so the company decided on a complete upgrade of the cooler. Description of the Project Jaypee selected IKN’s pendulum cooler for up-gradation. An upgrade with IKN pendulum cooler resulted In Improved productivity, enhanced run time and lowered thermal and electrical energy consumption. Results Achieved The following Table shows the operational parameters before and after the IKN upgrade. A significant improvement was achieved in the run days after the upgrade. Specific heat consumption was Reduced by 15-20 kcal/kg of clinker, productivity increased by approximately 200 TPD. The Power in cooler section was also lowered by approximately 0.59 kWh/MT. The upgrade has resulted in improved productivity and run time and reduced thermal and electrical energy consumption.
Table 34 Results achieved by installation of IKN’s pendulum cooler for upgradation
Parameters Before After Production rate(TPD) 5550 5750 Tertiary air Temp(°C) 760 930 Specific Heat Consumption(kcal/kg clk) 710 690 Power in cooler section (kWh/MT clk) 4.47 3.88 Cooler vent air temp (°C) 220 200 Clinker temp (°C) 152 132

64
6. INTERNET OF THINGS (IOT)
As the world’s expendable energy resources deplete and the industrial sector is being asked to deliver more to a growing population, energy efficiency has taken center stage to ensure the longevity of these energy resources, and the Internet of Things can play a crucial role. The emergence of the Internet of Things (IoT) almost certainly is the most important single development in the long evolution of energy management. The insight derived from data collected from new Internet-connected devices can be used to develop new services, enhance productivity and efficiency, improve real-time decision making, solve critical problems, and create new and innovative experiences. Traditionally, many plants do not have the technology in place to track and measure energy use. On top of that, information on a plant’s energy production and consumption is not consolidated into a single place. Energy production and consumption data is often not visible in real time and is not presented at a level granular enough to reflect how changes in behaviour affect energy use. With limited information at their disposal, energy managers can have a difficult time finding the places where energy use could improve. To develop a clear energy-saving strategy and drive energy-saving behaviour, managers need to boost monitoring capabilities and this data needs to be coordinated into a single system. The Internet of Things (IoT) captures information seamlessly from the sensors and machines that monitor all aspects of the manufacturing process. The information it returns offer greater visibility into actionable data that can result in significant energy savings. Network sensors track energy performance, monitor for leaks and flag any subpar operating situations. Adding Internet of Things sensor technology to a plant allows for real-time alerts that notify energy managers about wasteful situations. Energy managers can then take timely action before their operation loses large amounts of money. Further, the Internet of Things gets the right information to the right expert– whether that person is an onsite manager, an off-site facility specialist, or a third party expert—when they need it, so they can make the best decisions to improve energy performance.

65
7. ABBREVIATIONS
GHG – Green House Gases
GDP – Gross Domestic Product
IPCC – Intergovernmental Panel on Climate Change
GWP – Global Warming Potential
Gt.CO2 – Giga Tonne Carbon dioxide
MTOE – Metric Tonne Oil Equivalent
RPS – Renewable Portfolio Standards
TPD – Tonnes per Day
AOX – Absorbable Organic Demand
BOD –Biological Oxygen Demand
COD – Chemical Oxygen Demand
ADT – Air Dried Tonne GCV – Gross Calorific Value
NCV – Net Calorific Value
TOE – Tonne Oil Equivalent
Mkcals- Million Kilo calories
66
8. BIBLIOGRAPHY
1. India Energy Outlook, 2015, International Energy Agency (IEA). 2. Energy Statistics 2015, Ministry of Statistics and Programme Implementation
(MOSPI), 2015 ,GOI. 3. India: Green House Gas Emissions 2007, 2010, Ministry of Environment and Forests
(MOEF), GOI. 4. Energy Benchmarking for Cement Industry, 2015, CII 5. Case Study Booklet on Energy Efficient Technologies in Cement Industry, 2010, CII 6. Perform, Achieve and Trade (PAT) Booklet, 2012, Ministry of Power, GOI 7. Low Carbon Road Map for Cement Industry, 2010, CII 8. India’s Progress in Combatting Climate Change, 2014, Ministry of Environment and
Forest, GOI. 9. United Nations Framework Convention on Climate Change (UNFCCC), 1992, United
Nations. 10. https://en.wikipedia.org/wiki/Kyoto_Protocol 11. Import of fossil fuels in India, 12. Source: http://www.eia.gov/todayinenergy/detail.cfm?id=17551 13. Types of Cement Produced in India. 14. Source: http://business.mapsofindia.com/cement/types/ 15. CO2 Baseline Database for the Indian Power Sector, Version 10, 2014, CEA, Ministry
of Power, GOI. 16. IPCC Guidelines for National Green House Gas Inventories, 2006, Ministry of
Power, GOI. 17. The Electricity Act, 2003, Ministry of Law and Justice, GOI. 18. National Tariff Policy, 2015, Ministry of Power, GOI. 19. Duda, Walter .H, 1985, Cement Data Book, Volume 1 20. NCCBM, Training notes on technologies and advancements in cement manufacturing
process. 21. Latest details on cement machinery from suppliers like of FLSmidth, KHD
Humboldt, IKN etc. 22. Technology Roadmap, 2012, International Energy Agency (IEA). 23. Low Carbon Roadmap for Indian Cement Industry, 2010, CII. 24. Cement Sector GHG Emission Reduction Case Studies, 2009, The Loreti Group. 25. Case Study Booklet on Energy Efficient Technologies in Indian Cement Industry,
2015, CII. 26. Report 2015 – 16, DIPP, Ministry of Commerce and Industries, GOI 27. BP Statistical Review of World Energy 2016 28. Energy Statistics 2016 by Central Statistics Office, Ministry Of Statistics and
Programme Implementation, GOI 29. INCCA GHG Emissions 2007, MoE&F 30. RETEC Consilium Bulk

67
31. NCASI Report. 32. L& T Automation systems report 33. Report of Cement corporation of India, New Delhi 34. Metso application report, 2611/03/10 EN 35. Monitoring carryover at the brownstock washers, by B.Richardson 36. http://ietd.iipnetwork.org 37. http://ietd.iipnetwork.org 38. http://www.economywatch. com 39. http://ietd.iipnetwork.org 40. National best practice manual for cement industry by CII. 41. www.tappsa.co.za 42. http://www.ilocis.org 43. Technology compendium on Energy Saving opportunities in cement sector published
by CII & Shakti Sustainable energy foundation-Aug 2013. 44. Energy audit report of cement industries by NPC. 45. Base line audit report of cement industries by NPC