Embed Size (px)
Citation preview
Good practices on control and prevention of transboundary air pollution
Ram M. ShresthaProfessor
Asian Institute of TechnologyThailand
Email: [email protected]
3 October 2007
Contents
• Status and major issues of TAP in South Asia
• Approaches for controlling and preventing TAP
• Good practices on controlling and preventing TAP
• Some Issues on adoption of good practices
Status and Major Issues in South Asia
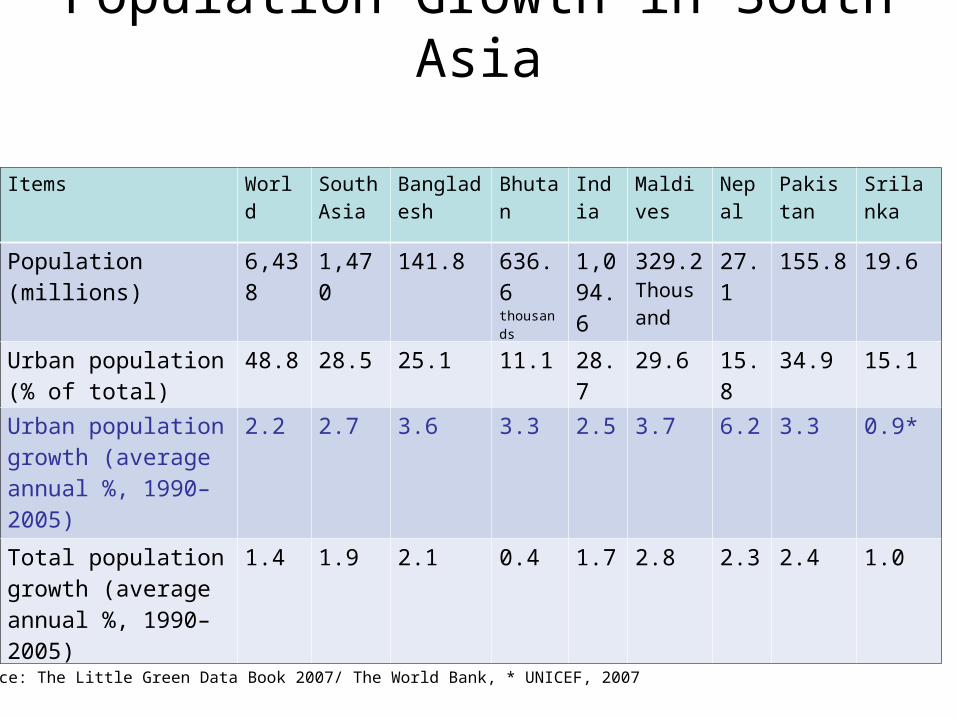
Population Growth in South Asia
Source: The Little Green Data Book 2007/ The World Bank, * UNICEF, 2007
Items World South Asia
Bangladesh
Bhutan
India Maldives
Nepal
Pakistan
Srilanka
Population (millions) 6,438 1,470 141.8 636.6 thousands
1,094.6
329.2 Thousand
27.1 155.8 19.6
Urban population (% of total)
48.8 28.5 25.1 11.1 28.7 29.6 15.8 34.9 15.1
Urban population growth (average annual %, 1990–2005)
2.2 2.7 3.6 3.3 2.5 3.7 6.2 3.3 0.9*
Total population growth (average annual %, 1990–2005)
1.4 1.9 2.1 0.4 1.7 2.8 2.3 2.4 1.0
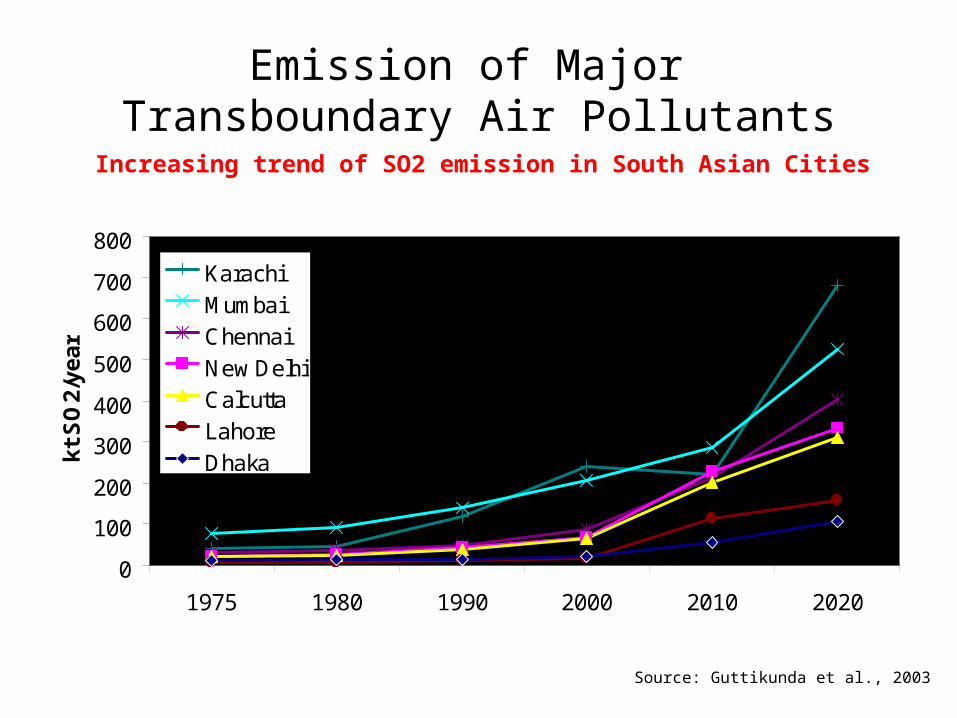
Emission of Major Transboundary Air Pollutants
Increasing trend of SO2 emission in South Asian Cities
Source: Guttikunda et al., 2003
0
100
200
300
400
500
600
700
800
1975 1980 1990 2000 2010 2020
kt
SO
2/y
ea
r
KarachiMumbaiChennaiNew DelhiCalcuttaLahoreDhaka
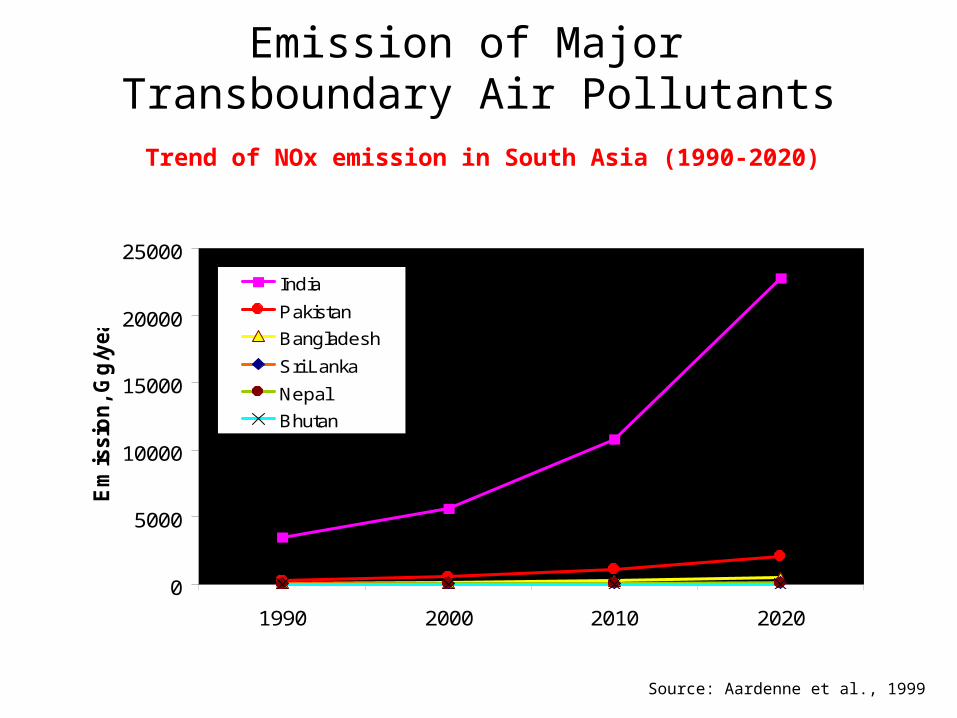
Emission of Major Transboundary Air PollutantsTrend of NOx emission in South Asia (1990-2020)
Source: Aardenne et al., 1999
0
5000
10000
15000
20000
25000
1990 2000 2010 2020
Em
issio
n, G
g/y
ear
India
Pakistan
Bangladesh
Sri Lanka
Nepal
Bhutan
Emission of Major Transboundary Air Pollutants
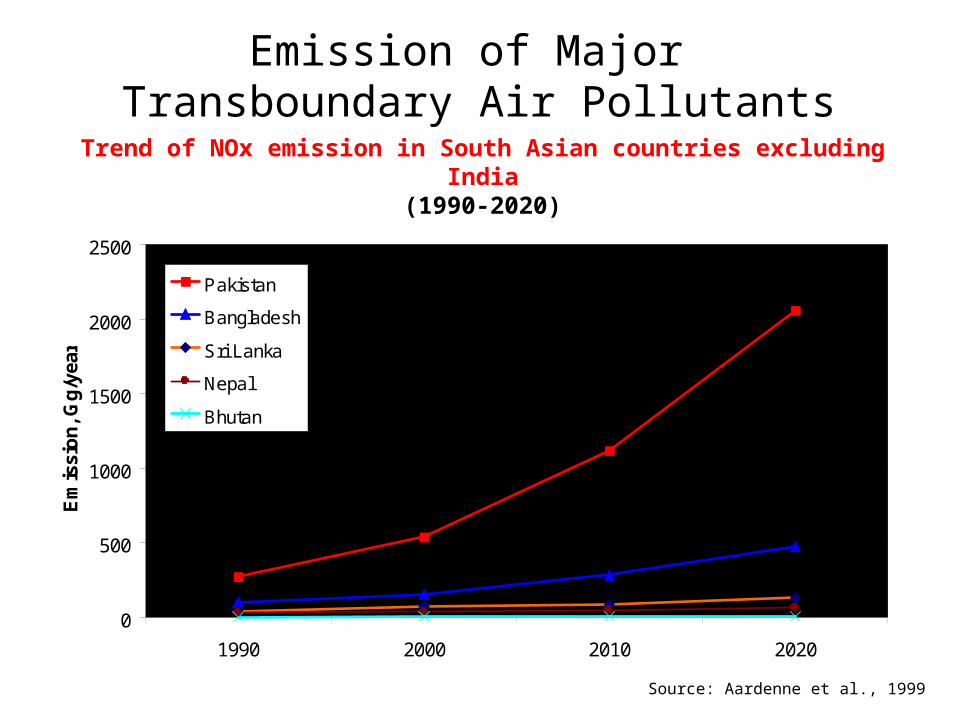
Trend of NOx emission in South Asian countries excluding India(1990-2020)
Source: Aardenne et al., 1999
0
500
1000
1500
2000
2500
1990 2000 2010 2020
Em
issi
on
, Gg
/yea
r
Pakistan
Bangladesh
Sri Lanka
Nepal
Bhutan
Emission of Major Transboundary Air Pollutants
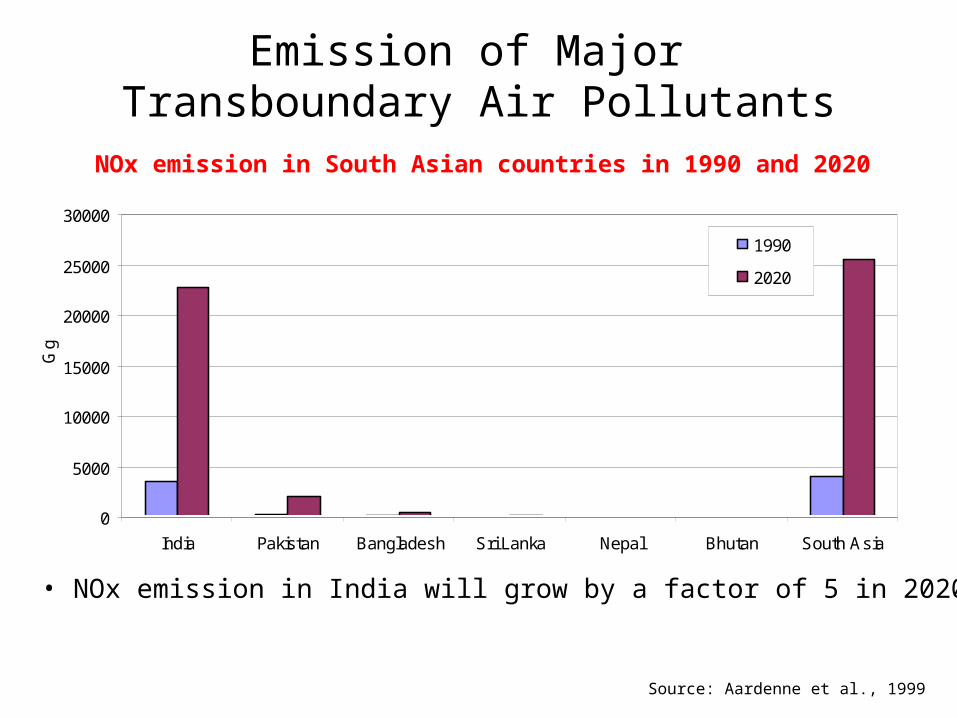
NOx emission in South Asian countries in 1990 and 2020
Source: Aardenne et al., 1999
0
5000
10000
15000
20000
25000
30000
India Pakistan Bangladesh Sri Lanka Nepal Bhutan South Asia
Gg
1990
2020
• NOx emission in India will grow by a factor of 5 in 2020
Growing exposure to increasing SO2 concentration in future
• In 2020, peak SO2 concentrations would reach 226 mg/m3 (average concentration 33 mg/m3)for Mumbai.
• In 2020, the population exposed to SO2 pollution levels above WHO standard (industrial area limit = 80 mg/m3) is 10.8 million for Mumbai city alone.
Source: Guttikunda et al., 2003, The contribution of megacities to regional sulfur pollution in Asia, Atmospheric Environment 37 (2003) 11–22
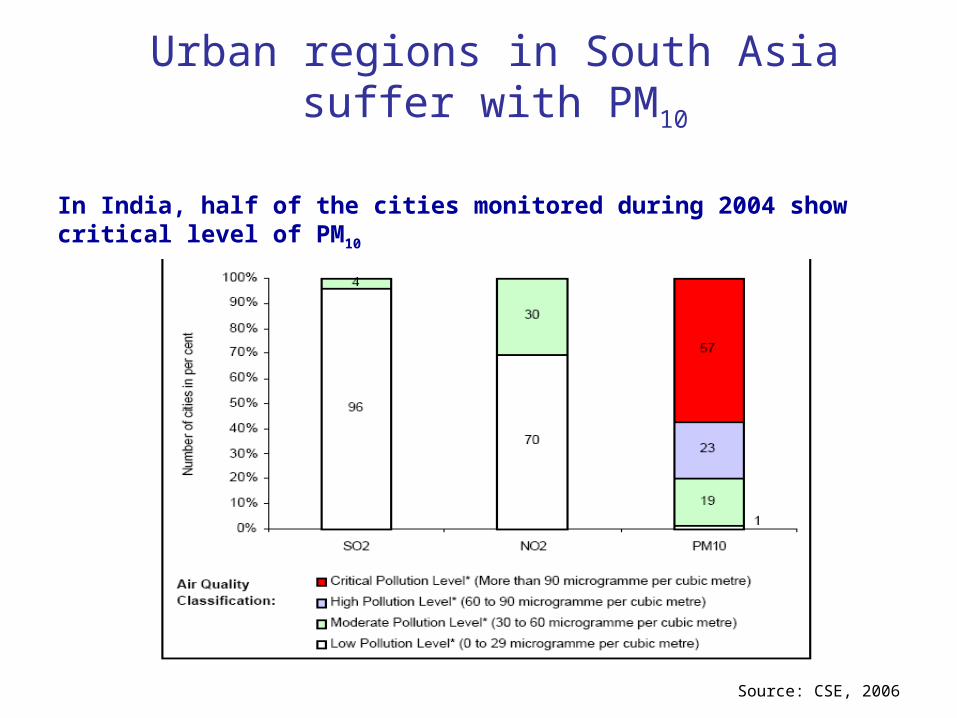
Urban regions in South Asia suffer with PM10
Source: CSE, 2006
In India, half of the cities monitored during 2004 show critical level of PM10
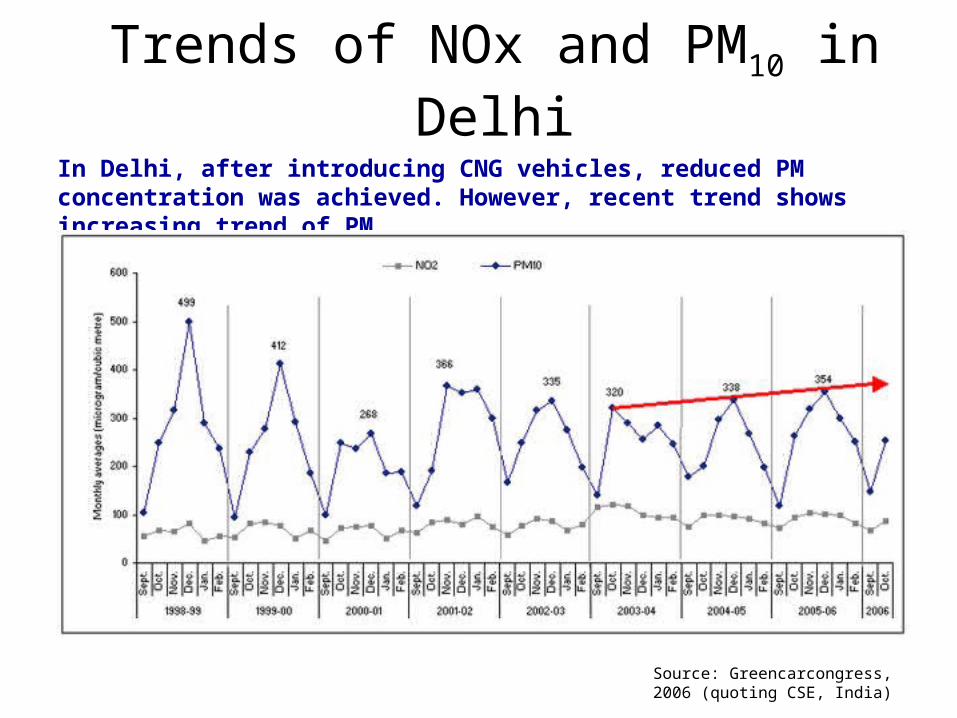
Trends of NOx and PM10 in Delhi
Source: Greencarcongress, 2006 (quoting CSE, India)
In Delhi, after introducing CNG vehicles, reduced PM concentration was achieved. However, recent trend shows increasing trend of PM10 .
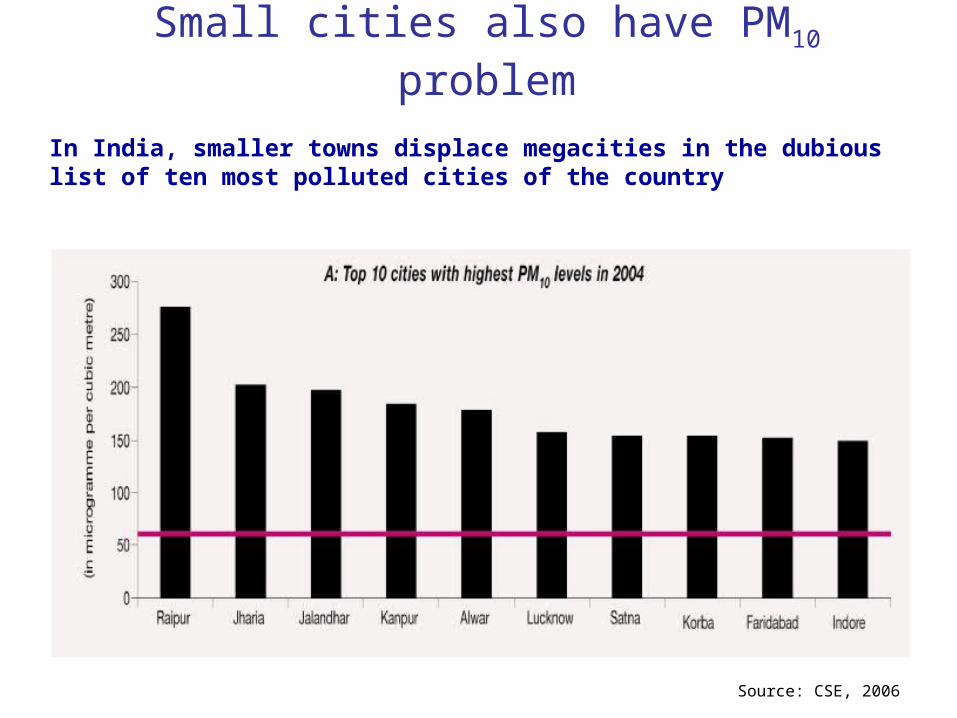
Small cities also have PM10 problem
Source: CSE, 2006
In India, smaller towns displace megacities in the dubious list of ten most polluted cities of the country
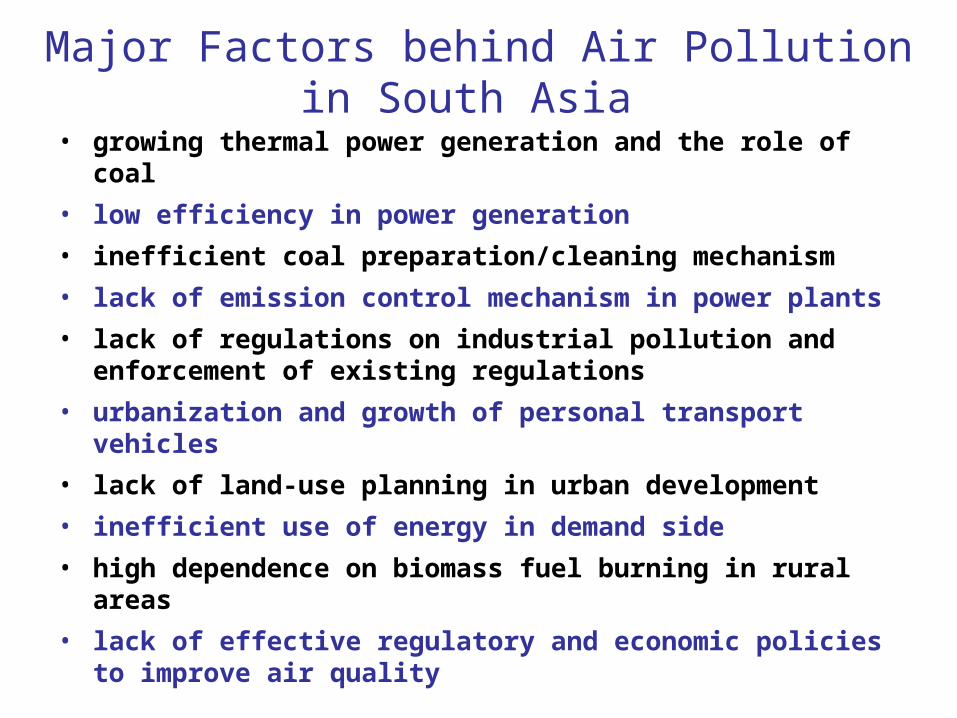
Major Factors behind Air Pollution in South Asia
• growing thermal power generation and the role of coal
• low efficiency in power generation
• inefficient coal preparation/cleaning mechanism
• lack of emission control mechanism in power plants
• lack of regulations on industrial pollution and enforcement of existing regulations
• urbanization and growth of personal transport vehicles
• lack of land-use planning in urban development
• inefficient use of energy in demand side
• high dependence on biomass fuel burning in rural areas
• lack of effective regulatory and economic policies to improve air quality
Growing thermal Power Generation in the region and the role of coal
India– In South Asia as a whole, coal accounts for 72% (147,368 ktoe)
of energy use in power generation. Out of it, nearly 99% (147,287 ktoe) is used by India.
– Coal based electricity generation accounts for 80% of total electricity generation in India in 2004 (IEA, 2004)
– The coal consumption in India had increased from 140 Mt in 1984 to over 400 Mt in 2004 with a growth rate of 5.4% (GOI, 2006). In this context, if coal import is to be avoided in future, India has to increase its domestic coal production in order to meet its growing coal demand (GOI, 2006)
– Coal demand in India increases to 1020 million tonnes by 2030 from 441 million tonnes in 2004 in reference scenario (IEA, 2006).
– Government of India, under the various scenarios, has estimated coal requirement from a low of 1580 Mt to high of 2555 Mt for year 2031/32 (GOI, 2006).
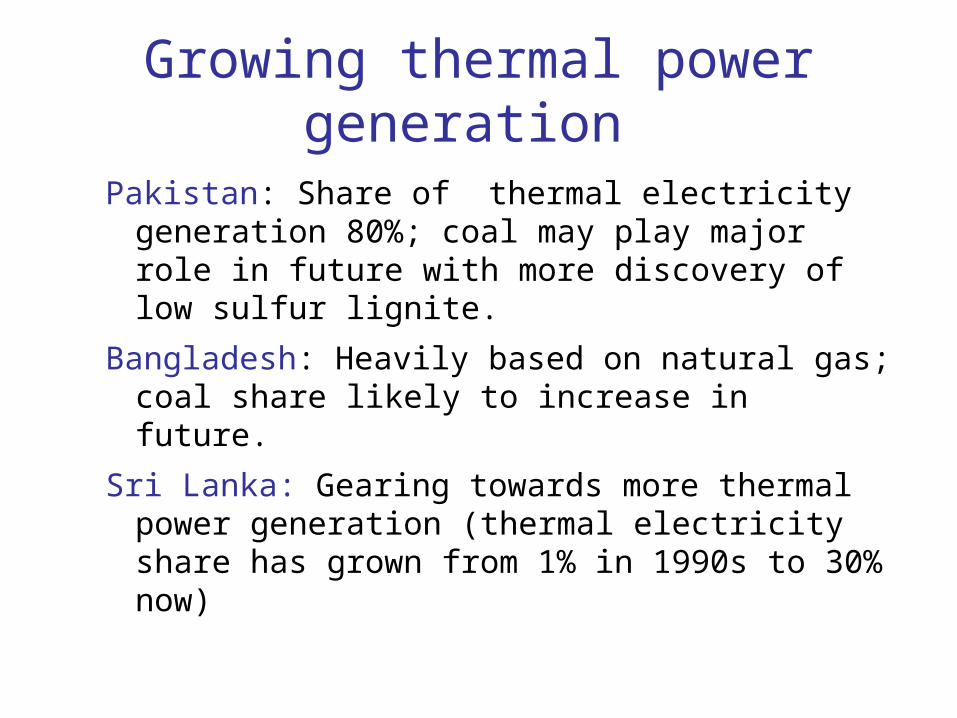
Growing thermal power generation
Pakistan: Share of thermal electricity generation 80%; coal may play major role in future with more discovery of low sulfur lignite.
Bangladesh: Heavily based on natural gas; coal share likely to increase in future.
Sri Lanka: Gearing towards more thermal power generation (thermal electricity share has grown from 1% in 1990s to 30% now)
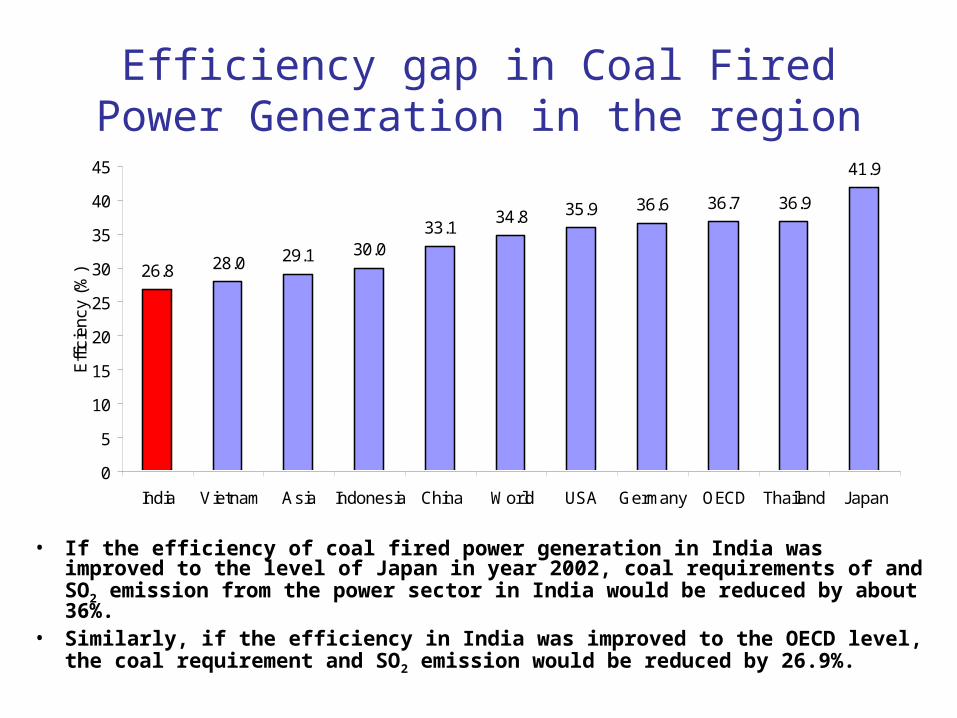
Efficiency gap in Coal Fired Power Generation in the region
• If the efficiency of coal fired power generation in India was improved to the level of Japan in year 2002, coal requirements of and SO2 emission from the power sector in India would be reduced by about 36%.
• Similarly, if the efficiency in India was improved to the OECD level, the coal requirement and SO2 emission would be reduced by 26.9%.
26.8 28.0 29.1 30.033.1
34.8 35.9 36.6 36.7 36.9
41.9
0
5
10
15
20
25
30
35
40
45
India Vietnam Asia Indonesia China World USA Germany OECD Thailand Japan
Effi
cien
cy (
%)
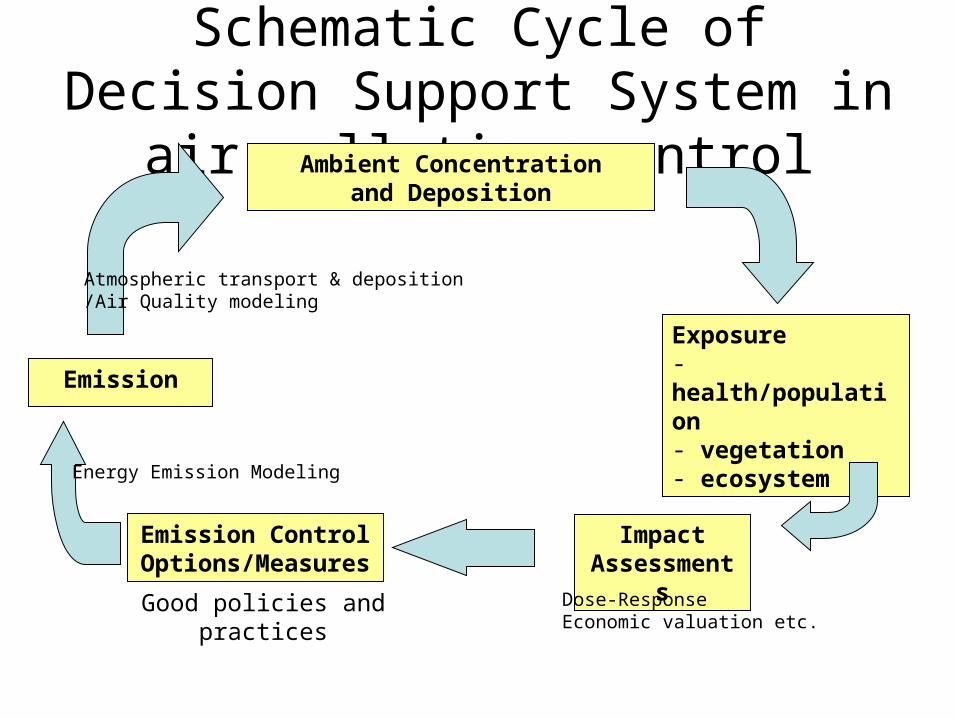
Schematic Cycle of Decision Support System in air pollution
controlAmbient Concentrationand Deposition
Emission
Exposure- health/population- vegetation- ecosystem
Impact Assessments
Emission Control Options/Measures
Atmospheric transport & deposition/Air Quality modeling
Energy Emission Modeling
Dose-ResponseEconomic valuation etc.
Good policies and practices
Approaches to control/prevent air pollution
» Command and control » Market/economic» Others
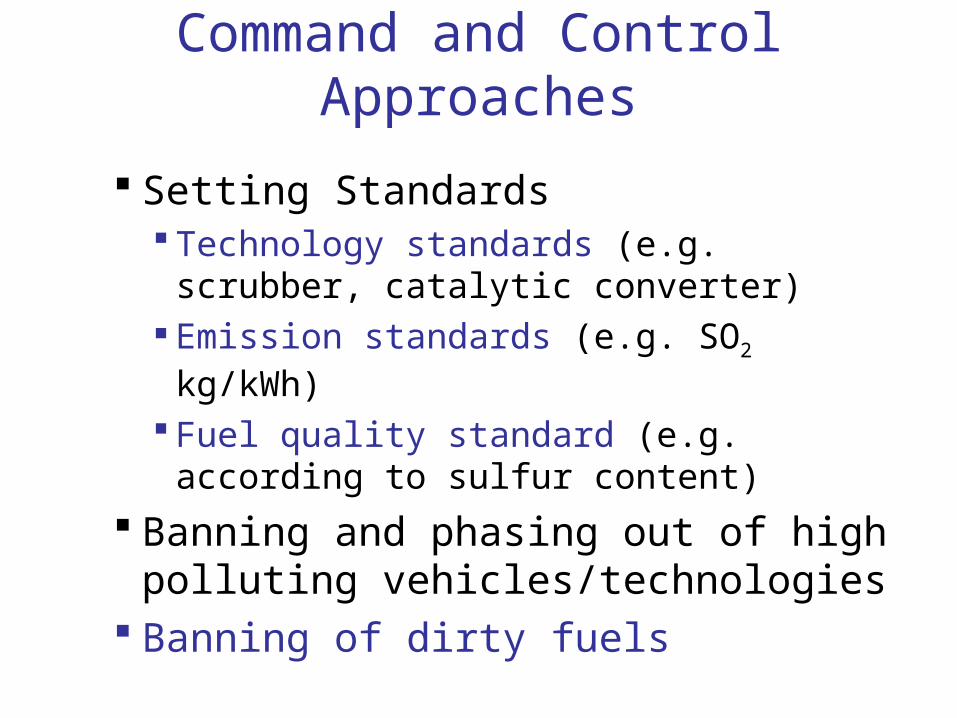
Command and Control Approaches
Setting Standards Technology standards (e.g. scrubber,
catalytic converter) Emission standards (e.g. SO2 kg/kWh)
Fuel quality standard (e.g. according to sulfur content)
Banning and phasing out of high polluting vehicles/technologies
Banning of dirty fuels
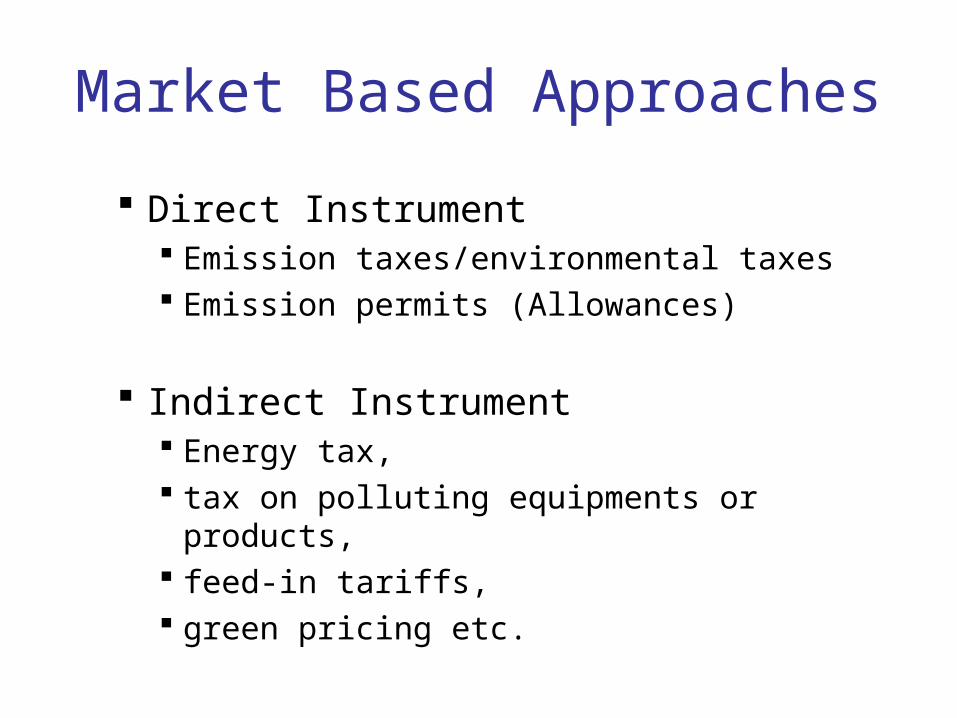
Market Based Approaches
Direct Instrument Emission taxes/environmental taxes Emission permits (Allowances)
Indirect Instrument Energy tax, tax on polluting equipments or products, feed-in tariffs, green pricing etc.
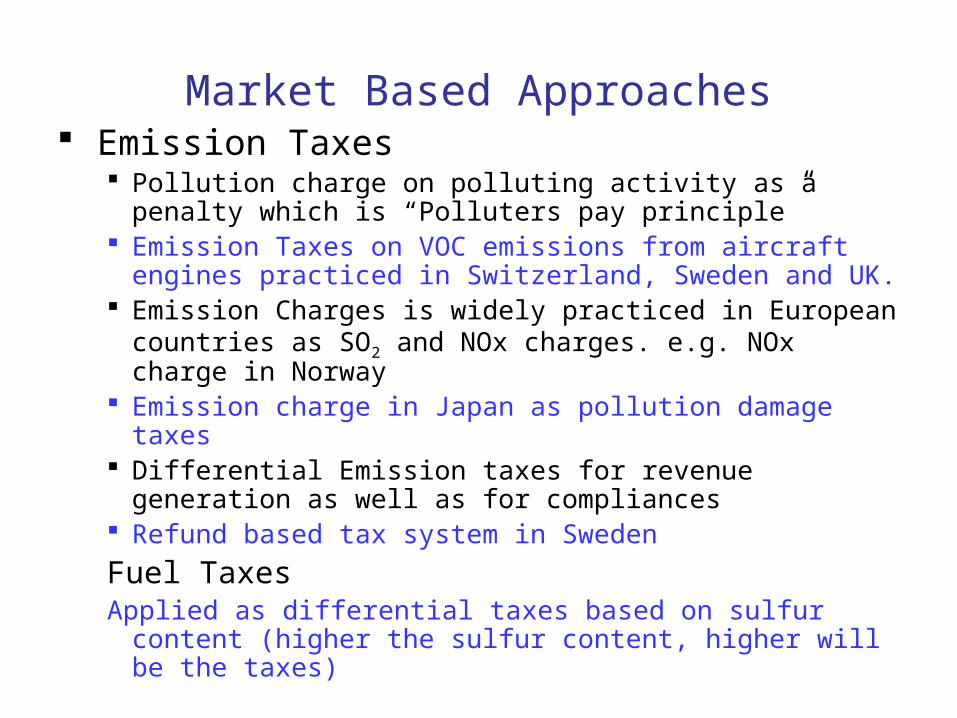
Market Based Approaches Emission Taxes
Pollution charge on polluting activity as a penalty which is “Polluters pay principle”
Emission Taxes on VOC emissions from aircraft engines practiced in Switzerland, Sweden and UK.
Emission Charges is widely practiced in European countries as SO2 and NOx charges. e.g. NOx charge in Norway
Emission charge in Japan as pollution damage taxes Differential Emission taxes for revenue generation as
well as for compliances Refund based tax system in Sweden
Fuel TaxesApplied as differential taxes based on sulfur content
(higher the sulfur content, higher will be the taxes)
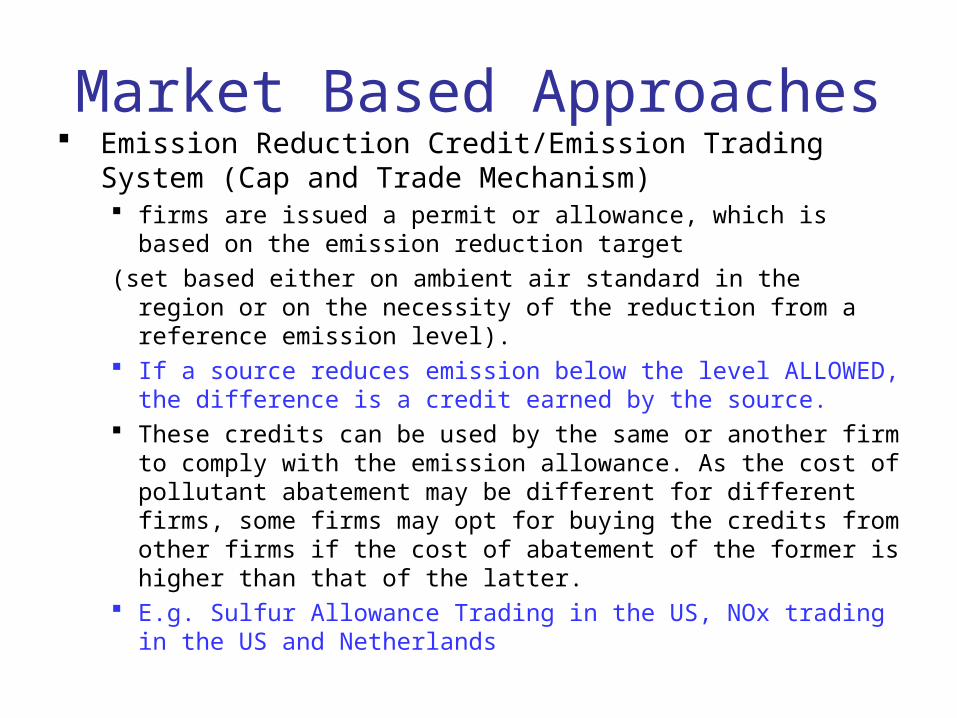
Market Based Approaches Emission Reduction Credit/Emission Trading System
(Cap and Trade Mechanism) firms are issued a permit or allowance, which is based on the
emission reduction target
(set based either on ambient air standard in the region or on the necessity of the reduction from a reference emission level).
If a source reduces emission below the level ALLOWED, the difference is a credit earned by the source.
These credits can be used by the same or another firm to comply with the emission allowance. As the cost of pollutant abatement may be different for different firms, some firms may opt for buying the credits from other firms if the cost of abatement of the former is higher than that of the latter.
E.g. Sulfur Allowance Trading in the US, NOx trading in the US and Netherlands
Approaches based on Voluntary Action
In these apporaches, individuals or individual firms engage in pollution-control activities in the absence of any formal, legal obligation to do so.
In Poland, in addition to the command and control approach, names of top 80 the worst national polluters are published. This has helped increase compliance of the standards in the country (Peszko et al, 2001).
Another example of voluntary action is the willingness on the part of some electricity users to buy green electricity (electricity from renewable energy technologies) at a premium price. This is also known as the concept of Green Pricing, which exists in Europe and the US.
Other ApproachesFuel Switching Options Switching to the cleaner fuels
Use of low sulfur content fuel (e.g. ultra low sulfur diesel )has been widely adapted in developed countries like USA and European countries
Switching to cleaner fuels like CNG and electric vehicles are some of the options in practice Public Passenger Transport Vehicle switching to Compressed
Natural Gas Vehicles in Delhi Electric Vehicles in Nepal (using electricity from hydro
resources)
Renewable Portfolio Standards
Energy Efficiency Improvement (Demand and Supply Side)-integrated resource planning
Land-use planning in urban region (compact city)
Other Approaches Congestion Charge
It is a charge applied to the vehicles using a designated region based on the degree of congestion. (e.g. Singapore, Hongkong and London).
Though the main purpose of this practice is to reduce traffic congestion in and around the charging zone rather than to obtain environmental benefit, this practice is able to reduce NOx and particulate matter to a larger extent within the charging zone (Beevers et al., 2005).
License permits It is aimed at reducing the congestion related pollution from
vehicles in designated time. These permits are used by Regulatory body in countries like Singapore and Chile for regulating the vehicular operation. A user requires acquiring these permits in order to run his/her vehicle.
Other approaches
Banning of Vehicles imposing a regulation that ban cars running on
designated day. E.g. in Mexico, the day was determined by the last
digit of the license plate;
• Restricting the vehicle operating days e.g., by using even and odd number of the license plates. However, it is reported that, in Mexico, the practice
was counterproductive with over investment in new vehicles in longer run.

Some good practices
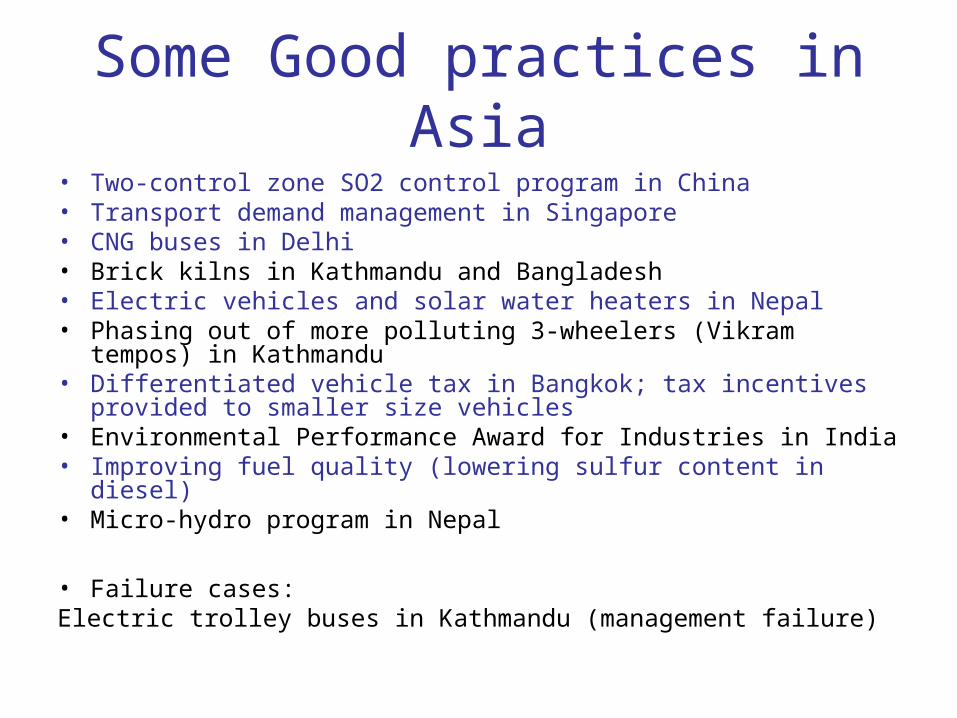
Some Good practices in Asia• Two-control zone SO2 control program in China• Transport demand management in Singapore• CNG buses in Delhi• Brick kilns in Kathmandu and Bangladesh• Electric vehicles and solar water heaters in Nepal • Phasing out of more polluting 3-wheelers (Vikram tempos) in
Kathmandu• Differentiated vehicle tax in Bangkok; tax incentives provided to
smaller size vehicles• Environmental Performance Award for Industries in India• Improving fuel quality (lowering sulfur content in diesel)• Micro-hydro program in Nepal
• Failure cases:Electric trolley buses in Kathmandu (management failure)
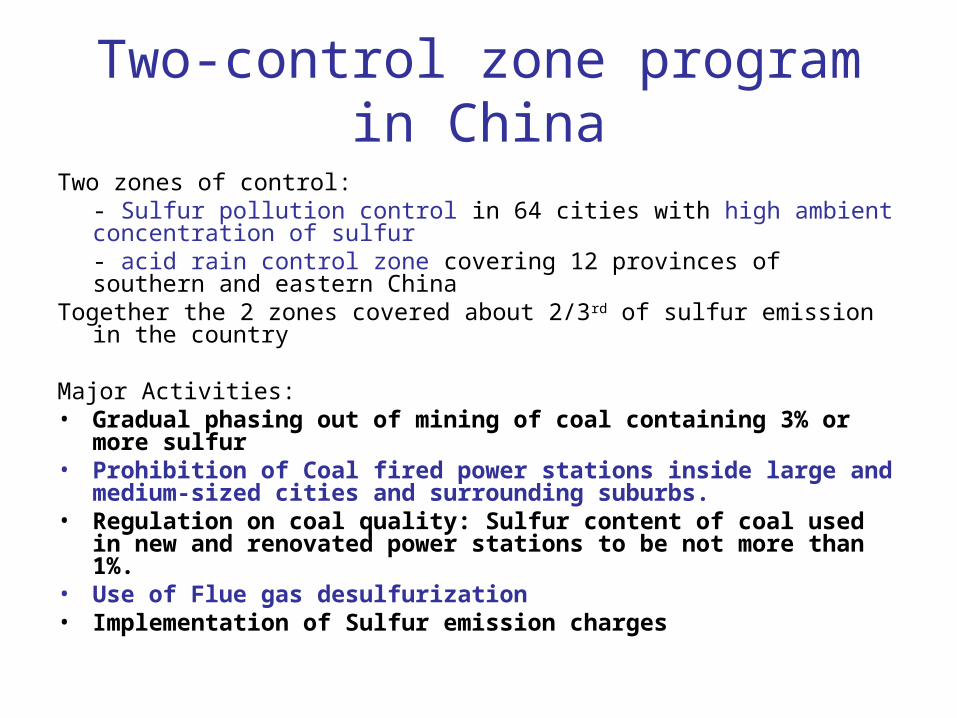
Two-control zone program in China
Two zones of control:- Sulfur pollution control in 64 cities with high ambient concentration of sulfur- acid rain control zone covering 12 provinces of southern and eastern China
Together the 2 zones covered about 2/3rd of sulfur emission in the country
Major Activities:• Gradual phasing out of mining of coal containing 3% or more sulfur • Prohibition of Coal fired power stations inside large and medium-sized
cities and surrounding suburbs.• Regulation on coal quality: Sulfur content of coal used in new and
renovated power stations to be not more than 1%.• Use of Flue gas desulfurization• Implementation of Sulfur emission charges
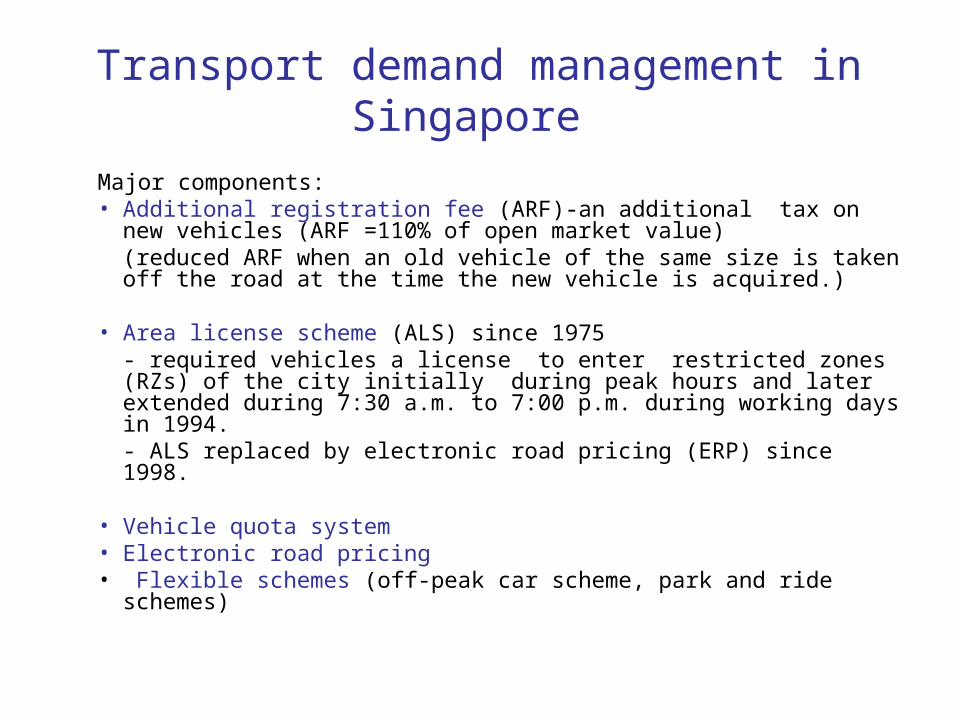
Transport demand management in Singapore
Major components:• Additional registration fee (ARF)-an additional tax on new
vehicles (ARF =110% of open market value)(reduced ARF when an old vehicle of the same size is taken off the road at the time the new vehicle is acquired.)
• Area license scheme (ALS) since 1975- required vehicles a license to enter restricted zones (RZs) of the city initially during peak hours and later extended during 7:30 a.m. to 7:00 p.m. during working days in 1994.- ALS replaced by electronic road pricing (ERP) since 1998.
• Vehicle quota system• Electronic road pricing• Flexible schemes (off-peak car scheme, park and ride
schemes)
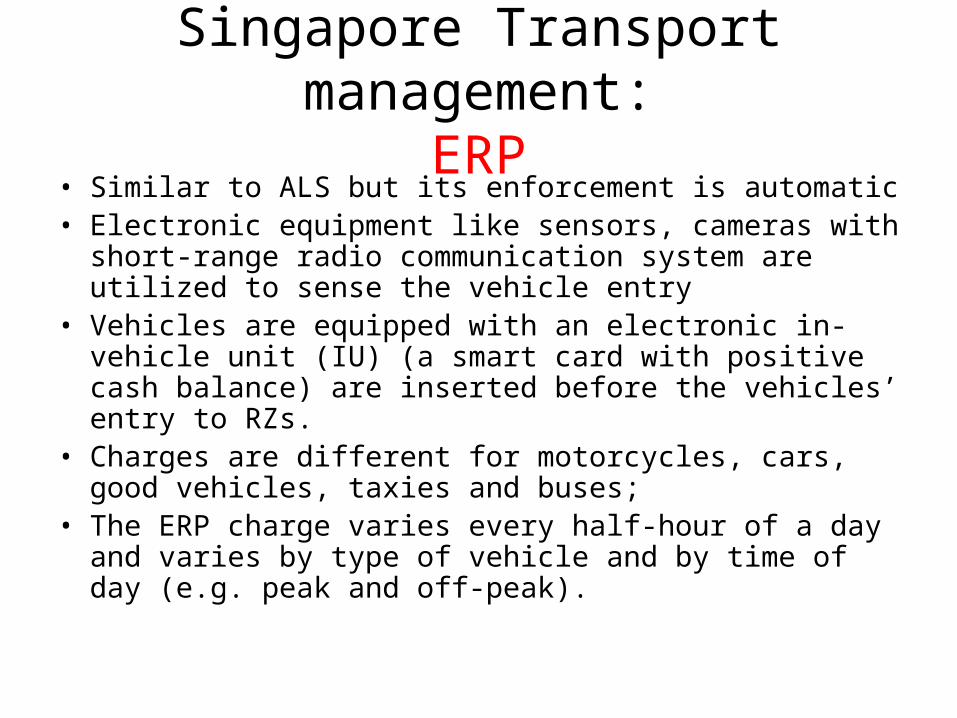
Singapore Transport management:ERP
• Similar to ALS but its enforcement is automatic• Electronic equipment like sensors, cameras with short-
range radio communication system are utilized to sense the vehicle entry
• Vehicles are equipped with an electronic in-vehicle unit (IU) (a smart card with positive cash balance) are inserted before the vehicles’ entry to RZs.
• Charges are different for motorcycles, cars, good vehicles, taxies and buses;
• The ERP charge varies every half-hour of a day and varies by type of vehicle and by time of day (e.g. peak and off-peak).
Singapore Transport management:Vehicle quota scheme (VQS)
• A quota on vehicles implemented since 1990.
• Requires all prospective purchasers of new vehicles to own a Certificate of Entitlement (COE) to operate vehicles on the road,
• COEs valid for 10 years and need to be purchased in an auction (open bidding process since 2002),
Singapore Transport management:Off-peak car scheme
• Permits to operate cars only during off-peak hours;
• Special permits to cars to run during weekends only under Weekend Car Scheme;
• OPC aims at reducing car usage during work days;
• Offers the new and existing car owners with OPC permits a rebate on car registration and road taxes
Singapore Transport demand management:
Other measures
• Improvement in communication system
• investments on and improvements to public transport system
• traffic management schemes;
• integrated transport and landuse planning
The Singapore Example: Can it be replicable?
• The prerequisites:– Provision of a good alternative public
transport system– strong commitment of govt. on better air
quality– Effective enforcement mechanism– Effective communication system
Better managability of vehicle growth being a city state
CNG Public Passenger vehicles in Delhi
• The Supreme Court of India through its verdicts and directives played the major role in conversion of buses to CNG use in Delhi.– Judicial activism (or a judicial “good practice”)
• Inadequacy of CNG filling stations and shortage were the initial hurdles.
• By 2003, all buses and nearly all auto-rickshaws were reported to operate on CNG.
• By 2006, 10,761 buses, 63,962 three wheelers, 19,351 private cars, over 5,229 taxis and 5, 258 vans running on CNG.
• SO2 concentration drastically reduced to the safe level during 1998-2005.
• NOx concentration within annual average national standard, but an increasing trend recently.
• Suspended particulate matter far above the national standard.
Judicial good practices (?)
• Pro-environmental/pro-public health judicial interventions (through public interest litigations) in India.
• Supreme court verdicts/directives on CNG buses in New Delhi and polluting industries around Agra.
• Similar judicial interventions in other countries
CNG vehicles in other countries
• Over 900,000 CNG vehicles in Pakistan
• Examples of Bangladesh
• CNG taxis and micro-buses in Bangkok
The US Acid Rain Program (1)
• Started in 1995– initially affected 263 large mostly coal fired plants
• Uses a market based (“cap and trade”) approach.• Plants or units that emit below their allowed level can
– trade the surplus allowances with other units in their system (within the same utility) or
– sell them to other utilities– bank them to meet emission reduction obligations in future years
• Some allowances (2.8%) are auctioned annually by USEPA. Typically, environmental groups acquire them for different purposes including permanent retirement of the allowances (which would lower the emission limit permanently).
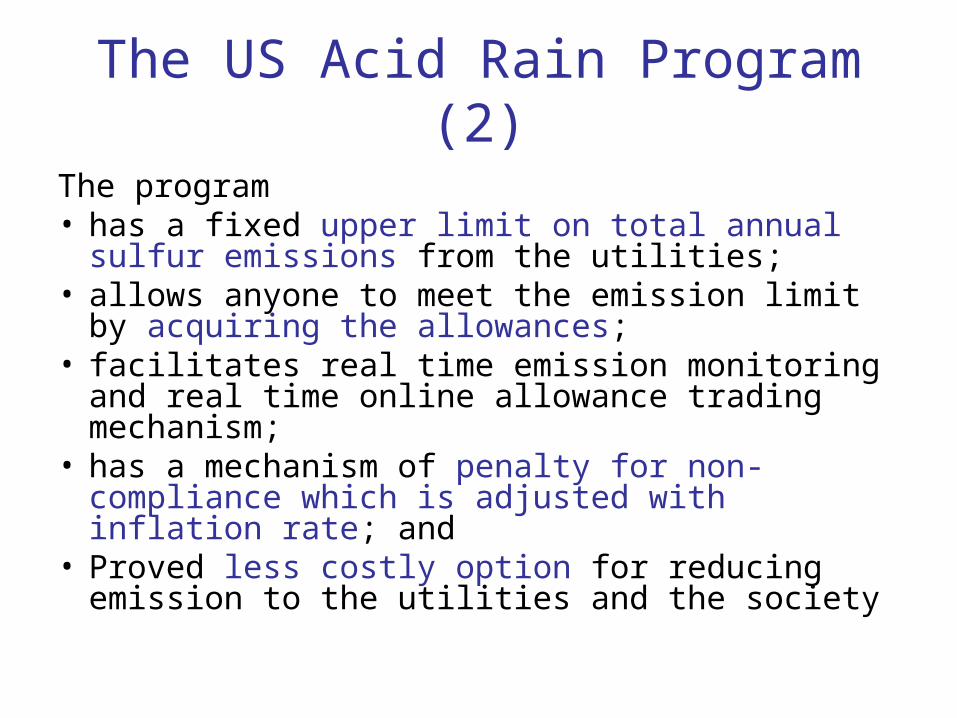
The US Acid Rain Program (2)
The program• has a fixed upper limit on total annual sulfur
emissions from the utilities; • allows anyone to meet the emission limit by
acquiring the allowances; • facilitates real time emission monitoring and real
time online allowance trading mechanism;• has a mechanism of penalty for non-compliance
which is adjusted with inflation rate; and• Proved less costly option for reducing emission
to the utilities and the society
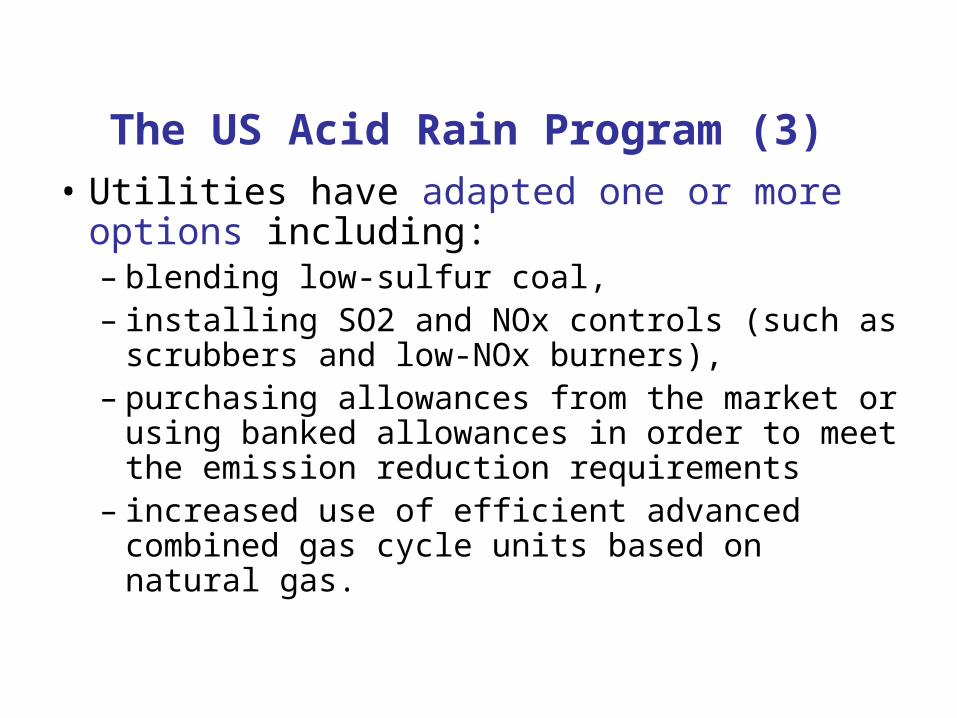
The US Acid Rain Program (3)
• Utilities have adapted one or more options including:– blending low-sulfur coal, – installing SO2 and NOx controls (such as
scrubbers and low-NOx burners),– purchasing allowances from the market or
using banked allowances in order to meet the emission reduction requirements
– increased use of efficient advanced combined gas cycle units based on natural gas.
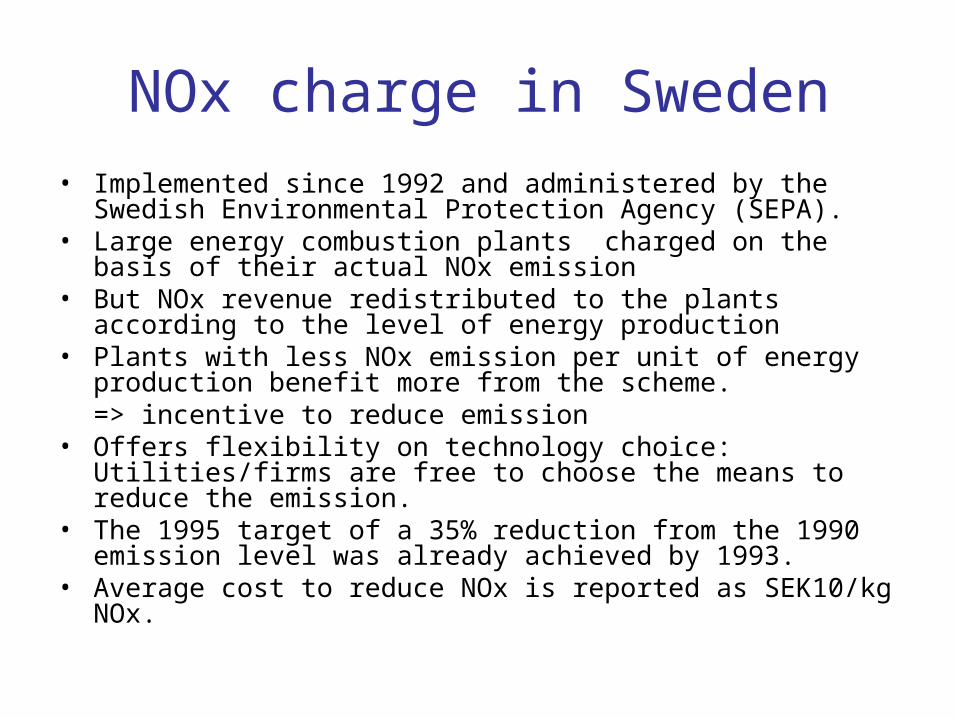
NOx charge in Sweden• Implemented since 1992 and administered by the Swedish
Environmental Protection Agency (SEPA).• Large energy combustion plants charged on the basis of their
actual NOx emission• But NOx revenue redistributed to the plants according to the level of
energy production• Plants with less NOx emission per unit of energy production benefit
more from the scheme.=> incentive to reduce emission
• Offers flexibility on technology choice: Utilities/firms are free to choose the means to reduce the emission.
• The 1995 target of a 35% reduction from the 1990 emission level was already achieved by 1993.
• Average cost to reduce NOx is reported as SEK10/kg NOx.
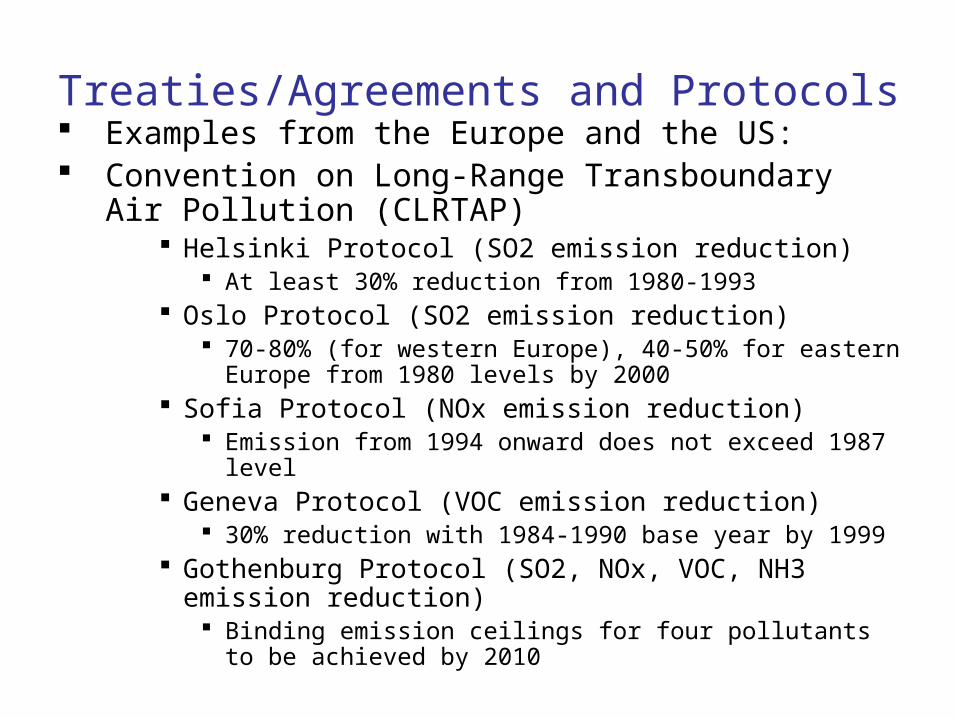
Treaties/Agreements and Protocols Examples from the Europe and the US: Convention on Long-Range Transboundary Air Pollution
(CLRTAP) Helsinki Protocol (SO2 emission reduction)
At least 30% reduction from 1980-1993 Oslo Protocol (SO2 emission reduction)
70-80% (for western Europe), 40-50% for eastern Europe from 1980 levels by 2000
Sofia Protocol (NOx emission reduction) Emission from 1994 onward does not exceed 1987 level
Geneva Protocol (VOC emission reduction) 30% reduction with 1984-1990 base year by 1999
Gothenburg Protocol (SO2, NOx, VOC, NH3 emission reduction)
Binding emission ceilings for four pollutants to be achieved by 2010
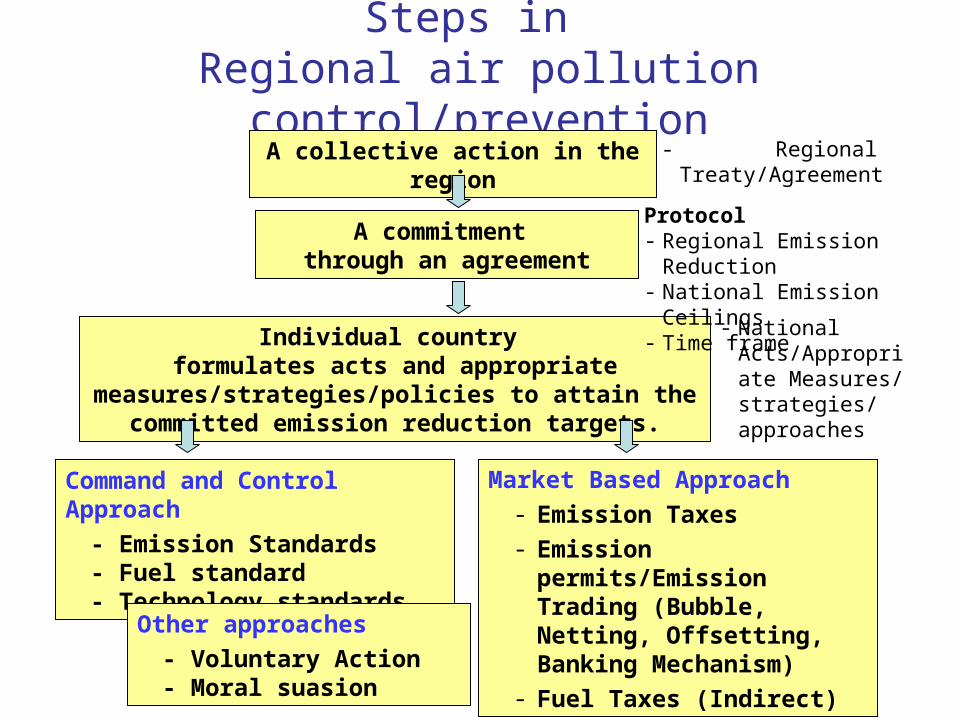
Steps in Regional air pollution control/prevention
A collective action in the region
A commitment through an agreement
Individual country formulates acts and appropriate
measures/strategies/policies to attain the committed emission reduction targets.
- Regional Treaty/Agreement
- National Acts/Appropriate Measures/strategies/approaches
Protocol- Regional Emission Reduction- National Emission Ceilings- Time frame
Command and Control Approach
- Emission Standards- Fuel standard- Technology standards
Market Based Approach
- Emission Taxes
- Emission permits/Emission Trading (Bubble, Netting, Offsetting, Banking Mechanism)
- Fuel Taxes (Indirect)
Other approaches
- Voluntary Action- Moral suasion
Treaties/Agreements and Protocols
European Commission National Emission Ceilings Directive (2001/81/EC)
Similar to Gothenburg Protocol but more stringent Target for SO2, NOx, VOC, NH3
Malé Declaration in South Asia It does not have a protocol yet.
Policy analysis of environmental policies/strategies
Should a good practice in a country be necessarily effective and good elsewhere?
Answer lies on the outcome of policy analysis (based on various criteria):- Cost of implementing a policy/strategy (economic efficiency, cost effectiveness)- Financial affordability- scientific, technical and managerial capacity to design implement the policy- administrative complexity (enforcement capacity)- political will and sensitivity- social acceptability- environmental effectiveness
Constraints in South Asian Countries
• Lack of capacity to monitor and enforce the regulations/policies
- Environmental Acts alone not enough (e.g., Nepal)• Inadequate scientific/technical capacity to analyze emissions,
assess impacts, and formulate appropriate policies/strategies
- Large share of small firms (more difficult to monitor and enforce)
- Inadequate resource allocation for environmental protection activities

Thank you