Embed Size (px)
Citation preview
7/29/2019 Gopalswamy and Yashiro 2013 a solar storm paper
http://slidepdf.com/reader/full/gopalswamy-and-yashiro-2013-a-solar-storm-paper 1/8
a r X i v : 1 3 0 9 . 2
0 4 6 v 1
[ a s t r o - p h . S R ] 9 S e p 2 0 1 3
PASJ: Publ. Astron. Soc. Japan , 1–??,c 2013. Astronomical Society of Japan.
Obscuration of Flare Emission by an Eruptive Prominence
Nat Gopalswamy1 and Seiji Yashiro1,2
1Code 671, NASA Goddard Space Flight Center, Greenbelt, MD 20771, USA2Department of Physics, The Catholic University of America, Washington DC 20064 USA
[email protected]; [email protected]
(Received ; accepted )
Abstract
We report on the eclipsing of microwave flare emission by an eruptive prominence from a neighboringregion as observed by the Nobeyama Radioheliograph at 17 GHz. The obscuration of the flare emissionappears as a dimming feature in the microwave flare light curve. We use the dimming feature to derive thetemperature of the prominence and the distribution of heating along the length of the filament. We findthat the prominence is heated to a temperature above the quiet Sun temperature at 17 GHz. The durationof the dimming is the time taken by the eruptive prominence in passing over the flaring region. We also findevidence for the obscuration in EUV images obtained by the Solar and Heliospheric Observatory (SOHO)mission.
Key words: Sun:prominences Sun: Flares Sun: coronal mass ejections Sun: microwave emission
1. Introduction
One of the greatest contributions of the Nobeyama ra-dioheliograph (NoRH, Nakajima et al. 1994) to the studyof solar eruptive phenomena is the information on theeruption of filaments and prominences, which are near-surface manifestations of coronal mass ejections (CMEs).Investigations involving Nobeyama prominence eruptionsand white-light CMEs have clarified a number of issuesand enhanced our understanding of solar eruptions (seee.g., Hanaoka et al. 1994; Gopalswamy and Hanaoka
1998; Gopalswamy et al. 1998; 1996; Hanaoka andShinkawa, 1999; Hori and Culhane, 2002; Gopalswamyand Thompson, 2000; Gopalswamy et al. 2003a; Kunduet al. 2004; Shimojo et al. 2006; Gopalswamy et al. 2012).By tracking the locations of prominence eruptions as afunction of time, it was found that the polarity rever-sal at solar poles coincided with the times of cessation of high latitude (poleward of 60◦) eruptions (Gopalswamyet al. 2003b; 2012). The spatial relationship betweenprominence eruptions and the associated CMEs has alsobeen useful in refining our understanding of CME deflec-tion by coronal holes, especially with respect to the evo-lution of the poloidal field of the Sun (Gopalswamy et al.
2000; Gopalswamy and Thompson, 2000). In particular,it was possible to show that the position angle of promi-nence eruptions is systematically offset poleward from theCME position angle during the rise phase of solar cycles(Gopalswamy et al. 2003a; 2012). This offset becomesrandom in the maximum phase because the polar coronalholes are present only up to the beginning of the maximumphase.
In this paper, we report on another aspect of promi-nence eruptions: obscuration of neighboring bright flarestructure by an eruptive prominence. The observationprovides quantitative information on the heating of the
prominence during its eruption. We also show that alarger volume of higher optical depth plasma surroundsthe eruptive filament.
2. Observational Overview
We are concerned about two flares that occurred in thesouthwest quadrant of the Sun during 2002 May 21-22.The first one was a C9.7 flares from active region NOAA9948 (S25W64) followed by a C5.0 flare from a neighbor-ing filament region (S30W34). A long quiescent filament,
which erupted in association with the C5.0 flare, obscuredthe preceding flare emission as it passed over it. A par-tial halo CME with a speed of 1246 km/s was associatedwith the C9.7 flare, while a full halo CME with a speedof 1557 km/s was associated with the C5.0 flare. The sec-ond CME produced an interplanetary type II radio burstand a large solar energetic particle event. Figure 1 showsthe region of interest consisting of AR 9948 with a largesunspot (Fig. 1a) and a neighboring filament observed inH-alpha (Fig. 1b) and in microwaves by NoRH (Fig. 1c).The filament extended slightly beyond the lower left cor-ner of the box shown in Fig. 1. The filament was locatedalong the neutral line of an extended plage region to the
east of AR9948. The sunspot in AR 9948 appears brightin microwaves (Fig.1c) because of the thermal gyroreso-nance emission due to the high magnetic field above thesunspot located in the negative polarity region. The C9.7flare, which started, peaked, and ended at 23:14, 00:30,and 01:28 UT, respectively involved the sunspot also.
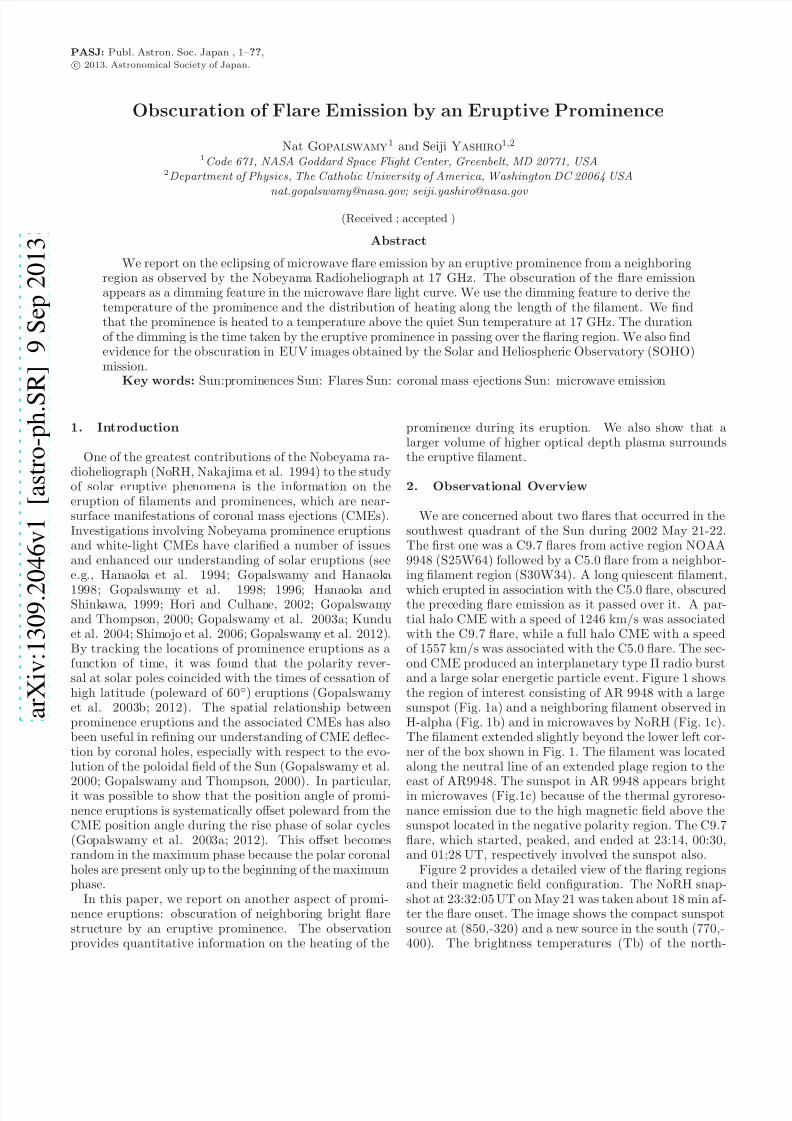
Figure 2 provides a detailed view of the flaring regionsand their magnetic field configuration. The NoRH snap-shot at 23:32:05 UT on May 21 was taken about 18 min af-ter the flare onset. The image shows the compact sunspotsource at (850,-320) and a new source in the south (770,-400). The brightness temperatures (Tb) of the north-
7/29/2019 Gopalswamy and Yashiro 2013 a solar storm paper
http://slidepdf.com/reader/full/gopalswamy-and-yashiro-2013-a-solar-storm-paper 2/8
2 Gopalswamy & Yashiro [Vol. ,
2002/05/21 16:27:04
(a)
2002/05/21 15:12:56
(b)
2002/05/21 23:05:01
(c)
Fig. 1. White light 16:27:05 UT (a) and H-alpha at 15:12:56 UT on May 21 (b) images from the Big Bear Solar Observatory, and17 GHz microwave image from the Nobeyama radioheliograph at 23:05 UT showing the region of interest. The Big Bear H-alpha
and white light images show the large sunspot in the negative polarity region of AR 9948.
2002/05/21 23:32:05
600 700 800 900 1000X (arcsecs)
-500
-400
-300
-200
-100
0
100
Y ( a r c s e c s )
Filament
2002/05/21 22:22:58
600 700 800 900 1000X (arcsecs)
-500
-400
-300
-200
-100
0
100
Y ( a r c s e c s )
Fig. 2. Overlay of microwave contours on the SOHO/MDI magnetogram showing Flare1 and the filament. The filament eruptionwas associated with a spotless flare and a fast CME. The contour levels are 6000, 7000, 8500, 10000, 12000, 15000, 20000, 30000,50000, 80000, 130000, 180000 K. In the case of the black (white) contours the brightness temperature decreases (increases) towardsthe peak. The sunspot source has the highest Tb (180,000 K). The southern flare source has a Tb of 130,000 K. The lowesttemperature in the filament is 6000 K.
7/29/2019 Gopalswamy and Yashiro 2013 a solar storm paper
http://slidepdf.com/reader/full/gopalswamy-and-yashiro-2013-a-solar-storm-paper 3/8
No. ] Obscuration by an Eruptive Prominence 3
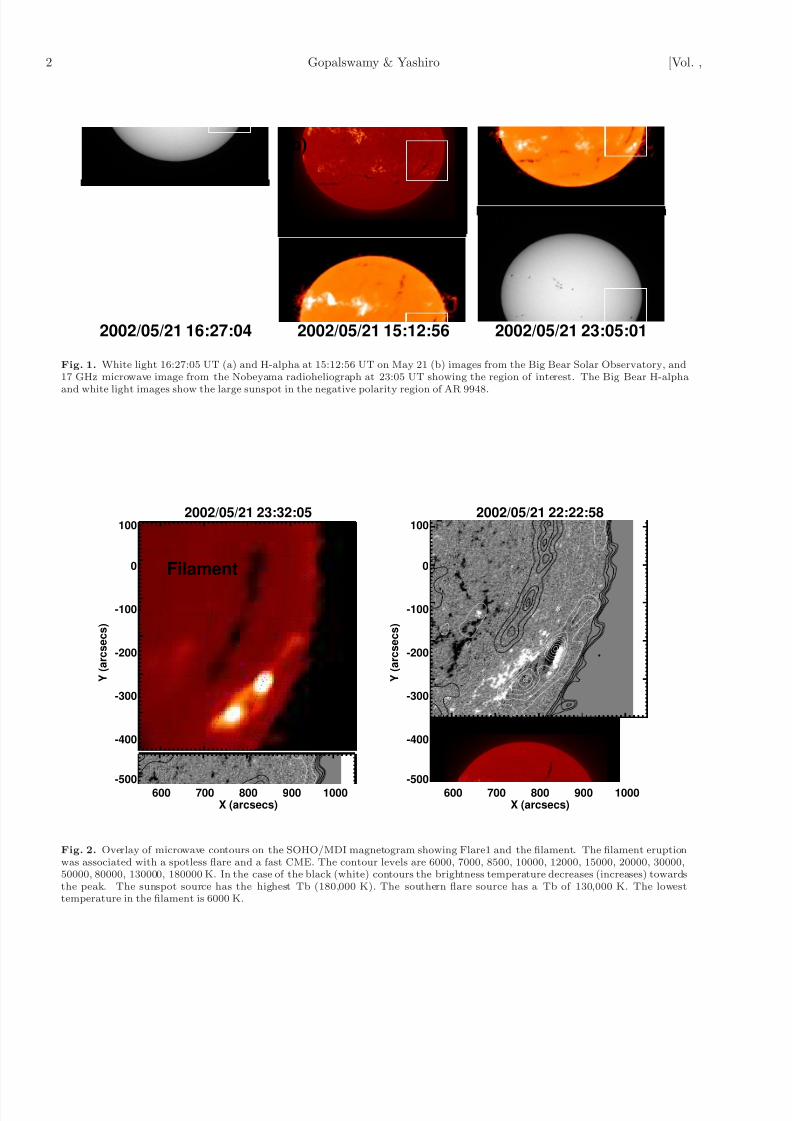
Fig. 3. Evolution of the two flares in question (Flare1 and Flare2) along with the eruptive filament from 23:05 UT on 2002 May 21to 03:38 UT on May 22. The filament (Fil) and the sunspot in the pre-eruption state are marked in the 23:05 UT (May 21) image.The post-eruption arcade of Flare1 is marked in the 01:02 UT (May 22) image. The first instance of significant obscuration by thefilament is at the location indicated by the arrow in the 03:12 UT image. In the images at 01:14 and 03:16 UT, the eruptive filament(EF) divides the flare emission into two parts. The flare emission starts recovering from 03:20 UT onwards and the eruptive filamentbecomes an eruptive prominence (EP) at 03:26 UT. The last image at 03:38 UT shows the post-eruption arcade corresponding toFlare2. The compact source is due to the Sunspot. In microwaves, the sunspots appear bright because of the thermal gyro-resonanceemission.
ern (sunspot) and southern sources were 1.8× 10⁵ K and1.3× 105 K, respectively. The sunspot source attained ahighest Tb of 4.9× 10⁵ K during its peak at 00:17:05 UTon May 22, about 13 min before the flare peak in softX-rays. The thermal component of the flare was in theform of a post-eruption arcade, which had an average Tbin the range 2− 3× 10⁴ K (more details in the next sec-tion). The thermal emission encompassed the two com-pact sources and occupied a much larger volume. Thefilament and the compact sources are shown overlaid ascontours on the nearest SOHO/MDI magnetogram takenat 22:22:58 UT on May 21 and rotated to the time of theNoRH image. The two compact sources are on opposite
polarity regions. The filament in question divides the op-posite polarity regions of the large plage region to the eastof the sunspot.
The lowest brightness temperature was ∼ 6000 K in thedarkest parts of the filament shown in Fig. 2. The quiet-Sun Tb is ∼ 104 K, corresponding to the level between thehighest dark contour (104 K) and the lowest white contour(1.2× 10⁴ K). The second flare started near the southernend of the filament, where the filament had a higher Tb,close to the quiet Sun level. The filament started liftingoff slowly around 03:12 UT on May 22 and the soft X-ray
flare started around 3:18 UT. The first flare was in thedecay phase at this time, but the post eruption arcadewas clearly observed in microwaves. The northern leg of the filament remained anchored throughout the eruption.Between 03:12 and 03:24 UT, the eruptive filament passedover the arcade of the first flare causing the dimming weare interested in.
3. Detailed Evolution of the Two Flaring Regions
Figure 3 shows a series of NoRH images between 23:05UT on May 21 to 03:38 UT on May 23 illustrating the evo-lution of the two flares and the eruptive filament eclipsing
the microwave emission from the first flare. In the pre-flare state, all we see is the bright sunspot and some plagebrightening to the south of the spot (23:08 UT). When theflare started, new compact footpoint sources appeared inthe south and at the southern edge of the sunspot (22:32UT). In the next few minutes, the flare emission appearedin the region between the two compact sources and to thenorth of the sunspot. Between 00:02 and 01:44 UT, theflare arcade grew in size and the sunspot emission was nolonger bright enough to be seen distinctly. When the flarearcade started fading by 02:31 UT, the sunspot emissioncan be seen again as a compact source. Around 03:05
7/29/2019 Gopalswamy and Yashiro 2013 a solar storm paper
http://slidepdf.com/reader/full/gopalswamy-and-yashiro-2013-a-solar-storm-paper 4/8
4 Gopalswamy & Yashiro [Vol. ,
2002/05/22 04:01:05
(a)
R2 R1
Beam
22:00 00:00 02:00 04:00 06:00
104
105
22:00 00:00 02:00 04:00 06:00
104
105(b)
dimmingR1 T
B
[ K ]
C
M
22:00 00:00 02:00 04:00 06:00
104
105
22:00 00:00 02:00 04:00 06:00
104
105(c)
R2
T B
[ K ]
C
M
22:00 00:00 02:00 04:00 06:00
0
10
20
30
40
22:00 00:00 02:00 04:00 06:00
0
10
20
30
40
(d)
B e a m S
i z e [ a r c s e c ]
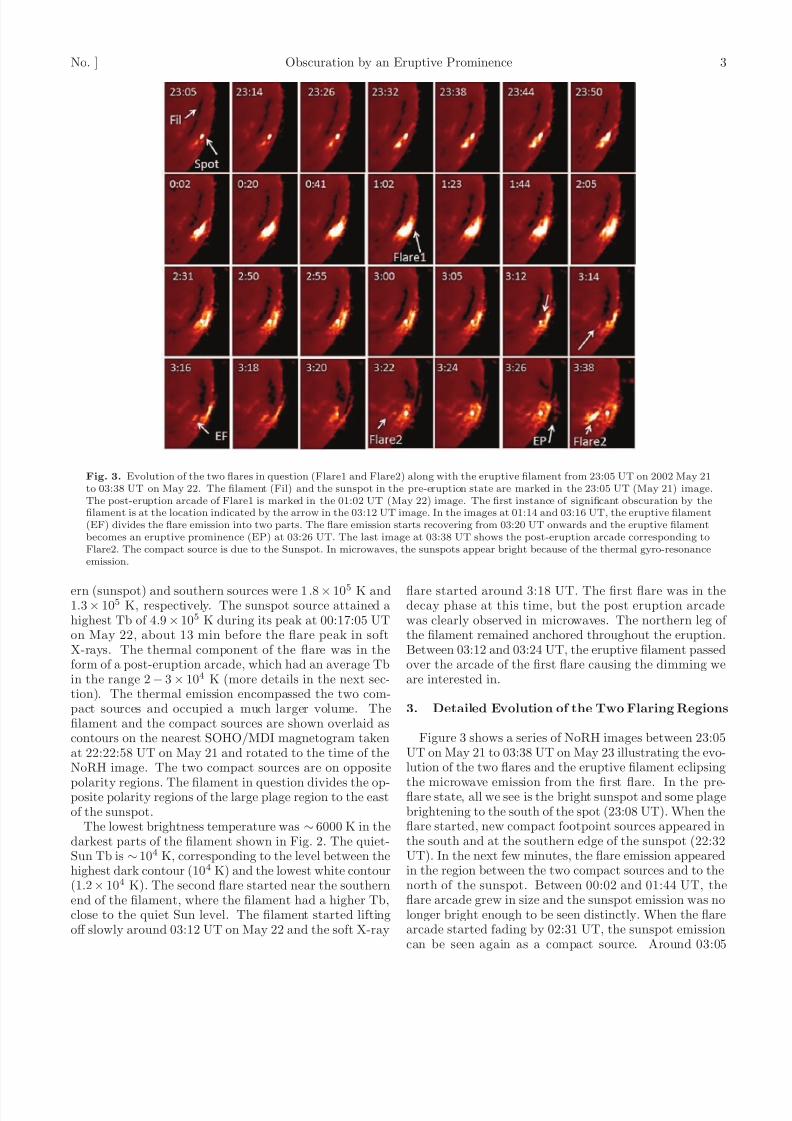
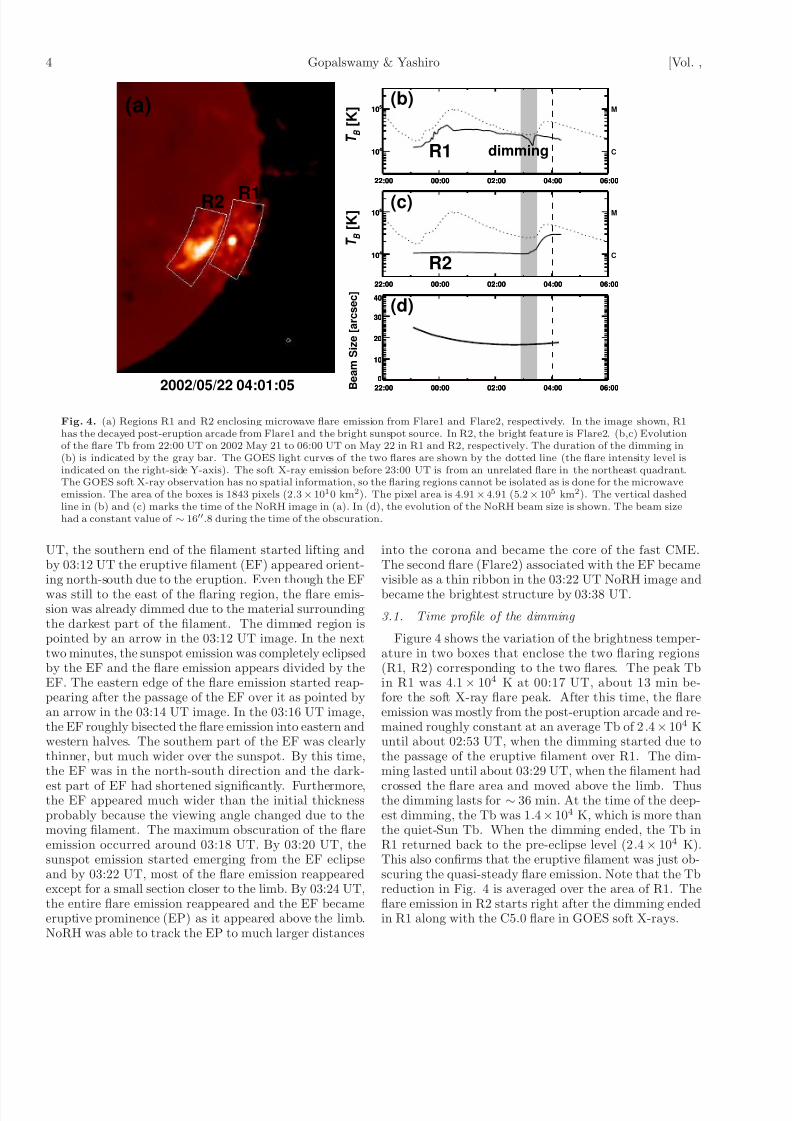
Fig. 4. (a) Regions R1 and R2 enclosing microwave flare emission from Flare1 and Flare2, respectively. In the image shown, R1has the decayed post-eruption arcade from Flare1 and the bright sunspot source. In R2, the bright feature is Flare2. (b,c) Evolutionof the flare Tb from 22:00 UT on 2002 May 21 to 06:00 UT on May 22 in R1 and R2, respectively. The duration of the dimming in(b) is indicated by the gray bar. The GOES light curves of the two flares are shown by the dotted line (the flare intensity level isindicated on the right-side Y-axis). The soft X-ray emission before 23:00 UT is from an unrelated flare in the northeast quadrant.The GOES soft X-ray observation has no spatial information, so the flaring regions cannot be isolated as is done for the microwaveemission. The area of the boxes is 1843 pixels (2.3× 10¹⁰ km2). The pixel area is 4.91× 4.91 (5.2× 10⁵ km2). The vertical dashedline in (b) and (c) marks the time of the NoRH image in (a). In (d), the evolution of the NoRH beam size is shown. The beam sizehad a constant value of ∼ 16′′
.8 during the time of the obscuration.
UT, the southern end of the filament started lifting andby 03:12 UT the eruptive filament (EF) appeared orient-ing north-south due to the eruption. Even though the EFwas still to the east of the flaring region, the flare emis-sion was already dimmed due to the material surroundingthe darkest part of the filament. The dimmed region ispointed by an arrow in the 03:12 UT image. In the nexttwo minutes, the sunspot emission was completely eclipsedby the EF and the flare emission appears divided by theEF. The eastern edge of the flare emission started reap-pearing after the passage of the EF over it as pointed byan arrow in the 03:14 UT image. In the 03:16 UT image,the EF roughly bisected the flare emission into eastern andwestern halves. The southern part of the EF was clearlythinner, but much wider over the sunspot. By this time,the EF was in the north-south direction and the dark-
est part of EF had shortened significantly. Furthermore,the EF appeared much wider than the initial thicknessprobably because the viewing angle changed due to themoving filament. The maximum obscuration of the flareemission occurred around 03:18 UT. By 03:20 UT, thesunspot emission started emerging from the EF eclipseand by 03:22 UT, most of the flare emission reappearedexcept for a small section closer to the limb. By 03:24 UT,the entire flare emission reappeared and the EF becameeruptive prominence (EP) as it appeared above the limb.NoRH was able to track the EP to much larger distances
into the corona and became the core of the fast CME.The second flare (Flare2) associated with the EF becamevisible as a thin ribbon in the 03:22 UT NoRH image andbecame the brightest structure by 03:38 UT.
3.1. Time profile of the dimming
Figure 4 shows the variation of the brightness temper-ature in two boxes that enclose the two flaring regions(R1, R2) corresponding to the two flares. The peak Tbin R1 was 4.1× 10⁴ K at 00:17 UT, about 13 min be-fore the soft X-ray flare peak. After this time, the flareemission was mostly from the post-eruption arcade and re-mained roughly constant at an average Tb of 2.4× 10⁴ Kuntil about 02:53 UT, when the dimming started due tothe passage of the eruptive filament over R1. The dim-ming lasted until about 03:29 UT, when the filament had
crossed the flare area and moved above the limb. Thusthe dimming lasts for ∼ 36 min. At the time of the deep-est dimming, the Tb was 1.4×10⁴ K, which is more thanthe quiet-Sun Tb. When the dimming ended, the Tb inR1 returned back to the pre-eclipse level (2.4× 10⁴ K).This also confirms that the eruptive filament was just ob-scuring the quasi-steady flare emission. Note that the Tbreduction in Fig. 4 is averaged over the area of R1. Theflare emission in R2 starts right after the dimming endedin R1 along with the C5.0 flare in GOES soft X-rays.
7/29/2019 Gopalswamy and Yashiro 2013 a solar storm paper
http://slidepdf.com/reader/full/gopalswamy-and-yashiro-2013-a-solar-storm-paper 5/8
No. ] Obscuration by an Eruptive Prominence 5
2002/05/22 04:01:05
(a)
Beam
00:00 02:00 04:00103
104
105
(b)
T B
[ K ]
03:13
00:00 02:00 04:00103
104
105
(c)
03:17
00:00 02:00 04:00103
104
105
(d)
03:20
00:00 02:00 04:00
103
104
105
(e)
T B
[ K ]
03:10
00:00 02:00 04:00
103
104
105
106
(f)
03:17
00:00 02:00 04:00
103
104
105
(g)
03:21
00:00 02:00 04:00
103
104
105
(h)
T B
[ K ]
03:10
00:00 02:00 04:00
103
104
105
(i)
03:17
00:00 02:00 04:00
103
104
105
(j)
03:20
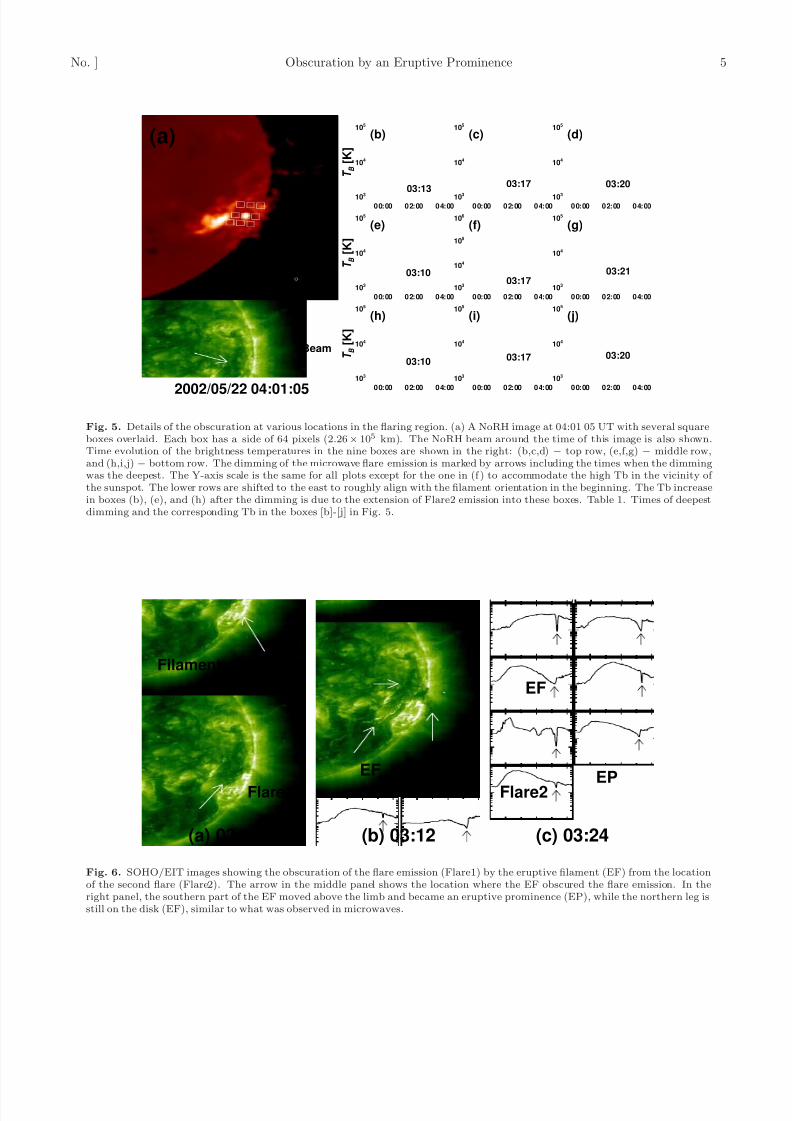
Fig. 5. Details of the obscuration at various locations in the flaring region. (a) A NoRH image at 04:01 05 UT with several squareboxes overlaid. Each box has a side of 64 pixels (2.26× 10⁵ km). The NoRH beam around the time of this image is also shown.Time evolution of the brightness temperatures in the nine boxes are shown in the right: (b,c,d) − top row, (e,f,g) − middle row,and (h,i,j) − bottom row. The dimming of the microwave flare emission is marked by arrows including the times when the dimmingwas the deepest. The Y-axis scale is the same for all plots except for the one in (f ) to accommodate the high Tb in the vicinity of the sunspot. The lower rows are shifted to the east to roughly align with the filament orientation in the beginning. The Tb increasein boxes (b), (e), and (h) after the dimming is due to the extension of Flare2 emission into these boxes. Table 1. Times of deepestdimming and the corresponding Tb in the boxes [b]-[j] in Fig. 5.
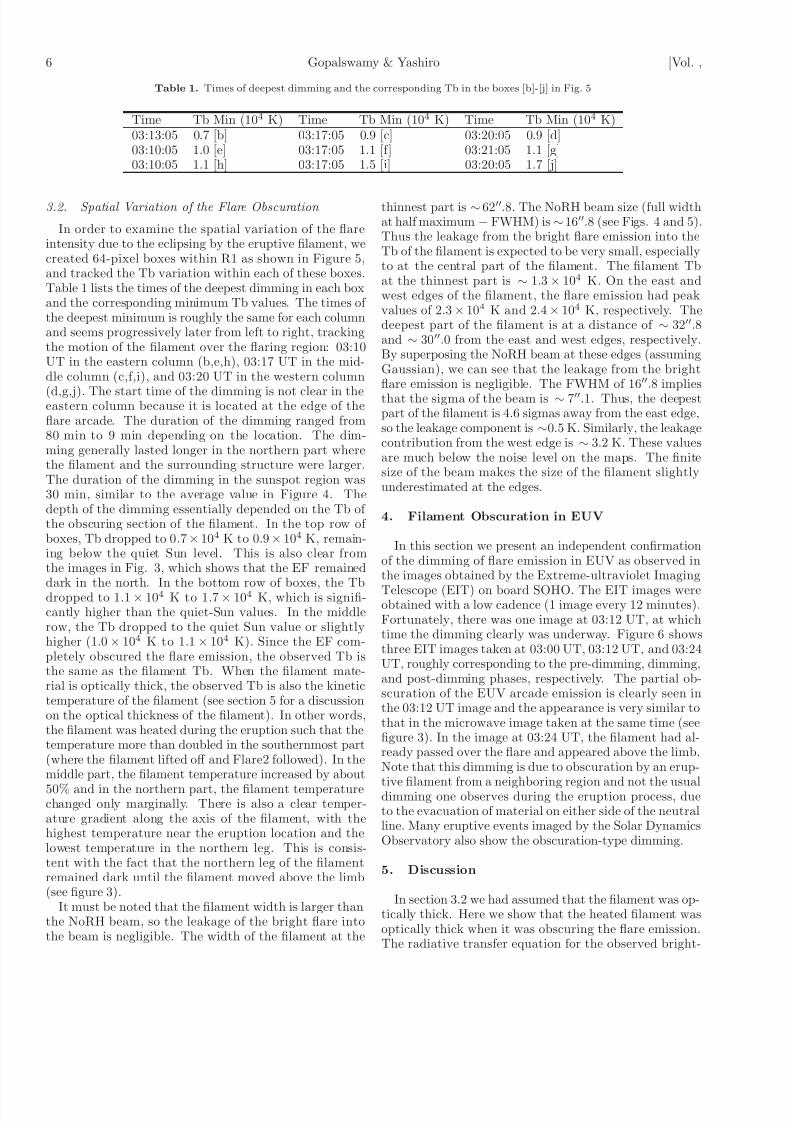
(a) 03:00
Filament
Flare1
EF
(b) 03:12
EF
Flare2 EP
(c) 03:24
Fig. 6. SOHO/EIT images showing the obscuration of the flare emission (Flare1) by the eruptive filament (EF) from the locationof the second flare (Flare2). The arrow in the middle panel shows the location where the EF obscured the flare emission. In theright panel, the southern part of the EF moved above the limb and became an eruptive prominence (EP), while the northern leg isstill on the disk (EF), similar to what was observed in microwaves.
7/29/2019 Gopalswamy and Yashiro 2013 a solar storm paper
http://slidepdf.com/reader/full/gopalswamy-and-yashiro-2013-a-solar-storm-paper 6/8
6 Gopalswamy & Yashiro [Vol. ,
Table 1. Times of deepest dimming and the corresponding Tb in the boxes [b]-[j] in Fig. 5
Time Tb Min (104 K) Time Tb Min (104 K) Time Tb Min (104 K)03:13:05 0.7 [b] 03:17:05 0.9 [c] 03:20:05 0.9 [d]03:10:05 1.0 [e] 03:17:05 1.1 [f] 03:21:05 1.1 [g]03:10:05 1.1 [h] 03:17:05 1.5 [i] 03:20:05 1.7 [j]
3.2. Spatial Variation of the Flare Obscuration
In order to examine the spatial variation of the flareintensity due to the eclipsing by the eruptive filament, wecreated 64-pixel boxes within R1 as shown in Figure 5,and tracked the Tb variation within each of these boxes.Table 1 lists the times of the deepest dimming in each boxand the corresponding minimum Tb values. The times of the deepest minimum is roughly the same for each columnand seems progressively later from left to right, trackingthe motion of the filament over the flaring region: 03:10UT in the eastern column (b,e,h), 03:17 UT in the mid-dle column (c,f,i), and 03:20 UT in the western column
(d,g,j). The start time of the dimming is not clear in theeastern column because it is located at the edge of theflare arcade. The duration of the dimming ranged from80 min to 9 min depending on the location. The dim-ming generally lasted longer in the northern part wherethe filament and the surrounding structure were larger.The duration of the dimming in the sunspot region was30 min, similar to the average value in Figure 4. Thedepth of the dimming essentially depended on the Tb of the obscuring section of the filament. In the top row of boxes, Tb dropped to 0.7× 10⁴ K to 0.9× 10⁴ K, remain-ing below the quiet Sun level. This is also clear fromthe images in Fig. 3, which shows that the EF remained
dark in the north. In the bottom row of boxes, the Tbdropped to 1.1× 10⁴ K to 1.7× 10⁴ K, which is signifi-cantly higher than the quiet-Sun values. In the middlerow, the Tb dropped to the quiet Sun value or slightlyhigher (1.0× 10⁴ K to 1.1× 10⁴ K). Since the EF com-pletely obscured the flare emission, the observed Tb isthe same as the filament Tb. When the filament mate-rial is optically thick, the observed Tb is also the kinetictemperature of the filament (see section 5 for a discussionon the optical thickness of the filament). In other words,the filament was heated during the eruption such that thetemperature more than doubled in the southernmost part(where the filament lifted off and Flare2 followed). In themiddle part, the filament temperature increased by about
50% and in the northern part, the filament temperaturechanged only marginally. There is also a clear temper-ature gradient along the axis of the filament, with thehighest temperature near the eruption location and thelowest temperature in the northern leg. This is consis-tent with the fact that the northern leg of the filamentremained dark until the filament moved above the limb(see figure 3).
It must be noted that the filament width is larger thanthe NoRH beam, so the leakage of the bright flare intothe beam is negligible. The width of the filament at the
thinnest part is ∼ 62′′.8. The NoRH beam size (full widthat half maximum − FWHM) is∼16′′.8 (see Figs. 4 and 5).Thus the leakage from the bright flare emission into theTb of the filament is expected to be very small, especiallyto at the central part of the filament. The filament Tbat the thinnest part is ∼ 1.3× 10⁴ K. On the east andwest edges of the filament, the flare emission had peakvalues of 2.3× 10⁴ K and 2.4× 10⁴ K, respectively. Thedeepest part of the filament is at a distance of ∼ 32′′.8and ∼ 30′′.0 from the east and west edges, respectively.By superposing the NoRH beam at these edges (assumingGaussian), we can see that the leakage from the brightflare emission is negligible. The FWHM of 16′′.8 impliesthat the sigma of the beam is ∼ 7′′.1. Thus, the deepestpart of the filament is 4.6 sigmas away from the east edge,so the leakage component is ∼0.5 K. Similarly, the leakagecontribution from the west edge is ∼ 3.2 K. These valuesare much below the noise level on the maps. The finitesize of the beam makes the size of the filament slightlyunderestimated at the edges.
4. Filament Obscuration in EUV
In this section we present an independent confirmationof the dimming of flare emission in EUV as observed inthe images obtained by the Extreme-ultraviolet Imaging
Telescope (EIT) on board SOHO. The EIT images wereobtained with a low cadence (1 image every 12 minutes).Fortunately, there was one image at 03:12 UT, at whichtime the dimming clearly was underway. Figure 6 showsthree EIT images taken at 03:00 UT, 03:12 UT, and 03:24UT, roughly corresponding to the pre-dimming, dimming,and post-dimming phases, respectively. The partial ob-scuration of the EUV arcade emission is clearly seen inthe 03:12 UT image and the appearance is very similar tothat in the microwave image taken at the same time (seefigure 3). In the image at 03:24 UT, the filament had al-ready passed over the flare and appeared above the limb.Note that this dimming is due to obscuration by an erup-
tive filament from a neighboring region and not the usualdimming one observes during the eruption process, dueto the evacuation of material on either side of the neutralline. Many eruptive events imaged by the Solar DynamicsObservatory also show the obscuration-type dimming.
5. Discussion
In section 3.2 we had assumed that the filament was op-tically thick. Here we show that the heated filament wasoptically thick when it was obscuring the flare emission.The radiative transfer equation for the observed bright-
7/29/2019 Gopalswamy and Yashiro 2013 a solar storm paper
http://slidepdf.com/reader/full/gopalswamy-and-yashiro-2013-a-solar-storm-paper 7/8
No. ] Obscuration by an Eruptive Prominence 7
2002/05/22 03:29:05
(a)
2002/05/22 03:35:05
(c)
0.0 0.2 0.4 0.6 0.8 1.0Relative Position (South - North)
0
5.0•103
1.0•104
1.5•104
B r i g h t n e s s T e m p e r a t u r e [ K ]
(b)
0.0 0.2 0.4 0.6 0.8 1.0Relative Position (South - North)
0
5.0•103
1.0•104
1.5•104
B r i g h t n e s s T e m
p e r a t u r e [ K ]
(d)
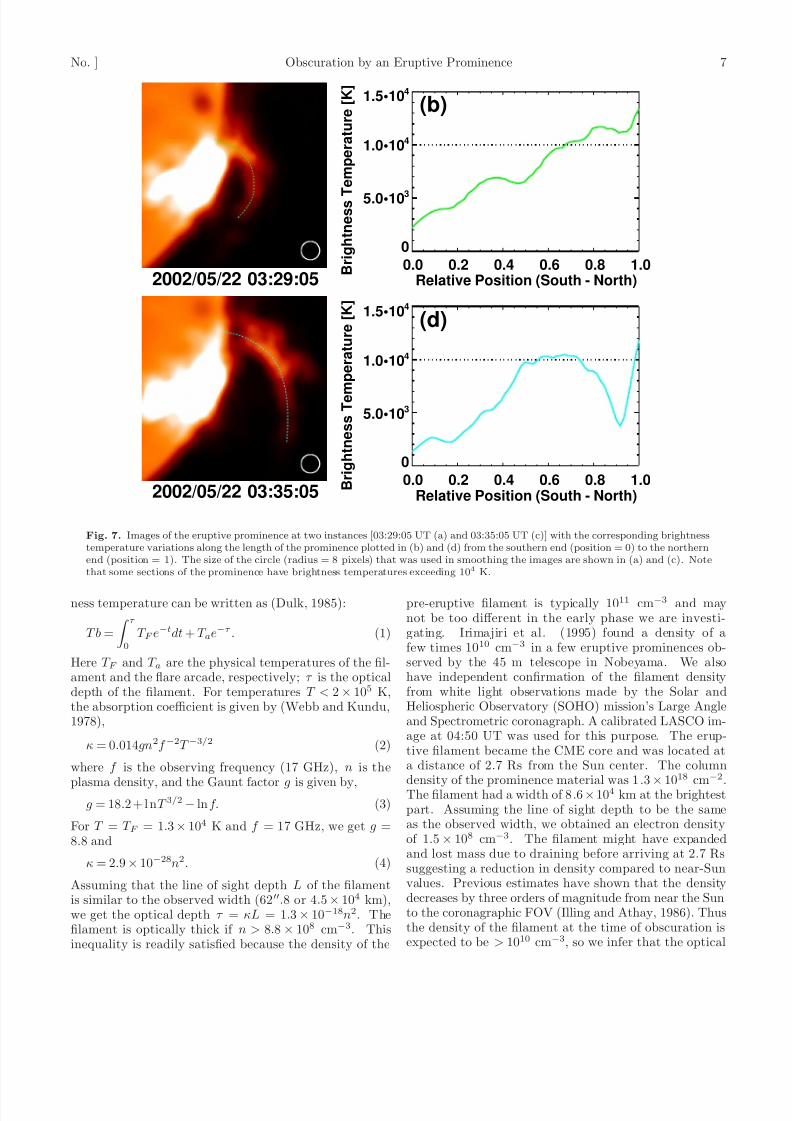
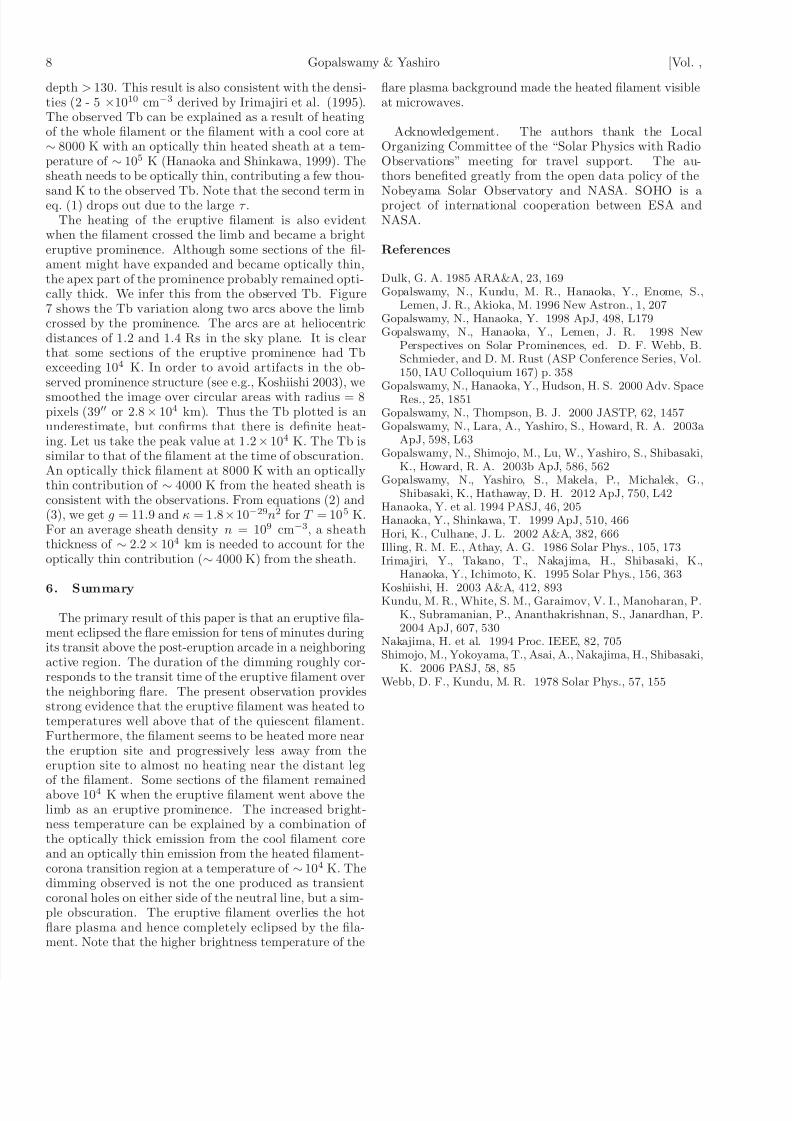
Fig. 7. Images of the eruptive prominence at two instances [03:29:05 UT (a) and 03:35:05 UT (c)] with the corresponding brightnesstemperature variations along the length of the prominence plotted in (b) and (d) from the southern end (position = 0) to the northernend (position = 1). The size of the circle (radius = 8 pixels) that was used in smoothing the images are shown in (a) and (c). Notethat some sections of the prominence have brightness temperatures exceeding 104 K.
ness temperature can be written as (Dulk, 1985):
T b =
τ 0
T F e−tdt + T ae−τ . (1)
Here T F and T a are the physical temperatures of the fil-ament and the flare arcade, respectively; τ is the opticaldepth of the filament. For temperatures T < 2× 10⁵ K,the absorption coefficient is given by (Webb and Kundu,1978),
κ = 0.014gn2f −2T −3/2 (2)
where f is the observing frequency (17 GHz), n is the
plasma density, and the Gaunt factor g is given by,g = 18.2 + l nT 3/2
− ln f. (3)
For T = T F = 1.3× 10⁴ K and f = 17 GHz, we get g =8.8 and
κ = 2.9× 10⁻²⁸n2. (4)
Assuming that the line of sight depth L of the filamentis similar to the observed width (62′′.8 or 4.5× 10⁴ km),we get the optical depth τ = κL = 1.3× 10⁻¹⁸n2. Thefilament is optically thick if n > 8.8× 108 cm−3. Thisinequality is readily satisfied because the density of the
pre-eruptive filament is typically 1011 cm−3 and maynot be too different in the early phase we are investi-gating. Irimajiri et al. (1995) found a density of afew times 1010 cm−3 in a few eruptive prominences ob-served by the 45 m telescope in Nobeyama. We alsohave independent confirmation of the filament densityfrom white light observations made by the Solar andHeliospheric Observatory (SOHO) mission’s Large Angleand Spectrometric coronagraph. A calibrated LASCO im-age at 04:50 UT was used for this purpose. The erup-tive filament became the CME core and was located ata distance of 2.7 Rs from the Sun center. The column
density of the prominence material was 1.3×
10
18
cm
−2
.The filament had a width of 8.6×10⁴ km at the brightestpart. Assuming the line of sight depth to be the sameas the observed width, we obtained an electron densityof 1.5× 108 cm−3. The filament might have expandedand lost mass due to draining before arriving at 2.7 Rssuggesting a reduction in density compared to near-Sunvalues. Previous estimates have shown that the densitydecreases by three orders of magnitude from near the Sunto the coronagraphic FOV (Illing and Athay, 1986). Thusthe density of the filament at the time of obscuration isexpected to be > 1010 cm−3, so we infer that the optical
7/29/2019 Gopalswamy and Yashiro 2013 a solar storm paper
http://slidepdf.com/reader/full/gopalswamy-and-yashiro-2013-a-solar-storm-paper 8/8
8 Gopalswamy & Yashiro [Vol. ,
depth > 130. This result is also consistent with the densi-ties (2 - 5 ×1010 cm−3 derived by Irimajiri et al. (1995).The observed Tb can be explained as a result of heatingof the whole filament or the filament with a cool core at∼ 8000 K with an optically thin heated sheath at a tem-perature of ∼ 105 K (Hanaoka and Shinkawa, 1999). Thesheath needs to be optically thin, contributing a few thou-
sand K to the observed Tb. Note that the second term ineq. (1) drops out due to the large τ .The heating of the eruptive filament is also evident
when the filament crossed the limb and became a brighteruptive prominence. Although some sections of the fil-ament might have expanded and became optically thin,the apex part of the prominence probably remained opti-cally thick. We infer this from the observed Tb. Figure7 shows the Tb variation along two arcs above the limbcrossed by the prominence. The arcs are at heliocentricdistances of 1.2 and 1.4 Rs in the sky plane. It is clearthat some sections of the eruptive prominence had Tbexceeding 104 K. In order to avoid artifacts in the ob-served prominence structure (see e.g., Koshiishi 2003), we
smoothed the image over circular areas with radius = 8pixels (39′′ or 2.8× 10⁴ km). Thus the Tb plotted is anunderestimate, but confirms that there is definite heat-ing. Let us take the peak value at 1.2× 10⁴ K. The Tb issimilar to that of the filament at the time of obscuration.An optically thick filament at 8000 K with an opticallythin contribution of ∼ 4000 K from the heated sheath isconsistent with the observations. From equations (2) and(3), we get g = 11.9 and κ = 1.8×10⁻²⁹n2 for T = 105 K.For an average sheath density n = 109 cm−3, a sheaththickness of ∼ 2.2× 10⁴ km is needed to account for theoptically thin contribution (∼ 4000 K) from the sheath.
6. Summary
The primary result of this paper is that an eruptive fila-ment eclipsed the flare emission for tens of minutes duringits transit above the post-eruption arcade in a neighboringactive region. The duration of the dimming roughly cor-responds to the transit time of the eruptive filament overthe neighboring flare. The present observation providesstrong evidence that the eruptive filament was heated totemperatures well above that of the quiescent filament.Furthermore, the filament seems to be heated more nearthe eruption site and progressively less away from theeruption site to almost no heating near the distant leg
of the filament. Some sections of the filament remainedabove 104 K when the eruptive filament went above thelimb as an eruptive prominence. The increased bright-ness temperature can be explained by a combination of the optically thick emission from the cool filament coreand an optically thin emission from the heated filament-corona transition region at a temperature of ∼ 104 K. Thedimming observed is not the one produced as transientcoronal holes on either side of the neutral line, but a sim-ple obscuration. The eruptive filament overlies the hotflare plasma and hence completely eclipsed by the fila-ment. Note that the higher brightness temperature of the
flare plasma background made the heated filament visibleat microwaves.
Acknowledgement. The authors thank the LocalOrganizing Committee of the “Solar Physics with RadioObservations” meeting for travel support. The au-thors benefited greatly from the open data policy of the
Nobeyama Solar Observatory and NASA. SOHO is aproject of international cooperation between ESA andNASA.
References
Dulk, G. A. 1985 ARA&A, 23, 169Gopalswamy, N., Kundu, M. R., Hanaoka, Y., Enome, S.,
Lemen, J. R., Akioka, M. 1996 New Astron., 1, 207Gopalswamy, N., Hanaoka, Y. 1998 ApJ, 498, L179Gopalswamy, N., Hanaoka, Y., Lemen, J. R. 1998 New
Perspectives on Solar Prominences, ed. D. F. Webb, B.Schmieder, and D. M. Rust (ASP Conference Series, Vol.150, IAU Colloquium 167) p. 358
Gopalswamy, N., Hanaoka, Y., Hudson, H. S. 2000 Adv. SpaceRes., 25, 1851
Gopalswamy, N., Thompson, B. J. 2000 JASTP, 62, 1457Gopalswamy, N., Lara, A., Yashiro, S., Howard, R. A. 2003a
ApJ, 598, L63Gopalswamy, N., Shimojo, M., Lu, W., Yashiro, S., Shibasaki,
K., Howard, R. A. 2003b ApJ, 586, 562Gopalswamy, N., Yashiro, S., Makela, P., Michalek, G.,
Shibasaki, K., Hathaway, D. H. 2012 ApJ, 750, L42Hanaoka, Y. et al. 1994 PASJ, 46, 205Hanaoka, Y., Shinkawa, T. 1999 ApJ, 510, 466Hori, K., Culhane, J. L. 2002 A&A, 382, 666Illing, R. M. E., Athay, A. G. 1986 Solar Phys., 105, 173Irimajiri, Y., Takano, T., Nakajima, H., Shibasaki, K.,
Hanaoka, Y., Ichimoto, K. 1995 Solar Phys., 156, 363
Koshiishi, H. 2003 A&A, 412, 893Kundu, M. R., White, S. M., Garaimov, V. I., Manoharan, P.
K., Subramanian, P., Ananthakrishnan, S., Janardhan, P.2004 ApJ, 607, 530
Nakajima, H. et al. 1994 Proc. IEEE, 82, 705Shimojo, M., Yokoyama, T., Asai, A., Nakajima, H., Shibasaki,
K. 2006 PASJ, 58, 85Webb, D. F., Kundu, M. R. 1978 Solar Phys., 57, 155