Embed Size (px)
Citation preview
Got Fitness? or Does SIZE matter?
Group 4- Evolution
Teachable unit-Fitness
Facilitator- Lianna Etchberger
Brian, Miles, Devon, Ralph, Jane, Cheryl, Nish
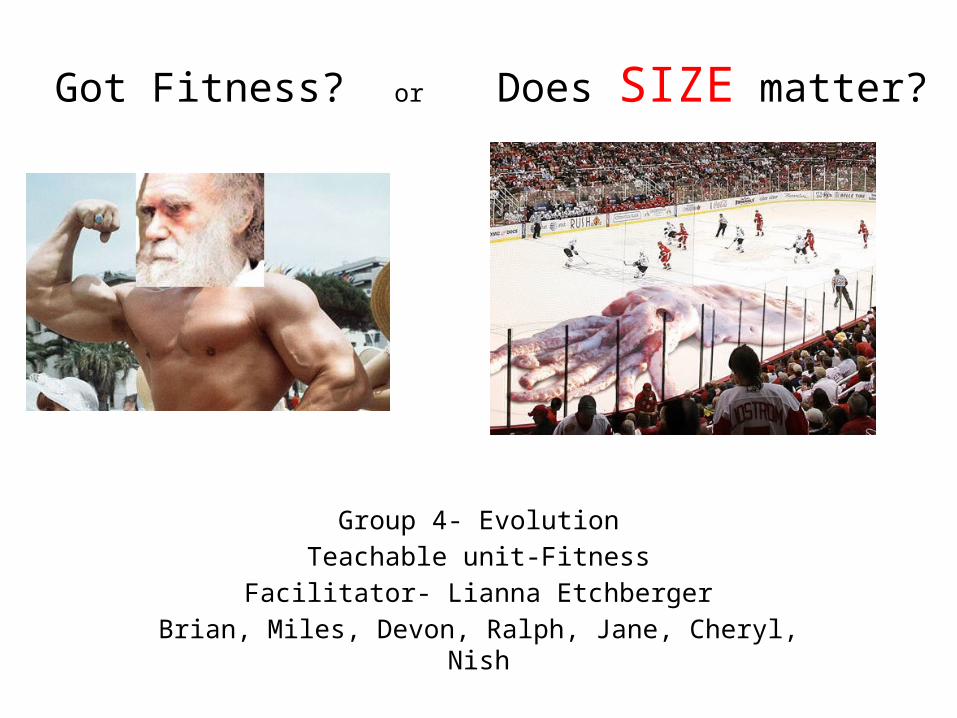
Context• Introductory Biology course (freshman)• In this same course, students will have
already been exposed to:– Inheritance– Genetics– Evolution and Religion (not mutually
exclusive)– Scientific processing skills (graphing)
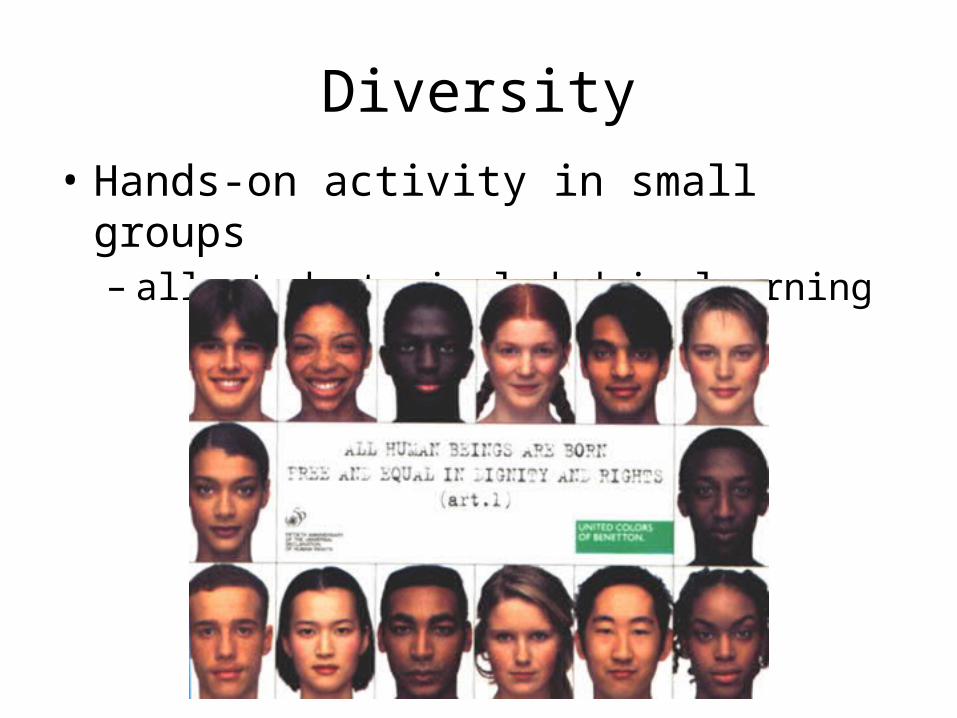
Diversity• Hands-on activity in small groups
– all students included in learning

Misconceptions
• There are “good” traits and “bad” traits.
• Bigger/more/stronger/faster is better.
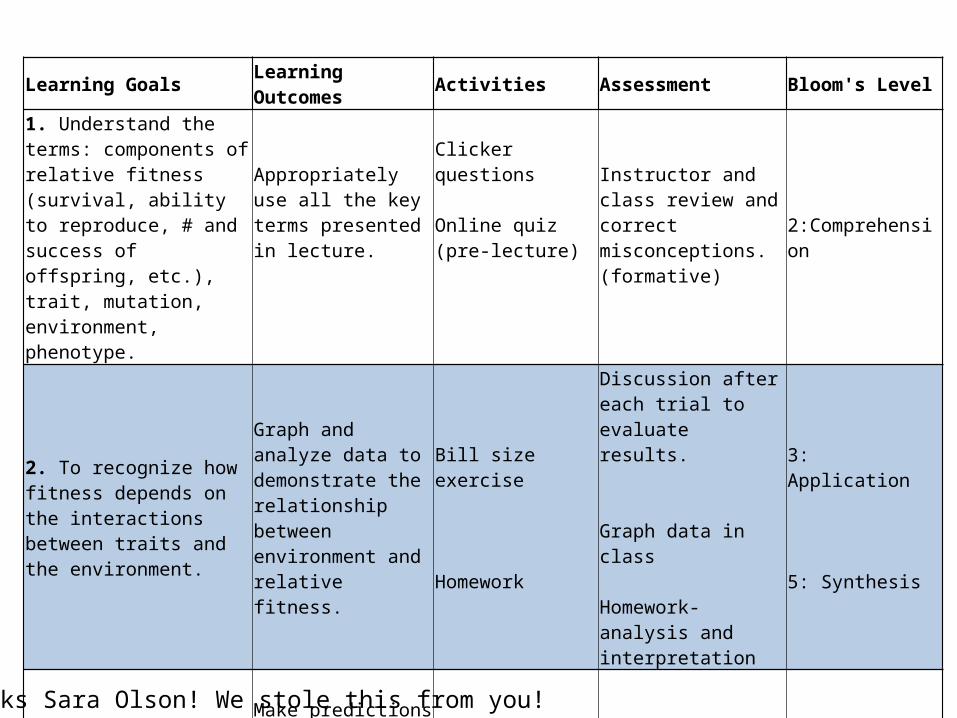
Learning Goals Learning Outcomes Activities Assessment Bloom's Level
1. Understand the terms: components of relative fitness (survival, ability to reproduce, # and success of offspring, etc.), trait, mutation, environment, phenotype.
Appropriately use all the key terms presented in lecture.
Clicker questions
Online quiz (pre-lecture)
Instructor and class review and correct misconceptions. (formative)
2:Comprehension
2. To recognize how fitness depends on the interactions between traits and the environment.
Graph and analyze data to demonstrate the relationship between environment and relative fitness.
Bill size exercise
Homework
Discussion after each trial to evaluate results.
Graph data in class
Homework-analysis and interpretation
3: Application
5: Synthesis
3. Apply recently learned knowledge to real world examples.
Make predictions of fitness based on description of trait and environment with new examples (application of concept).
Second lecture w/ clicker cases:Darwin’s finchesHuman Skin Color
In class clickers and group discussion
Novel example on final exam
4. Analysis
6. Evaluation
Thanks Sara Olson! We stole this from you!
Summative Assessment• Final exam question:
Apply concepts to a new/different example of natural selection.
Interpret a brief data set through a set of multiple choice questions.
Learning Goal: To recognize how fitness depends on the interactions between traits and the environment
Relative fitness (Objective 1)
Objective 2
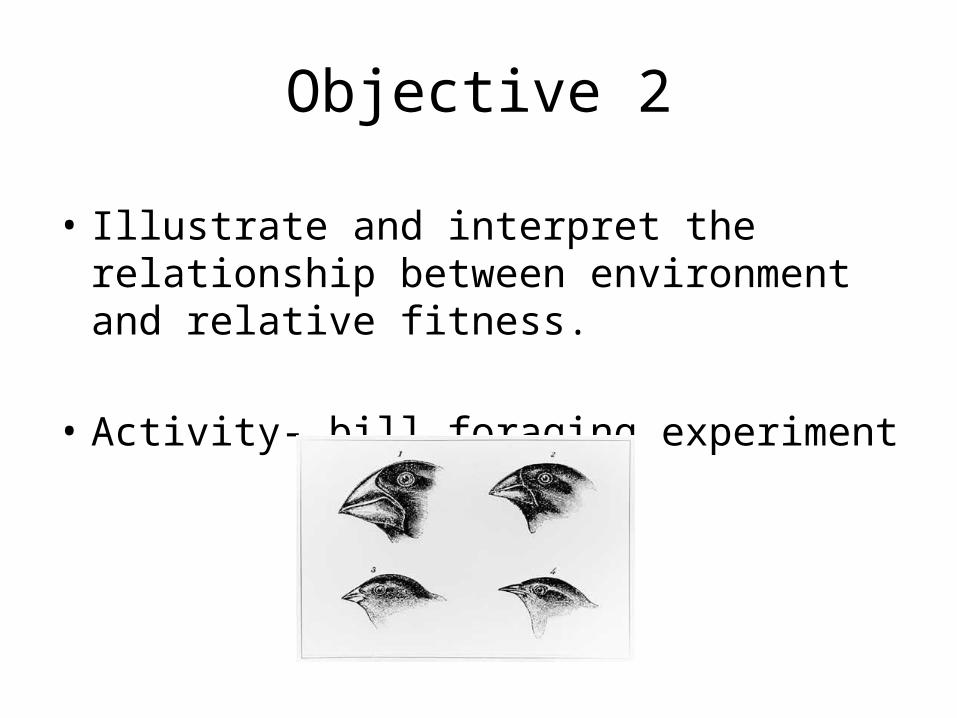
• Illustrate and interpret the relationship between environment and relative fitness.
• Activity- bill foraging experiment

Bill experiment
• Clips= Bill• Food source: nuts (3 size classes)• Time: 30 seconds/run• Groups=3 individuals with each beak size• 2 trials, 3 conditions- mixed nuts, all small, all large• Record data on each trial on handout• Calculate how well each individual did compared to
the most successful one in their trial• Graph/sketch their own data in class in small groups.
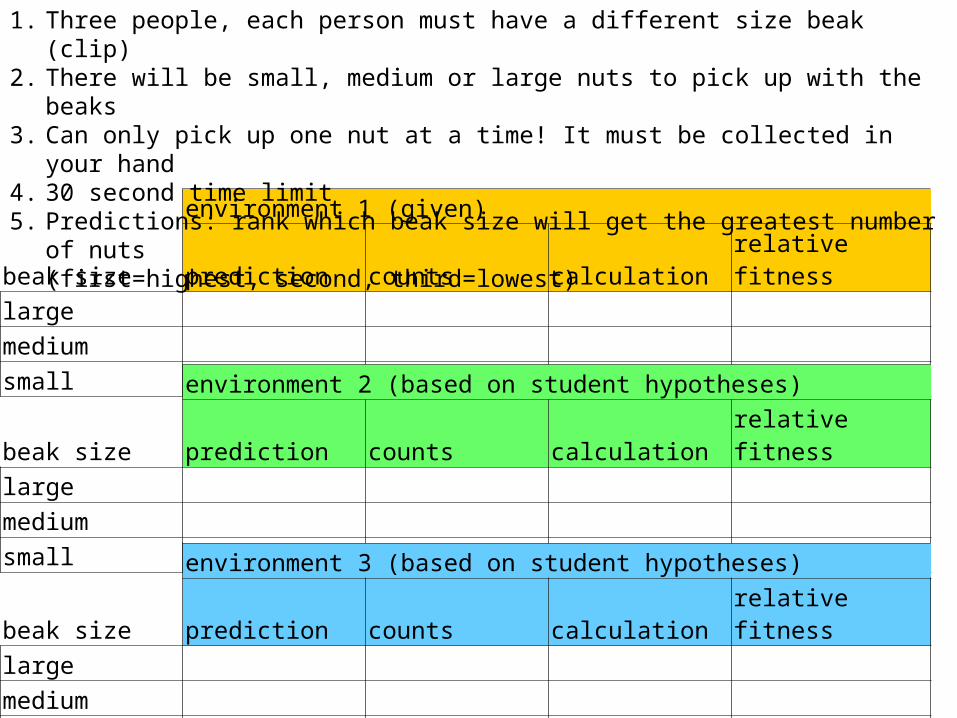
environment 1 (given)beak size prediction counts calculation relative fitnesslarge medium small
environment 2 (based on student hypotheses)beak size prediction counts calculation relative fitnesslarge medium small
environment 3 (based on student hypotheses)beak size prediction counts calculation relative fitnesslarge medium small
1. Three people, each person must have a different size beak (clip)2. There will be small, medium or large nuts to pick up with the beaks3. Can only pick up one nut at a time! It must be collected in your hand4. 30 second time limit5. Predictions: rank which beak size will get the greatest number of nuts
(first=highest, second, third=lowest)
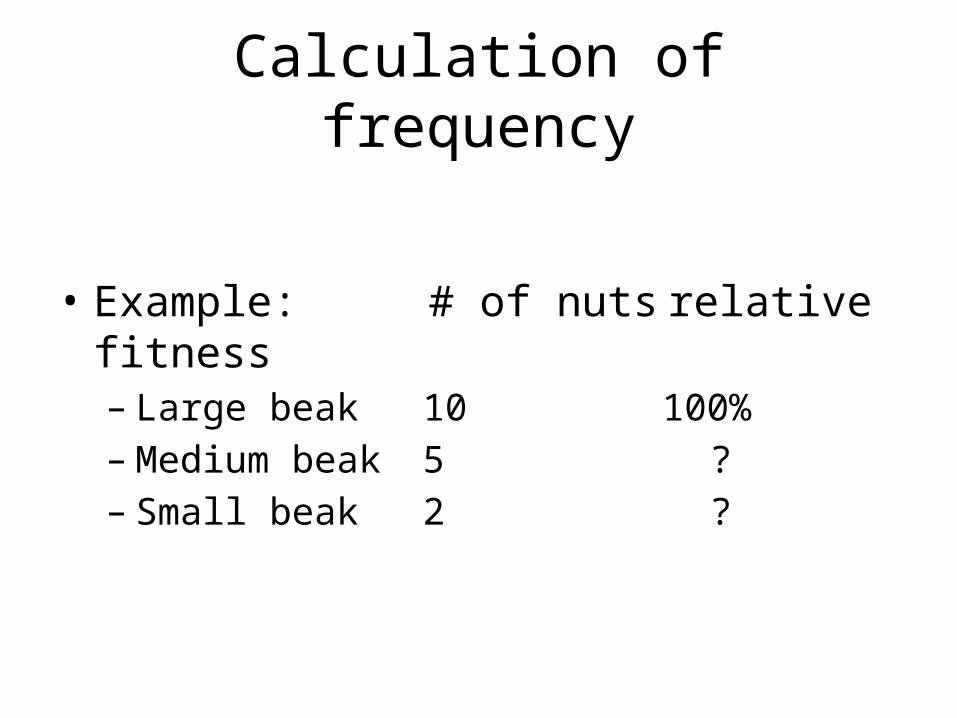
Calculation of frequency
• Example: # of nuts relative fitness– Large beak 10 100%– Medium beak 5 ?– Small beak 2 ?
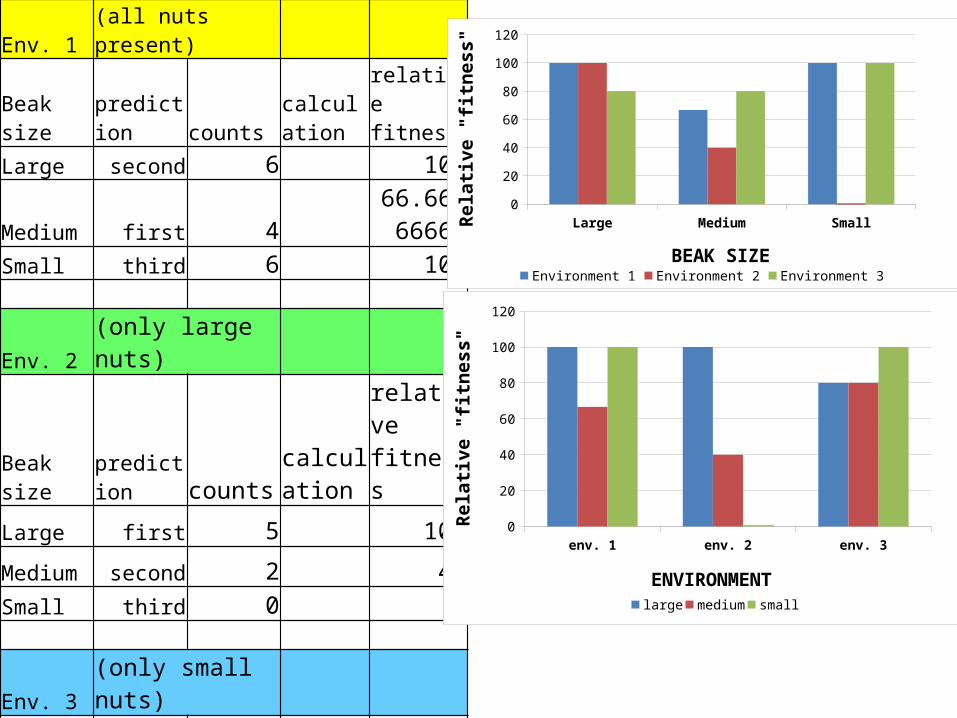
Env. 1 (all nuts present)
Beak size prediction countscalculation
relative fitness
Large second 6 100
Medium first 466.66666
667Small third 6 100
Env. 2 (only large nuts)
Beak size prediction countscalculation
relative fitness
Large first 5 100
Medium second 2 40Small third 0 0
Env. 3 (only small nuts)
Beak size prediction countscalculation
relative fitness
Large third 8 80
Medium second 8 80
Small first 10 100
Large Medium Small0
20
40
60
80
100
120
Environment 1 Environment 2 Environment 3
BEAK SIZE
Rela
tive
"fitn
ess"
env. 1 env. 2 env. 30
20
40
60
80
100
120
large medium small
ENVIRONMENT
Rela
tive
"fitn
ess"
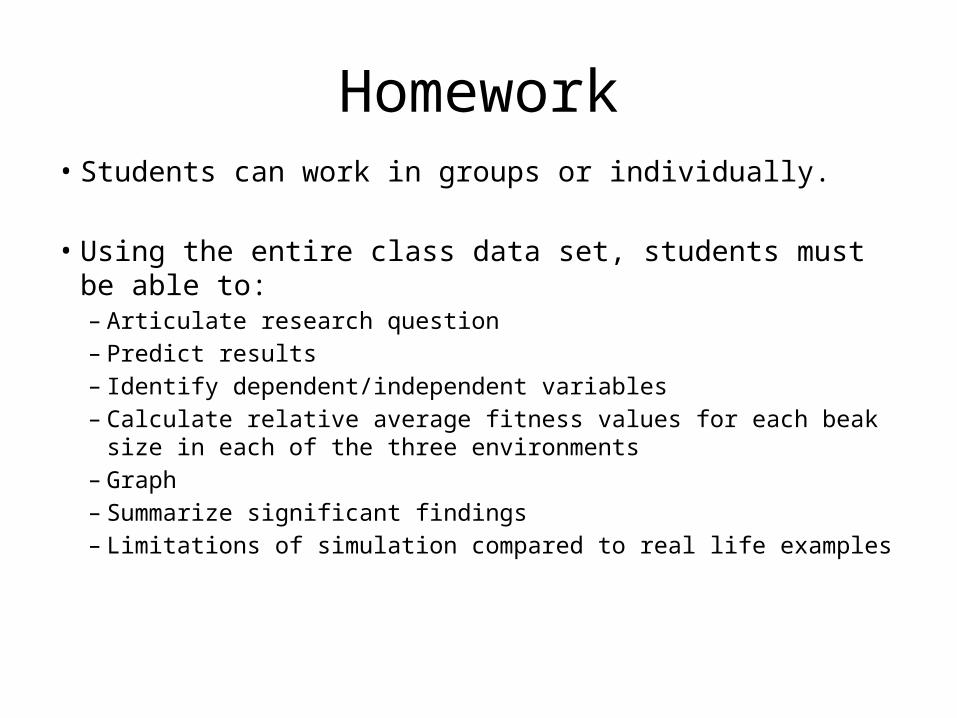
Homework• Students can work in groups or individually.
• Using the entire class data set, students must be able to:– Articulate research question– Predict results– Identify dependent/independent variables– Calculate relative average fitness values for each beak size in
each of the three environments– Graph– Summarize significant findings– Limitations of simulation compared to real life examples
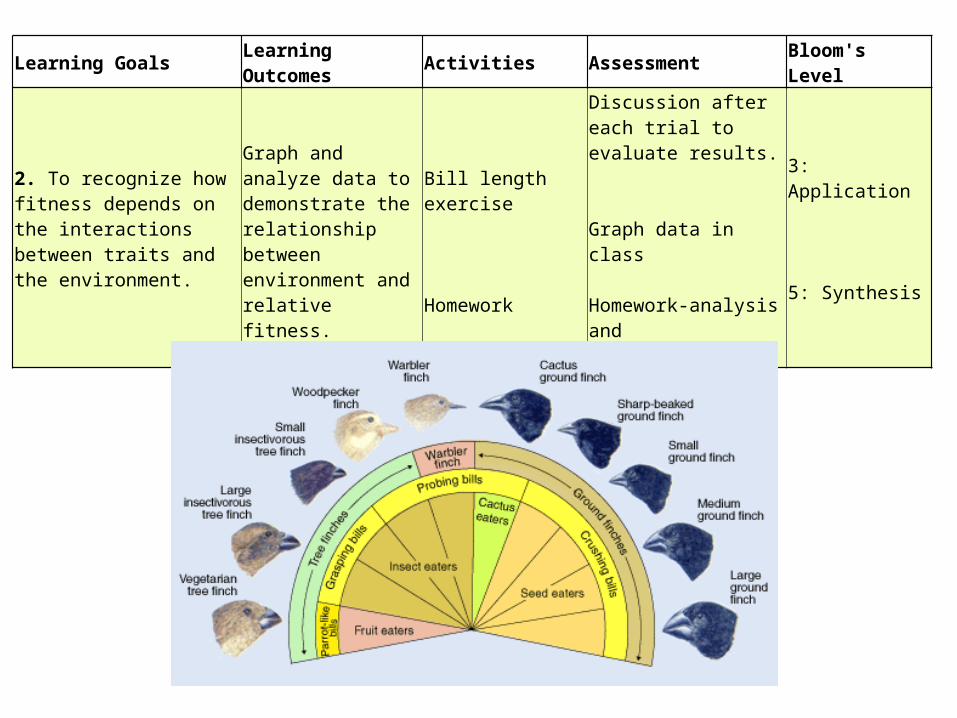
Learning Goals Learning Outcomes Activities Assessment Bloom's Level
2. To recognize how fitness depends on the interactions between traits and the environment.
Graph and analyze data to demonstrate the relationship between environment and relative fitness.
Bill length exercise
Homework
Discussion after each trial to evaluate results.
Graph data in class
Homework-analysis and interpretation
3: Application
5: Synthesis