Embed Size (px)
Citation preview

Munich Personal RePEc Archive
Governance and Foreign Direct
Investment : A comparative Analysis
between Low and Middle Income African
Countries
Bouchoucha, Najeh and Yahyaoui, Ismahen
8 September 2019
Online at https://mpra.ub.uni-muenchen.de/95944/
MPRA Paper No. 95944, posted 11 Sep 2019 05:44 UTC

1
Governance and Foreign Direct Investment : A comparative Analysis
between Low and Middle Income African Countries
Najeh Bouchoucha
University of Sousse
IsmaheneYahyaoui
University of Sousse
Abstract This paper investigates the effect of governance on FDI on a sample of 41 African countries:
20 low income countries and 21 middle income countries, over the period of 1996-2013.Our
study moves from an aggregated analysis to a disaggregated analysis by applying the system
generalized method of moments (System-GMM). The aggregated approach consists to use a
composite institutional quality index, which includes the six dimensions of governance to
identify the overall impact of governance on FDI inflows. While, the iterative approach
examines the effect of the six dimensions of governance on FDI. Our results indicate that
good governance is a deterministic condition in attractiveness of FDI in African economies.
1.Introduction
Foreign direct investment plays a crucial role in a country’s development and poverty
reduction. Indeed, it is considered as an engine of economic growth because it is a source of
capital and serves to create jobs. With the phenomenon of financial liberalization in the
1980s, FDI flows to the developing countries have considerably grown considerably.
However, competition for FDI is strong as both advanced and developing countries opted for
faster economic growth. In this context, Africa registered a remarkable increase in FDI
inflows in 2013, reaching $ 57 billion, an increase of 4% compared to 2012. This increase
was recorded in the main countries of Eastern and Southern Africa. Indeed, the inflow of FDI
doubled in Southern Africa to reach $ 13 billion, besides, the main countries that attracted
most FDI were South Africa and Mozambique.
2
Actually, these two countries attracted a significant share of FDI through the development of
infrastructure and gas sectors, while East Africa attracted only $ 6.2 billion, an increase by
15% during 2012. Most of the inward FDI in this sub-region was directed to Kenya and
Ethiopia. For instance, in Kenya, the investors were attracted mainly by the natural resources
of this country (gas and oil) as well as by the manufacturing and transport sectors which are
certainly important in this country. However, the inflow of FDI in North Africa declined by
7% to reach $ 15 billion. In addition, FDI inflows in Central and East Africa decreased by 8
and $ 14 billion, respectively. This decline is due to both political instability and the lack of
security. On the other hand, inequality, in terms of foreign direct investment, led researchers
to wonder about the main factors that explain the attractiveness of FDI.
Although the previous literature is abundant on the determinants that are likely to attract FDI,
the results are in most cases unconvincing and depend on the adopted methodology or the
used sample. Indeed, Ayachi and Berthomieu (2006) analyzed the determinants of FDI in the
MEDA region on a sample of 10 countries over the period from 1990 to 2002. They
concluded that the political infrastructure (governance), physical infrastructure, market size,
agglomeration between firms and distance are the main determinants of FDI in Europe. For
their part, Alaya et al. (2007) suggested that FDI depends on several factors, namely industrial
factors (transport, implementation, and production costs, as well as the technological
advantage and the agglomeration of activities), commercial factors (market size, proximity to
demand, barriers to trade) and institutional factors (tax or trade policy, country’s risk and
statutory provision for repatriation of capital). On the other hand, Mazbahul and Tanin (2010)
examined the main determinants of FDI location in Bangladesh over the period from 1975 to
2006.They found that the degree of openness, the exchange rate and the infrastructure
positively affected FDI in this country. As for Jadhav (2012), he studied the role of economic,
institutional, and political factors in attracting FDI into the BRICS countries using the panel
data approach over a period from 2000 to 2009. The results indicate that market size, trade
openness and the rule of law play an important role in attracting FDI to the BRICS countries,
while the availability of natural resources has a negative impact on FDI inflows, which
implies that FDI in the BRICS countries is largely market-oriented. Similarly, Jadhav and
Katti (2012) found that government efficiency and the quality of regulation have a positive
effect on FDI inflows while political instability, voice and accountability, and the control of
corruption have a negative effect on FDI inflows into the BRICS countries. Moreover, Sayed
Mohammed Alavisab (2013) analyzed the economic determinants of FDI in Iran over the
period from 1991 to 2009. The empirical results suggest that the economic factors that attract
3
FDI are: the real GDP growth, the share of imports into GDP and the return on investment
and infrastructure. This divergence of empirical results drives us to focus our attention on the
most relevant determinants of foreign direct investment, while emphasizing the role of the
institutional environment in attracting FDI in African countries and sub-regions( low-income
African countries and middle income Africa). For econometric analysis, the present study
employs system GMM (Arellano-Bover/Blundel-Bond) to deal with endogeneity problem,
omission of relevant variables , measurement error.
Our contribution consists firstly to construct a synthetic index that encompasses the various
of measures of governance indicators weighted by their contribution to explaining of total
inertia using a Principal Component Analysis (PCA). Due to the existence of hight correlation
between the overall dimensions of institutional quality( Globerman and Shapiro (2002) and
Buchanan et al(2012)), most of the papers in the literature use only one aspect or a set of
institutional quality. Secondly, our interest is to individualize the effect of governance,
measured using different dimensions developed by Kaufmann et al. (2010), on the
attractiveness of foreign direct investment that have not the subject of previous studies. In
other words, the iterative approach makes it possible to determine which dimension is the
origin of the attractiveness of FDI. Our study differs from previous work in the sense that we
conduct cross-sectional regressions for the cases of countries belonging to the same region,
unlike the majority of studies that take the form of time series or panel data, or cross section
(different regions). The implication of this study will not only provide the appropriate policy
mix that would aim to increase the attractiveness of Foreign Direct Investment in the African
region and these sub-regions, but also to identify which of governance indicators is
associated with attractiviness of FDI in the region.
The rest of the study is structured as follows: the second section presents the review of the
theoretical literature. The third section presents the econometric model and the main results.
Finally, we finish this work with a conclusion and some political implications.
2.Review of the theoretical literature
To be able to explain the differences in the levels of FDI flows between countries and why
investors choose to locate in such a country and not in another, it is obvious to examine the
main determinants of the FDI location. The economic literature in this theme cited two major
families of the determinants of FDI namely: traditional determinants that are related to the
characteristics of the economy in general and non-traditional determinants that are related to
institutions of the host countries. Regarding the traditional factors, several empirical studies
analyzed the effects of the various economic factors on the attractiveness of FDI (Root and

4
Ahmed 1979, Lee and Tan 2006, Wheeler and Mody 1992, Dunning and Narula 1996 and
UNCTAD 2006). Other studies that the market size, the key resource endowments and the
efficiency factor are the main determinants of FDI (Dunning 1998a, b, Stoian and Filippaios
2008).
Similarly, Stoian and Filippaios (2008) and Jensen (2006) found that the market potential
measured by GDP growth, infrastructure in the host country, trade openness and
macroeconomic stability and the quality of work are as determinants of FDI. In the same
direction of research, Dupasquier and Osakwe (2006) and Deichmann et al (2003) showed
that the existence of natural resources has a positive effect on the flow of FDI. In addition,
Mohamed and Sidiropoulos (2010) found that the main determinants of FDI flows into the
MENA region are the natural resources, the size of the host countries, the size of the
government, and the institutions. In addition, other studies linked the financial development
with FDI. They found that financial system development favors the attraction of FDI
(Deichmann et al., 2003, Jenkins and Thomas 2002 and Kinda 2009). Other recent studies
showed the need to improve and strengthen the benefits in the host countries through the
attractive role played by the governments of these countries. Thus, the debate on the location
choice shifted towards the government policies, that is, towards the role of the quality of
institutions other than the economic factors as an important determinant of FDI.
In this context, several empirical studies examined the role of institutions in the attractiveness
of FDI. The literature on this issue can be divided into three groups: The first group focuses
mainly on the effect of a specific institutional dimension, such as corruption and the political
regime on FDI. For example, Wei's (2000) study showed that corruption has a negative
impact on the location preferences of multinational firms. Indeed, corruption increases the
costs of doing business and also uncertainty. Similarly, the work of Habib and Zurawicki
(2002) and Voyer and Beamish (2004) lead to the same result as the one found by Wei
(2000).
In addition, the work of Jensen (2003) and Ahlquist (2006) showed that countries with a
democratic regime attract more foreign direct investment than the ones with an authoritarian
regime given that countries with a democratic regime tend to reduce political and
expropriation risks and increase the credibility of the host countries for foreign direct
investors. However, O'Neal (1994) found that authoritarian regimes offer investors in the
developing countries higher returns in terms of profit. On the other hand, Staats and Biglaiser
(2012) analyzed the determinants of FDI using a sample of 17 Latin American countries and

5
found that the rule of law and the judicial strength are important determinants of FDI inflows
into Latin America.
The second group of literature deals with the importance of different dimensions of
institutional quality in the attractiveness of FDI. For example, the study of Gastanaga et al
(1998) showed that low levels of corruption and better contract enforcement attract more FDI.
On the other hand, Asiedu (2006) showed that the poor quality of institutions measured by
corruption, the lack of the rule of law and political instability discourage FDI inflows. In the
same vein of research, Daude and Stein (2007) by examining the dimensions of the quality of
institutions that affect the foreign direct investment decision.Daude and Stein (2007) found
that an unpredictable policy and the lack of government commitment discourage the
attractiveness of FDI.
In addition, Gani (2007) investigated the relationship between governance indicators and
foreign direct investment on a sample of Asian and Latin American countries. He found that
the rule of law, corruption control, regulatory quality, government efficiency and political
stability are positively correlated with FDI. Recently, Gangi and Abdrazak (2012) have
studied the impact of governance on FDI flows in 50 African economies using World Bank
indicators. They found that three of six governance indicators, such as voice and
accountability, government effectiveness and the rule of law, are significant. In addition, Gani
and Al-Abri (2013) examine the effect of institutional quality on FDI inflows in GCC
countries. Their results show that political instability and the absence of democracy enhance
FDI inflows. In the same context, Helmy (2013) studies the determinants of FDI inflows to
MENA countries after changes following the Arab Spring in 2010. Their results revealed that
freedom and security of investments have a positive effect on FDI, while chances of
expropriation and corruption rates have a negative influence as they lead to an unsafe business
environment. In the same context, Bouchoucha et Benammou (2018) examined the link
between governance and FDI in 41 African economic using World Bank indicators.The
empirical results show that the attractiveness of FDI to African countries is positively
correlated with the control of corruption, the effectiveness of governments, the quality of
regulation and the voice and accountability.
A third group of researchers examined the effect of a composite indicator of governance
quality constructed from the different dimensions of institutional variables on the
attractiveness of FDI. For example, Wheeler and Mody (1992) studied the effect of the
composite index of governance calculated from the following variables: bureaucracy,
corruption, political instability and legal system efficiency on multinational firms US. They

6
found that the governance index does not affect the location decision of US multinationals.
On the other hand, Globerman and Shapiro (2002) and Buchanan et al (2012) constructed a
composite governance index based on the following variables: the control of corruption, the
rule of law, the regulatory environment and political stability. They found that the political
infrastructure (measured by governance) positively affects the attractiveness of FDI inflows.
More recently, Samimi and Ariani (2010) have studied the impact of good governance on
foreign direct investment. They used aggregated annual data for 16 countries in the Middle
East and North Africa (MENA) for the period 2002-2007. They used three governance
indicators, namely political stability, control of corruption and the rule of law. They
concluded that improving governance has a positive impact on FDI inflows in the MENA
countries. As a result, policies for the improvement of the governance indicators in the region
are recommended.
3. The econometric method and the data
3.1. Econometric modeling
The objective of the paper is to focuse on the attractiveness factors of Foreign Direct
Investment in low and middle income African countries over the period 1996-2013. However,
the empirical literature does not agree on the main attractiveness factors of FDI in the
developing countries. Some authors emphasized the role of the economic factors (such as the
market size, openness policy), while others emphasized the role of the political factors, and a
third group attached great importance to the institutional factors. In this empirical study, we
will take into account the economic, political and institutional determinants of the
attractiveness of foreign direct investment. Since the FDI levels of the current year influenced
by past investment decisions in the sense of Singh and Jun (1995), we will take into account
the lagged variable of a period as an explanatory variable in our model. Therefore, equation
(1) can be written in a dynamic form as follows:
0 1it it it itFDI FDI X −= + + +
Where is the net inflows of FDI as a percentage of GDP in country i at time t,
represents the lagged dependent variable of foreign direct investment in year t-1, ( is
the set of the explanatory variables ( Gov,inv, open rate, inf, infra, FD, GDP per cap,GExp,
HC, tax).In fact, Gov is the composite index of institutional governance calculated from the
following six indicators: political stability, the control of corruption, voice and accountability,
the rule of law, government effectiveness and regulatory quality; : are the individual effects,
(1)
7
the parameters to be estimated, Inv measures domestic investment, Open measures the
degree of trade openness, inf is the consumer price index, infra is a proxy for the
infrastructure, FD measures the level of financial system development, GDP per capita is a
proxy for market size, GExp measure the government expenditure ; HC is the human capital,
tax means taxation, Ɛit is the error of the model relating to individual i at date t. = + :
admits two components, is the specific unobservable fixed effect for each country and
finally is the temporal effect.
Arellano and Bond (1991) proposed the Generalized Moment Method which encompasses all
orthogonality conditions between the endogenous delayed variable and the error term.
Moreover, besides all endogenous variables delayed by more than two are validated
instruments for the equation of the first difference. They proposed to differentiate equation (2)
as follows
1 1 2 1 1( ) ( ) ( ) ( )it it it it it it it it
FDI FDI FDI FDI X X − − − − −− = − + − + −
Differentiation eliminates country specific effects, but it does not solve the problem of
correlation between the residual and the lagged dependent variable. They proposed the
following timing conditions:
, , , 1(FDI ( 0 2; 3,...i t s i t i t
E for s t T − − − = =
, , , 1( ( ) 0 2; 3,...i t s i t i t
E X for s t T − − − = =
Using these moment conditions, they proposed the estimation by the GMM method in two
stages: in the first, the error terms are homoscedastic and independent between individuals
and over time. The second is to use the resulting residuals to construct an appropriate estimate
of the variance-covariance matrix that ignores the previous assumptions. These two steps
make it possible to take into consideration the hypothesis of heteroscedasticity, the
autocorrelation of the error terms. Indeed, the GMM method of Arellano and Bond (1991) is
based on the hypotheses of the absence of second order autocorrelation in the errors of the
first difference equation and that all the instruments are validated.
Also, Monti Carlo's simulations have found that the weaknesses of the instruments in the case
of small samples, can induce biased coefficients. To overcome the shortcomings related to the
estimator of first differences. Arellano and Bover (1995) and Bondell and Bond (1998)
proposed a system GMM estimator. The latter combines both the regression in difference and
the regression in level. In addition, GMM can take account the possibility of endogeneity
(2)

8
between the explanatory factors. Thus, the system GMM estimator is more efficient and
superior to that of the first difference GMM estimator.
Delayed levels are used as difference regression instruments, while only the most recent
regression of the difference is used as the instrument of the level regression.
, , 1) , ,( )( ) 0 1i t s i t s i t i t
E X X for s − − − − + = =
The efficiency of the Generalized Moments Method (GMM) System estimator is based on the
validation of two hypotheses: the validity of the instruments and the absence of
autocorrelation of the errors. To test the validity of the instruments, we will use the following
two tests: the first is Hansen's test of overidentification restrictions, which tests the overall
validity of the instruments (the null hypothesis is that the instruments are valid) (Leitão 2015)
; the second is the second-order autocorrelation test for the error term, which tests the null
hypothesis of no autocorrelation (Abdouli and Hammami, 2015).
3.2.Data
The data cover 41 African countries, 20 of which are considered low-income countries and 21
middle-income countries. On the other hand, the period of our study runs from 1996 to 2013.
The data of the governance indicators are available from the year 1996, however, it should be
noted that the data about the different dimensions of governance for the years 1997, 1999 and
2001 are missing. In fact, all the variables in our series are collected from the World Bank
database, excepting the governance indicators and tax which are extracted from the World
Governance Indicators and Freedom House. The different sources of our data are summarized
in table A.1.2 in the appendix.
3.4.Main results and discussions
3.4.1.Descriptive statistics
Tables 1, 2, 3 contains the descriptive statistics of all the variables of interest used in our
study. The level of governance is low in African countries, on average the index of
governance achieved (-0,557). Indeed, the highest value is recorded in Morocco (1,838) in
2000, but, the minimum value of governance index is reached in Central African Republic (-
1.994) in 2011. Indeed, the highest value (1.838) is recorded in middle-income economies in
Morocco in 2000, while the highest value (-0.122) of governance in low-income economies
was marked in Benin in 1996. On the other hand, the minimum value of the governance index
in Middle-income Africa is reached in Congo Republic (-1.978) in 1996.While, the minimum
value of the governance index in low-income Africa is reached in Congo Democratic
Republic (-1.994) in 2011.
9
Regarding the variable FDI inflows, Africa received an average of 4.300, where middle-
income and low-income countries received, on average respectively 3.866 and 4.7641million
dollars. We find that low-income economies attract more FDI inflows than middle-income
economies. Indeed, middle-income countries reaches a maximum value of FDI inflows of
37.27million dollars in Mauritania in 2005, while the minimum value of FDI inflows is -3.28
in sawzialand in 2003. While the highest value of FDI inflows in low-income economies in
Liberia (91.1) in 2003. But, the minimum value of the FDI inflows is in Liberia (-82.89) in
1996.
3.4.2.Results of the principal components analysis
We have created a composite index contrary to Barro (1991) and Barro and Lee (1994),
among others, who used political rights and civil liberties as proxy for indicators of the
quality of institutions and governance. The advantage of this measure is that it allows us to
summarize multidimensional and complex questions in order to help decision-making. Also,
it helps to rank countries and evaluate progress over time.
In this context, many weighting techniques have been developed, some of which are derived
from statistical methods such as factor analysis and others have been based on participatory
approaches such as the analytic hierarchy process. But whatever the method, weights
represent value judgments. While some analysts may choose weightings based solely on
statistical methods, others may choose elements that are more influential, based on expert
opinion, to better reflect political priorities or theoretical factors.
The construction of our governance index is based on the statistical method called Principal
Component Analysis (PCA) in order not to prejudge the importance of a particular indicator
in the measurement of the quality of governance (Appendix 2 , 3 and 4). Principal component
analysis groups together individual indicators that are collinear to form a composite indicator
that captures as much as possible common information about individual indicators. It makes it
possible to reduce the dimensions of the initial data by replacing it with the initial variables by
appropriate factors.
As a result, the composite index no longer depends on the dimensionality of the dataset, but is
based on the statistical dimensions of the data. Composite indices are the weighted average of
the principal components of each governance variable, which will be calculated by the share
of the variance.
The Principal Component Analysis (PCA) allows us to extract two main components in the
case of global Africa and their sub-region (formed by middlle- and low-income Africa) from

10
our study. The first factor was chosen as a composite index in our analysis since it accounts
for more than half of the total inertia in the entire study sample. Thus, our composite indices
will be calculated as the linear combination of weighted governance indicators by the share of
the variance of the variables explained for each principal component.
According to the result of the tables of the eigenvalues reported in the appendix see (Tables
(A.2.4), (A.3.3) and(A.4.3)), the first factorial axes account for 87.35%, 90.16% and 81.84%
respectively in global Africa, Africa with middle income and low income total information
contained in the six initial active variables in the case of the regions studied, therefore, the six
governance indicators can be reduced to only two components to apprehend governance
3.4.3. Dynamic model results
Our econometric study was started by estimating eq (1) by applying the GMM system in
African countries and these two sub-regions (low-income countries and middle-income
countries). In this framework, we will introduce the governance variable measured, initially,
by the composite index of the six dimensions of governance of the World Bank. Our results
are recapitalized in the specifications M1, M8 and M15 for the African countries, the low-
income African countries and the middle-income African countries, respectively. In a second
place, we will again estimate the eq (1) by integrating separately the indicators of the good
governance developed by Kaufman Kraay and Mastruzy (2010) (government
effectiviness(GE), control of corruption(CC), rule of law(RL), political stability(PS), voice
and accountability(VA), regulatory quality(RQ)). Their results will be reported in the
following specifications: M2, M3, M4, M5, M6 and M7, in the case of African countries, M9,
M10, M11, M12, M13, and M14 for low-income countries, and M16, M17, M18, M19, M20
and M21 for the case of middle-income countries. The purpose of this disaggregation will be
to determine the dimension that may be behind the attraction of Foreign Direct Investment. In
addition, when we introduce all governance indicators simultaneously, we can achieve
fallacious results because there is a strong correlation between these governance indicators
developed by the World Bank (see the appendix(tables (A.2.1),(A.3.1) and (A.4.1)).
Table 4. Results for whole sample
Table 5. Results for the middle income African countries
Table 6. Results for the low income African countries
We start our dynamic analysis with the instrument validity test. Tables (4),(5) and (6) show
that the two specifications tested in the case of African countries and the low-income and the
middle-income African countries do not reject the sur- identification of Hansen and accept the
null hypothesis of no second-order autocorrelation as well as the validity of the instruments.

11
Our results test the validity of the instruments used according to Hansen and the AR-
autocorrelation test(2).
The results reported in Tables (4),(5) and (6) show that the different determinants of foreign
direct investment in Africa varies with the income level by re-estimating the models for the
sub-samples: lower and middle-income countries. Indeed, the results of system -GMM
estimator showed that the lagged FDI inflows variable is positive and statistically significant
in all models, whether in the global African countries, in the middle-income or in the low-
income countries. This shows the important role of the training effect of last year's FDI. These
results are consistent with the studies of Diaw and Camille Guidime (2013) and Bouchoucha
and Benammou (2018).
According to Tables (4),(5) and (6) and specifically in the specifications (M1, M8 and M15),
the governance coefficients have a positive and statistically significant, respectively, at 5%,
10% and 10% thresholds. In the case of the Global African countries (M1), governance
(measured by the composite index) improves the attractiveness of Foreign Direct Investment.
This improvement in FDI in African economies can be explained in large part by the
improvement of the following indicators: government effectiveness (5,771), control of
corruption (5,025), voice and accountability (5,948), and quality of regulation (5.177).
Nevertheless, governance (measured by the composite index) in African middle-income
economies (M8) has attracted foreign direct investment through the improvement of the
following dimensions: Government efficiency (5,696), corruption control (8,052), the rule of
law (2,968) and political stability (2,886). As for low-income African countries (M15),
governance (measured by the composite index) can attract FDI notably through the
development of the following institutional indicators: government efficiency (11,539), rule of
law (6.106), political stability (3.641), voice and accountability (7.808) and regulatory quality
(12.79). It is interesting to infer that governance (a composite measure) as well as its six
disaggregated components ( efficiency of government, control of corruption, rule of law,
political stability, voice and accountability and regulatory quality) are good drivers of FDI
inflows into the African countries and there sub-regions.
Regarding the control variables, the infrastructure has a negative and statistically significant
effect on FDI in Africa in all models (M2, M3, M4, M5, M6, M7). On the other hand, the
infrastructure coefficients are negative and statistically significant only in middle-income
African economies in the models (M8, M11 and M13). This result implies that middle-income
African countries are characterized by poor infrastructure quality, which can be an inhibiting
factor for the attractiveness of foreign direct investment in the region.

12
Regarding the inflation coefficients, we found that inflation has a positive and statistically
significant on FDI only in middle-income African economies (M12 and M14). But, they are
not significant for the case of African and low income African countries. These results are in
contrast with most previous studies examining the FDI-inflation relationship. These findings
are in line with those of Kinoshita and Campos (2003).
The coefficients of trade openness are positive and statistically significant at the threshold of
only 10% in low-income Africa in the model (M15), but not significant for the case of Africa
and Middle-Income Africa. Foreign investors can be well informed about the local conditions
of their international trading partners when trade is released. As a result, foreign investors
prefer to invest in countries with large volumes of trade. This result is consistent with
Elfakhani and Matar (2007).
For the coefficients associated with the financial development, they are positive and
statistically significant in Africa in the models (M4 and M5) and significant in case of middle
income African countries(M13). This means that an enhancement of financial development
leads to generating positive influences on the attractiveness of Foreign Direct Investment. In
other hand, middle-income African economies need a highly developed financial system so
that they can finance investment projects.
Finally,the coefficients of tax are negatives and statistically significants for overall sample in
the models (M2, M4 and M7) . However, the variable’s cofficient is significant only in these
models (M8, M9 and M10) and (M15, M16, M17, M18, M19, M20 and M21) in middle and
low income African countries, respectively. This imply that a very high corporate tax rate will
discourage FDI inflows into Africa regardless of income level. Thus, tax relief is an attractive
factor for foreign direct investment in the African region.
4.Conclusion and policy implication
The purpose of this paper is to examine the role of governance on the attractiveness of FDI
into 41 African countries grouped into two subgroups of which 20 countries are considered to
have low incomes and 21countries realize intermediate income. Our econometric analysis was
based firstly on an aggregated approach to construct a synthetic index of governance using
principal component analysis (PCA).
The results indicate that global governance affects positively and significantly the
attractiveness of Foreign Direct Investments in the region of Africa and its sub-regions (low-
and middle-income African countries). In a second step, our objective is to individualize the
effect of governance, measured through the different dimensions developed by Kaufmann et
al. (2010), on the attractiveness of Foreign Direct Investment. In other words, we used six

13
indicators to measure the quality of institutions and tested their effects on the attractiveness of
FDI. Indeed, the iterative approach makes it possible to determine which dimension is at the
origin of the attractiveness of FDI.
The attractiveness of FDI in African economies (overall sample) can be explained mainly by
the improvement of the following indicators: government effectiveness(GE), corruption
control(CC), voice and accountability(VA) and regulatory quality(RQ). While the
attractiveness of FDI in African middle-income economies depends on improving of
government efficiency(GE), control of corruption(CC), rule of law(RL) and political
stability(PS). For low-income African economies, the most importants institutionals factors
that affect the attractiveness of FDI are government effectiveness(GE), rule of law(RL),
political stability(PS), voice and accountability(VA), and regulatory quality(RQ). We found
also that when we subdivise our sample size in two, countries with better institutions were
able to attract FDI more than countries with poorer institutional development. The study
revealed the importance of other determinants of FDI for global sample. These factors include
lagged FDI, trade openness, infrastructure, financial development, inflation and tax.
The main policy implications of our study can be presented as follows. Firstly, policymakers
need to formulate policies that attract more FDI inflows into the region by strengthening the
institutional framework. Secondly, the attractiveness of FDI depends on the financial system
development. This drives the African countries to improve the quality of their financial
systems in order to be integrated into international financial markets and therefore make their
economies more attractive in terms of investment. A stable macroeconomic environment can
be important for attracting FDI flows and it is important for growth. In addition, the region
needs to improve the degree of trade openness by eliminating the tariff and non-tariff barriers
and creating a climate conducive to investment. Finally, there is a need for a tax system for
Foreign Direct Investors.
References
Abdouli.M,Hammami S (2015). “the impact of FDI inflows and environmental quality on
economic growth :an empirical study for the MENA countries”, J. Knowl Econ 6 :1-25.
Ahlquist, John S. (2006). “ Economic policy, institutions, and capital flows: portfolio and
direct investment flows indeveloping countries”, International Studies Quarterly 50: 681–704.
Alaya , M. Nicet-Chenaf, D et E. Rougier.(2007) . “Politique d’attractivité des IDE et
dynamique de croissance et de convergence dans les pays de Sud Est de la Méditerranée”,
Groupe de recherche en Economie Théorique et appliquée, n° 2007-06 juin 2007.

14
Alsan, M., D. E. Bloom, et D. Canning , (2006) . “The Effect of Population HealthonForeign
Direct Investment Inflows to Low- and Middle-Income Countries”, World Development, Vol.
34, No. 4, 613–630.
Anderson,G.(1984). “characteristics of discrete housing market model equilibria”, Journal of
Urban Economics , Elsevier, 16 (2):125-148
Anyanwu, J. C. (2011). “Determinants of Foreign Direct Investment Inflows to Africa 1980
–2007”, Working Paper Series N°136, African Development Bank, Tunis, Tunisia.
Arellano, M. et Bond, S.R. (1991). “Some tests of specification for panel data: Monte Carlo
evidence and an application to employment equations”, Review of Economic Studies, Vol.58,
pp.277-297.
Arrellano, M. et O. Bover(1995). “Another look at the instrumental –Variable Estimation of
Error Components Models”, Journal of Econometrics, vol.68, n°1, p.29-52.
Artige, L., Nicolini, R. (2005). “Evidence on the Determinants of Foreign Direct Investment:
The Case of Three European Regions”, http://pareto.uab.es/wp/2005/65505.pdf.
Asiedu, E. and A. Villamil. (2000). “Discount Factors and Thresh-olds: Foreign Investment
when Enforcement is Imperfect,Macroeconomic Dynamics”, 4(1), 1-21.
Asiedu, Elizabeth. (2006). “Foreign direct investment in Africa: The role of natural
resources, market size,government policy, institutions and political instability”. The World
Economy 29: 63–77.
Ayachi, F. et C. Berthomieu.(2006). “Les déterminants des investissements directs
étrangers européens et la gouvernance dans la région MEDA : une estimation par la méthode
des moments généralisés, Colloque du GDR CNRS « EMMA », (Economie Méditerranée
Monde Arabe) sur le thème « le partenariat euro méditerranéen : construction régionale ou
dilution dans la mondialisation”, Université de Galatasaray Istanbul. Turquie, pp: 26-27.
Baltagi, B.(1995) . “Editor’s introduction Panel data”, Journal of Econometrics,
Elsevier,68(1) :14.
Blundell, R. et S. Bond(1998). “ Initial conditions and Moment Restrictions in Dynamic
Panel Data Models”, Journal of Econometrics, Vol.87, n°1, p.115-143.
Bouchoucha, N and Benammou, S (2018). “Does Institutional Quality Matter Foreign
Direct Investment ? Evidence from African Countries” , Journal of Knowledge Economy ,
pp1-15.
Buchanan, B. G., Quan V Le, and Rishi ,M. (2012). “Foreign direct investment and
institutional quality:Some empirical evidence”,International Review of Financial Analysis 21:
81–89.
15
Daude, Christian, and Ernesto Stein. (2007). “The quality of institutions and foreign direct
investment”,Economics and Politics 19: 317–44.
Deichmann, J. I., and Eshghi A., Haughton D. M., Sayek S., Teebagy N. C. (2003).
“Foreign Direct Investment in the Eurasian Transition States”, Eastern European Economics,
41(1), 5-34.
Diaw, A et D, Camille Guidime, (2013). “Une analyse dynamique des déterminants des
investissements directs étrangers dans les pays de la Communauté Economique des Etats de
l’Afrique de l’Ouest (CEDEAO), Canadian Journal of Development Studies”, Revue
Canadian d’études du développement, Vol. 34, No. 1, 37–53.
Dunning, J. (1998a). “Location and the multinational enterprise: A neglected factor? ” ,
Journal of International Business Studies, 29(1), 45–66.
Dunning, J., &Narula, R. (1996). “The investment development pathrevisited: Some
emerging issues. In J. Dunning& R. Narula (Eds.), Foreign direct investment and
governments:Catalysts for economic restructuring” pp. 1–41. London: Routledge.
Dupasquier, C. and Osakwe P. N. (2006). “Foreign direct investment in Africa:
Performance, challenges, and responsibilities”, Journal of Asian Economics, 17, 241–260.
Elfakhani, M. and Matar, M. (2007) . “Foreign direct investment in the Middle East and
North Africa region”, Journal of Global Business Advancement, 1: 49-70.
Fedderke J.W., et A.T.Romm(2006). “Growth impact and determinants of Foreign Direct
Investment into South Africa”, 1956–2003, Economic Modeling, 23, 738–760.
8, 162–9.
Gangi, Y.A.and Abdulrazak, R.S.(2012). “ the impact of governance on FDI flows to
African countries”, World Journal of Entrepreneurship, Management and Sustainable
Development,
Gani, A and Al Abri S.(2013) . “Indicators of Business environment institutional quality and
foreign direct investment in Gulf Cooperation Council(GCC) countries”, International Review
of Applied Economics, 27 :515-530.
Gani, A. (2007). “Governance and foreign direct investment links: evidence from panel data
estimations”, Applied Economics Letters 14: 753–56.
Gastanaga, Victor M., Jeffrey B. Nugent, and Bistra Pashamova. (1998). “Host country
reforms and FDI inflows:How much difference do they make? ”, World Development 26:
1299–314.
Globerman, Steven, and Daniel Shapiro. (2002). “Global foreign direct investment flows:
The role of governance infrastructure. ” World Development 30: 1899–919.
16
Habib, M., and Zurawicki, L. (2002). “Corruption and Foreign Direct Investment” , Journal
of International Business Studies 33 (2):291–307.
Helmi, H (2013). “The impact of corruption on FDI: Is MENA an exception? ”, Journal of
International Review of Applied Economics, 27: 491-514.
Im, K .S., Pesaran, M.H., et Shin , Y.(2003) . “testing for unit roots in heterogeneous
panels”, Journal of Econometrics, 115,536-74 .
Jadhav, P. (2012). “Determinants of foreign direct investment in BRICS economies:
Analysis of economic, institutional and political factor”, International Conference on
Emerging Economies-Prospects and Challenges (ICEE- 2012), Procedia-Social and
Behavioral Sciences, 37 (2012), p. 5- 14.
Jadhav, P.,and Katti, V.(2012) . “institutional and Political Determinants of Foreign Direct
Investment :Evidence from BRICS Economies”, Poverty and Public Policy,4(3), 49-57.
http://dx.doi.org/10.1002/pop4.5.
Jenkins, C. and Thomas, L. (2002). “Foreign Direct Investment in Southern Africa:
Determinants, Characteristics and Implications for Economic Growth and Poverty
Alleviation”. CREFSA, University of Oxford, CSAE and London School of Economics
Jensen, C. (2006). “Foreign direct investment and economic transition: Panacea or pain
killer? ”, Europe-Asia Studies, 58(6), 881–902.
Jensen, Nathan M. (2003). “Democratic governance and multinational corporations: Political
regimes and inflows of foreign direct investment”,International Organization 57: 587–616.
Kaufmann, D., Kraay, A., & Mastruzzi, M. (2010). “The Worldwide Governance
Indicators: Methodology and Analytical Issues”, (World Bank Policy Research Working
Paper No. 5430). Retrieved from https://ssrn.com/abstract=1682130.
Kinda, T. (2009). “Investment Climate and FDI in Developing Countries: Firm-Level
Evidence ”, World Development, Vol. 38, No.4. pp. 498-513.
Kinoshita, Y. and Campos, F. (2003) . “Why does FDI go where it goes? New evidence
from the transition economies”, William Davidson Institute Paper No. 573. Retrieved from:
http://www.cepr.org/pubs/dps/DP3984.asp.
Lautier.M. and F. Moreaub. (2012). “Domestic Investment and FDI in Developing
Countries: The Missing Link”, Journal of Economic Development, vol. 37.pp:1-23.
Lee, H. H., & Tan, H. B. (2006). “FDI, technologytransfer and economic growth in the
ASEAN region”,Journal of the Asia Pacific Economy, 11(4), 394–410.
Leitão. N.C(2015). “Energy consumption and foreign direct investment : a panel data
analysis for Portugal” . Int J Energy Econ Policy 5(1) :138-147.

17
Mazbahul .G .A etTanin (2010). “Determinants of the relationship between FDI and
Economic Growth in Bangladesh”, Journal of Munish Personal RePEC archive (MPRA),
Paper 20236,pp.1-32.
Oneal, John R. (1994). “The Affinity of Foreign Investors for Authoritarian Regimes”,
Political Research Quarterly 47 (3), pp. 565-588.
Root, F., & Ahmed, A. (1979). “Empirical determinants of manufacturing direct foreign
investment in developing countries”, Economic Development and Cultural Change, 27(4),
751–767.
Sayed Mohammed Alavisab(2013). “Determinants of foreign Direct investment in Iran” ,
International Journal of Academic Research in Business and social science, 3(2) pp.258-269.
Sevestre, P.(1985) . “ Exaogenous variables and asymptotic bias in dynamic models with
autocorrelated errors :A note”, Economic Letters , Elsvier, 18(4) :355-360.
Staats, J. L., & Biglaiser, G. (2012). “Foreign direct investment in Latin America: The
importance of judicial strength and rule of law ”,. International Studies Quarterly, 56(1), 193–
202. doi:10.1111/j.14682478.2011.00690.x
Stoian, C., and Filippaios, F. (2008). “Dunning’seclecticparadigm: A holistic, yet context
specificframework for analysing the determinants of outward FDI evidence from international
greek investments”,International Business Review, 17, 349–367.
Tarzi, S.(2005). “Foreign Direct Investment flows into Developing Countries: Impact
Location and Government Policy”, Journal of Social, Political and Economic Studies, 30(4),
497-515.
Topcu SCM(2013). “The nexus between financial development and energy consumption in
the EU: A dynamic panel data analysis”, Energy Economics 39, 81–88.
UNCTAD. (2006). “World investment report”, New York and Geneva: United Nations.
Voyer.P. and Beamish. P. (2004). “The effect of Corruption on Japanese Foreign Direct
Investment”, Journal of Business Ethics, vol.50, pp.211-24.
Wei, Shang Jin. (2000). “How taxing is corruption on international investors? ”, Review of
Economics and Statistics 82:1–11.
Wernick, D , Haar, J et Singh, S.(2009). “Do governing institutions affect foreign direct investment inflows? New evidence from emerging economies”, International Journal of Economics and Business Research, Vol. X, No.X, xxxx. Wheeler, D., & Mody, A. (1992). “International investment location decisions: The case of U.S.Firms”, Journal of International Economics, 33, 57–76.

18
Tables
Table 1.Descriptive statistics in African countries
variable obs Mean Std. Dev. Min Max
FDI 730 4.300 8.876 -82.89 91.1
Gov 615 -.557 .597 -1.994 1.838
Inv 695 1.301 .232 -.53 1.9
Open 711 .741 .361 .18 2.3
Inf 655 .788 .495 -1.39 2.82
HC 690 1.219 .254 .31 1.9
Infra 724 .078 .744 -2.21 1.9
DF 710 1.228 .430 -.7 2.7
GExp 690 1.219 .254 .31 1.9
GDP per cap 733 2.534 .833 .48 3.84
Fisc 418 7.700 9.430 .3 59.24
Table 2.Descriptive statistics of Middle-income African countries
Variable Obs Mean Std. Dev. Min Max
FDI 377 3.866 5.263 -3.28 37.27
Gov 315 -.332 .640 -1.994 1.838
Inv 343 1.348 .186 .67 1.9
Open 357 .868 .353 .31 2.1
Inf 355 .738 .440 -1.25 1.9
HC 211 12.115 11.363 1.19 59.24
Infra 377 .529 .639 -.9 1.9
DF 368 1.394 .393 .32 2.7
GDP per cap 375 2.545 1.153 .48 3.84
GExp 342 1.252 .211 .45 1.9
Fisc 369 1.745 .067 1.46 1.88
Table 3.Descriptive statistics Low-income African countries
Variable Obs Mean Std. Dev. Min Max
FDI 353 4.764 11.540 -82.89 91.1
Gov 300 -.794 .438 -1.978 -.122
Inv 352 1.255 .262 -.53 1.9
Open 354 .612 .321 .18 2.3
Inf 300 .847 .549 -1.39 2.82
HC 207 3.200 2.840 .3 19.4
Infra 347 -.410 .503 -2.21 .9
DF 342 1.048 .394 -.7 2.2
GExp 348 1.187 .287 .31 1.9
GDP per cap 358 2.522 .172 1.87 2.87

19
Fisc 295 1.716 .074 1.33 1.94
Table 4 .Results for whole sample FDI (M1) (M2) (M3) (M4) (M5) (M6) (M7)
FDI(-1) .424** .832** .955*** .911*** 1.012* .642*** .720***
(2.40) (0.016 ) (0.007) (0.003) (0.057) (0.008) (0.000)
Gov 10.102**
(1.95)
GE 5.771*
(0.061)
CC 5.025*
(0.099)
RL 2.820
(0.181)
PS .129
(0.947)
VA 5.948*
(0.057)
QR 5.177**
(0.025)
Infra -2.463 -2.426** -3.577** -2.906** -1.742* -3.490* ** -2.310*
(-1.36) (0.048) (0.040) (0.036) (0.072) (0.010) (0.067)
Inf 2.315 1.176 1.036 1.192 1.384 1.147 1.293
(2.77)*** (0.157) (0.207) (0.140) (0.187) (0.259) (0.160)
Open 1.303 -1.465 4.541 3.117 3.112 6.094 .902
(0.59) (0.629) (0.390) (0.430) (0.563) (0.212) (0.815)
FD 4.148* 1.577 1.356 2.050** 2.744*** 1.116 1.731
(1.83) (0.170) (0.162) (0.033) (0.002) (0.624) (0.162)
GExp -1.560 -2.419 -1.473 -1.646 -1.497 -2.444 -1.896
(-0.89) (0.131) (0.428) (0.310) (0.491) (0.170) (0.113)
GDP per cap 1.293 -.041 -1.113 -.458 -.258 . -2.442** -.434
(1.11) (0.959) (0.225) (0.410) (0.624) (0.037) (0.598)
HC .0329 -.025 -.0007 -.004 -.020 .035 -.004
(0.44) (0.598) (0.987) (0.902) (0.528) (0.663) (0.934)
Inv 5.437 4.685 1.899 3.711 3.946 2.138 4.819
(1.60) (0.228) (0.511) (0.242) (0.354) (0.676 ) (0.230)
Fisc -11.091 -34.778** -22.575 -18.752* -7.798 -26.976 -34.243**
(-0.74) (0.050) (0.169) (0.086) (0.464) (0.153) (0.041)
Cons 11.339 60.437* 39.249 27.891 5.042 51.265 57.167*
(0.42) (0.068) (0.265) (0.212) (0.816) (0.234) (0.098)
Hansen: p- 0.647 0.403 0.233 0.630 0.471 0.543 0.462
AR(2) : p- 0.722 0.950 0.764 0.998 0.959 0.820 0.948
Notes : the values in parenthesis are t- Student. ***significance at 1%. **significance at 5% and*significance at 10%. *** Significance at 1%, * Significance at 5% and * Significance at 10%. a: The values reported in the table are the p-values of the Hansen test. According to these values, we cannot reject the null hypothesis of the instrument validity at threshold of the annual risk

20
b: The values reported in the table are the p-values of the Arellano and Bond AR (2) test. According to these values, we cannot reject the null hypothesis of the absence of second-order autocorrelation.
Table 5. Results for the middle income African countries FDI (M8) (M9) (M10) (M11) (M12) (M13) (M14)
FDI(-1) .345*** 0.437*** 0.458*** 0.473*** 0.446*** .568*** 0.607**
(3.46) (0.000) (0.000) (0.000) (0.000) (3.92) (0.014)
Gov 8.525*
(2.05)
GE 5.696***
(0.009)
CC 8.052**
(0.043)
RL 2.968***
(0.091)
PS 2.886***
(0.068)
VA -4.287
(-1.34)
QR 2.181
(0.384)
Infra -5.873* -3.194 -4.666 -3.841*** -3.104 -2.585* -2.969
(-1.83) (0.180) (0.183) (0.069) (0.181) (-1.85) (0.139)
Inf 2.187 2.478 2.353 2.598 3.208*** 3.000 2.755*
(1.20) (0.130) (0.172) (0.146) (0.084) (1.55) (0.085)
Open 1.576 -1.694 -1.241 .431 -.968 5.147 3.779
(0.64) (0.625) (0.770) (0.885) (0.721) (1.15) (0.404)
FD -.339 -.282 .201 1.257 1.655 5.547** 1.874
(-0.09) (0.879) (0.939) (0.498) (0.222) (2.41) (0.418)
GExp -1.599 -.956 -2.827 -1.081 -1.139 .754 -1.945
(-0.41) (0.686) (0.394) (0.598) (0.645) (0.33) (0.366)
GDPper cap -1.342 -0.137 -1.036 -0.278 -0.670 1.112 -.488
(-0.91) (0.881) (0.443) (0.713) (0.459) (0.86) (0.387)
HC .077 0.012 0.056 0.032 0 .029 -.030 0.021
(1.03) (0.818) (0.403) (0.344) (0.465) (-0.94) (0.644)
Inv 10.484 13.096 7.539 11.854 11.829 11.703* 10.535
(1.22) (0.188) (0.383) (0.162) (0.187) (1.70) (0.142)
Fisc -37.109*** -24.946* -35.153* -13.651 -15.555 15.246 -15.829
(-3.30) (0.085) (0.069) (0.396) (0.155) (0.70) (0.194)
Cons 61.318*** 32.895 63.140 10.684 14.955 -58.677 12.941
(3.04) (0.235) (0.067) (0.784) (0.516) (-1.14) (0.651)
Hansen: p- 0.704 0.961 0.994 0.999 0.980 0.970 0.923
AR(2) : p- 0.941 0.986 0.533 0.994 0.976 0.030 0.945 Notes : the values in parenthesis are t- Student. ***significance at 1%. **significance at 5% and*significance at 10%. *** Significance at 1%, * Significance at 5% and * Significance at 10%. a: The values reported in the table are the p-values of the Hansen test. According to these values, we cannot reject the null hypothesis of the instrument validity at threshold of the annual risk

21
b: The values reported in the table are the p-values of the Arellano and Bond AR (2) test. According to these values, we cannot reject the null hypothesis of the absence of second-order autocorrelation
Table 6. Results for the low income African countries
FDI
(M15)
(M16)
(M17)
(M18)
(M19) (M20)
(M21)
FDI(-1) 1.209*** 1.151*** 1.166*** 1.157*** 1.149*** 1.197*** 1.126***
(6.39) (0.000) (0.000) (0.000) (0.000) (0.000) (0.000)
Gov 5.680*
(1.82)
GE 11.539*
(0.071)
CC 3.531
(0.338)
RL 6.106*
(0.077)
PS 3.641*
(0.003)
VA 7.808*
(0.089)
QR 12.790*
(0.055)
Infra -1.306 -.304 -.387 -2.991 -2.640 -1.695 .052
(-0.88) (0.914) (0.813) (0.096) (0.291) (0.479) (0.987)
Inf .481 .193 .473 .517 .591 .472 .484
(1.03) (0.688) (0.241) (0.410) (0.285) (0.318) (0.449)
Open
3.11* -.434 -.079 9.623 4.973 1.870 -8.224
(1.78) (0.971) (0.993) (0.302) (0.700) (0.825) (0.515)
FD .738 1.477 1.196 .121 -.012 -.005 1.705
(0.55) (0.453) (0.509) (0.939) (0.996) (0.999) (0.360)
GExp -3.103 -6.020** -2.569 -2.181 -2.849 -4.445 -6.262*
(-1.50) (0.044) (0.291) (0.477) (0.372) (0.133) (0.071)
GDPper cap 3.698 4.975 6.574** 4.560 .062 -2.130 2.775
(1.19) (0.295) (0.048) (0.291) (0.990) (0.782) (0.568)
HC -.130 .062 -.243 -.018 -.016 -.102 .028
(-0.59) (0.846) (0.245) (0.955) (0.945) (-.652) (0.942)
Inv .477 -.696 1.509 -.915 1.166 -.621 -1.138
(0.22) (0.849) (0.568) (0.724) (0.689) (0.824) (0.722)
Fisc -32.908** -64.972** -23.273* -29.170* -25.191* -45.226** -90.568**
(-2.29) (0.017) (0.059) (0.053) (0.054) (0.031) (0.016)
Cons 50.981* 116.056** 26.508 40.234 43.528 92.501* 170.118**
(1.83) (0.028) (0.204) (0.258) (0.151) (0.091) (0.024)
Hansen: p- 0.998 0.960 1.000 1.000 0.886 0.993 0.999
AR(2) : p- 0.859 0.358 0.893 0.454 0.986 0.845 0.924

22
Notes : the values in parenthesis are t- Student. ***significance at 1%. **significance at 5% and*significance at 10%. *** Significance at 1%, * Significance at 5% and * Significance at 10%. a: The values reported in the table are the p-values of the Hansen test. According to these values, we cannot reject the null hypothesis of the instrument validity at threshold of the annual risk b: The values reported in the table are the p-values of the Arellano and Bond AR (2) test. According to these values, we cannot reject the null hypothesis of the absence of second-order autocorrelation.
Appendix
Appendix 1 : list of countries and Data description and source
Table A.1. 1. Classification of African countries by income
Global African sample
Benin –Burkina Faso-Brundi- Chad - Comoros –Congo Democratic Republic -Guinea –Liberia –Madagascar –Malawi- Mali – Mozambique- Niger-Sierra Lione – Tanzanie- Togo-
Uganda – Zimbabwe –Eriteria- Central African Republic-Botswana- Cameroon –Cape Verde-Congo Republic-Cote d’ivoire- Ghana- Kenya-Lesotho- Mauritius – Mauritania - Namibie -
Nigeria –Senegal- South Africa -Swaziland- Zambia -Algeria- Egypte- Lybya- Morocco- Tunisia.
Low income Africa
Benin –Burkina Faso-Brundi- Chad - Comros – Congo Democratic Republic -Guinea –Liberia –Madagascar –Malawi- Mali – Mozambique- Niger-Sierra Lione – Tanzanie- Togo-Uganda – Zimbabwe –Eriteria- Centrale Africain Républic.
Middle income Africa
Botswana- Cameroun –Cape Vert-Congo République-Côte d’ivoire- Ghana- Kenya-Lesotho- Mauritius – Mauritania - Namibie -Nigeria –Senegal- South Africa -Sawzialand- Zambia -Algeria- Egypte- Lybya- Marocco- Tunisia.
Table A .1.2. Data description and source
Variables Definitions of variables Sources
FDI Foreign Direct investment, net inflows (%of GDP) in countries i at time t.
WDI
Gov the aggregate index of governance. WGI Inv Domestic investment mesured by the Gross fixed capital
formation as a percent of GDP. WDI WDI WDI WDI WDI WDI WDI WDI
Open Openess mesured by export+import of goods and services /GDP
Inf Inflation approximated by inflation, consumer prices(annual%)
Enrol Human capital measured by the tertiary enrollment ratio Tel Fixed telephone Subscriptions (per 100 people) FD Financial development Domestic credit to private
sector(%of GDP) GDP the market size mesured by GDP per capita
GE the government expenditure, as a percentage of GDP

23
Tax Tax approximated by the index of the economic freedom Freedom House
Appendix 2: Factors analysisis for Africains countries (global sample)
Table A.2.1. Correlation matrix
CC GE PS RQ RL VA
CC 1,000
GE 0,823 1,000
PS 0,707 0,665 1,000
QR 0,730 0,868 0,615 1,000
RL 0,864 0,895 0,776 0,847 1,000
VA 0,684 0,718 0,662 0,759 0,767 1,000
Notes: CC: Control of Corruption, GE: Government Effectiveness, PS: Political Stability, QR: Regulatory Quality, RL: Rule of Law, VA: Voice and Accountability.
Table A.2.2. KMO and Bartlett’s Test Kaiser-Meyer-Olkin measure of sampling adequacy. ,895
Bartlett’s test of sphericity Approx Chi-Square. 3996,767
Ddl 15 Sig ,000
Table A.2.3: Representation qualities(Communalitios)
Initial Extraction
CC 1,000 ,810 GE 1,000 ,903 PS 1,000 ,963 Qr 1,000 ,910 RL 1,000 ,925 VA 1,000 ,729
Extraction Method: Principal Component Analysis
Table A.2.4: Total varaiance explained
Component Initial Eigenvalues Extraction sums of Squared loadings
Total % of variance cumulation % Total % of variance cumulation %
1 4,806 80,102 80,102 4,806 80,102 80,102 2 ,435 7,248 87,350 ,435 7,248 87,350 3 ,352 5,860 93,210 4 ,219 3,657 96,867 5 ,106 1,775 98,642 6 ,081 1,358 100,000
Table A.2.5. Component Matrixa
Components
1 2

24
RL ,962 ,006
GE ,930 -,197
QR ,901 -,313
CC ,898 ,063
VA ,853 -,046
PS ,819 ,540
Extraction Method: component Analysis Method. a. 2 components extracted.
Appendix 3: Factors analysisis for Africains countries (middle income)
Table A.3.1. Correlation matrix
CC GE PS RQ RL VA
CC 1,000
GE 0.8803 1,000
PS 0.7617 0.6767 1,000
QR 0.8066 0.8936 0.6081 1,000
RL 0.8971 0.9064 0.7821 0.8343 1,000
VA 0.7758 0.7721 0.6101 0.7884 0.7871 1,000
Notes: CC: Control of Corruption, GE: Government Effectiveness, PS: Political Stability, QR: Regulatory Quality, RL: Rule of Law, VA: Voice and Accountability.
Table A.3.2.KMO and Bartlett’s Test Kaiser-Meyer-Olkin measure of sampling adequacy. ,897
Bartlett’s test of sphericity Approx Chi-Square. 2260,284
Ddl 15 Sig ,000
Table A.3. 3. Representation qualities
Initial Extraction
CC 1,000 ,894 GE 1,000 ,913 PS 1,000 ,969 QR 1,000 ,903 RL 1,000 ,923 VA 1,000 ,808
Extraction Method: Principal Component Analysis
Table A.3.4. Total varaiance explained
Component Initial Eigenvalues Extraction sums of Squared loadings
Total % of variance cumulation % Total % of variance cumulation %
1 4,942 82,372 82,372 4,942 82,372 82,372 2 ,468 7,796 90,168 ,468 7,796 90,168 3 ,266 4,426 94,594 4 ,156 2,603 97,197

25
5 ,100 1,673 98,870 6 ,068 1,130 100,000
Table A.3.5. Component Matrixa
Components
1 2
RL ,943 ,068
GE ,946 -,134
QR ,810 ,560
CC ,909 -,276
VA ,959 ,062
PS ,869 -,228
Extraction Method: component Analysis Method. a. 2 components extracted.
Appendix 4: Factors analysisis for Africains countries (low income)
Table A.4.1. Correlation matrix
CC GE PS RQ RL VA
CC 1,000
GE ,583 1,000
PS ,568 ,592 1,000
QR ,490 ,773 ,531 1,000
RL ,714 ,806 ,736 ,797 1,000
VA ,447 ,644 ,694 ,715 ,720 1,000
Notes: CC: Control of Corruption, GE: Government Effectiveness, PS: Political Stability, QR: Regulatory Quality, RL: Rule of Law, VA: Voice and Accountability.
Table A.4.2. KMO and Bartlett’s Test Kaiser-Meyer-Olkin measure of sampling adequacy. ,848
Bartlett’s test of sphericity Approx Chi-Square. 1429,747
Ddl 15 Sig ,000
Table A.4.3. Representation qualities
Initial Extraction
CC 1,000 ,931 GE 1,000 ,772 PS 1,000 ,675 QR 1,000 ,839 RL 1,000 ,898 VA 1,000 ,796
Extraction Method: Principal Component Analysis
Table A.4.4. Total varaiance explained
Component Initial Eigenvalues Extraction sums of Squared loadings
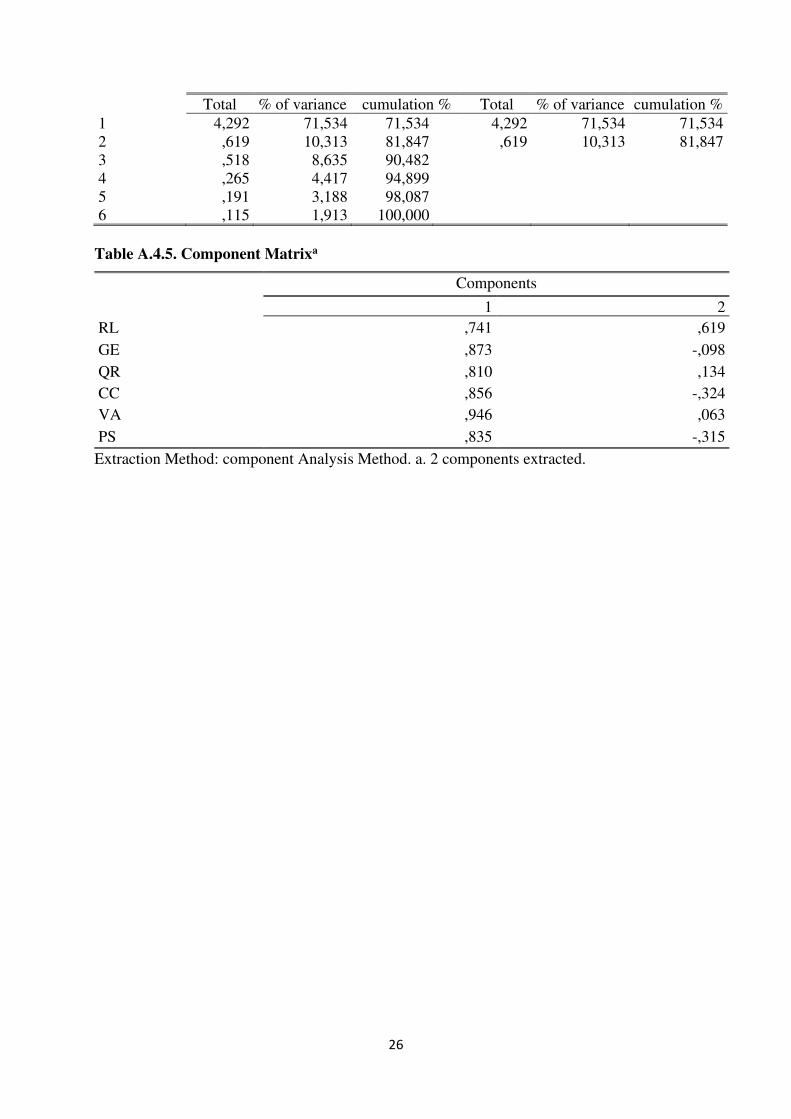
26
Total % of variance cumulation % Total % of variance cumulation %
1 4,292 71,534 71,534 4,292 71,534 71,534 2 ,619 10,313 81,847 ,619 10,313 81,847 3 ,518 8,635 90,482 4 ,265 4,417 94,899 5 ,191 3,188 98,087 6 ,115 1,913 100,000
Table A.4.5. Component Matrixa
Components
1 2
RL ,741 ,619
GE ,873 -,098
QR ,810 ,134
CC ,856 -,324
VA ,946 ,063
PS ,835 -,315
Extraction Method: component Analysis Method. a. 2 components extracted.

27