Embed Size (px)
Citation preview

1
Working Paper No. 164
Ethiopians’ views of democratic
government: Fear, ignorance, or
unique understanding of democracy?
by Robert Mattes and Mulu Teka | May 2016

1
Working Paper No. 164
Ethiopians’ views of democratic
government: Fear, ignorance, or
unique understanding of democracy?
by Robert Mattes and Mulu Teka | May 2016
Robert Mattes is professor of political studies at the University of Cape Town, South Africa. Email: [email protected]. Mulu Teka is principal researcher and director of ABCON Plc Consulting House, Ethiopia. Email: [email protected].
Abstract
Five rounds of Afrobarometer surveys in up to 35 African countries show that ordinary African citizens tend to reach the same conclusions about the extent of democracy in their country as international expert rating systems. But the 2013 survey in Ethiopia produces a puzzling anomaly: While no expert assessment comes close to calling Ethiopia a democracy, 81% of Ethiopians consider their country either a complete democracy or a democracy with only minor problems. The best explanation for this anomaly is Ethiopians’ highly positive assessment of political and economic developments in their country. However, these opinions are marked by a syndrome of “uncritical citizenship” and a distinctively instrumental and paternalistic understanding of “democracy.” Other contributing factors include the country’s low level of development, especially with respect to education and communications; its long-standing one-party dominance and low levels of political freedom; and significant political fear and suspicion of the interview environment. Because of the idiosyncratic way in which Ethiopians understand democracy, extreme caution must be exercised in attempting to compare any responses to democracy questions from Ethiopia with those from other African countries. Analysts are advised to use the Ethiopia data set only in a stand-alone setting or to limit their comparative analysis to items that do not use the “d-word.”
Acknowledgements
We would like to thank Leonardo Arriola, Michael Bratton, Carolyn Logan, Leonard Wantchekon, and Rajen Govender for their comments on earlier versions of this paper.

Afrobarometer Working Papers
Copyright © Afrobarometer 2016 1
Executive summary
The results of five rounds of Afrobarometer surveys in up to 35 African countries demonstrate
clearly that ordinary African citizens tend to reach the same conclusions about the extent of
democracy in their country as international expert rating systems devised by political
scientists. Yet the 2013 Afrobarometer survey in Ethiopia produces a puzzling anomaly. While
no expert assessment comes close to calling Ethiopia a democracy, 81% of Ethiopian
respondents told Afrobarometer interviewers that the country was either a complete
democracy or a democracy with only minor problems. This paper seeks to solve this puzzle.
The best explanation of why Ethiopians think their country is a democracy is their very positive
assessment of political and economic developments. Of respondents who offered an
opinion, the overwhelming balance said that the most recent election was free and fair, that
the executive respects the Constitution and Legislature, and that very few officials are
corrupt. They also said the country was headed in the right direction, saw the economy
improving, and considered that the government had managed the economy well.
Ethiopians who held these opinions were likely to say the country is democratic.
However, we have located a syndrome of “uncritical citizenship” that affects the way
Ethiopians form these opinions. That is, Ethiopians were consistently among the most likely
respondents across Afrobarometer surveys in 35 countries to say they “don’t know” –
sometimes one-third or more of respondents said this – when asked to evaluate economic
and political performance. And among those who did offer substantive responses, Ethiopians
ranked as the least likely people to offer explicitly critical replies.
An important part of the explanation of Ethiopians’ uncritical assessments of the democratic
character and performance of the regime is their distinctive understanding of the concept
“democracy.” To begin with, Ethiopians attach a very positive connotation to the word
“democracy.” Yet they display a poor grasp of what the concept actually entails. Many are
willing to accept clearly undemocratic alternative regime types. While they understand
democracy as a system of elected government, they have little appreciation of the
importance of multi-party competition or the roles played by rights, laws, courts, legislatures,
opposition parties, or the news media in restraining government and limiting the role of the
executive.
In addition, Ethiopians define democracy more instrumentally (that is, in terms of the provision
of material welfare or effective governance) than intrinsically (that is, as the protection of
individual freedoms or the observance of political procedures such as competitive elections
and institutional checks and balances). By wide margins, Ethiopians also see political
authority in paternalistic terms (as a “parent” rather than an “employee”) and prefer a
government that “gets things done” to one that follows proper procedures. All of these
(mis)understandings of democracy lead Ethiopians to overrate – by a wide margin – the
extent and quality of democracy in their own country.
Throughout this report, we also focus on the impact of the country’s extremely low level of
development and modernization, especially with respect to education and
communications. Ethiopia has one of the highest proportions of rural-based citizens amongst
the 35 countries surveyed during Afrobarometer Round 5 (2011/2013). The Ethiopian
electorate is also characterized by the lowest level of formal education amongst
Afrobarometer countries, the lowest level of news media use, and one of the lowest levels of
political discussion. In particular, the penetration of news media in rural Ethiopia is extremely
limited. An astonishingly low 2% of rural dwellers read newspapers on at least a weekly basis,
and only 3% of rural residents own a television.
Finally, we have probed the possibility that, given the country’s long-standing one-party
dominance and low levels of political freedom, at least some survey respondents censored
themselves and did not reveal their true evaluations and preferences. We located significant
levels of political fear, as indicated by perceived insecurity in the ability to join associations,
to vote without pressure, and particularly to speak freely about politics. Significant minorities
also worried about electoral intimidation and violence. We also found that Ethiopians exhibit

Afrobarometer Working Papers
Copyright © Afrobarometer 2016 2
a high degree of political suspicion of the survey environment. They expressed the highest
levels of suspicion of the neutrality of Afrobarometer fieldworkers in Africa: Two-thirds of
respondents told interviewers that they thought they were really from some part of the
Ethiopian state. In turn, Afrobarometer interviewers observed relatively high proportions of
respondents who were ill at ease in the course of the interview.
While neither ignorance (with the exception of news media use) nor political suspicion has a
direct impact on Ethiopians’ anomalous assessment of the quality of democracy, they both
play important indirect roles. The small proportion of respondents who are well educated,
who use the news media frequently, and who engage in frequent political discussion were
much more likely to offer negative evaluations, and were also far more likely to offer opinions
about political performance. These factors are also strongly connected to the inability to
answer questions about democratic norms that do not actually use the word “democracy.”
In turn, the vast majority of Ethiopians who infrequently or never use news media offered
more rose-coloured assessments of the country’s democracy than those who use news
media frequently.
Perhaps more importantly, we found that respondent trust in the fieldworker and comfort
with the survey interview environment play key roles and interact with levels of political fear.
Respondents who were both fearful of political intimidation and suspicious of the interview
environment were more likely to offer positive views of economic and political governance
and the performance of leaders and institutions, as well as more likely to decline to answer
these questions.
Going beyond the survey results, this paper interprets the tendency of Ethiopians to overrate
the extent and quality of their country’s democracy as a consequence of an institutional
legacy of feudal monarchy and Leninist one-party rule. Never having experienced an
interlude of democracy, citizens have instead imbibed a top-down ideology of guardianship
by which a paternalistic elite promises to provide material welfare in lieu of guarantees of
political liberty. In other words, Ethiopians do not only have limited knowledge about what
democracy means; rather, the concept has been redefined for them. And by buying into
the Ethiopian Peoples’ Revolutionary Democratic Front’s definition of “revolutionary
democracy,” Ethiopians remain subjects rather than citizens.
Finally, because of the idiosyncratic way in which Ethiopians apparently understand
democracy, extreme caution must be exercised in attempting to compare any responses to
“d-word” (i.e. democracy) questions from Ethiopia with those from other African countries.
Indeed, because of the evident cross-country incomparability of this set of responses,
Afrobarometer has refrained from integrating data from Ethiopia into the merged
Afrobarometer Round 5 data set. Analysts who wish to explore public opinion in Ethiopia are
strongly cautioned against taking cross-national comparisons between Ethiopia and other
countries at face value, especially on items that use the “d-word.” In general, analysts are
advised to use the Ethiopia data set only in a stand-alone setting or to limit their comparative
analysis to items that do not use the “d-word.”
African views of democracy and the Ethiopian anomaly
Previous analyses of public opinion data collected by Afrobarometer have demonstrated
that Africans are good judges of the quality of democracy in their country (Bratton et al.,
2005; Bratton & Houessou, 2014). That is, ordinary citizens across the continent tend to reach
the same conclusions about the extent of democracy in their own country as do various
international expert rating systems devised by political scientists. In those countries that
experts rate as democracies, such as Mauritius or Botswana, large proportions of people say
the country is a full democracy. But where scholars find abundant evidence of repression
and violations of human rights, survey respondents tend to say the country is either not a
democracy or one of low quality.
But while no expert assessment comes close to calling Ethiopia a democracy, 81% of
Ethiopian respondents told Afrobarometer interviewers in a 2013 survey that their country was

Afrobarometer Working Papers
Copyright © Afrobarometer 2016 3
either a full democracy or one with minor problems. They also tended to provide effusive
evaluations of many other parts of their political system. In no other African country is the
divergence between international expert and local mass estimates greater. Thus, Ethiopians
stand out from other Africans by insisting – contra international opinion – that they live in a
democracy. This paper seeks to understand this anomalous finding by testing whether
Ethiopians’ unexpected views of democracy and governance are due to fear, ignorance, or
a shared (mis)understanding of democracy.
Context
Ethiopia presents the analyst with a distinctive history of autocracy as well as extremely low
levels of socioeconomic development. Ethiopians have a long and unique experience with
autocratic government. After 2,000 years of monarchic rule, the last sovereign, Emperor Haile
Selassie I, was overthrown in 1974, after 44 years on the throne. However, the popular uprising
against Selassie was followed by a repressive military dictatorship, marked by a devastating
civil war, that lasted for 17 years under the Marxist Derg of Mengistu Haile Mariam. Mengistu
was in turn ousted by a coalition of ethnically based rebel groups that, as the Ethiopian
Peoples’ Revolutionary Democratic Front (EPRDF), formed a transitional government in May
1991.1
Ethiopians were first exposed to democracy in 1994 when a new ethnically based federal
constitution provided for multiparty elections and a parliamentary system at the national
level, with a division of powers between the central and regional governments. In almost all
other instances of transitions away from autocratic rule in Africa since 1989, the society in
question had some prior experience with multiparty elections and representative
government in the early post-independence period, or even with limited referenda and
elected legislative councils in the late colonial period. By contrast, a direct transition from
monarchy to Marxist-Leninist one-party rule precluded Ethiopians from any experience with,
or opportunity to learn about, democracy.
Moreover, EPRDF ideologists have promoted an official doctrine of “revolutionary
democracy” (“abyotawi democracy” in the Amharic language). This doctrine redefines
democracy to emphasize mass participation and group consensus while minimizing the
importance of individual freedom and choice. Deriving from the experience of armed
struggle, the official version of democracy rejects most core liberal principles such as free
speech, open elections, and the rule of law. Instead, the operating principle is democratic
centralism, whereby decisions made at higher levels of a vanguard party are transmitted
downward to disciplined mass organizations. As such, to an extent possibly exceeded in any
other African country, Ethiopian citizens are indoctrinated in an interpretation of democracy
that is “the exact opposite of liberalism. … The doctrine remains powerful as a fighting tool to
exclude internal and external ‘enemies’ ” (Bach, 2011, p. 657; see also Tronvoll, 2009).
Indeed, by essentially denying the possibility of alternation of rulers by election, the official
ideology of “revolutionary democracy” helps to underwrite the resilience of authoritarian
rule.
While the country has now held five multiparty elections, the ruling EPRDF has become
increasingly dominant. Since the first election in May 1995, which made Meles Zenawi prime
minister, the de facto one-party regime has won four successive election victories.
Opposition parties managed to secure 105 of 547 House of Peoples’ Representatives seats in
the 2005 federal election, but they called the integrity of the vote into question and rejected
the results. Post-election protests degenerated into violence and a major government
crackdown in which civilians were killed and opposition leaders, human rights activists, and
journalists were imprisoned on treason charges. In 2010, the opposition was almost eliminated
electorally, winning only one constituency and a single legislative seat. The EPRDF’s electoral
1 The Ethiopian Peoples’ Revolutionary Democratic Front (EPRDF) is a coalition of the Tigray People’s Liberation
Front (TPLF), the Amhara National Democratic Movement (ANDM), the Oromo Peoples’ Democratic Organization (OPDO), and the Southern Ethiopian Peoples’ Democratic Movement (SEPDM).
Afrobarometer Working Papers
Copyright © Afrobarometer 2016 4
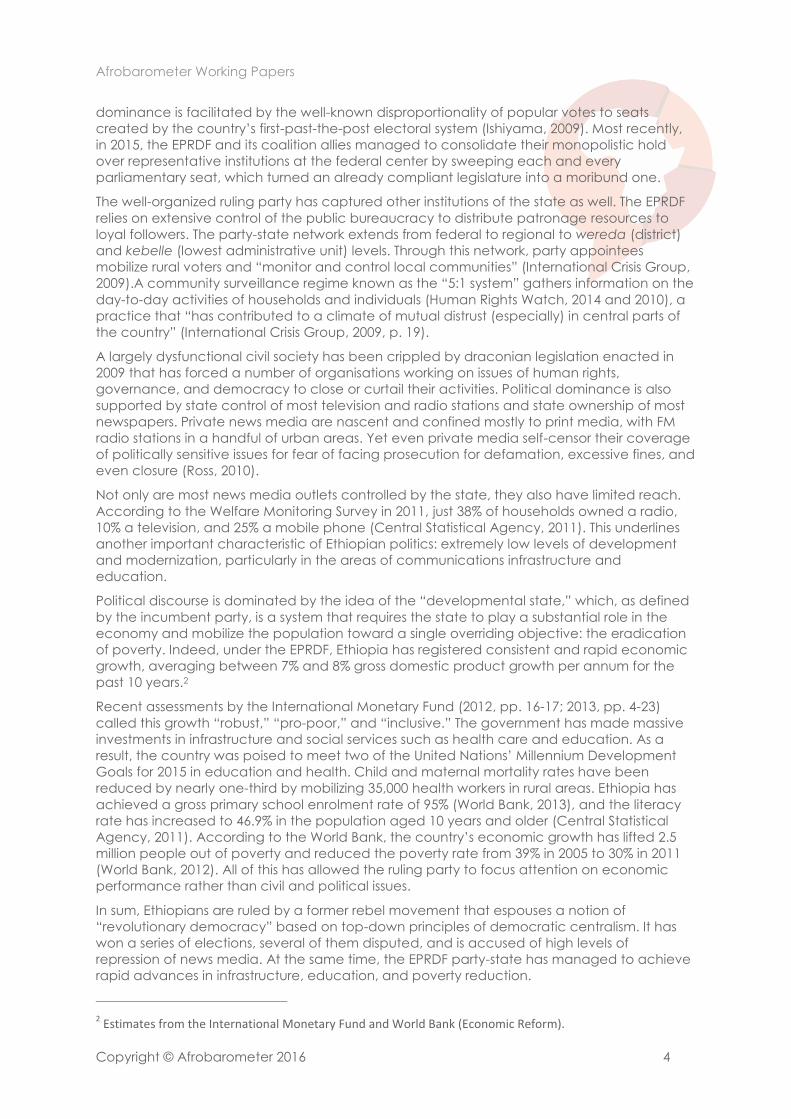
dominance is facilitated by the well-known disproportionality of popular votes to seats
created by the country’s first-past-the-post electoral system (Ishiyama, 2009). Most recently,
in 2015, the EPRDF and its coalition allies managed to consolidate their monopolistic hold
over representative institutions at the federal center by sweeping each and every
parliamentary seat, which turned an already compliant legislature into a moribund one.
The well-organized ruling party has captured other institutions of the state as well. The EPRDF
relies on extensive control of the public bureaucracy to distribute patronage resources to
loyal followers. The party-state network extends from federal to regional to wereda (district)
and kebelle (lowest administrative unit) levels. Through this network, party appointees
mobilize rural voters and “monitor and control local communities” (International Crisis Group,
2009).A community surveillance regime known as the “5:1 system” gathers information on the
day-to-day activities of households and individuals (Human Rights Watch, 2014 and 2010), a
practice that “has contributed to a climate of mutual distrust (especially) in central parts of
the country” (International Crisis Group, 2009, p. 19).
A largely dysfunctional civil society has been crippled by draconian legislation enacted in
2009 that has forced a number of organisations working on issues of human rights,
governance, and democracy to close or curtail their activities. Political dominance is also
supported by state control of most television and radio stations and state ownership of most
newspapers. Private news media are nascent and confined mostly to print media, with FM
radio stations in a handful of urban areas. Yet even private media self-censor their coverage
of politically sensitive issues for fear of facing prosecution for defamation, excessive fines, and
even closure (Ross, 2010).
Not only are most news media outlets controlled by the state, they also have limited reach.
According to the Welfare Monitoring Survey in 2011, just 38% of households owned a radio,
10% a television, and 25% a mobile phone (Central Statistical Agency, 2011). This underlines
another important characteristic of Ethiopian politics: extremely low levels of development
and modernization, particularly in the areas of communications infrastructure and
education.
Political discourse is dominated by the idea of the “developmental state,” which, as defined
by the incumbent party, is a system that requires the state to play a substantial role in the
economy and mobilize the population toward a single overriding objective: the eradication
of poverty. Indeed, under the EPRDF, Ethiopia has registered consistent and rapid economic
growth, averaging between 7% and 8% gross domestic product growth per annum for the
past 10 years.2
Recent assessments by the International Monetary Fund (2012, pp. 16-17; 2013, pp. 4-23)
called this growth “robust,” “pro-poor,” and “inclusive.” The government has made massive
investments in infrastructure and social services such as health care and education. As a
result, the country was poised to meet two of the United Nations’ Millennium Development
Goals for 2015 in education and health. Child and maternal mortality rates have been
reduced by nearly one-third by mobilizing 35,000 health workers in rural areas. Ethiopia has
achieved a gross primary school enrolment rate of 95% (World Bank, 2013), and the literacy
rate has increased to 46.9% in the population aged 10 years and older (Central Statistical
Agency, 2011). According to the World Bank, the country’s economic growth has lifted 2.5
million people out of poverty and reduced the poverty rate from 39% in 2005 to 30% in 2011
(World Bank, 2012). All of this has allowed the ruling party to focus attention on economic
performance rather than civil and political issues.
In sum, Ethiopians are ruled by a former rebel movement that espouses a notion of
“revolutionary democracy” based on top-down principles of democratic centralism. It has
won a series of elections, several of them disputed, and is accused of high levels of
repression of news media. At the same time, the EPRDF party-state has managed to achieve
rapid advances in infrastructure, education, and poverty reduction.
2 Estimates from the International Monetary Fund and World Bank (Economic Reform).

Afrobarometer Working Papers
Copyright © Afrobarometer 2016 5
The anomaly: Ethiopians’ assessments of democracy
It was against this backdrop that Afrobarometer, as part of a major expansion in country
coverage across the African continent during Round 5 (2011-2013), carried out its first survey
in Ethiopia in August 2013.3 We begin by focusing on responses to a signature Afrobarometer
question that asks respondents, “In your opinion, how much of a democracy is [your country]
today?” Respondents could answer that it is “a full democracy,” “a democracy, but with
minor problems,” “a democracy with major problems,” or “not a democracy” (in addition to
the standard “don’t know/don’t understand the question” option). Given the political history
sketched out above, the responses were surprising. Four in 10 respondents (42%) answered
that Ethiopia was an unblemished “full democracy.” This response outpaced every other
society among the 35 Round 5 country surveys. An additional 39% responded that it was a
“democracy, but with minor problems” (Table 1). The normal Afrobarometer practice is to
combine these responses as a broad indicator of the public sense that the country meets
basic standards of democracy. If we follow this practice in Ethiopia, 81% indicate that they
think the country is a full, or mostly democratic; again, this was the highest result recorded in
35 Round 5 surveys (Figure 1).
Table 1: Perceived extent of democracy | Ethiopia | 2013
%
A full democracy 42
A democracy, but with minor problems 39
A democracy with major problems 6
Not a democracy 2
Don’t know 9
Don’t understand question/democracy) 1 Respondents were asked: How much of a democracy is Ethiopia today?
The perception of the unblemished democratic quality of Ethiopia’s government is far higher
in the countryside (46% of rural respondents say the country is “a full democracy”) than in the
cities (27%). This is important, since almost eight in 10 Ethiopians live in the countryside (79%).
Only Uganda (86%), Burundi (83%), and Malawi (81%) have larger proportions of their adult
populations residing in rural areas. This perception is also far higher among respondents who
said they “feel close” to the ruling party (46% said “a full democracy”) than among those
who supported an opposition party (33%). Yet only 31% said they “feel close” to any political
party, the lowest level among all continental sub-Saharan countries. Moreover, the lion’s
share of these identifiers said they feel close to the ruling EPRDF (27%), leaving just 4% willing
to openly affiliate with any opposition party.
Yet Ethiopians do not simply label any regime democratic; there is evidence that they
discriminate levels of democracy across differing regimes. In response to a differently framed
set of questions, the median Ethiopian gave the current government a score of 8 on a scale
of 0 (““completely undemocratic”) to 10 (“completely democratic”), corroborating the
effusive responses discussed earlier regarding the quality of the country’s current
democracy. But when asked about the level of democracy 10 years previous, in 2003, when
the EPRDF was also the ruling party, the median Ethiopian gave a score of just 5. Moreover,
they provided extremely critical views of the Derg regime (Mengistu’s military government),
for which the median score was 1 (Table 2).
3 Afrobarometer is a pan-African, non-partisan research network that conducts public attitude surveys on
democracy, governance, economic conditions, and related issues across more than 30 countries in Africa. Afrobarometer conducts face-to-face interviews in the language of the respondent’s choice with nationally representative samples. The Afrobarometer team in Ethiopia, led by the Survey Research Unit at ABCON Plc Consulting House, interviewed 2,400 adult Ethiopians in August 2013. A sample of this size yields country-level results with a margin of error of +/-2% at a 95% confidence level.

Afrobarometer Working Papers
Copyright © Afrobarometer 2016 6
Figure 1: Perceived extent of democracy | 35 countries | 2011/2013
Respondents were asked: In your opinion, how much of a democracy is [your country] today?
Table 2: Ratings of democracy across differing political regimes, 10-point scale
| Ethiopia | 2013
Previous non-democratic regime
Government of 10 years ago
Government today
Government in 10 years’ time
0 to 1 53% 6% 2% 1%
2 to 4 9% 20% 5% 1%
5 4% 18% 15% 1%
6 to 8 1% 21% 34% 8%
9 to 10 2% 9% 29% 72%
Don’t know 32% 26% 16% 18%
Mean 1.0 5.3 7.4 9.5
Median 0 5 8 10.0 Respondents were asked: On a scale of 0 to 10, where 0 means completely undemocratic and 10
means completely democratic, where would you place each of the following, or haven’t heard
enough to say? (“Don’t know” responses were excluded when calculating means.)
8%
8%
9%
8%
9% 10%
9%
10%
6% 12%
9%
16%
7%
9%
20%
7%
12% 24%
20%
23%
15%
28% 24%
39%
32%
27%
30%
37%
27% 27%
27%
22%
27%
33% 42%
11%
19%
18%
21%
22% 22%
25%
26%
30% 24%
28%
25%
35%
33%
30%
44%
40% 31%
36%
34%
48%
38% 43%
29%
39%
43%
41%
35%
46% 49%
49%
54%
52%
46% 39%
0% 10% 20% 30% 40% 50% 60% 70% 80% 90%
EgyptTunisia
Sudan
Madagascar
Zimbabwe
Morocco
Côte d'Ivoire
TogoCameroon
Mali
Swaziland
Guinea
NigeriaKenya
Lesotho
Algeria
Uganda
Burkina Faso
Malawi
MozambiqueCape Verde
South Africa
Senegal
Niger
LiberiaBenin
Sierra Leone
Burundi
Namibia
Tanzania
Zambia
MauritiusGhana
Botswana
Ethiopia
Full democracy Democracy with minor problems

Afrobarometer Working Papers
Copyright © Afrobarometer 2016 7
Returning to the current political regime, a separate question, widely used around the world
by comparative survey research projects, found that 39% proclaimed themselves to be “very
satisfied” with “the way democracy works” in Ethiopia – again the highest positive response
recorded across all 35 African countries (not shown). In total, 81% were either “fairly” or “very
satisfied” (Table 3). As with the extent of democracy, rural Ethiopians are far more satisfied
(42% say “very satisfied”) than urban dwellers (28%).
Table 3: Satisfaction with democracy | Ethiopia | 2013
%
Very satisfied 39
Fairly satisfied 42
Not very satisfied 6
Not at all satisfied 4
Don’t know 9 Respondents were asked: Overall, how satisfied are you with the way democracy works in Ethiopia?
Afrobarometer asks these questions on the extent of democracy and satisfaction with
democracy because we believe that citizens’ evaluations of the supply of democracy are
likely to be more relevant to actual political developments within the country than the expert
ratings produced by organisations such as Polity, Freedom House, the Mo Ibrahim
Foundation, World Bank, and Bertelsmann Foundation (Mattes & Bratton, 2007). Moreover, in
the words of John Stuart Mill, citizens may be more likely than experts, especially those at a
distance, to know when and where the “democratic shoe pinches.” That is, they may be
more likely to observe political practices at grass-roots levels that are simply beyond the
purview of political scientists. Any divergences between expert and mass evaluations may
suggest that citizens are privy to political phenomena missed or under-weighted by expert
judgments.4
At the same time, we have found over the years that ordinary Africans tend, broadly, to
reach the very same conclusions as the experts about the levels of democracy in surveyed
countries. Where experts rank a country high on their scales as a full democracy, large
proportions of Afrobarometer respondents also do so. Likewise, where few survey
respondents say countries are democracies, experts tend to rate them as only partial
democracies, or autocracies.
Ethiopia, however, is different. In contrast to the extremely positive assessments provided by
ordinary Ethiopians, expert rating organisations come to very different conclusions. In its 2013
survey, for example, Freedom House gave Ethiopia scores of 6 for civil liberties and 6 for
political freedom (on a scale that runs from 1 to 7, 7 being the worst), which gives it an
overall freedom status of “not free.” In 2013, Polity scored Ethiopia at -2.5 on an
autocracy/democracy scale that runs from -10 to +10, categorizing it as a “closed
anocracy.”According to political scientist Tatu Vanhanen, who measures democracy as a
combination of voter turnout (participation) and the combined vote share won by
opposition parties (contestation), Ethiopia is not a democracy, receiving a combined index
score of 3 (with 5 being the cut-off point for democracy on a scale of 0 to 50). Ethiopia
obtains similarly low scores on the relevant dimensions of the World Bank Worldwide
Governance Indicators measure of Voice and Accountability (which places it at the 12th
percentile across more than 200 countries), as well as from the Mo Ibrahim Index of African
4 None of this is to suggest that we should take the position of C.B. MacPherson (1966), who argued in the
years following decolonization and at the height of the Cold War that democracy means different things to different people, and that First World (bourgeois democracy), Second World (people’s democracy), and Third World (developmental democracy) countries were simply differently democratic. We reject this as a relativistic approach.
Afrobarometer Working Papers
Copyright © Afrobarometer 2016 8
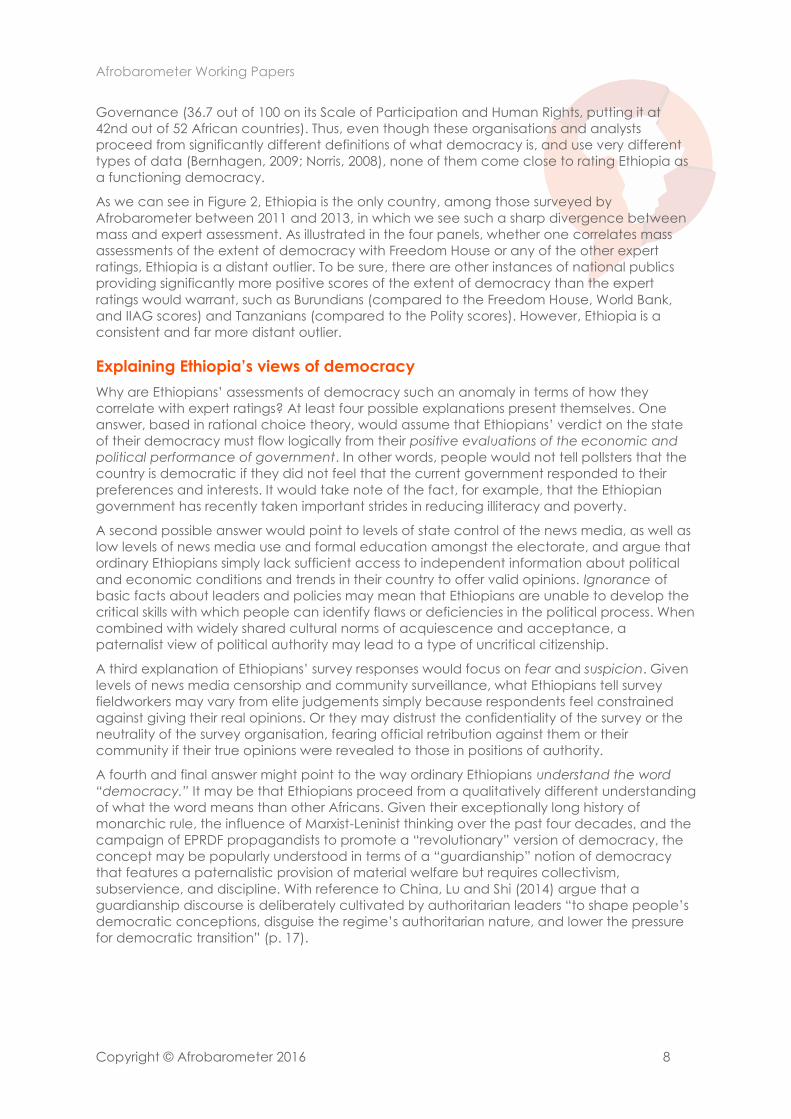
Governance (36.7 out of 100 on its Scale of Participation and Human Rights, putting it at
42nd out of 52 African countries). Thus, even though these organisations and analysts
proceed from significantly different definitions of what democracy is, and use very different
types of data (Bernhagen, 2009; Norris, 2008), none of them come close to rating Ethiopia as
a functioning democracy.
As we can see in Figure 2, Ethiopia is the only country, among those surveyed by
Afrobarometer between 2011 and 2013, in which we see such a sharp divergence between
mass and expert assessment. As illustrated in the four panels, whether one correlates mass
assessments of the extent of democracy with Freedom House or any of the other expert
ratings, Ethiopia is a distant outlier. To be sure, there are other instances of national publics
providing significantly more positive scores of the extent of democracy than the expert
ratings would warrant, such as Burundians (compared to the Freedom House, World Bank,
and IIAG scores) and Tanzanians (compared to the Polity scores). However, Ethiopia is a
consistent and far more distant outlier.
Explaining Ethiopia’s views of democracy
Why are Ethiopians’ assessments of democracy such an anomaly in terms of how they
correlate with expert ratings? At least four possible explanations present themselves. One
answer, based in rational choice theory, would assume that Ethiopians’ verdict on the state
of their democracy must flow logically from their positive evaluations of the economic and
political performance of government. In other words, people would not tell pollsters that the
country is democratic if they did not feel that the current government responded to their
preferences and interests. It would take note of the fact, for example, that the Ethiopian
government has recently taken important strides in reducing illiteracy and poverty.
A second possible answer would point to levels of state control of the news media, as well as
low levels of news media use and formal education amongst the electorate, and argue that
ordinary Ethiopians simply lack sufficient access to independent information about political
and economic conditions and trends in their country to offer valid opinions. Ignorance of
basic facts about leaders and policies may mean that Ethiopians are unable to develop the
critical skills with which people can identify flaws or deficiencies in the political process. When
combined with widely shared cultural norms of acquiescence and acceptance, a
paternalist view of political authority may lead to a type of uncritical citizenship.
A third explanation of Ethiopians’ survey responses would focus on fear and suspicion. Given
levels of news media censorship and community surveillance, what Ethiopians tell survey
fieldworkers may vary from elite judgements simply because respondents feel constrained
against giving their real opinions. Or they may distrust the confidentiality of the survey or the
neutrality of the survey organisation, fearing official retribution against them or their
community if their true opinions were revealed to those in positions of authority.
A fourth and final answer might point to the way ordinary Ethiopians understand the word
“democracy.” It may be that Ethiopians proceed from a qualitatively different understanding
of what the word means than other Africans. Given their exceptionally long history of
monarchic rule, the influence of Marxist-Leninist thinking over the past four decades, and the
campaign of EPRDF propagandists to promote a “revolutionary” version of democracy, the
concept may be popularly understood in terms of a “guardianship” notion of democracy
that features a paternalistic provision of material welfare but requires collectivism,
subservience, and discipline. With reference to China, Lu and Shi (2014) argue that a
guardianship discourse is deliberately cultivated by authoritarian leaders “to shape people’s
democratic conceptions, disguise the regime’s authoritarian nature, and lower the pressure
for democratic transition” (p. 17).

Afrobarometer Working Papers
Copyright © Afrobarometer 2016 9
Figure 2: Public ratings of extent of democracy and selected expert indicators | 35 countries | 2011/2013

Afrobarometer Working Papers
Copyright © Afrobarometer 2016 10
The rest of this paper will review the evidence for each of these propositions. The evidence
will come from the responses of ordinary Ethiopians to Afrobarometer questions, the
correlations of those answers with their views on the extent of democracy in Ethiopia, and
cross-country comparisons between aggregate responses in Ethiopia and other African
countries. Since Ethiopia lies at the extreme of Afrobarometer responses in assessments of
democracy, the goal here is to identify other areas in which Ethiopia lies at the extremities of
the distribution. Comparative politics proceeds from the premise that similar country
characteristics explain similar outcomes, and different country characteristics explain
different outcomes (Coppedge, 2012). To this we would add, for purposes of this analysis,
extreme country characteristics explain extreme outcomes.
Political performance evaluations
Are Ethiopians’ extremely positive evaluations of the democratic content of the regime
matched by equally positive performance evaluations of the political system? Because free
and fair elections are a necessary condition for any democracy, Afrobarometer asks
respondents to rate the quality of their most recent election. As with popular assessments of
democracy, previous research has demonstrated that Africans tend to reach the same
conclusions as election observer missions and other expert assessments (Greenberg &
Mattes, 2013; Mattes, 2014).
Opposition parties managed to win only one legislative seat in Ethiopia’s 2010 parliamentary
elections – and none in 2015 – and the election process was criticized by European Union
and U.S. observers. Thus, the fact that six in 10 Ethiopians (60%) say the 2010 election was
“completely free and fair” is surprising. An additional 15% considered it “free and fair, but
with minor problems.” Only 1% of respondents stated that the election was “not free or fair.”
Significantly, 20% of respondents said they did not know (Table 4). Of the one-quarter of the
electorate who identify with the EPRDF, 69% said the election was completely free and fair,
compared to 58% of those who feel close to no political party and 44% of those who identify
with an opposition party.
Table 4: Freeness and fairness of the most recent national election | Ethiopia | 2013
%
Completely free and fair 60
Free and fair, but with minor problems 15
Free and fair, with major problems 3
Not free and fair 1
Don’t know 20
Respondents were asked: On the whole, how would you rate the freeness and fairness of the last
national election held in 2010?
Besides high-quality elections, modern representative democracy is also based on the
premise that elected officials will listen to and represent citizens’ views in national and local
legislative bodies between elections. In order to tap how well Ethiopians think their
representatives perform this task, Afrobarometer asked respondents how often they think
elected officials try to listen to people’s opinions.
Compared to the 82% who said that the country is democratic, or the 75% who said the 2010
election was free and fair, far fewer respondents thought their elected officials were
responsive to public opinion. Just 14% felt that members of Parliament5 (MPs) were “often” or
“always” interested, while 23% said this about their local councillors (Table 5). Significant
5 Parliament is used to refer to the lower House of Peoples’ Representatives, whose members are directly
elected to five-year terms.
Afrobarometer Working Papers
Copyright © Afrobarometer 2016 11
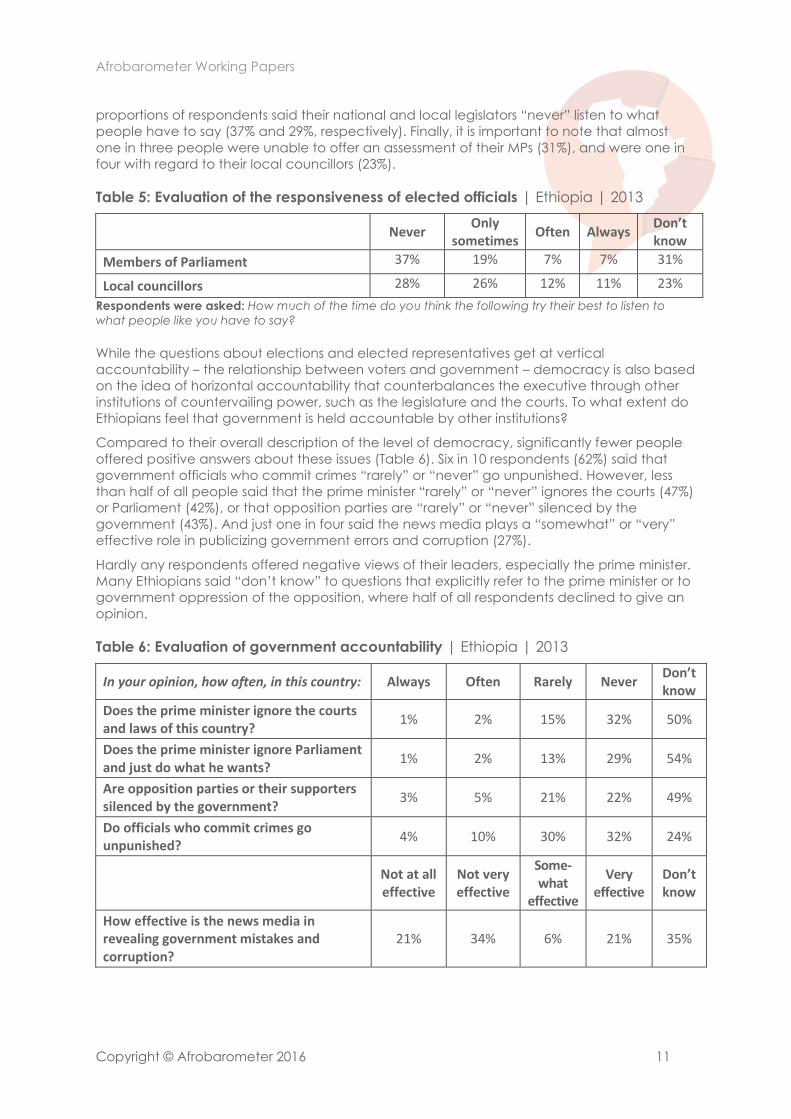
proportions of respondents said their national and local legislators “never” listen to what
people have to say (37% and 29%, respectively). Finally, it is important to note that almost
one in three people were unable to offer an assessment of their MPs (31%), and were one in
four with regard to their local councillors (23%).
Table 5: Evaluation of the responsiveness of elected officials | Ethiopia | 2013
Never
Only sometimes
Often Always Don’t know
Members of Parliament 37% 19% 7% 7% 31%
Local councillors 28% 26% 12% 11% 23%
Respondents were asked: How much of the time do you think the following try their best to listen to
what people like you have to say?
While the questions about elections and elected representatives get at vertical
accountability – the relationship between voters and government – democracy is also based
on the idea of horizontal accountability that counterbalances the executive through other
institutions of countervailing power, such as the legislature and the courts. To what extent do
Ethiopians feel that government is held accountable by other institutions?
Compared to their overall description of the level of democracy, significantly fewer people
offered positive answers about these issues (Table 6). Six in 10 respondents (62%) said that
government officials who commit crimes “rarely” or “never” go unpunished. However, less
than half of all people said that the prime minister “rarely” or “never” ignores the courts (47%)
or Parliament (42%), or that opposition parties are “rarely” or “never” silenced by the
government (43%). And just one in four said the news media plays a “somewhat” or “very”
effective role in publicizing government errors and corruption (27%).
Hardly any respondents offered negative views of their leaders, especially the prime minister.
Many Ethiopians said “don’t know” to questions that explicitly refer to the prime minister or to
government oppression of the opposition, where half of all respondents declined to give an
opinion.
Table 6: Evaluation of government accountability | Ethiopia | 2013
In your opinion, how often, in this country: Always Often Rarely Never Don’t know
Does the prime minister ignore the courts and laws of this country?
1% 2% 15% 32% 50%
Does the prime minister ignore Parliament and just do what he wants?
1% 2% 13% 29% 54%
Are opposition parties or their supporters silenced by the government?
3% 5% 21% 22% 49%
Do officials who commit crimes go unpunished?
4% 10% 30% 32% 24%
Not at all effective
Not very effective
Some-what
effective
Very effective
Don’t know
How effective is the news media in revealing government mistakes and corruption?
21% 34% 6% 21% 35%

Afrobarometer Working Papers
Copyright © Afrobarometer 2016 12
On the issue of government corruption, a slightly larger number of Ethiopians were willing to
give a negative rating to political institutions (Table 7). Between one-fifth and one-sixth of
respondents said that “all” or “most” tax officials (20%), judges (19%), police (17%), local
councillors (17%), and government officials (16%) are involved in corrupt activities.
However, the numbers drop sharply when the questions turn to MPs and the Office of the
Prime Minister. These results place Ethiopia higher than any other Afrobarometer country
except Cape Verde and Mauritius in terms of perceptions of clean governance.
Table 7: Perceptions of corruption | Ethiopia | 2013
All of them
Most of them
Some of them
None of them
Don’t know
Prime Minister’s Office 1% 6% 18% 24% 51%
Members of House of Peoples’ Representatives
1% 7% 18% 19% 54%
Members of regional state councils 1% 9% 21% 17% 51%
Government officials 3% 13% 24% 14% 46%
Elected local government councils 3% 14% 25% 16% 42%
Police 4% 13% 27% 17% 38%
Federal, regional, and local tax collectors
5% 15% 20% 14% 46%
Judges and magistrates 4% 14% 24% 16% 42%
Respondents were asked: How many of the following people do you think are involved in corruption, or
haven’t you heard enough about them to say?
Again, however, levels of “don’t know” are extremely high. Both the frequency of “don’t
know” responses and the low levels of corruption perceptions are surprising, if only because
of the prevalence of corruption in public discourse and the widespread coverage given to it
by state news media and senior government officials. In his last parliamentary address, for
example, former Prime Minister Meles in 2012 described the intensity of corruption and
complained that the country was plagued by “a coalition of thieves within the government
and robbers within the people” (Alebachew, 2012). Indeed, the Mo Ibrahim Foundation’s
Ibrahim Index of African Governance (IAAG) places Ethiopia 25th out of 52 African states in
terms of accountability (which includes several measures of official corruption), and the
World Bank places it at the 36th percentile internationally.
Given this elite discourse, the extremely infrequent reports of individual experiences paying
bribes is also surprising (Table 8). Just 1% to 3% of respondents told interviewers that they had
been victimized by corrupt bureaucrats. This is one of the lowest levels reported in surveyed
countries (matched only by Mauritius, Botswana, Cape Verde, and Namibia, four countries
that regularly receive international recognition for their success in combating corruption).

Afrobarometer Working Papers
Copyright © Afrobarometer 2016 13
Table 8: Personal experiences with corruption | Ethiopia | 2013
In the past year, how often, if ever, have you had to pay a bribe, give a gift, or do a favour to government officials in order to. …?
Often A few times
Once or
twice Never
No experience
in past year
Don’t know
Get a document or a permit? <1% 1% 1% 64% 30% 4%
Get water or sanitation services? <1% <1% 1% 67% 28% 3%
Get treatment at a local health clinic or hospital?
0% 1% 1% 73% 24% 2%
Avoid a problem with the police, like passing a checkpoint or avoiding a fine or arrest?
<1% 1% 1% 69% 26% 2%
Get a place in a primary school for a child? <1% <1% 1% 73% 24% 2%
And during the last election in 2010, how often, if ever, did a candidate or someone from a political party offer you something, like food or a gift or money, in return for your vote?
<1% <1% 1% 94% -- 5%
Next we examine how Ethiopians rate the job performance of their political leaders (Table 9).
Three striking facts emerge. First, positive ratings of incumbent leaders are not especially high.
In 2013, 57% of Ethiopians approved of the job performance of Prime Minister Hailemariam
Desalegn, 46% approved of the performance of their MPs, and 52% were satisfied with the
performance of their local councils. None of these numbers represent an overwhelming
endorsement of any of these incumbents. Second, levels of disapproval are strikingly low.
Just one in 10 respondents told interviewers that they “disapprove” or “strongly disapprove”
of the job performance of these leaders. And finally, we find extremely high levels of “don’t
know” responses, ranging from 43% for MPs to 34% for local councillors.
Table 9: Evaluations of political leaders| Ethiopia | 2013
Strongly disapprove
Disapprove Approve Strongly approve
Don’t know
Prime Minister Hailemariam Desalegn 2% 6% 39% 18% 36%
Member of House of Peoples’ Representatives
2% 7% 39% 9% 43%
Elected local councillor 2% 11% 43% 9% 34% Respondents were asked: Do you approve or disapprove of the way that the following people have
performed their jobs over the past 12 months, or haven’t you heard enough about them to say?
When it comes to evaluations of government performance in specific policy areas,
Ethiopians said they were very pleased. More than eight in 10 respondents said the
government was handling its job “fairly well” or “very well” with regard to fighting crime
(86%), resolving conflicts (83%), and empowering women (86%), and six in 10 approved of its
efforts to fight corruption (61%) (Table 10). No more than 15% gave a negative rating on any
of these policies. While people were willing to offer opinions on these issues, one in five were
unable to give an evaluation with regard to corruption (21%). When we create a single index
that taps the average response across all four questions, we find that Ethiopians gave their
government the highest level of positive responses of all countries surveyed by
Afrobarometer (not shown).

Afrobarometer Working Papers
Copyright © Afrobarometer 2016 14
Table 10: Evaluations of government performance: Crime and corruption | Ethiopia | 2013
Very badly
Fairly badly
Fairly well
Very well
Don’t know
Reducing crime 2% 7% 51% 35% 6%
Resolving violent conflict between communities 2% 6% 55% 28% 9%
Empowering women 1% 5% 48% 38% 8%
Fighting corruption in government 4% 14% 47% 14% 21% Respondents were asked: How well or badly would you say the current government is handling the
following matters, or haven’t you heard enough to say?
Finally, Afrobarometer asks respondents about the amount of “trust” they place in various
institutions (Table 11). Once again, we find that Ethiopians’ opinions were, on balance, quite
positive. Absolute levels of distrust tended to be higher than levels of performance
disapproval but lower than perceptions of corruption. One-fifth to one-sixth of respondents
expressed no trust or low levels of trust in the Ethiopian Revenue and Tax Authority (19%),
police (18%), their local council (17%), and the National Electoral Board (15%). Distrust was far
lower for the governing EPRDF (10%) and the army and prime minister (8% each). The
generally passive acceptance of political institutions and bodies reversed itself with great
clarity when interviewers asked about “opposition parties.” In response to this prompt, 42%
said they distrust opposition parties, with 29% saying they trust them “not at all.” And again,
we see extremely high levels of “don’t know” responses across all institutions.
Table 11: Political trust | Ethiopia | 2013
How much do you trust each of the following, or haven’t you heard enough about them to say?
Not at all
Just a little
Some-
what A lot
Don’t know
Prime Minister Hailemariam Desalegn 2% 6% 21% 51% 19%
House of Peoples’ Representatives 2% 9% 29% 29% 31%
Regional state council 3% 9% 31% 28% 29%
Ethiopian National Electoral Board 5% 10% 27% 27% 31%
Ethiopian Revenue and Tax Authority 8% 11% 24% 20% 38%
Local council 5% 12% 34% 29% 20%
Ruling party (EPRDF) 4% 6% 25% 47% 18%
Opposition political parties 29% 13% 17% 9% 32%
Police 6% 12% 32% 38% 12%
Army 2% 6% 21% 53% 17%
Courts of law 3% 10% 33% 36% 18%
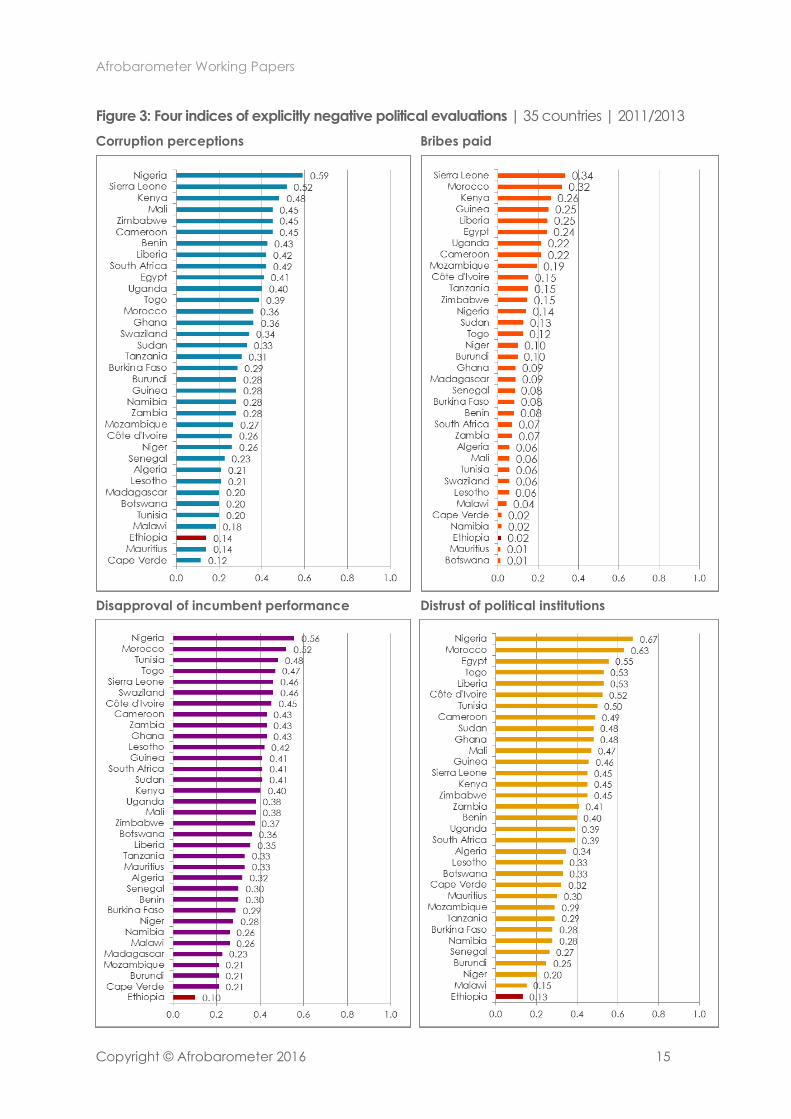
Thus, while Ethiopians do not produce glowing assessments of their political leaders, they
seem unable or unwilling to produce critical evaluations. Given the very high levels of “don’t
know,” we create average indices of explicit negative evaluations with regard to corruption
perceptions, reported extortion at the hands of bureaucrats, disapproval of elected
incumbents, and distrust of political institutions. Across all included items, all reports of
victimization and negative perceptions or evaluations are coded as 1, and all other
responses, including “don’t know,” are coded as 0. The result demonstrates that Ethiopians
are at the low end of each measure of negative evaluations across 35 countries6 (Figure 3).
6 In cases where some component questions of indices were not asked in all countries, figures may show 33 or
34 countries.
Afrobarometer Working Papers
Copyright © Afrobarometer 2016 15
Figure 3: Four indices of explicitly negative political evaluations | 35 countries | 2011/2013
Corruption perceptions Bribes paid
Disapproval of incumbent performance Distrust of political institutions

Afrobarometer Working Papers
Copyright © Afrobarometer 2016 16
Economic evaluations
Now we turn to examine how Ethiopians evaluate the economic performance of their
government. Economic assessments might be a strong influence on political attitudes,
especially if respondents see democracy instrumentally through a substantive lens, as we will
explore below. We look first at respondents’ evaluations of the economy, which are
extremely positive. As of August 2013, eight in 10 respondents said the country was going in
the “right direction” (81%), and half reported that the national economy had improved (51%)
in the previous 12 months (Table 12). In both instances, Ethiopians’ assessments were the most
positive expressed across 35 African countries (Figure 4 and Figure 5).
In this case, the high levels of optimism are not unwarranted. In the year prior to the survey,
Ethiopia had one of the highest GDP growth rates of all 35 Afrobarometer countries, and thus
these evaluations make sense, as is illustrated in Figure 6. The same logic applies to
Ethiopians’ retrospective evaluations of personal living conditions, which are some of the
most positive in Afrobarometer (not shown).
Table 12: Evaluations of economic conditions | Ethiopia | 2013
Much worse
Worse Same Better Much better
Don’t know
Looking back, how do you rate the following compared to 12 months ago: The present economic condition of this country?
2% 15% 28% 43% 8% 5%
Looking back, how do you rate the following compared to 12 months ago: Your living conditions?
2% 15% 34% 43% 5% 1%
Very bad
Bad
Neither good nor bad
Good Very good
Don’t know
In general, how would you describe the present economic condition of this country?
3% 10% 13% 56% 13% 5%
In general, how would you describe your own present living conditions?
4% 12% 18% 58% 7% <1%
Much worse
Worse Same Better Much better
Don’t know
Looking ahead, do you expect the following to be better or worse: Economic conditions in this country in 12 months’ time?
2% 5% 11% 51% 18% 13%
Looking ahead, do you expect the following to be better or worse: Your living conditions in 12 months’ time?
1% 6% 16% 53% 15% 9%
Wrong direction Right direction
Don’t know
What about the overall direction of the country? Would you say that the country is going in the wrong direction or going in the right direction?
9% 81% 10%

Afrobarometer Working Papers
Copyright © Afrobarometer 2016 17
19%
21%
23%
27%
24%
32%
32%
39%
35%
37%
45%
33%
37%
46%
39%
46%
49%
50%
41%
51%
49%
41%
28%
34%
44%
43%
60%
60%
55%
42%
38%
51%
35%
53%
53%
3%
3%
3%
5%
9%
4%
8%
2%
9%
12%
5%
17%
15%
7%
16%
11%
11%
10%
21%
13%
17%
26%
40%
35%
28%
30%
13%
14%
21%
36%
41%
28%
44%
27%
29%
0% 20% 40% 60% 80% 100%
Tanzania
Uganda
Mauritius
Egypt
Kenya
Sudan
Burundi
Madagascar
Malawi
Botswana
Tunisia
Lesotho
Zimbabwe
Togo
South Africa
Cameroon
Morocco
Burkina Faso
Zambia
Guinea
Swaziland
Liberia
Namibia
Sierra Leone
Mozambique
Ghana
Senegal
Cape Verde
Côte d'Ivoire
Nigeria
Benin
Ethiopia
Niger
Mali
Algeria
Better Much better
10%
11%
15%
16%
19%
19%
21%
22%
23%
23%
24%
24%
25%
25%
27%
28%
25%
28%
30%
31%
31%
33%
35%
31%
32%
34%
30%
36%
40%
36%
40%
40%
31%
41%
43%
1%
1%
1%
2%
2%
2%
1%
2%
2%
2%
2%
3%
2%
3%
2%
2%
5%
4%
3%
3%
4%
2%
2%
6%
6%
3%
9%
4%
1%
5%
4%
6%
16%
7%
8%
0% 20% 40% 60% 80% 100%
Egypt
Madagascar
Tunisia
Uganda
Sudan
Lesotho
Togo
Swaziland
Mauritius
Burundi
Tanzania
Botswana
Guinea
Cameroon
Morocco
Côte d'Ivoire
South Africa
Malawi
Kenya
Zimbabwe
Nigeria
Senegal
Cape Verde
Zambia
Namibia
Algeria
Liberia
Niger
Burkina Faso
Ghana
Benin
Mali
Sierra Leone
Mozambique
Ethiopia
Better Much better
Figure 4: Views of recent and future economic trends | 35 countries | 2011/2013
National economic trends, past 12 months National economic trends, next 12 months

Afrobarometer Working Papers
Copyright © Afrobarometer 2016 18
Figure 5: Country headed in right direction | 35 countries | 2011/2013
Figure 6: Prospective evaluations and GDP growth | 35 countries | 2011/2013
20% 21%
23% 24% 24% 25% 26%
35% 36% 36%
38% 38% 39%
46% 47% 48% 49% 50%
52% 52% 52% 53% 53% 53% 55%
58% 58% 59%
63% 64%
66% 71% 71% 72%
81%
0% 10% 20% 30% 40% 50% 60% 70% 80% 90% 100%
EgyptUganda
TunisiaKenya
MaliTanzania
NigeriaSudan
TogoGhana
MadagascarGuineaMalawi
South AfricaSwaziland
CameroonZimbabwe
BurundiLiberia
LesothoBotswanaMauritius
Sierra LeoneMorocco
Côte d'IvoireBenin
Burkina FasoNiger
ZambiaSenegal
Cape VerdeNamibia
MozambiqueAlgeria
Ethiopia

Afrobarometer Working Papers
Copyright © Afrobarometer 2016 19
Not only do Ethiopians perceive positive economic trends, but they also give most of the
credit for these trends to government. The national government received very positive marks
for economic performance (Table 13), with almost eight in 10 saying it was doing “fairly well”
or “very well” with regard to economic management (78%) and job creation (64%). Opinions
were more divided with regard to controlling inflation and narrowing income gaps. When we
create an index of respondents’ average responses across all elements of government
macroeconomic performance, Ethiopians’ levels of positive responses emerge as the highest
across all surveyed countries (not shown).
Table 13: Evaluations of government performance: Macroeconomics | Ethiopia | 2013
How well or badly would you say the current government is handling the following matters, or haven’t you heard enough to say?
Very badly
Fairly badly
Fairly well
Very well
Don’t know
Managing the economy 2% 10% 59% 19% 11%
Creating jobs 4% 17% 53% 13% 12%
Narrowing gaps between rich and poor 10% 26% 42% 9% 13%
Keeping prices down 11% 28% 42% 8% 12%
Positive evaluations are even stronger when it comes to issues of public service delivery
(Table 14). Eight in 10 respondents offered positive ratings of government handling of
HIV/AIDS (85%), education (89%), and health services (85%). At the same time, the
government encountered significant elements of dissatisfaction in areas of electrification
(40% said “fairly badly” or “very badly”), water and sanitation (36%), and food distribution
(33%). Yet even after taking these negative marks into consideration, Ethiopians’ average
ratings of government performance in delivering public services join those of Batswana as
the highest in Afrobarometer surveys (not shown).
Table 14: Evaluations of government performance: Microeconomics | Ethiopia | 2013
How well or badly would you say the current government is handling the following matters, or haven’t you heard enough to say?
Very badly
Fairly badly
Fairly well
Very well
Don’t know
Combating HIV/AIDS 2% 4% 43% 42% 10%
Addressing educational needs 2% 5% 50% 39% 4%
Improving basic health services 2% 9% 52% 33% 4%
Maintaining roads and bridges 6% 16% 50% 22% 6%
Providing water and sanitation services 9% 27% 43% 17% 5%
Improving the living standards of the poor 3% 18% 57% 14% 8%
Providing a reliable supply of electricity 13% 27% 39% 12% 8%
Ensuring everyone has enough to eat 6% 27% 47% 8% 11%
Ethiopians’ understanding of democracy and political authority
Another possible explanation of the puzzle is that Ethiopians’ understanding of what
democracy is may differ significantly from that of other Africans. As argued earlier, this may
be due to their long history of autocratic rule with no previous democratic interlude, taken
together with ongoing political domination by a political party with roots in Leninist ideology.
What do Ethiopians mean when they say the country is democratic? We can gain some
purchase on this issue by examining responses to another standard Afrobarometer question
that asks people about their support for democracy. In this question, and throughout the

Afrobarometer Working Papers
Copyright © Afrobarometer 2016 20
questionnaire, the word “democracy” was offered in English and translated into an Ethiopian
language only if the respondent was unable to understand the English version. The results
strongly suggest that Ethiopians recognize the term and attach a very positive connotation
to the word, as three-quarters (76%) chose the statement “Democracy is preferable to any
other kind of government” as being closest to their own views (Table 15). Just 3% said that a
non-democratic government might be preferable in some situations. One in 10 said the issue
did not matter to them (9%), and another one in 10 said they did not know (12%).
Table 15: Support for democracy | Ethiopia | 2013
%
Democracy is preferable to any other kind of government. 76
In some circumstances, a non-democratic government can be preferable. 3
For someone like me, it doesn’t matter what kind of government we have. 9
Don't know 12 Respondents were asked: Which of these three statements comes closest to your own opinion?
But once we tap public commitment to democracy without using the “d-word,” the level of
support drops and the number of “don’t know” responses increases significantly. While just
3% said a “non-democratic” government could be preferable in certain situations,
significantly larger proportions explicitly approved of a series of clearly autocratic alternatives
to democracy (Table 16). Between one-sixth and one-fifth of all respondents said they would
approve of an executive dictatorship (16%), a one-party state (17%), and military rule (20%).
Viewed in another way, while three-quarters said “democracy is always preferable,” just six in
10 disapproved of allowing only one party to stand candidates (60%), abandoning elections
and Parliament to allow the executive to decide everything (59%), and abandoning civilian
rule to let the military take control (57%). Combining those who said they “don’t’ know” with
those who said they “neither approve nor disapprove,” approximately one-quarter of
respondents were unable to express an opinion about these fundamental issues.
Table 16: Rejection of authoritarian alternatives | Ethiopia | 2013
Approve/ Strongly approve
Neither Disapprove/
Strongly disapprove
Don’t know
Only one political party is allowed to stand for election and hold office.
17% 3% 60% 20%
Elections and Parliament are abolished so that the prime minister can decide everything.
16% 3% 59% 23%
The army comes in to govern the country. 20% 3% 57% 21% Respondents were asked: There are many ways to govern a country. Would you disapprove or
approve of the following alternatives?
Afrobarometer Round 5 asked a module of questions designed in concert with colleagues
from the Global Barometer Surveys consortium, comprising Latino Barometer, Asia Barometer,
and Eurasia Barometer. The aim was to encourage respondents to weigh differing
interpretations of democracy against each other. But we were also concerned that forced-
choice responses are often shaped by the precise wording of various responses, how
differing responses are framed, and the peculiar juxtaposition of different wordings and
framings in the same question. Our solution was to ask the same question four separate times,
with conceptually equivalent though differently worded responses to each question.
The basic question reads: “Many things may be desirable, but not all of them are essential
characteristics of democracy. If you have to choose only one of the things that I am going to

Afrobarometer Working Papers
Copyright © Afrobarometer 2016 21
read, which one would you choose as the most essential characteristic of democracy?” To
each item we provided four responses tapping (1) a socioeconomic interpretation that
emphasizes material equality, full employment, and provision of basic necessities or state
welfare; a (2) a governance-oriented interpretation that focuses on law and order,
transparency, and efficiency; (3) a freedom-oriented interpretation that emphasizes political
rights such as speech, association, and protest; and (4) a procedural interpretation that
features elections, political parties, legislatures, and courts. In this way, we expected that if,
say, a proceduralist was attracted by a strongly worded freedom-oriented response on one
item, he or she would tend to give a proceduralist response to the other three questions.
The responses to these questions reveal that while Ethiopians’ understandings of democracy
were diverse, they were most likely to say that democracy is defined as the delivery of
socioeconomic welfare, or efficient governance. We also observe that between one-tenth
and one-fifth of respondents were unable to answer each question (Table 17), and that 8%
were unable to answer any of the four questions.
Table 17: Understandings of democracy | Ethiopia | 2013
Question 1 %
Government narrows the gap between the rich and the poor. (ECON) 30
People choose government leaders in free and fair elections. (PROC) 26
People are free to express their political views openly. (FREE) 18
Government does not waste any public money. (GOV) 12
None of these 2
Don’t know 12
Question 2 %
Government ensures law and order. (GOV) 34
Government ensures job opportunities for all. (ECON) 31
Multiple parties compete fairly in elections. (PROC) 15
Media is free to criticize the things government does. (FREE) 8
None of these 1
Don’t know 12
Question 3 %
Government provides basic necessities for everyone. (ECON)) 26
Public services work well and do not break down. (GOV) 21
The legislatures closely monitor the actions of the prime minister. (PROC) 20
People are free to form organisations to influence government. (FREE) 15
Don’t know 20
Question 4 %
Politics is clean and free of corruption. (GOV) 28
People are free to take part in demonstrations and protests. (FREE) 24
People receive aid from government when they are in need. (ECON) 20
The court protects ordinary people if government mistreats them. (PROC) 13
None of these 1
Don’t know 14 Respondents were asked: Many things may be desirable, but not all of them are essential
characteristics of democracy. If you have to choose only one of the things that I am going to read,
which one would you choose as the most essential characteristic of democracy?

Afrobarometer Working Papers
Copyright © Afrobarometer 2016 22
From these responses, we created an index that measures how often across the four
questions a respondent selected a response from each thematic area (Table 18). Again, this
index demonstrates that socioeconomic outcomes (such as material equality) or good-
governance outcomes (such as transparency and efficiency) are much more likely to make
up Ethiopians’ conception of democracy than classic liberal issues of rights or procedures.
Across the four question items, half of the sample never chose a response related to freedom
and rights (52%) or procedures (48%) as part of the meaning of democracy.
Table 18: Understandings of democracy (by frequency of citation) | Ethiopia | 2013
0 items 1 item 2 items 3 items 4 items
Governance 36% 39% 20% 5% <1%
Socioeconomic 38% 33% 18% 8% 4%
Freedom 52% 34% 12% 2% <1%
Procedural 48% 35% 14% 3% <1%
None of these / Don’t know 76% 8% 6% 2% 8%
Since the governance and socioeconomic responses are primarily concerned with the
outcomes of economic and political policy performance, we created a combined scale of
instrumental understandings of democracy. We also combined freedom- and procedure-
oriented answers into a scale of intrinsic understandings of democracy. Compared to the
other surveyed countries, Ethiopians fall approximately in the middle of the 35-country
variation in terms of their likelihood of adopting an instrumental view of democracy. When it
comes to intrinsic understandings, however, Ethiopians are amongst the least likely citizens to
understand democracy in terms of political procedures, rights, or freedoms (see Figure 7
below). They are also some of the most likely respondents to give “don’t know” replies:
Across all four question items, an average of 15% said “don’t know.” Only Mozambicans
(19%) and Malagasy (24%) were more likely to give “don’t know” responses (not shown).
Ethiopians’ grasp of the meaning of democracy appears even more precarious when we
look to a different set of questions that tap agreement or disagreement with specific
procedural arrangements related to multiparty elections, the institutional balance of power,
and independent oversight of government. “Regular, open, and honest elections” were
widely supported (82%), and few were persuaded by the argument that “Since elections
sometimes produce bad results, we should adopt other methods for choosing this country’s
leaders” (9%). Just 9% had no opinion when the question was phrased in this way. They were
far less likely, however, to appreciate the role of intra-party difference and debate in the
electoral process. Almost one-third agreed with the old argument, frequently advanced by
would-be dictators, that “Political parties create division and confusion; it is therefore
unnecessary to have many political parties” (32%). Just half of respondents agreed that
“Many political parties are needed to make sure that Ethiopians have real choices in who
governs them.” Again, one in five either responded “don’t know” or agreed with neither
statement (19%) (Table 19).
This pattern recurs in responses to several other questions that tap, broadly, people’s
attitudes toward the separation of powers, oversight, and term limits. Six in 10 agreed that
the legislature should make laws, even when the executive disagrees (59%), while one in
seventh instead accepted that the executive should be able to make laws by decree (14%),
and one-quarter had no opinion (25%). Only 55% said the executive has to obey the law and
the courts, while 26% said the prime minister should not be so bound if he thinks the laws are
wrong. Again, 18% had no opinion. Just four in 10 respondents agreed that the Constitution
should limit the executive to serving two terms (40%), while a similar proportion preferred no
constitutional limit on how long the prime minister can serve (42%) (Table 20).

Afrobarometer Working Papers
Copyright © Afrobarometer 2016 23
Table 19: Attitudes toward elections and multipartyism | Ethiopia | 2013
Popular elections Agree/ Strongly agree
We should choose our leaders in this country through regular, open, and honest elections.
82%
Since elections sometimes produce bad results, we should adopt other methods for choosing this country’s leaders.
9%
Agree with neither <1%
Don’t know 9%
Multiparty elections Agree/Strongly agree
Many political parties are needed to make sure that Ethiopians have real choices in who governs them.
50%
Political parties create division and confusion; it is therefore unnecessary to have many political parties in Ethiopia.
32%
Agree with neither 1%
Don’t know 18%
Respondents were asked: Which of the following statements is closest to your view?
Table 20: Attitudes toward separation of powers | Ethiopia | 2013
Legislative independence Agree/
Strongly agree
Members of Parliament represent the people; therefore they should make laws for this country, even if the prime minister does not agree.
59%
Since the prime minister represents all of us, he should pass laws without worrying about what Parliament thinks.
14%
Agree with neither 1%
Don’t know 25%
Judicial independence Agree/
Strongly agree
The prime minister must always obey the laws and the courts, even if he thinks they are wrong.
55%
Since the prime minister was elected to lead the country, he should not be bound by laws or court decisions that he thinks are wrong.
26%
Agree with neither 1%
Don’t know 18%
Executive term limits Agree/
Strongly agree
The Constitution should limit the prime minister to serving a maximum of two terms in office.
40%
There should be no constitutional limit on how long the prime minister can serve. 42%
Agree with neither 1%
Don’t know 17%

Afrobarometer Working Papers
Copyright © Afrobarometer 2016 24
Six in 10 (60%) said the news media should “constantly investigate and report on government
mistakes,” but 16%said negative reporting “harms the country,” and 23% said they “don’t
know.” Just half agreed that the executive should be held to account by the legislature
(51%), while one-fifth agreed that forcing the executive to justify its actions is a waste of time
(22%), and one-quarter had no opinion (26%). And only one-third of Ethiopians said that
opposition parties should “regularly examine and criticize” government actions; most people
thought the opposition should rather cooperate with government for the greater good of
development (44%), and 18% had no opinion (Table 21).
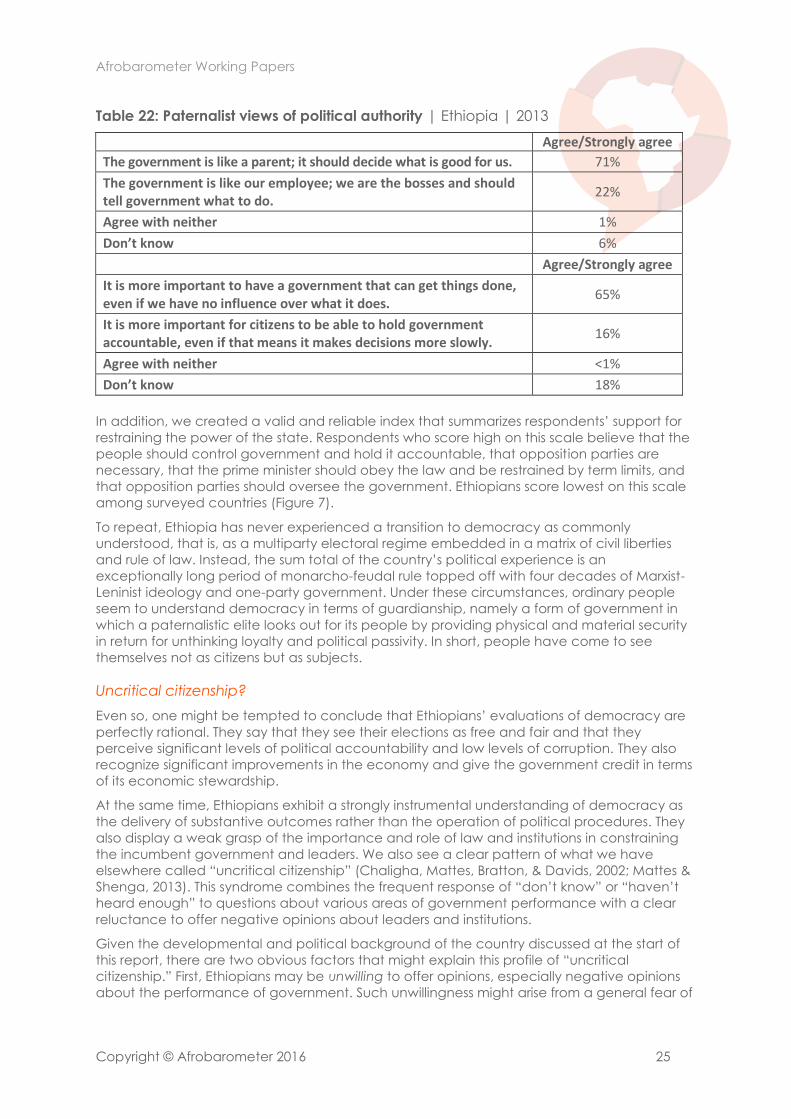
Ethiopians’ instrumental acceptance of a top-down “guardianship” version of democracy
can be seen in their broad views of political authority. Seven in 10 respondents (71%) agreed
or strongly agreed with the statement that “The government is like a parent; it should decide
what is good for us.” By contrast, just one in five (22%) agreed that “The government is like
our employee; we are the bosses and should tell government what to do.” Moreover, just 6%
of all respondents were unable to answer this question. In response to a separate question,
two-thirds (65%) said “It is more important to have a government that can get things done,
even if we have less influence over what it does,” while just one in six said “It is more
important for citizens to be able to hold government accountable, even if that means it
makes decisions more slowly.” In other words, Ethiopians hold an extremely paternalist view
of authority that cedes authority to incumbent political elites and that judges government in
instrumental rather than intrinsic terms (Table 22).
Importantly, Ethiopians are the most likely respondents in Africa to see the state as a parent
and to prioritize government effectiveness over public accountability (not shown).
Table 21: Attitudes toward oversight | Ethiopia | 2013
News media oversight Agree/
Strongly agree
The news media should constantly investigate and report on government mistakes and corruption.
60%
Too much reporting on negative events, like government mistakes and corruption, only harms the country.
16%
Agree with neither 1%
Don’t know 23%
Legislative oversight Agree/
Strongly agree
Parliament should ensure that the prime minister explains to it on a regular basis how his government spends taxpayers’ money.
51%
The prime minister should be able to devote his full attention to developing the country rather than wasting time justifying his actions.
22%
Agree with neither 1%
Don’t know 26%
Opposition oversight Agree/
Strongly agree
Opposition parties should regularly examine and criticize government policies and actions.
36%
Opposition parties should concentrate on cooperating with government and helping it develop the country.
44%
Agree with neither 1%
Don’t know 18%
Afrobarometer Working Papers
Copyright © Afrobarometer 2016 25
Table 22: Paternalist views of political authority | Ethiopia | 2013
Agree/Strongly agree
The government is like a parent; it should decide what is good for us. 71%
The government is like our employee; we are the bosses and should tell government what to do.
22%
Agree with neither 1%
Don’t know 6%
Agree/Strongly agree
It is more important to have a government that can get things done, even if we have no influence over what it does.
65%
It is more important for citizens to be able to hold government accountable, even if that means it makes decisions more slowly.
16%
Agree with neither <1%
Don’t know 18%
In addition, we created a valid and reliable index that summarizes respondents’ support for
restraining the power of the state. Respondents who score high on this scale believe that the
people should control government and hold it accountable, that opposition parties are
necessary, that the prime minister should obey the law and be restrained by term limits, and
that opposition parties should oversee the government. Ethiopians score lowest on this scale
among surveyed countries (Figure 7).
To repeat, Ethiopia has never experienced a transition to democracy as commonly
understood, that is, as a multiparty electoral regime embedded in a matrix of civil liberties
and rule of law. Instead, the sum total of the country’s political experience is an
exceptionally long period of monarcho-feudal rule topped off with four decades of Marxist-
Leninist ideology and one-party government. Under these circumstances, ordinary people
seem to understand democracy in terms of guardianship, namely a form of government in
which a paternalistic elite looks out for its people by providing physical and material security
in return for unthinking loyalty and political passivity. In short, people have come to see
themselves not as citizens but as subjects.
Uncritical citizenship?
Even so, one might be tempted to conclude that Ethiopians’ evaluations of democracy are
perfectly rational. They say that they see their elections as free and fair and that they
perceive significant levels of political accountability and low levels of corruption. They also
recognize significant improvements in the economy and give the government credit in terms
of its economic stewardship.
At the same time, Ethiopians exhibit a strongly instrumental understanding of democracy as
the delivery of substantive outcomes rather than the operation of political procedures. They
also display a weak grasp of the importance and role of law and institutions in constraining
the incumbent government and leaders. We also see a clear pattern of what we have
elsewhere called “uncritical citizenship” (Chaligha, Mattes, Bratton, & Davids, 2002; Mattes &
Shenga, 2013). This syndrome combines the frequent response of “don’t know” or “haven’t
heard enough” to questions about various areas of government performance with a clear
reluctance to offer negative opinions about leaders and institutions.
Given the developmental and political background of the country discussed at the start of
this report, there are two obvious factors that might explain this profile of “uncritical
citizenship.” First, Ethiopians may be unwilling to offer opinions, especially negative opinions
about the performance of government. Such unwillingness might arise from a general fear of

Afrobarometer Working Papers
Copyright © Afrobarometer 2016 26
0.42
0.56
0.58
0.61
0.61
0.62
0.69
0.71
0.74
0.75
0.77
0.79
0.80
0.80
0.81
0.82
0.82
0.83
0.84
0.88
0.89
0.91
0.93
0.94
0.96
0.96
0.96
0.97
1.01
1.01
1.05
1.05
1.05
1.08
1.19
0.0 0.2 0.4 0.6 0.8 1.0 1.2 1.4 1.6 1.8 2.0
Morocco
Swaziland
Mali
Niger
Tunisia
Egypt
Ethiopia
Burkina Faso
Algeria
Senegal
Madagascar
Sudan
Nigeria
Mozambique
Mauritius
Lesotho
South Africa
Kenya
Zimbabwe
Botswana
Namibia
Malawi
Guinea
Burundi
Liberia
Uganda
Togo
Sierra Leone
Cape Verde
Benin
Zambia
Cameroon
Ghana
Côte d'Ivoire
Tanzania
0.61
0.63
0.68
0.68
0.68
0.68
0.69
0.70
0.71
0.74
0.74
0.74
0.74
0.75
0.75
0.78
0.79
0.80
0.80
0.80
0.80
0.81
0.82
0.82
0.83
0.84
0.84
0.84
0.85
0.86
0.88
0.88
0.90
0.91
0.0 0.2 0.4 0.6 0.8 1.0
Ethiopia
Algeria
Sudan
Tunisia
Senegal
Mozambique
Swaziland
Morocco
Egypt
Sierra Leone
Guinea
Nigeria
Burkina Faso
Mali
Cape Verde
Togo
Niger
Cameroon
Benin
Botswana
Burundi
South Africa
Namibia
Zimbabwe
Kenya
Lesotho
Uganda
Mauritius
Zambia
Liberia
Malawi
Côte d'Ivoire
Tanzania
Ghana
Figure 7: (Mis)Understanding democracy | 35 countries | 2011/2013
Intrinsic views of democracy Support for constrained government

Afrobarometer Working Papers
Copyright © Afrobarometer 2016 27
speaking one’s mind about politics in public due to potential reprisals from police or
government. Or it might arise from a suspicion of the identity of the survey fieldworker.
Second, Ethiopians might be unable to offer opinions on specific areas of governance
because they lack the necessary cognitive skills and access to independent information (or
any information) about political and economic policy and performance. We explore these
two possible accounts in the next two sections.
Political fear
Political fear arises from the perception that it is not safe to express one’s political beliefs,
whether in public (for example at a village market), in discussion with acquaintances, or
even through the ballot box. As one approach to measuring political fear, a battery of
Afrobarometer questions asks respondents “how free” they are to carry out three basic rights
of citizenship. While the great majority of Ethiopians said they are free to do these things, one
in 10 said they are “not very free” or “not at all free.” The rights in question are “to choose
who to vote for without being pressured” (7% said “not very” or “not at all” free), “to say
what you think” (9%), and “to join any political organisation” (14%).
Similar proportions perceive political intimidation. One in 10 said that during election
campaigns, they fear becoming a victim of political intimidation or violence “somewhat”
(7%) or “a lot” (4%). One in six said it is “somewhat likely” (10%) or “very likely” (6%) that
“powerful people can find out how you voted, even though there is supposed to be a secret
ballot in this country.” And one in 10 said that party competition “always” (2%) or “often”
(6%) leads to political conflict (Table 23).
Survey responses reveal higher levels of fear, however, when we reframe questions to refer to
self-censorship. Almost half of all respondents said they “always” (33%) or “often” (15%)
“have to be careful of what they say about politics.”
Yet while there are detectable levels of fear in the country, Ethiopians do not stand out as
unusual. When we aggregate all the above responses into a scale of political fear, we find
that Ethiopians actually fall below the Afrobarometer average, meaning they express
significantly less fear than the mean Afrobarometer respondent (Figure 8). Even on the most
explicit individual question – the extent to which people can speak openly about politics –
Ethiopia lies at the middle of the Afrobarometer data set (not shown).
Table 23: Political fear | Ethiopia | 2013
Not at all free
Not very free
Somewhat free
Completely free
Don’t know
In this country, how free are you to say what you think?
4% 5% 28% 61% 3%
In this country, how free are you to join any political organisation you want?
6% 8% 26% 46% 14%
In this country, how free are you to choose who to vote for without feeling pressured?
3% 4% 21% 64% 7%
Always Often Rarely Never
Don’t know
In your opinion, how often, in this country, do people have to be careful of what they say about politics?
33% 15% 26% 14% 12%
In your opinion, how often, in this country, does competition between political parties lead to violent conflict?
2% 6% 39% 14% 39%

Afrobarometer Working Papers
Copyright © Afrobarometer 2016 28
Very likely
Somewhat likely
Not very likely
Not at all likely
Don’t know
How likely do you think it is that powerful people can find out how you voted, even though there is supposed to be a secret ballot in this country?
6% 10% 6% 64% 13%
A lot Somewhat A little bit Not at all
Don’t know
During election campaigns in this country, how much do you personally fear becoming a victim of political intimidation or violence?
4% 7% 11% 72% 6%
Figure 8: Index of political fear | 34 countries* | 2011/2013
* Figure excludes Swaziland because some component questions of the index were not asked there.
0.63
0.85
0.86
0.91
0.92
0.97
0.98
1.00
1.06
1.06
1.07
1.07
1.07
1.10
1.11
1.24
1.24
1.27
1.29
1.29
1.34
1.38
1.39
1.41
1.42
1.44
1.45
1.50
1.52
1.55
1.56
1.89
2.00
2.21
0.0 0.5 1.0 1.5 2.0 2.5
Botswana
Algeria
Malawi
Tanzania
Niger
Benin
Ghana
Namibia
Cape Verde
Ethiopia
Mauritius
Liberia
Tunisia
Lesotho
South Africa
Madagascar
Zambia
Sierra Leone
Burkina Faso
Senegal
Burundi
Uganda
Mali
Morocco
Cameroon
Kenya
Mozambique
Egypt
Togo
Guinea
Nigeria
Sudan
Côte d'Ivoire
Zimbabwe
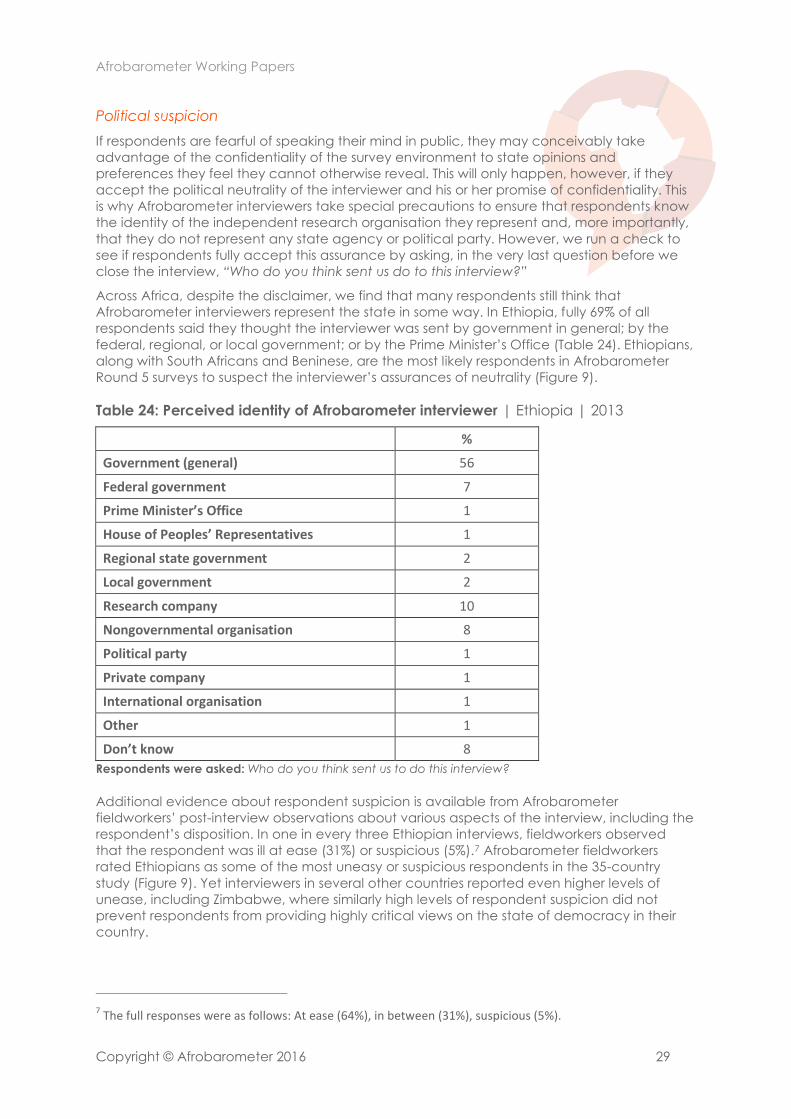
Afrobarometer Working Papers
Copyright © Afrobarometer 2016 29
Political suspicion
If respondents are fearful of speaking their mind in public, they may conceivably take
advantage of the confidentiality of the survey environment to state opinions and
preferences they feel they cannot otherwise reveal. This will only happen, however, if they
accept the political neutrality of the interviewer and his or her promise of confidentiality. This
is why Afrobarometer interviewers take special precautions to ensure that respondents know
the identity of the independent research organisation they represent and, more importantly,
that they do not represent any state agency or political party. However, we run a check to
see if respondents fully accept this assurance by asking, in the very last question before we
close the interview, “Who do you think sent us do to this interview?”
Across Africa, despite the disclaimer, we find that many respondents still think that
Afrobarometer interviewers represent the state in some way. In Ethiopia, fully 69% of all
respondents said they thought the interviewer was sent by government in general; by the
federal, regional, or local government; or by the Prime Minister’s Office (Table 24). Ethiopians,
along with South Africans and Beninese, are the most likely respondents in Afrobarometer
Round 5 surveys to suspect the interviewer’s assurances of neutrality (Figure 9).
Table 24: Perceived identity of Afrobarometer interviewer | Ethiopia | 2013
%
Government (general) 56
Federal government 7
Prime Minister’s Office 1
House of Peoples’ Representatives 1
Regional state government 2
Local government 2
Research company 10
Nongovernmental organisation 8
Political party 1
Private company 1
International organisation 1
Other 1
Don’t know 8
Respondents were asked: Who do you think sent us to do this interview?
Additional evidence about respondent suspicion is available from Afrobarometer
fieldworkers’ post-interview observations about various aspects of the interview, including the
respondent’s disposition. In one in every three Ethiopian interviews, fieldworkers observed
that the respondent was ill at ease (31%) or suspicious (5%).7 Afrobarometer fieldworkers
rated Ethiopians as some of the most uneasy or suspicious respondents in the 35-country
study (Figure 9). Yet interviewers in several other countries reported even higher levels of
unease, including Zimbabwe, where similarly high levels of respondent suspicion did not
prevent respondents from providing highly critical views on the state of democracy in their
country.
7 The full responses were as follows: At ease (64%), in between (31%), suspicious (5%).

Afrobarometer Working Papers
Copyright © Afrobarometer 2016 30
15%
21%
22%
22%
27%
33%
34%
35%
35%
39%
40%
41%
42%
43%
45%
46%
47%
48%
49%
50%
51%
52%
52%
53%
53%
55%
57%
58%
59%
60%
62%
63%
64%
65%
65%
0% 10% 20% 30% 40% 50% 60% 70% 80% 90% 100%
Algeria
Egypt
Morocco
Tunisia
Sudan
Mauritius
Cape Verde
Liberia
Zimbabwe
Burundi
Cameroon
Sierra Leone
Côte d'Ivoire
Burkina Faso
Mali
Namibia
Mozambique
Madagascar
Kenya
Niger
Botswana
Guinea
Lesotho
Uganda
Togo
Senegal
Ghana
Tanzania
Nigeria
Zambia
Swaziland
Malawi
Ethiopia
Benin
South Africa
8%
7%
10%
9%
8%
9%
11%
13%
14%
13%
13%
15%
17%
17%
18%
15%
19%
18%
17%
20%
22%
19%
26%
26%
26%
29%
32%
30%
26%
31%
27%
32%
34%
36%
38%
1%
2%
0%
1%
3%
3%
3%
2%
2%
3%
4%
4%
2%
3%
3%
6%
3%
4%
6%
5%
4%
8%
3%
3%
4%
2%
1%
3%
8%
5%
10%
11%
11%
16%
14%
0% 10% 20% 30% 40% 50% 60% 70% 80% 90% 100%
Nigeria
Benin
Liberia
Senegal
Botswana
Niger
Cape Verde
Tanzania
Ghana
Malawi
Guinea
Mali
Burundi
Kenya
Côte d'Ivoire
Tunisia
Uganda
Zambia
Burkina Faso
Togo
Lesotho
Mozambiq…
South Africa
Sierra Leone
Namibia
Madagas…
Mauritius
Swaziland
Morocco
Ethiopia
Cameroon
Zimbabwe
Sudan
Algeria
Egypt
In between "at
ease" and
"suspicious"
Suspicious
Figure 9: Political suspicion | 35 countries | 2011/2013
Respondent thinks interviewer is from state Interviewer says respondent not at ease/suspicious

Afrobarometer Working Papers
Copyright © Afrobarometer 2016 31
On a final note, it might seem obvious that respondents who think the interviewer is from a
state entity are the ones who interviewers think are ill at ease or suspicious. In fact, there is no
statistically significant relationship between the two. Levels of observed respondent unease
are equally high among those who think the interviewer is from the state and those who
accept the interviewer’s neutrality. Moreover, while it might seem logical to expect that
respondents with doubts about the bona fides of the survey interviewer would censor their
reports of political fear, the actual situation is far more complex. Those respondents who
thought the interviewer was really from a state entity were indeed less likely to say they
feared speaking their minds about politics, but the relationship was weak.8 Yet respondents
who were ill at ease were slightly more likely to report political fear than those who were
observed to be at ease.9 For these reasons, the analyses below will examine the
independent effects of respondent beliefs about the interviewer, interviewer observations of
the respondent disposition, and respondent reports of political fear.
Political ignorance
In this section, we explore the possibility that ignorance of basic facts about leaders and
policies may preclude Ethiopians from engaging the political system as active democratic
citizens. They may lack sufficient information to understand existing flaws or deficiencies of
the electoral process, recognize the centralization of political power, or be aware of the
denial of human rights. At the most basic level, people with no other competing information
may simply answer the survey question about democracy by referring to the official name of
the country: the Federal Democratic Republic of Ethiopia.
Let us begin with education. Adult Ethiopians have some of the lowest, though not the
lowest, levels of formal education across all Afrobarometer countries (Figure 10). Almost half
of all people aged 18 and over have no formal schooling (Table 25). In total, seven in 10
adults never completed primary school. Education varies sharply along the country’s urban-
rural divide: 81% of rural Ethiopians have not completed primary school, compared to 35% of
city dwellers.
Table 25: Formal education | Ethiopia | 2013
%
No formal schooling 47
Some primary schooling 24
Primary schooling completed 8
Some secondary schooling 7
Secondary school completed 7
Post-secondary qualifications, not university 5
Some university 1
University completed 1
Post-graduate <1
Don’t know <1 Respondents were asked: What is the highest level of education you have completed?
8 Kendall’s Tau c = -.095, p=.001.
9 Kendall’s Tau c = .056, p =.001.

Afrobarometer Working Papers
Copyright © Afrobarometer 2016 32
Where Ethiopia differs most, and most consistently, from the other surveyed countries is in
access to and use of news media. Large numbers of Ethiopians simply do not possess the
basic necessities for consuming news. As of 2013, just 47% owned a radio (the lowest level in
Afrobarometer), and 15% owned a television (lower than any other surveyed country save
Malawi and Burundi). Both numbers vary widely depending on where people live. While two-
thirds of city dwellers owned a radio (66%) and/or television (62%), the proportions in rural
areas dropped to 42% for radio and just 3% for television.
More than eight in 10 Ethiopians never get news from a newspaper (85%) or the Internet
(87%), and two-thirds never get news from television (65%) (Table 26). While access to and
use of these news media are uneven across Africa, radio news normally provides almost
universal access. Not so in Ethiopia, where four in 10 said they never get news from radio
(39%). Again, the rural-urban divides are stark: While 56% of urban respondents reported
watching television news broadcasts on a daily basis, 79% of those in the countryside never
watch television news. Only Egypt has lower levels of radio news listenership, and only
Burundi and Niger have lower levels of newspaper readership. When we construct an
average index combining listenership, viewership, and readership, Ethiopia places dead last
(Figure 10).
Table 26: News media use | Ethiopia | 2013
Never Less than once a month
A few times a month
A few times a week
Every day
Don’t know
Radio news 39% 6% 8% 22% 24% 1%
Television news 65% 5% 6% 8% 14% 2%
Newspaper 85% 4% 4% 4% 1% 3%
Internet news 87% 11% 1% 2% 2% 7% Respondents were asked: How often do you get news from the following sources?
Walter Lippmann (1922) once noted that engaged citizenship requires that people possess a
“picture in the head” of who their leaders are, whether they are trustworthy, and what goes
on in the capital city. Absence of vicarious experiences of government leaders through
video on television, pictures in newspapers, or speeches and interviews on radio could
present Ethiopians with a major obstacle to political citizenship. Yet news media use is not a
necessary condition for people to form an opinion about government policy and its impacts.
Samuel Popkin (1994) has observed that people can use “low information reasoning” to
draw inferences from everyday observations of consumer goods prices, the number of
unemployed people on street corners, and housing and infrastructural construction. But “low
information reasoning” is facilitated by the extent to which people talk to one another about
politics and public affairs and take an active interest in them. Almost half of all respondents
in Ethiopia said they “never” discuss politics (47%) (Table 27). This is one of the highest levels in
Afrobarometer (surpassed only by Liberia, Burundi, and Madagascar) (Figure 11).
Table 27: Political discussion | Ethiopia | 2013
When you get together with your friends or family, would you say you discuss political matters. …?
%
Frequently 11
Occasionally 39
Never 47
Don’t know 3

Afrobarometer Working Papers
Copyright © Afrobarometer 2016 33
0% 10% 20% 30% 40% 50% 60% 70% 80% 90% 100%
Madagascar
Niger
Burkina Faso
Burundi
Benin
Malawi
Tanzania
Mali
Ethiopia
Senegal
Guinea
Togo
Côte d'Ivoire
Lesotho
Algeria
Mozambique
Cape Verde
Uganda
Ghana
Zambia
Tunisia
Mauritius
Sierra Leone
Liberia
Namibia
Cameroon
Morocco
South Africa
Swaziland
Kenya
Zimbabwe
Botswana
Sudan
Egypt
Nigeria
Secondary school completed
Post-secondary qualifications, not
university
Some university
University completed
Post-graduate
0.81
0.84
0.95
0.95
0.99
1.11
1.13
1.16
1.19
1.19
1.27
1.28
1.29
1.32
1.35
1.38
1.47
1.51
1.61
1.68
1.70
1.76
1.79
1.80
1.81
1.85
1.91
1.91
1.98
1.99
2.05
2.15
2.21
2.40
2.88
0.00 0.50 1.00 1.50 2.00 2.50 3.00 3.50 4.00
Ethiopia
Burundi
Malawi
Niger
Madagascar
Sierra Leone
Lesotho
Burkina Faso
Guinea
Liberia
Mozambique
Benin
Mali
Togo
Tanzania
Uganda
Zimbabwe
Zambia
Côte d'Ivoire
Egypt
Ghana
Kenya
Nigeria
Swaziland
Namibia
Cameroon
Senegal
Botswana
Morocco
Tunisia
Cape Verde
Sudan
South Africa
Algeria
Mauritius
Figure 10: Indicators of information | 35 countries | 2011/2013
Formal education (completed high school) News media use

Afrobarometer Working Papers
Copyright © Afrobarometer 2016 34
60%
55%
51%
47%
47%
43%
40%
39%
39%
38%
35%
35%
35%
34%
34%
34%
33%
32%
31%
31%
29%
28%
27%
27%
26%
26%
26%
26%
26%
22%
21%
21%
20%
18%
17%
0% 10% 20% 30% 40% 50% 60% 70% 80% 90% 100%
Madagascar
Burundi
Liberia
Ethiopia
Togo
Morocco
Mali
Ghana
Burkina Faso
Côte d'Ivoire
Mauritius
Swaziland
Namibia
Guinea
Malawi
Botswana
Cape Verde
Cameroon
Zambia
Kenya
South Africa
Sierra Leone
Benin
Lesotho
Uganda
Algeria
Sudan
Mozambique
Zimbabwe
Tanzania
Tunisia
Nigeria
Egypt
Senegal
Niger
9%
12%
12%
14%
16%
18%
21%
23%
23%
24%
24%
26%
26%
26%
27%
28%
28%
28%
28%
29%
29%
30%
30%
32%
32%
33%
35%
36%
37%
40%
41%
42%
44%
52%
54%
0% 10% 20% 30% 40% 50% 60% 70% 80% 90% 100%
Algeria
Côte d'Ivoire
Morocco
Madagascar
Mauritius
Burkina Faso
Swaziland
South Africa
Sudan
Benin
Cameroon
Zimbabwe
Togo
Uganda
Namibia
Liberia
Cape Verde
Kenya
Ghana
Botswana
Nigeria
Tunisia
Sierra Leone
Guinea
Mozambique
Egypt
Niger
Burundi
Zambia
Mali
Tanzania
Senegal
Malawi
Ethiopia
Lesotho
Figure 11: Indicators of cognitive engagement | 35 countries | 2011/2013
Never discuss politics Very interested in politics

Afrobarometer Working Papers
Copyright © Afrobarometer 2016 35
Is this low level of political discussion due to the fact that Ethiopians are apolitical and
uninterested in politics? On the face of it, the answer is “no.” While 47% “never” talk about
politics, 84% claimed they are “very” or “somewhat” interested in politics (Table 28). In an
astonishing volte face to political discussion – where Ethiopians rank among the lowest in
Africa – they display the highest levels of interest in politics in Africa (along with citizens in
Lesotho, which was embroiled in major electoral controversies) (Figure 11).
Table 28: Interest in politics | Ethiopia | 2013
How interested would you say you are in public affairs? %
Very interested 52
Somewhat interested 32
Not very interested 7
Not at all interested 7
Don’t know 2
A lack of critical skills gained through education combined with low access to information
about everyday political events may constitute an important part of the explanation for the
high levels of “don’t know” responses to questions reviewed above. To better analyse this,
we create two indices that calculate the probability that a respondent says “don’t know” in
response to (1) a series of 21 question items about political performance and (2) a series of
12 questions about political and democratic values. We find an average “don’t know” rate
of 36% for the performance questions and an average of 19% for the value questions. Again,
these are the highest levels found anywhere in Afrobarometer, by a large margin (Figure 12).
The differences in “don’t know” rates between performance and value items are consistent
with previous analyses of Afrobarometer results in countries that exhibited strong tendencies
of “uncritical citizenship,” such as Tanzania (Chaligha, Mattes, Bratton, & Davids, 2002) and
Mozambique (Mattes & Shenga, 2013). “Don’t know” responses are prevalent on questions
that require some form of factual knowledge, but substantially lower for value preferences.
On the other hand, we find important differences by type of evaluation question. Even with
very low levels of schooling and news media use, Ethiopians offer very few “don’t know”
responses on questions that allow them to use “low information reasoning” and draw
inferences from events and trends in their immediate environment, e.g. about how well the
government is handling basic services and living standards (less than 10% “don’t know”).
They even register moderately low levels of “don’t know” when they draw larger inferences
to things such as government economic management (10%-20%). At the other end of the
spectrum, however, when they are asked to comment on national leaders and national
political institutions, or the relationships between those institutions – issues that require at least
some basic factual knowledge – “don’t know” levels rise steeply (more than 30%).
And with regard to democratic values, we see that most Ethiopians are able to offer
substantive responses to questions about democracy that explicitly use the “d-word.”
However, they are far more likely, and consistently most likely of all Afrobarometer
respondents, to give “don’t know” responses to a range of other questions about
democracy that do not use the word “democracy”. So, for example, without the word
“democracy” to guide them, one in five respondents don’t know where they stand on the
issues of one-party rule and big-man rule. They are also most likely of all Afrobarometer
countries – and sometimes by wide margins – to give “don’t know” responses to questions
about multipartyism, parliamentary control of law-making, whether the prime minister should
obey the law, and whether the prime minister should be monitored by Parliament, opposition
parties, and the news media.

Afrobarometer Working Papers
Copyright © Afrobarometer 2016 36
0.03 0.03 0.03 0.04 0.04 0.05 0.05 0.06 0.06 0.06 0.06 0.07 0.07 0.07 0.07 0.08 0.08 0.08
0.10 0.10 0.11 0.12 0.12 0.13 0.14 0.15 0.15 0.15
0.17 0.17
0.20 0.21 0.23
0.25 0.36
0.0 0.1 0.2 0.3 0.4 0.5 0.6 0.7 0.8 0.9 1.0
TanzaniaGhanaNigeria
BeninSierra LeoneSouth Africa
UgandaMali
NamibiaZimbabwe
ZambiaBurundiKenyaLiberia
MauritiusCôte d'Ivoire
EgyptGuineaMalawi
NigerBotswanaSwaziland
AlgeriaSenegal
MoroccoBurkina Faso
TogoCameroon
SudanMozambiqueCape Verde
TunisiaMadagascar
LesothoEthiopia
0.00 0.01 0.01 0.01 0.01 0.01 0.01 0.01 0.01 0.01 0.01 0.01 0.02 0.02 0.02 0.02 0.02 0.02 0.02 0.03 0.03 0.03 0.04 0.04 0.05 0.05 0.06 0.07 0.08 0.08 0.10
0.14 0.14 0.14
0.19
0.0 0.1 0.2 0.3 0.4 0.5 0.6 0.7 0.8 0.9 1.0
BeninZimbabwe
MalawiZambiaBurundi
Sierra LeoneUgandaNamibiaTanzania
MaliNigeriaGhana
Côte d'IvoireSouth Africa
BotswanaLiberia
SenegalMauritius
GuineaKenya
SwazilandNiger
Cape VerdeLesotho
TunisiaTogo
Burkina FasoSudanEgypt
CameroonAlgeria
MadagascarMorocco
MozambiqueEthiopia
Figure 12: Inability to offer opinions | 35 countries | 2011/2013
Political performance questions Value questions

Afrobarometer Working Papers
Copyright © Afrobarometer 2016 37
Do your own analysis of Afrobarometer data – on any question, for any country and survey round. It’s
easy and free at www.afrobarometer.org/online-data-analysis.
The effects of fear, suspicion, and ignorance
To what extent do political fear, suspicion of the interviewer, or ignorance shape the levels of
uncritical citizenship that were expressed during the Ethiopia Afrobarometer survey? We
address this question with a series of multiple regression analyses using a range of evaluations
and preferences as dependent variables. In the first instance, we test the effect of
respondent perceptions of political fear, the belief that the interviewer is from the state, and
interviewer observations of the respondent’s disposition. We also construct two interaction
terms that assess the impact of being both fearful and suspicious. In the second instance, we
test the effect of a range of indicators of information and cognitive skills (including level of
education, news media use, frequency of political discussion, interest in politics, internal
efficacy (the perception that politics are too complicated to understand), and urban-rural
residence) on each of the selected dependent variables (tables 29-32).
On the face of it, we might expect that respondents who say it is not safe to speak one’s
mind, who doubt ballot secrecy, or who suspect that the survey fieldworker is a state agent
would be more likely to censor their true views and provide more optimistic assessments of
the state of democracy.
Yet in at least one earlier analysis of survey responses in a similarly politically restrictive
situation, analysts found that fear did not have the anticipated effects. In their analysis of the
Afrobarometer 2004 survey in Zimbabwe, which found surprisingly positive evaluations of the
performance of President Robert Mugabe, they concluded that “remarkably, it pulls in a
direction opposite to what we would have predicted. People who feel fearful are twice as
likely to give a negative rating to the president. In other words, despite their fear, people are
willing to take the risk of speaking truth
to power” (Chikwanha, Sithole, &
Bratton, 2004, p. 24). At the same time,
Zimbabweans who suspected that the
interviewer was from the state were
more than twice as likely to say they
approved of the performance of
Mugabe.
We find similar dynamics in Ethiopia. To
recall, our index of political fear is a
composite measure that sums
respondents’ views of their ability to speak their minds, join associations, avoid partisan
violence and intimidation, and vote without pressure and in secret. We find that Ethiopians
who score highly on this index – i.e. who are more fearful – are more likely to say they are
dissatisfied with government economic performance (Table 29), disapprove of their leaders,
see them as corrupt, distrust institutions, and call the last election unfree (Table 30).
But in contrast to the findings in Zimbabwe, we find little or no evidence that suspicious
respondents were more likely to give positive replies. Rather, this happens only when
suspicion combines with fear. Fearful respondents who suspected that the interviewer was
from the state were more likely to say Ethiopia was headed in the right direction, express
satisfaction with the economy, and give government strong marks in terms of economic
stewardship (Table 29). And fearful respondents who were ill at ease or showed suspicion
during the interview were also significantly less likely to express a range of negative
evaluations of leaders, institutions, or elections (Table 30).

Afrobarometer Working Papers
Copyright © Afrobarometer 2016 38
Table 29: Correlations of indicators of fear/suspicion and ratings of economy
| Ethiopia | 2013
Country
headed in right
direction
Index of evaluations of national
econ trends
Index of govt
handling of macroecon
Index of govt
handling of public
services
Constant 1.97 3.62 2.67 2.49
Index of political fear -.338*** -.243*** -.283*** -.195***
Respondent thinks interviewer from state
NS NS NS NS
Respondent uneasy NS NS NS NS
Interviewer from state x fear .139*** .101* .119** NS
Unease x fear .121** NS NS NS
Adjusted R2 .066 .037 .060 .043
N 2,351 2,346 2,346 2,339 Cell entries are standardized beta regression coefficients. *** p =<.00; ** p=<.01; * p =<.05
Table 30: Correlations of indicators of fear/suspicion and ratings of leaders and
institutions | Ethiopia | 2013
Disapproveof elected
leaders
Institutions are corrupt
Index of govt
handling of crime/
corruption
Distrust institutions
Election unfree/ unfair
Constant 0.12 0.09 3.02 0.07 -0.05
Index of political fear .200*** .173*** -.197*** .280*** .299***
Respondent thinks interviewer from state
NS NS NS NS NS
Respondent uneasy NS NS NS NS NS
Interviewer from state x fear
-.094* NS NS NS NS
Unease x fear -.112** -.131** NS -.106* -.162***
Adjusted R2 .030 .037 .044 .061 .063
N 2,348 2,336 2,346 2,344 2,349 Cell entries are standardized beta regression coefficients. *** p =<.00; ** p=<.01; * p =<.05
While levels of information or cognitive skills have little impact on respondents’ evaluations of
the economy (Table 31), they have important effects on ratings of leaders and institutions
(Table 32). Educated respondents were consistently more likely to offer negative opinions, as
were those who frequently engage in political discussion or use news media.

Afrobarometer Working Papers
Copyright © Afrobarometer 2016 39
Table 31: Correlations of indicators of information and ratings of economy | Ethiopia
| 2013
Country
headed in right
direction
Index of evaluations of national
econ trends
Index of govt
handling of macroecon
Index of govt
handling of public
services
Constant 1.51 2.56 1.96 2.25
Education NS NS NS NS
Index of news media use NS .055* .060* .111***
Political discussion NS .045* NS .051**
Political interest .067** .094*** .095*** .083***
Internal efficacy NS NS NS NS
Rural .074** .153*** .104*** -.067**
Adjusted R2 .007 .030 .024 .034
N 2,378 2,373 2,373 2,368 Cell entries are standardized beta regression coefficients. *** p =<.00; ** p=<.01; * p =.05
Table 32: Correlations of indicators of information and ratings of leaders and
institutions | Ethiopia | 2013
Disapprove of elected
leaders
Institutions are corrupt
Index of govt handling of
crime/corruption
Distrust institutions
Election unfree/unfair
Constant 0.11 0.10 2.61 0.14 0.04
Education .153*** .150*** NS .164*** .112***
Index of news media use
.087*** NS .075** NS NS
Political discussion NS .092*** NS .098*** .042*
Political interest NS NS .077*** NS NS
Internal efficacy -.049* NS NS -.060** NS
Rural NS -.047* NS -.089*** NS
Adjusted R2 .059 .052 .007 .081 .015
N 2,374 2,361 2,373 2,369 2,376 Cell entries are standardized beta regression coefficients. *** p =<.00; ** p=<.01; * p =.05
We then repeat the same exercise, but substitute the indices of “don’t know” responses
reported earlier as the dependent variable. Here we find different dynamics. First, in sharp
contrast to the previous discussion, political fear makes respondents less likely to offer
evaluations of various areas of political performance, or to express values about democracy
and governance. Second, respondents who were uneasy during the interview were also
more likely to avoid offering any opinion. Similarly, those who both thought the fieldworker
worked for the government and feared political intimidation were less likely to express their
political values (Table 33).
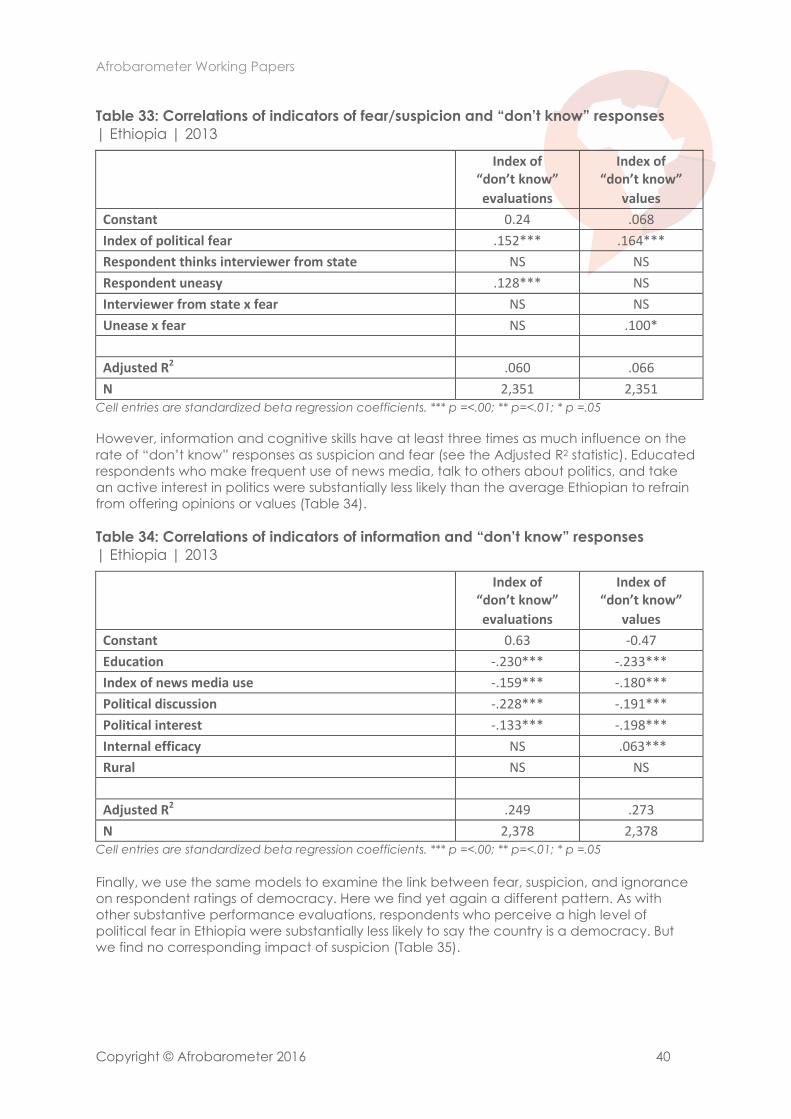
Afrobarometer Working Papers
Copyright © Afrobarometer 2016 40
Table 33: Correlations of indicators of fear/suspicion and “don’t know” responses
| Ethiopia | 2013
Index of “don’t know”
evaluations
Index of “don’t know”
values
Constant 0.24 .068
Index of political fear .152*** .164***
Respondent thinks interviewer from state NS NS
Respondent uneasy .128*** NS
Interviewer from state x fear NS NS
Unease x fear NS .100*
Adjusted R2 .060 .066
N 2,351 2,351 Cell entries are standardized beta regression coefficients. *** p =<.00; ** p=<.01; * p =.05
However, information and cognitive skills have at least three times as much influence on the
rate of “don’t know” responses as suspicion and fear (see the Adjusted R2 statistic). Educated
respondents who make frequent use of news media, talk to others about politics, and take
an active interest in politics were substantially less likely than the average Ethiopian to refrain
from offering opinions or values (Table 34).
Table 34: Correlations of indicators of information and “don’t know” responses
| Ethiopia | 2013
Index of “don’t know”
evaluations
Index of “don’t know”
values
Constant 0.63 -0.47
Education -.230*** -.233***
Index of news media use -.159*** -.180***
Political discussion -.228*** -.191***
Political interest -.133*** -.198***
Internal efficacy NS .063***
Rural NS NS
Adjusted R2 .249 .273
N 2,378 2,378 Cell entries are standardized beta regression coefficients. *** p =<.00; ** p=<.01; * p =.05
Finally, we use the same models to examine the link between fear, suspicion, and ignorance
on respondent ratings of democracy. Here we find yet again a different pattern. As with
other substantive performance evaluations, respondents who perceive a high level of
political fear in Ethiopia were substantially less likely to say the country is a democracy. But
we find no corresponding impact of suspicion (Table 35).

Afrobarometer Working Papers
Copyright © Afrobarometer 2016 41
Table 35: Correlations of indicators of fear/suspicion and supply of democracy
| Ethiopia | 2013
Perceived extent of
democracy
(Ethiopia)
Perceived extent of democracy
(rest of Afrobarometer)
Constant 3.62 2.869
Index of political fear -.369*** -.302***
Respondent thinks interviewer from state NS .048***
Respondent uneasy NS -.039***
Interviewer from state x fear NS .026**
Unease x fear NS NS
Adjusted R2 .119 .093
N 2,349 50,127 Cell entries are standardized beta regression coefficients. *** p =<.00; ** p=<.01; * p =<.05
Levels of information also play a direct role in ratings of democracy, though they make a
smaller impact than does fear. Educated respondents and frequent consumers of news were
less likely to say the country is democratic. However, the frequency of political discussion
plays no role, and those Ethiopians who said they are interested in politics (an area in which
Ethiopia leads all other Afrobarometer countries) were actually more likely to rate the regime
positively. And those who were unable to offer opinions on political values were also less
likely to say the country is democratic (Table 36).
Table 36: Correlations of indicators of information and supply of democracy
| Ethiopia | 2013
Perceived extent of
democracy
(Ethiopia)
Perceived extent of democracy
(rest of Afrobarometer)
Constant 2.86 2.35
Education -.098*** -.119***
Index of news media use -.070** NS
Political discussion NS -.039***
Political interest .113*** .070***
Internal efficacy .058** .023***
“Don’t know” evaluations NS -.029***
“Don’t know” values -.087** -.019***
Rural .096*** .013**
Adjusted R2 .056 .01
N 2,376 51,512 Cell entries are standardized beta regression coefficients. *** p =<.00; ** p=<.01; * p =.05
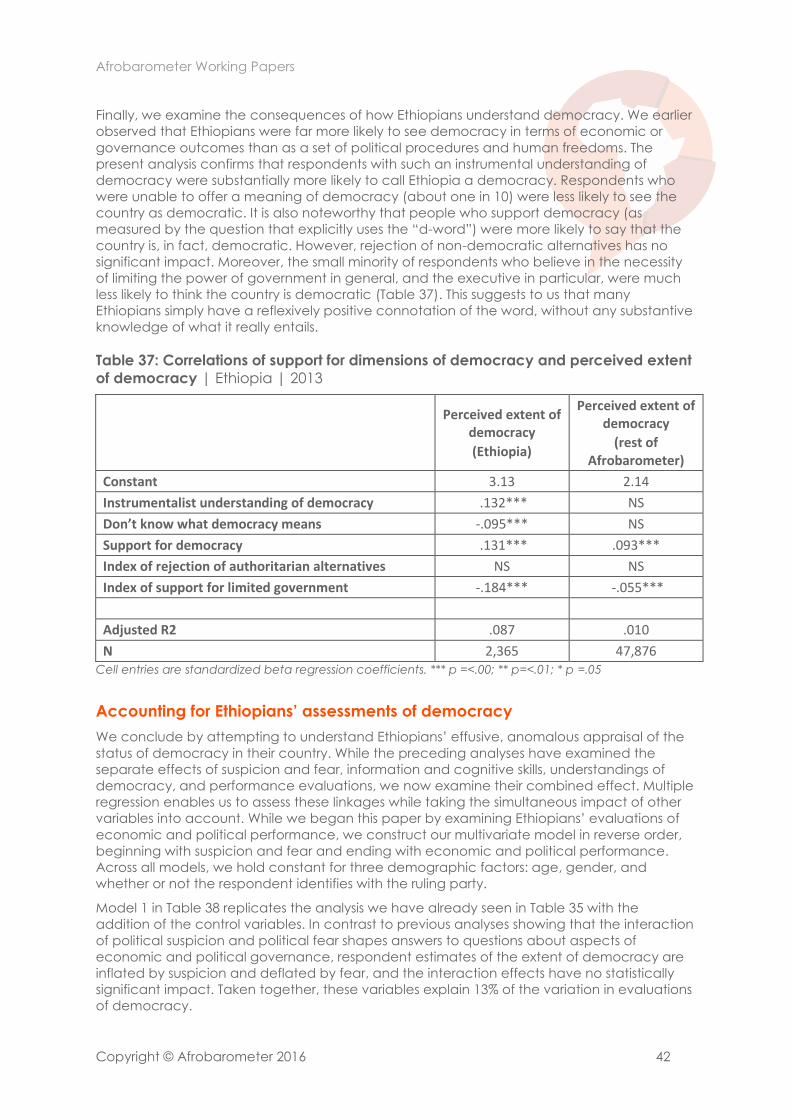
Afrobarometer Working Papers
Copyright © Afrobarometer 2016 42
Finally, we examine the consequences of how Ethiopians understand democracy. We earlier
observed that Ethiopians were far more likely to see democracy in terms of economic or
governance outcomes than as a set of political procedures and human freedoms. The
present analysis confirms that respondents with such an instrumental understanding of
democracy were substantially more likely to call Ethiopia a democracy. Respondents who
were unable to offer a meaning of democracy (about one in 10) were less likely to see the
country as democratic. It is also noteworthy that people who support democracy (as
measured by the question that explicitly uses the “d-word”) were more likely to say that the
country is, in fact, democratic. However, rejection of non-democratic alternatives has no
significant impact. Moreover, the small minority of respondents who believe in the necessity
of limiting the power of government in general, and the executive in particular, were much
less likely to think the country is democratic (Table 37). This suggests to us that many
Ethiopians simply have a reflexively positive connotation of the word, without any substantive
knowledge of what it really entails.
Table 37: Correlations of support for dimensions of democracy and perceived extent
of democracy | Ethiopia | 2013
Perceived extent of
democracy
(Ethiopia)
Perceived extent of democracy
(rest of Afrobarometer)
Constant 3.13 2.14
Instrumentalist understanding of democracy .132*** NS
Don’t know what democracy means -.095*** NS
Support for democracy .131*** .093***
Index of rejection of authoritarian alternatives NS NS
Index of support for limited government -.184*** -.055***
Adjusted R2 .087 .010
N 2,365 47,876 Cell entries are standardized beta regression coefficients. *** p =<.00; ** p=<.01; * p =.05
Accounting for Ethiopians’ assessments of democracy
We conclude by attempting to understand Ethiopians’ effusive, anomalous appraisal of the
status of democracy in their country. While the preceding analyses have examined the
separate effects of suspicion and fear, information and cognitive skills, understandings of
democracy, and performance evaluations, we now examine their combined effect. Multiple
regression enables us to assess these linkages while taking the simultaneous impact of other
variables into account. While we began this paper by examining Ethiopians’ evaluations of
economic and political performance, we construct our multivariate model in reverse order,
beginning with suspicion and fear and ending with economic and political performance.
Across all models, we hold constant for three demographic factors: age, gender, and
whether or not the respondent identifies with the ruling party.
Model 1 in Table 38 replicates the analysis we have already seen in Table 35 with the
addition of the control variables. In contrast to previous analyses showing that the interaction
of political suspicion and political fear shapes answers to questions about aspects of
economic and political governance, respondent estimates of the extent of democracy are
inflated by suspicion and deflated by fear, and the interaction effects have no statistically
significant impact. Taken together, these variables explain 13% of the variation in evaluations
of democracy.

Afrobarometer Working Papers
Copyright © Afrobarometer 2016 43
Table 38: Regression estimates of predictors of perceived extent of democracy | Ethiopia | 2013
Model 1 Model 2 Model 3 Model 4 Model 5
Constant 3.13 3.28 3.04 1.30 0.95
Respondent thinks interviewer is from state .042* NS NS NS NS
Respondent not at ease .059*** .044* .048** .047** .038*
Index of political fear -.325*** -.327*** -.294*** -.146*** -.132***
Education -.094*** -.075** NS NS
News media use -.075** -.057* -.071** -.080***
Political interest .110*** .094*** .051** .046*
Able to understand politics .041* .047* NS NS
Instrumentalist understanding of democracy .110*** -.097*** .098***
Support democracy .124*** .094*** .088***
Support for limited government -.114*** -.097*** -.089***
Election free and fair .235*** .223***
Elected representatives are responsive .083*** .084***
Index of supply of horizontal accountability .084*** .081***
Index of extortion victimization -.071*** -.068***
Index of government handling of crime and corruption .085*** .057**
Incumbent job approval .110*** .086***
Country headed in right direction .084***
Index of national economic conditions .045*
Age NS -.050* -.041* .110*** -.050**
Rural .130*** .051* .051* .070*** .062**
Female .044* .041* .047* -.060*** .046*
Identify with EPRDF .072*** .072*** .062*** NS NS
Adjusted R2 .145 .164 .202 .305 .319
N 2,314 2,307 2,290 2,268 2,255 Cell entries are standardized beta regression coefficients. *** p =<.00; ** p=<.01; * p =.05

Afrobarometer Working Papers
Copyright © Afrobarometer 2016 44
The addition of variables related to information and cognitive skills increases the explanatory
power of the model to 16% (Model 2). But their addition also removes the impact of
respondent doubts about the identity of the interviewer. Formal education and news media
use produce more sceptical evaluations of the state of democracy, but interest in politics
leads to more favourable assessments.
The strength of the explanatory model increases to 21% with the addition of Ethiopians’
understandings of democracy (Model 3). As we saw earlier, those who see democracy as a
set of economic and governance outcomes and who say they prefer democracy are more
likely to say they are living in a democracy. However, rejection of non-democratic
alternatives has no effect. And those who support various limitations on government and
executive power are substantially less likely to say Ethiopia is democratic.
Political performance evaluations make a substantial addition to the model, increasing
explained variance to 31% (Model 4). The perception that the 2010 election was free and
fair, that government is held accountable, that elected representatives are responsive, and
that incumbent leaders are doing their jobs well (both in general and in controlling crime
and corruption specifically) all lead to positive assessments of democracy. Personal
experience with official extortion, on the other hand, leads to more negative assessments.
Model 5 attempts to add a wide range of economic performance evaluations, but most turn
out to be statistically insignificant. Positive assessments of economic trends and the belief
that the country is headed in the right direction are important, but they add only
incrementally to the contribution of political performance evaluations.
Conclusion
The results of five rounds of Afrobarometer surveys in up to 35 African countries demonstrate
clearly that ordinary African citizens tend to reach the same conclusions about the extent of
democracy in their own country as international expert rating systems devised by political
scientists. Yet the 2013 Afrobarometer survey in Ethiopia produces a clear anomaly. While no
expert assessment comes close to calling Ethiopia a democracy, 81% of Ethiopian
respondents told Afrobarometer interviewers that the country is either a complete
democracy or one with only minor problems. This paper has sought to solve this puzzle.
The best explanation of why Ethiopians think their country is a democracy is their very positive
assessment of political and economic developments. Of those who offered an opinion, the
overwhelming majority said that the most recent election was free and fair, that the
executive respects the Constitution and legislature, and that very few officials are corrupt.
They also said the country was headed in the right direction, saw the economy as improving,
and considered that the government had managed the economy well. Ethiopians who held
these opinions were far more likely to say the country is democratic.
However, we have also located a clear syndrome of “uncritical citizenship” that affects the
way Ethiopians form these opinions. That is, Ethiopians are consistently among the most likely
respondents across 35 Afrobarometer surveys to say they “don’t know” – sometimes more
than one-third of respondents said this – when asked to evaluate economic and political
performance. And based on those who did give substantive responses, Ethiopians rank as
the least likely people to offer explicitly critical replies.
An important part of the explanation of Ethiopians’ uncritical assessments of the democratic
character and performance of the regime is their distinctive understanding of the concept
“democracy.” Ethiopians attach a highly positive connotation to the word “democracy.” Yet
they display a poor grasp of what the concept actually entails. Many are willing to accept
clearly undemocratic alternative regime types. While they understand it as a system of
elected government, they have little appreciation of the importance of multiparty
competition or the roles played by rights, laws, courts, legislatures, opposition parties, or the
news media in restraining government and limiting the role of the executive.

Afrobarometer Working Papers
Copyright © Afrobarometer 2016 45
In addition, Ethiopians tend to define democracy instrumentally (that is, in terms of the
provision of material welfare or effective governance) rather than intrinsically (that is, as the
protection of individual freedoms or the observance of political procedures such as
competitive elections and institutional checks and balances). By wide margins, Ethiopians
see political authority in paternalist terms (as a “parent” rather than an “employee”) and
prefer a government that “gets things done” to one that follows proper procedures. All of
these (mis)understandings of democracy lead Ethiopians to overrate – by a wide margin –
the extent and quality of democracy in their country.
Going beyond the survey results, this paper interprets this tendency as a consequence of an
institutional legacy of feudal monarchy and Leninist one-party rule. Never having
experienced an interlude of democracy, citizens have instead imbibed a top-down ideology
of guardianship by which a paternalistic elite promises to provide material welfare in lieu of
guarantees of political liberties. In other words, Ethiopians not only suffer limited knowledge
about what democracy means; rather, the concept has been redefined for them. And by
buying into the EPRDF’s definition of “revolutionary democracy,” Ethiopians remain subjects
rather than citizens.
Throughout this report, we have also focussed on the impact of the country’s extremely low
levels of development and modernization, especially with respect to education and
communications. Ethiopia has one of the highest proportions of rural-based citizens amongst
the 35 Afrobarometer countries. The Ethiopian electorate is also characterized by some of
the lowest levels of formal education, the lowest level of news media use, and one of the
lowest levels of political discussion. In particular, the penetration of news media in rural
Ethiopia is extremely limited. An astonishingly low 2% of rural dwellers read newspapers on at
least a weekly basis, and only 3% of rural dwellers own a television.
Finally, we have also probed the possibility that, given the country’s long-standing one-party
dominance and low levels of political freedom, at least some survey respondents censored
themselves and did not reveal their true evaluations and preferences. We located significant
levels of political fear, as indicated by perceived insecurity in their ability to join associations,
to vote without pressure, and particularly to speak freely about politics. Significant minorities
also worried about electoral intimidation and violence. We also found that Ethiopians
exhibited a high degree of political suspicion of the survey environment. They expressed the
highest levels of suspicion of the neutrality of Afrobarometer fieldworkers in Africa: Two-thirds
of respondents told interviewers at the conclusion of the interview that they thought they
were really from some part of the Ethiopian state. In turn, Afrobarometer interviewers
observed relatively high proportions of respondents who seemed ill at ease or suspicious in
the course of the interview.
While neither ignorance (with the exception of news media use) nor political suspicion has a
direct impact on Ethiopians’ anomalous assessment of the quality of democracy, they both
play important indirect roles. The small proportion of respondents who are well educated,
who use the news media frequently, and who engage in frequent political discussion were
much more likely to offer negative evaluations, and were also far more likely to offer opinions
about political performance. These factors are also strongly connected to the inability to
answer questions about democratic norms that do not actually use the word “democracy.”
In turn, the vast majority of Ethiopians who infrequently or never use news media offered
more rose-coloured assessments of the country’s democracy than those who use news
media frequently.
Perhaps more importantly, we found that respondent trust in the fieldworker and comfort
with the survey interview environment play key roles and interact with levels of political fear.
Respondents who were both fearful of political intimidation and suspicious of the interview
environment were more likely to offer positive views of economic and political governance
and the performance of leaders and institutions, as well as more likely to decline to answer
these questions. Alternatively, those who experienced political fear but trusted the
interviewer and were comfortable with the survey environment used the survey to criticize

Afrobarometer Working Papers
Copyright © Afrobarometer 2016 46
government and the state of democracy. To put it another way, as long as the interviewer
earned the respondent’s trust, the survey empowered fearful Ethiopians to express things that
they otherwise would feel unsafe saying publicly in the village marketplace (or privately on
the telephone or Internet) and thereby “speak truth to power.”
This has important implications for survey researchers who work in electoral authoritarian
regimes in Africa and elsewhere. In liberal democracies such as South Africa or Benin, the
perception that the interviewer works for the state may stem from an awareness that state
agencies regularly send researchers to local communities to measure employment,
economic activity, or public health, and may have a benign effect. In countries like Ethiopia,
however, with palpable levels of political fear, this perception may lead a significant number
of respondents to censor themselves, either by declining to answer questions or by offering
more positive answers than they would otherwise. This may not be a problem for census-
takers or surveyors of employment, income, or health status. However, it poses significant
challenges to researchers who want to measure contentious issues where respondents may
perceive a socially desirable or politically correct answer, such as sexual behaviour, values
about gender or democracy, or people’s evaluations of economic and political
performance. This may be especially true when interviews are conducted with rural or less
informed respondents. In these cases, researchers may need to go beyond standard
protocols of obtaining informed consent and take extraordinary measures to convince
respondents of the neutrality of the survey organisation and the confidentiality of their
answers.
Finally, because of the idiosyncratic way in which Ethiopians apparently understand
democracy, extreme caution must be exercised in attempting to compare any responses to
“d-word” questions from Ethiopia with those from other African countries. Indeed, because of
the evident cross-country incomparability of this set of responses, Afrobarometer has
refrained from integrating data from Ethiopia into the merged Afrobarometer Round 5
data set. Analysts who wish to explore public opinion in Ethiopia should use the Ethiopia
data set in a stand-alone setting or limit their comparative analysis to items that do not use
the “d-word.”

Afrobarometer Working Papers
Copyright © Afrobarometer 2016 47
References
Alebachew, H. (2012). Discourse on the political economy of corruption in Ethiopia: Meles Zenawi revisited. Available at: www.aigaforum.com/articles/political-economy.
Bach, J.-N. (2011). Abyotawi democracy: Neither revolutionary nor democratic. Journal of Eastern African Studies, 5(4), 641-663.
Bernhagen, P. (2009). Measuring democracy and democratization. In C. W. Haerpfer, P. Bernhagen, R. Inglehart, & C. Welzel (Eds.), Democratization. Oxford/New York: Oxford University Press.
Bratton, M., Mattes, R., & Gyimah-Boadi, E. (2005). Public opinion, market reform, and democracy. Cambridge: Cambridge University Press.
Bratton, M., & Houessou, R. (2014). Demand for democracy is rising in Africa, but most political leaders fail to deliver. Afrobarometer Policy Paper No. 11. Available at http://afrobarometer.org/sites/default/files/publications/Policy%20paper/ ab_r5_policypaperno11.pdf.
Central Statistical Agency. (2011). Welfare Monitoring Survey. Available at: http://www.csa.gov.et/index.php?option=com_content&view=article&id=47&Itemid=27
Chaligha, A., Mattes, R., Bratton, M., & Davids, Y. D. (2002).Uncritical citizens or patient trustees? Tanzanians’ views of political and economic reform. Afrobarometer Working Paper No. 18. Available at http://afrobarometer.org/publications/wp18-uncritical-citizens-or-patient-trustees-tanzanians-views-political-and-economic.
Chikwanha, A., Sithole, T., & Bratton, M. (2004). The power of propaganda: Public opinion in Zimbabwe, 2004. Afrobarometer Working Paper No. 42. Available at http://afrobarometer.org/publications/wp42-power-propaganda-public-opinion-zimbabwe-2004.
Coppedge, M. (2013). Democratization and research methods. Cambridge: Cambridge University Press.
De Waal, A. (2009). The theory and practice of Meles Zenawi. African Affairs, 112(446), 148-155.
Greenberg, A. P., & Mattes, R. (2013). Quality matters: Electoral outcomes and democratic health in Africa. In M. Bratton (Ed.) Voting and Democratic Citizenship in Africa, pp. 239-252. Boulder, CO: Lynne Rienner Publishers.
Human Rights Watch. (2010). One hundred ways of putting pressure: Violations of freedom of expression and association in Ethiopia. Available at: https://www.hrw.org/sites/default/files/reports/ethiopia0310webwcover.pdf
Human Rights Watch. (2014). They know everything we do: Telecom and internet surveillance in Ethiopia. Available at: https://www.hrw.org/report/2014/03/25/they-know-everything-we-do/telecom-and-internet-surveillance-ethiopia.
International Crisis Group. (2009). Ethiopia: Ethnic federalism and its discontents. Africa Report No. 153, 18. Available at: http://www.crisisgroup.org/~/media/Files/africa/horn-of-africa/ethiopia-eritrea/Ethiopia%20Ethnic%20Federalism%20and%20Its%20Discontents.pdf.
International Monetary Fund. (2012). Staff report for the 2012 article IV consultation. IMF country report No. 12/287.
International Monetary Fund. (2013). Translating economic growth into higher living standard: Inclusive growth in Ethiopia. IMF country report No. 13/309.
Ishiyama, J. (2009). Alternative electoral systems and the 2005 Ethiopian parliamentary elections. African Studies Quarterly, 10(4), 37-55.
Lippmann, W. (1922). Public opinion. New York: Harcourt, Brace.

Afrobarometer Working Papers
Copyright © Afrobarometer 2016 48
Lu, J., & Shi, T. (2014). The battle of ideas and discourses before democratic transition: Different democratic conceptions in authoritarian China. International Political Science Review, 36(1), 1-22.
Mattes, R. & Bratton, M. (2007). Learning about democracy: Performance, awareness, and experience. American Journal of Political Science, 51(1), 192-217.
Mattes, R., & Shenga, C. (2013). Uncritical citizenship in a low-information society: Mozambicans in comparative perspective. In Voting and Democratic Citizenship in Africa, M. Bratton (ed.). Boulder, CO: Lynne Rienner Publishers.
Mattes, R. (2014). Popular perceptions of electoral integrity in Africa. In P. Norris, R. Frank, & F. Martinez i Coma (Eds.), Advancing Electoral Integrity. New York: Oxford University Press.
McPherson, C. B. (1966). The real world of democracy. Oxford: Oxford University Press.
Norris, P. (2008). Driving democracy: Do power-sharing institutions work? Cambridge: Cambridge University Press.
Popkin, S. (1994). The reasoning voter: Communication and persuasion in presidential campaigns. Chicago: University of Chicago Press.
Ross, T. (2010). A test of democracy: Ethiopia’s mass media and freedom of information proclamation. Penn State Law Review, 114(3), 1047-1066.
Tronvoll, K. (2009). Ambiguous elections: The influence of non-electoral politics in Ethiopian democratization. Journal of Modern African Studies, 47(3), 449-474.
World Bank. (2012). Ethiopia economic update: Overcoming inflation, raising competitiveness. Washington, D.C. Available at www.worldbank.org/en/press-release/2012/12/13.

Afrobarometer Working Papers
Copyright © Afrobarometer 2016 49
Recent Afrobarometer working papers
No. 163 Manacorda, Marco & Andrea Tesei. Liberation technology: Mobile phones and political mobilization in Africa. 2016.
No. 162 Albaugh, Ericka A. Language, education, and citizenship in Africa. 2016.
No. 161 De Kadt, Daniel, & Evan S. Lieberman. Do citizens reward good service? Voter responses to basic service provision in southern Africa. 2015
No. 160 De Aquino, Jakson Alves. The effect of exposure to political institutions and economic events on demand for democracy in Africa. 2015
No. 159 Tsubura, Machiko. Does clientelism help Tanzanian MPs establish long-term electoral support? 2015
No. 158 Claire, Adida L., Karen E. Ferree, Daniel N. Posner, & Amanda L. Robinson. Who’s asking? Interviewer coethnicity effects in African survey data. 2015
No.157 Bratton, Michael & E. Gyimah-Boadi. Political risks facing African democracies: Evidence from Afrobarometer. 2015
No.156 Croke, Kevin, Guy Grossman, Horacio A. Larreguy, & John Marshall. Deliberate disengagement: How education decreases political participation in electoral authoritarian regimes. 2015
No.155 Bleck, Jaimie & Kristin Michelitch. On the primacy of weak public service provision in rural Africa: Malians redefine ‘state breakdown’ amidst 2012 political crisis. 2015
No.154 Leo, Benjamin, Robert Morello, & Vijaya Ramachandran. The face of African infrastructure: Service availability and citizens’ demands. 2015
No. 153 Gottlieb, Jessica, Guy Grossman, & Amanda Lea Robinson. Do men and women have different policy preferences, and if so, why? 2015
No. 152 Mattes, Robert & Samantha Richmond. Are South Africa’s youth really a ‘ticking time bomb’? 2015
No. 151 Mattes, Robert. South Africa’s emerging black middle class: A harbinger of political change? 2014
No. 150 Cheeseman, Nic. Does the African middle class defend democracy? Evidence from Kenya. 2014
No. 149 Schaub, Max. Solidarity with a sharp edge: Communal conflict and local collective action in rural Nigeria. 2014
No.148 Peiffer, Caryn & Richard Rose. Why do some Africans pay bribes while other Africans don’t? 2014
No. 147 Ellis, Erin. A vote of confidence: Retrospective voting in Africa. 2014
No. 146 Hollard, Guillaume & Omar Sene. What drives quality of schools in Africa? Disentangling social capital and ethnic divisions. 2014
No. 145 Dionne, Kim Yi, Kris L. Inman, & Gabriella R. Montinola. Another resource curse? The impact of remittances on political participation. 2014
No. 144 Carlson, Elizabeth. Social desirability bias and reported vote preferences in Africa surveys. 2014
No. 143 Ali, Merima, Odd-Helge Fjeldstad, & Ingrid Hoem Sjursen. To pay or not to pay? Citizens’ attitudes towards taxation in Kenya, Tanzania, Uganda and South Africa. 2013
No. 142 Bodenstein, Thilo. Ethnicity and individual attitudes towards international investors: Survey evidence from sub-Saharan Africa. 2013
No. 141 Bandyopadhyay, Sanghamitra & Elliott Green. Pre-colonial political centralization and contemporary development in Uganda. 2012

Afrobarometer Working Papers
Copyright © Afrobarometer 2016 50
Afrobarometer Working Papers Series
Editor: Michael Bratton, [email protected] Editorial Board: E. Gyimah-Boadi, Carolyn Logan, Robert Mattes, Leonard Wantchekon Afrobarometer publications report the results of national sample surveys on the attitudes of citizens in selected African countries toward democracy, markets, civil society, and other aspects of development. Afrobarometer publications are simultaneously co-published by the six Afrobarometer Core Partner and Support Unit Institutions. All Afrobarometer publications can be searched and downloaded from www.afrobarometer.org.
Support for Afrobarometer is provided by the UK’s Department for International Development (DFID), the Mo Ibrahim Foundation, the Swedish International Development Cooperation Agency (SIDA), the United States Agency for International Development (USAID), and the World Bank.
Core partners: Center for Democratic Development (CDD-Ghana)
95 Nortei Ababio Street, North Airport Residential Area
P.O. Box LG 404, Legon-Accra, Ghana Tel: +233 21 776 142
Fax: +233 21 763 028
www.cddghana.org
Institute for Development Studies (IDS), University of Nairobi P.O. Box 30197, Nairobi, 00100, Kenya Tel: +254 20 2247968 Fax: +254 20 2222036 www.ids.uonbi.ac.ke
Institute for Empirical Research in Political Economy (IREEP) Arconville, Lot 104 - Parcelle J, 02 BP: 372, Cotonou, Republique du Benin Tel: +229 21 363 873/ 229 94 940 108 Fax: +229 21 362 029
www.ireep.org
Institute for Justice and Reconciliation (IJR) 105 Hatfield Street, Gardens, 8001, Cape Town, South Africa Tel: +27 21 763 7128 Fax: +27 21 763 7138 www.ijr.org.za
Support units:
Michigan State University (MSU) Department of Political Science
East Lansing, MI 48824 Tel: +1 517 353 6590; Fax: +1 517 432 1091 www.polisci.msu.edu
University of Cape Town UCT) Democracy in Africa Research Unit Centre for Social Science Research
Private Bag Rondebosch 7701, South Africa Tel: +27 21 650 3827 Fax: +27 21 650 4657 www.cssr.uct.org.za