Embed Size (px)
Citation preview
Government Intervention
Section 1.3
Learning Objectives Indirect taxes
Specific (fixed amount) taxes and ad valorem (percentage) taxes and their impact on markets
� Explain why governments impose indirect (excise) taxes.
� Distinguish between specific and ad valorem taxes.
� Draw diagrams to show specific and ad valorem taxes, and analyse their impacts on market outcomes.
� Discuss the consequences of imposing an indirect tax on the stakeholders in a market, including consumers, producers and the government.
Continued… Tax incidence and price elasticity of demand and supply (HL ONLY)
� Explain, using diagrams, how the incidence of indirect taxes on consumers and firms differs, depending on the price elasticity of demand and on the price elasticity of supply.
� Plot demand and supply curves for a product from linear functions and then illustrate and/or calculate the effects of the imposition of a specific tax on the market (on price, quantity, consumer expenditure, producer revenue, government revenue, consumer surplus and producer surplus).
Continued… Subsidies
Impact on markets
� Explain why governments provide subsidies, and describe examples of subsidies.
� Draw a diagram to show a subsidy, and analyse the impacts of a subsidy on market outcomes.
� Discuss the consequences of providing a subsidy on the stakeholders in a market, including consumers, producers and the government.
� Plot demand and supply curves for a product from linear functions and then illustrate and/or calculate the effects of the provision of a subsidy on the market (on price, quantity, consumer expenditure, producer revenue, government expenditure, consumer surplus and producer surplus). (HL ONLY)
Continued… Price controls
Price ceilings (maximum prices): rationale, consequences and examples
� Explain why governments impose price ceilings, and describe examples of price ceilings, including food price controls and rent controls.
� Draw a diagram to show a price ceiling, and analyse the impacts of a price ceiling on market outcomes.
� Examine the possible consequences of a price ceiling, including shortages, inefficient resource allocation, welfare impacts, underground parallel markets and non-price rationing mechanisms.
� Discuss the consequences of imposing a price ceiling on the stakeholders in a market, including consumers, producers and the government.
� Calculate possible effects from the price ceiling diagram, including the resulting shortage and the change in consumer expenditure (which is equal to the change in firm revenue). (HL ONLY)
Continued… Price floors (minimum prices): rationale, consequences and examples
� Explain why governments impose price floors, and describe examples of price floors, including price support for agricultural products and minimum wages.
� Draw a diagram of a price floor, and analyse the impacts of a price floor on market outcomes.
� Examine the possible consequences of a price floor, including surpluses and government measures to dispose of the surpluses, inefficient resource allocation and welfare impacts.
� Discuss the consequences of imposing a price floor on the stakeholders in a market, including consumers, producers and the government.
� Calculate possible effects from the price floor diagram, including the resulting surplus, the change in consumer expenditure, the change in producer revenue, and government expenditure to purchase the surplus.
Tok Links � In what sense are we morally obliged to pay taxes?
Is this the result of a promise that we have made ourselves? When was this promise made? (Make a distinction here between moral and legal obligations.)
� To what extent is government morally obliged to provide healthcare and welfare benefits to the unemployed?

The Role of Government in the Market Economy
Free market � is one without any government control or intervention. The price and output is
determined by the interactions of buyers and sellers
� However, not all markets are completely free.
� Governments tend to intervene often to influence several variables in markets for particular goods, such as:
• Indirect taxes
• Taxing the good to discourage consumption or raise revenues
• Subsidies
• Paying producers of the good to reduce costs or encourage the good’s production:
• Price Ceilings
• Reducing the price of the good below its free market equilibrium to benefit consumers
• Price Floors
• Raising the price of a good above its free market equilibrium to benefit producers:
� When governments intervene in the free market, the level of output and price that results is may NOT be the allocatively efficient level.
� In other words, government intervention may lead to a misallocation of society’s resources.
Indirect Taxes
Continued… � An indirect tax is one placed by the government on
the producers of a particular good.
• Consumers will pay the tax indirectly through producers
• An indirect tax will be shared by both consumers and producers
Different types of Indirect Tax:
� Specific Tax: � The amount od tax is an absolute value
� Example: $2 per pack of cigarette
� Ad Valorem Tax: � The amount of tax is a % of the sale
� Value added tax or (VAT) 19%
� GST: 13% in Ontario
Excise Tax/Sin Tax � This refers to an indirect tax places on harmful/
demerit goods such as: � Cigarettes, alcohol and petrol
� This will further explored in the next section 1.4, market failure
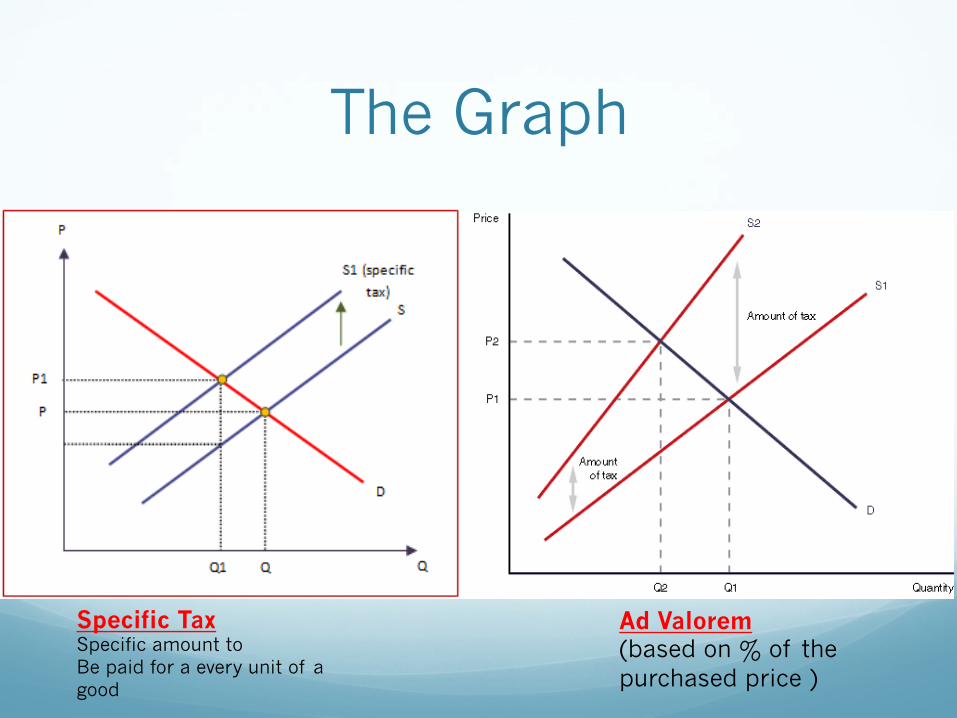
The Graph
Specific Tax Specific amount to Be paid for a every unit of a good
Ad Valorem (based on % of the purchased price )

Example
Pencil market S
D
Q
P
Qe
S+tax
1.05
1.55
Qtax
$0.50
1.25
• Assume the government decides to place a $0.50 tax on pencil production to raise revenue to support the pen industry.
• The tax is an additional cost for pencil producers, so the supply of pencils decreases.
• Supply will shift UP by $0.50 • The price of pencils increases from
$1.25 to $1.55. • Once the tax is paid, pencil
producers get to keep just $1.05
Examine the market for pencils.
Stakeholder Consequences � Tax Raise Prices:
� Tax shifts supply to the left, consequently, the Pe of the product will rise
� Tax Reduces Output: � Supply will shift to the left due to increase in cost. Reduced supply will
reduce output.
� Market Size Shrinks: � Reduced output means reduced market size.
� Consumers Suffer: � Will pay higher prices and receive lees of the product
� Producers Suffer: � They produce less, hence less profits
� Government Benefits: � Increase in Government revenues (taxes)
Example Determining the Effect of Indirect Taxes
� As we saw, a tax reduces the supply of a good and increases the price.
We noticed:
• The price of the good does not increase by the full amount of the tax
• The producers of the good do not keep the full price paid by consumers, as they must pay the tax
• There is a loss of total welfare in the market resulting from the tax.
Example
Pencil market S
D
Q
P
Qe
S+tax
1.05
1.55
Qtax
$0.50
1.25
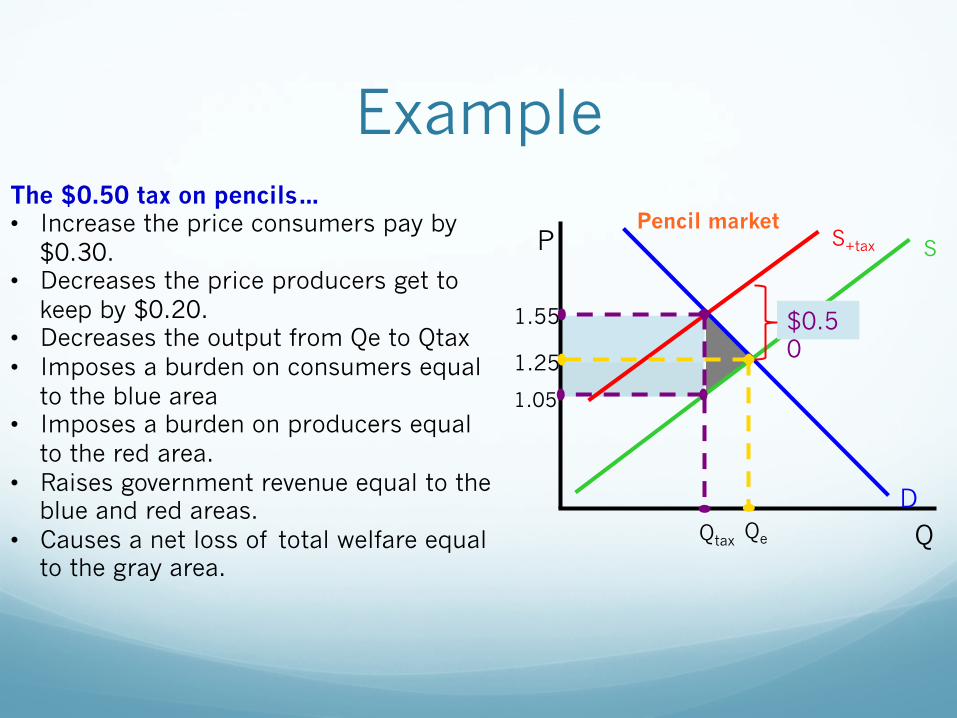
The $0.50 tax on pencils… • Increase the price consumers pay by
$0.30. • Decreases the price producers get to
keep by $0.20. • Decreases the output from Qe to Qtax • Imposes a burden on consumers equal
to the blue area • Imposes a burden on producers equal
to the red area. • Raises government revenue equal to the
blue and red areas. • Causes a net loss of total welfare equal
to the gray area.

Test your knowledge � With your new partner, answer the following
questions
� Post answers on you blogger under 1.3 Government intervention 1. Explain, using examples, how specific and Ad
valorem tax work. 2. Discuss the effect of indirect taxes on different
stakeholders
Tax Incidence HL ONLY
The Effects of an Indirect Tax and PED
� In the previous example, consumers paid $0.30 of the $0.50 tax and producers paid only $0.20.
� The tax was shared, but consumers paid the larger share.
� Determining who will pay the larger share of a tax requires us to examine the price elasticity of demand for the good being taxed.
If demand is relatively elastic:
• Producers will bear the larger burden of the tax.
• Firms will not be able to raise the price by much out of fear of losing all their customers, therefore price will not increase by much,
• but producers will get to keep less of what consumers pay.
If demand is relatively inelastic:
• Consumes will bear the larger burden of the tax.
• Firms will be able to pass most of the tax onto consumers, who are not very responsive to the higher price,
• thus will continue to consume close to what they were before the tax.
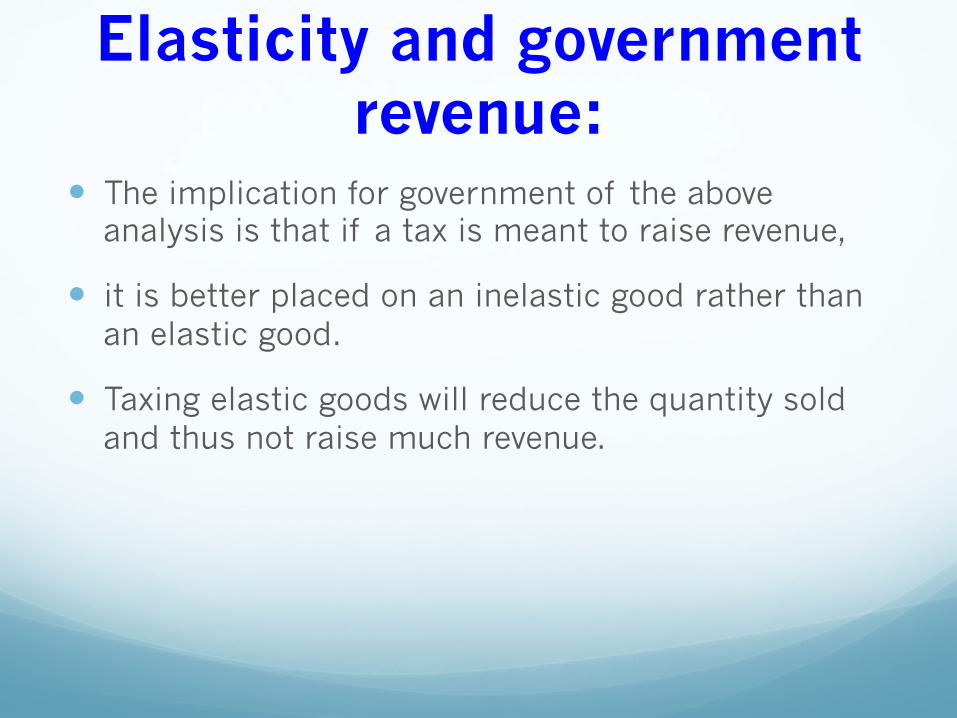
Elasticity and government revenue:
� The implication for government of the above analysis is that if a tax is meant to raise revenue,
� it is better placed on an inelastic good rather than an elastic good.
� Taxing elastic goods will reduce the quantity sold and thus not raise much revenue.
Exercise/Example
Good A S
D
Q
P
Qe
S+tax
2.00
Qtax
$1 2.20
1.20
Good B S
D
Q
P
Qe
S+tax
2.00
Qtax
$1 2.90
1.90
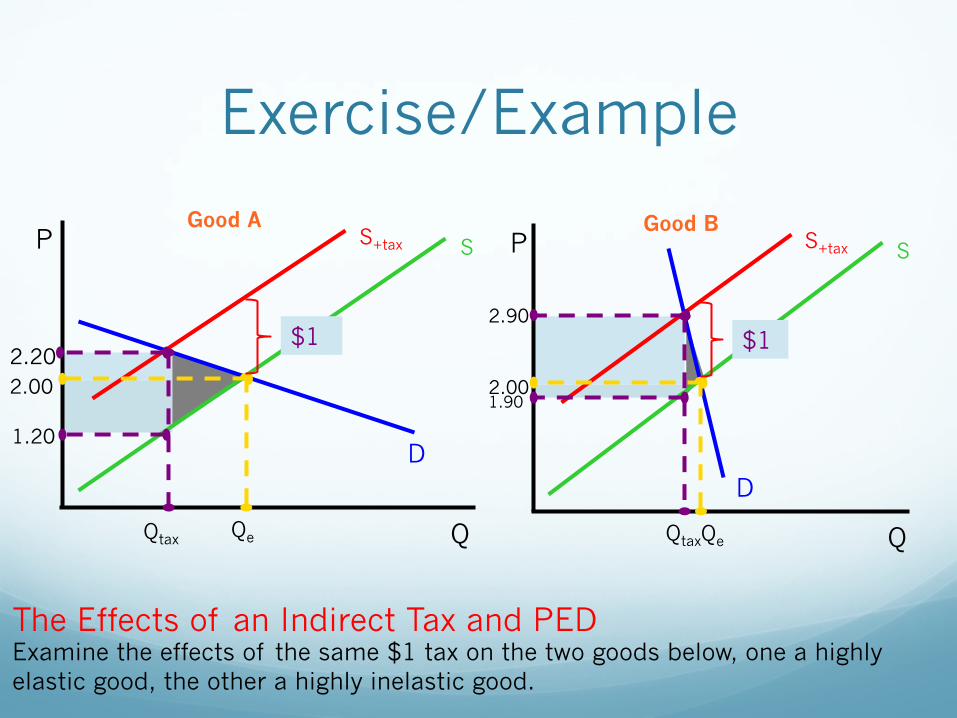
The Effects of an Indirect Tax and PED Examine the effects of the same $1 tax on the two goods below, one a highly elastic good, the other a highly inelastic good.

Example- Good A
The $1 tax on Good A (highly elastic demand): • $0.80 is paid by produces, and
only $0.20 by consumers • Quantity falls dramatically. • The loss of welfare (gray triangle)
is large • Revenue raised is small due to the
large decrease in Q
Good A
S
D
Q
P
Qe
S+tax
2.00
Qtax
$1 2.20
1.20
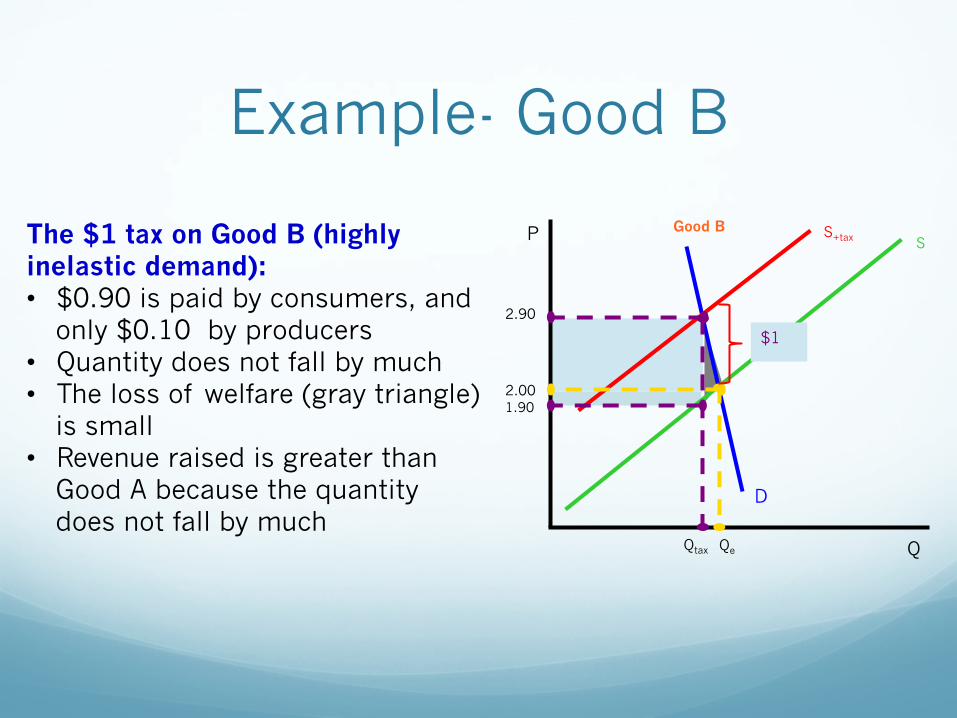
Example- Good B
The $1 tax on Good B (highly inelastic demand): • $0.90 is paid by consumers, and
only $0.10 by producers • Quantity does not fall by much • The loss of welfare (gray triangle)
is small • Revenue raised is greater than
Good A because the quantity does not fall by much
Good B S
D
Q
P
Qe
S+tax
2.00
Qtax
$1
2.90
1.90
Government revenue � Observations
� Taxing goods with relatively inelastic demand will raise more revenue and lead to a smaller loss of total welfare, while taxing goods with elastic demand will lead to a larger decrease in quantity and a greater loss of total welfare.
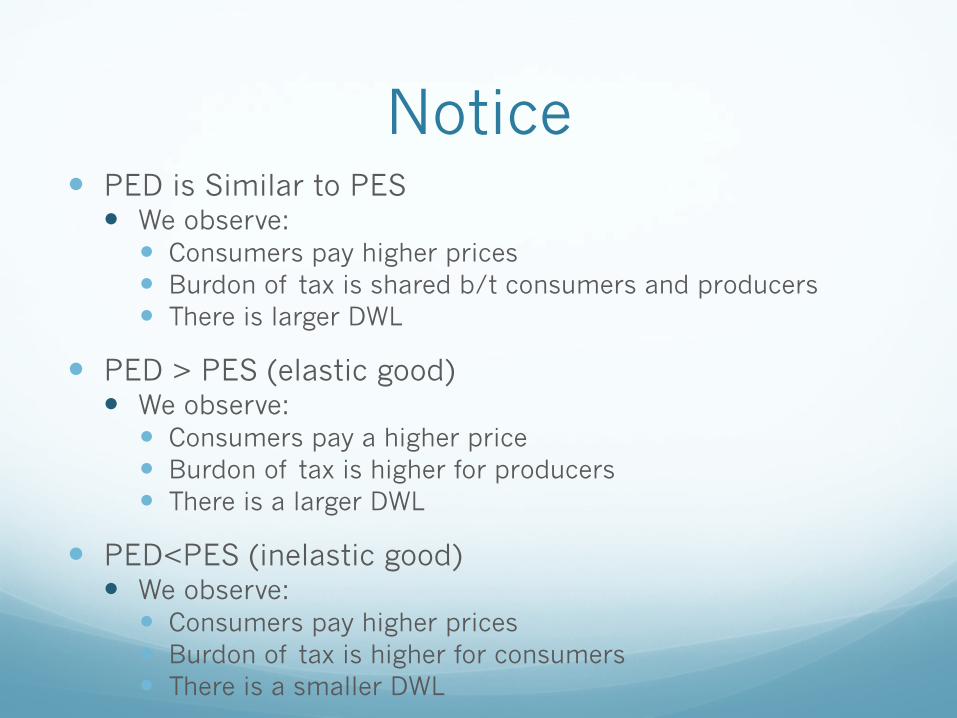
Notice � PED is Similar to PES
� We observe: � Consumers pay higher prices � Burdon of tax is shared b/t consumers and producers � There is larger DWL
� PED > PES (elastic good) � We observe:
� Consumers pay a higher price � Burdon of tax is higher for producers � There is a larger DWL
� PED<PES (inelastic good) � We observe:
� Consumers pay higher prices � Burdon of tax is higher for consumers � There is a smaller DWL

Other resources
Textbook Reference � Refer to page 100 of your textbook
� Also read the following link on tax incidence
� http://thismatter.com/economics/tax-incidence.htm

Test your Knowledge � Watch the following videos and answer the given
questions.
� http://www.econclassroom.com/?p=2771
� http://www.econclassroom.com/?p=2774
� Explain, using diagrams, how the incidence of indirect taxes on consumers and firms differs, depending on the price elasticity of demand and on the price elasticity of supply.
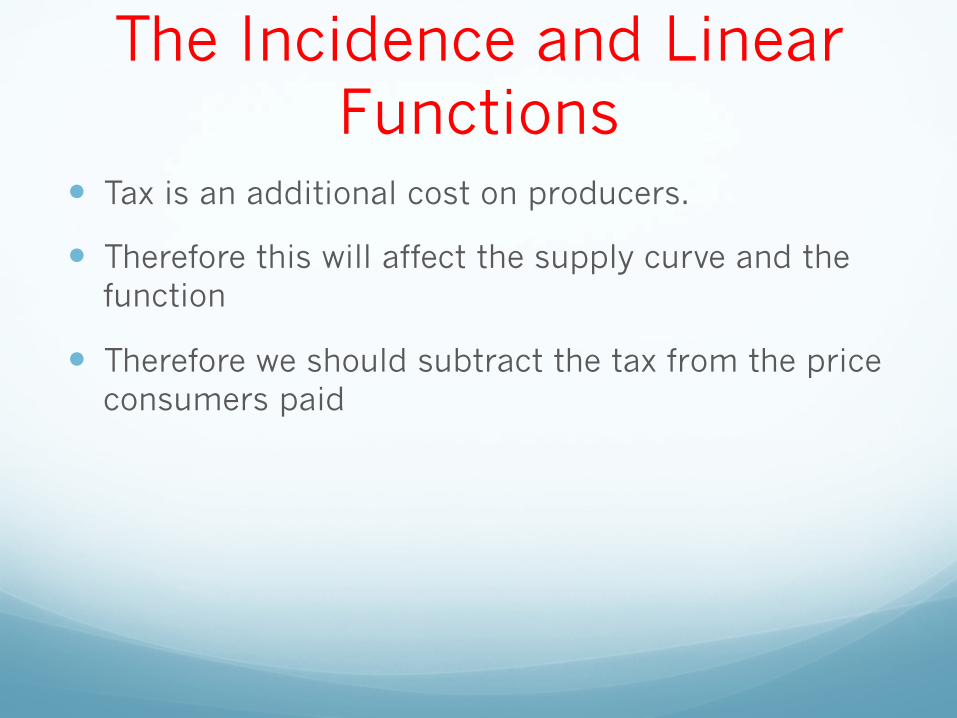
The Incidence and Linear Functions
� Tax is an additional cost on producers.
� Therefore this will affect the supply curve and the function
� Therefore we should subtract the tax from the price consumers paid
Example
Example
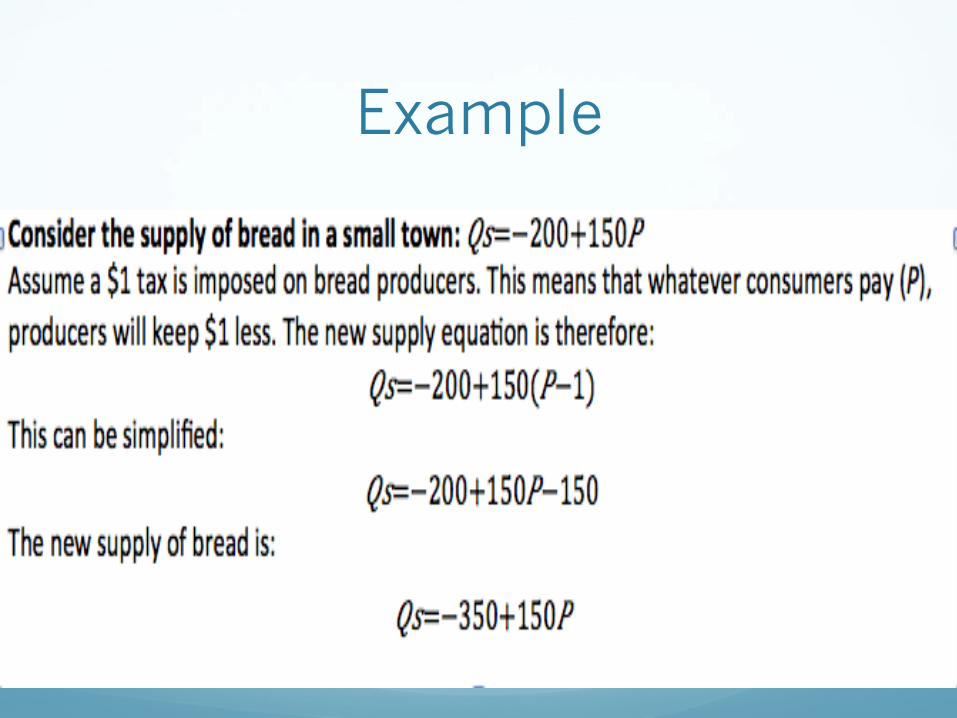
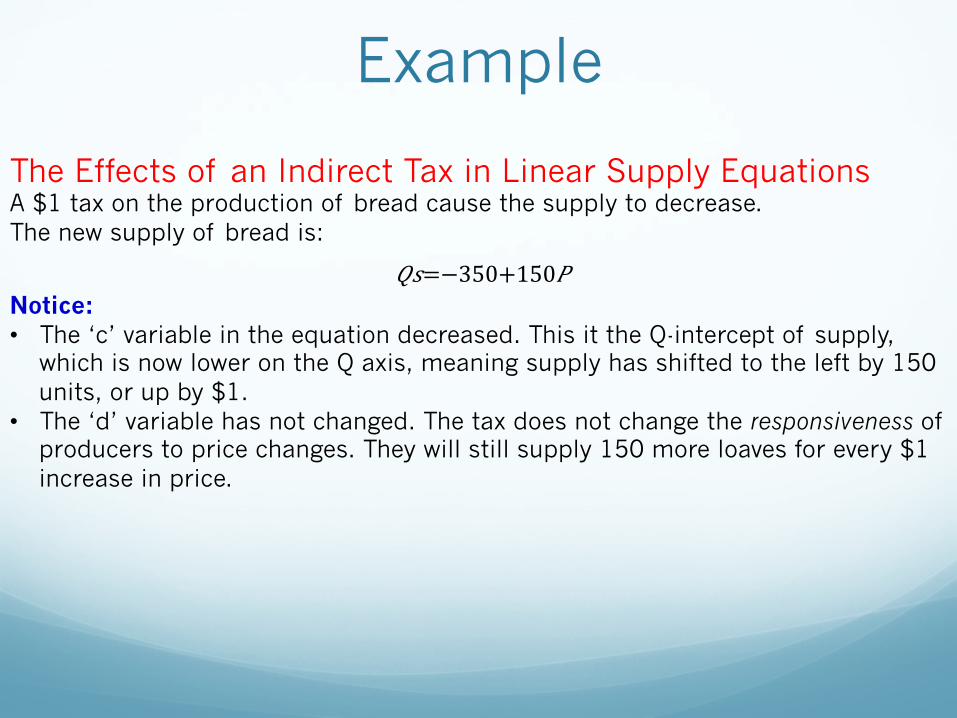
The Effects of an Indirect Tax in Linear Supply Equations A $1 tax on the production of bread cause the supply to decrease. The new supply of bread is:
𝑄𝑠=−350+150𝑃 Notice: • The ‘c’ variable in the equation decreased. This it the Q-intercept of supply,
which is now lower on the Q axis, meaning supply has shifted to the left by 150 units, or up by $1.
• The ‘d’ variable has not changed. The tax does not change the responsiveness of producers to price changes. They will still supply 150 more loaves for every $1 increase in price.

Test your knowledge � Watch the following video:
� http://www.econclassroom.com/?p=2784
� Follow the example in your textbook (page 104 of section 1.3)
� Do HL Exercise questions on page 107 (this counts as an assignment grade)