Embed Size (px)
Citation preview
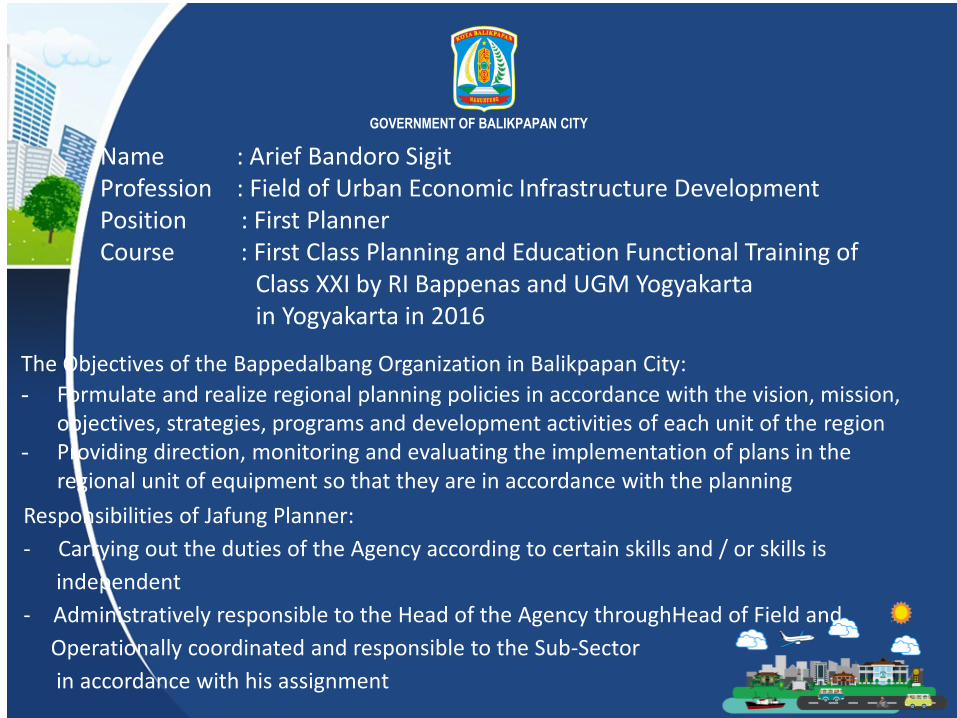
GOVERNMENT OF BALIKPAPAN CITY
Disampaikan oleh :
H. RAHMAD MAS’UD WAKIL WALI KOTA BALIKPAPAN
The Objectives of the Bappedalbang Organization in Balikpapan City:
- Formulate and realize regional planning policies in accordance with the vision, mission, objectives, strategies, programs and development activities of each unit of the region
- Providing direction, monitoring and evaluating the implementation of plans in the regional unit of equipment so that they are in accordance with the planning
Name : Arief Bandoro Sigit Profession : Field of Urban Economic Infrastructure Development Position : First Planner Course : First Class Planning and Education Functional Training of Class XXI by RI Bappenas and UGM Yogyakarta in Yogyakarta in 2016
Responsibilities of Jafung Planner:
- Carrying out the duties of the Agency according to certain skills and / or skills is
independent
- Administratively responsible to the Head of the Agency throughHead of Field and
Operationally coordinated and responsible to the Sub-Sector
in accordance with his assignment
2
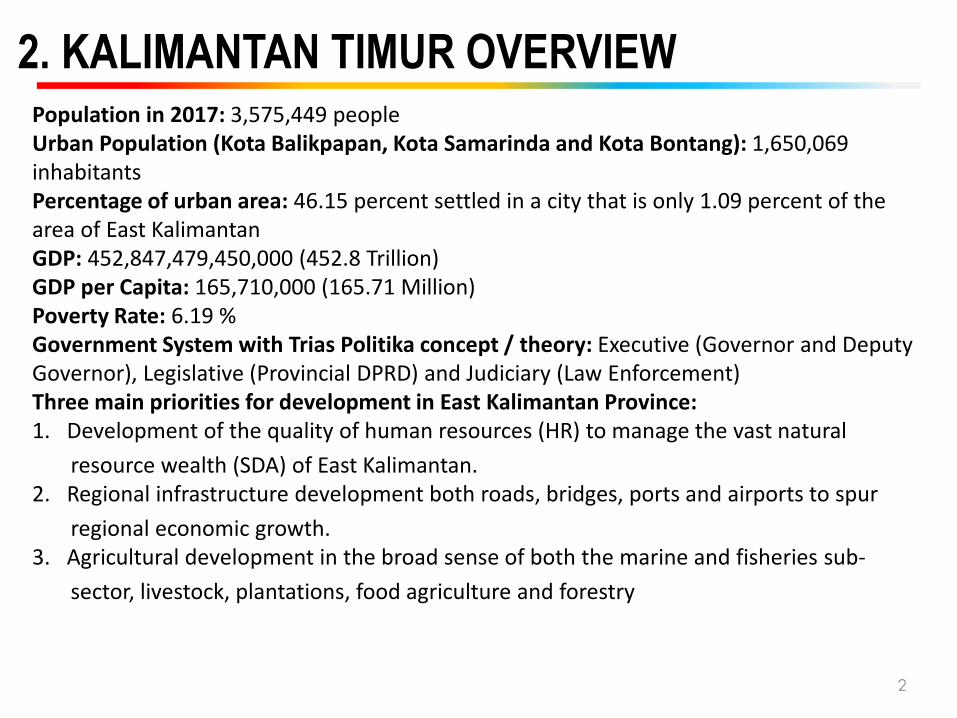
2. KALIMANTAN TIMUR OVERVIEW Population in 2017: 3,575,449 people Urban Population (Kota Balikpapan, Kota Samarinda and Kota Bontang): 1,650,069 inhabitants Percentage of urban area: 46.15 percent settled in a city that is only 1.09 percent of the area of East Kalimantan GDP: 452,847,479,450,000 (452.8 Trillion) GDP per Capita: 165,710,000 (165.71 Million) Poverty Rate: 6.19 % Government System with Trias Politika concept / theory: Executive (Governor and Deputy Governor), Legislative (Provincial DPRD) and Judiciary (Law Enforcement) Three main priorities for development in East Kalimantan Province: 1. Development of the quality of human resources (HR) to manage the vast natural
resource wealth (SDA) of East Kalimantan. 2. Regional infrastructure development both roads, bridges, ports and airports to spur
regional economic growth. 3. Agricultural development in the broad sense of both the marine and fisheries sub-
sector, livestock, plantations, food agriculture and forestry

BERAU
BALIKPAPAN
PASER
MAHULU
BONTANG
DISTRICT / CITY ACHIEVEMENTS IN 2016
BALIKPAPAN
HDI … 78.57
RATE OF ECONOMIC GROWTH… 4.76
LEVEL OF OPEN UNEMPLOYMENT…. 10,39
POVERTY LEVEL…. 2,82
ECONOMIC MOVEMENT SECTOR:
• REFINERY INDUSTRY (47,62 %)
• BIG & RETAIL TRADE (8,61 %)
BONTANG
HDI …. 78.92
RATE OF ECONOMIC GROWTH… -1.49
LEVEL OF OPEN UNEMPLOYMENT… 12.44
POVERTY LEVEL… 5,16
ECONOMIC MOVEMENT SECTOR:
• REFINERY INDUSTRY (83,96 %)
• BIG & RETAIL TRADE (2,62 %)
BERAU
HDI …73.56
RATE OF ECONOMIC GROWTH… -4.79
LEVEL OF OPEN UNEMPLOYMENT… 6,45
POVERTY LEVEL… 5,41
ECONOMIC MOVEMENT SECTOR:
MINING & LEAVING(60,36 %)
• AGRICULTURE, FORESTRY, FISHERIES (11,38
%)
• BIG & RETAIL TRADE (5,25 %)
MAHAKAM ULU
IHDI ….. 66,09
RATE OF ECONOMIC GROWTH….3.38
LEVEL OF OPEN UNEMPLOYMENT… 9,05
POVERTY LEVEL… 11,29
ECONOMIC MOVEMENT SECTOR:
• AGRICULTURE, FORESTRY, FISHERIES (77,23
&%)
• MINING & LEAVING (7,68 %)
• BIG & RETAIL TRADE (3,94 %)
PASER
HDI … 71.00
RATE OF ECONOMIC GROWTH… -4.79
LEVEL OF OPEN UNEMPLOYMENT… 5,54
POVERTY LEVEL… 9,28
ECONOMIC MOVEMENT SECTOR:
• MINING & LEAVING (71,31 %)
• AGRICULTURE, FORESTRY, FISHERIES (12,56 %)
• REFINERY INDUSTRY (4,51 %)
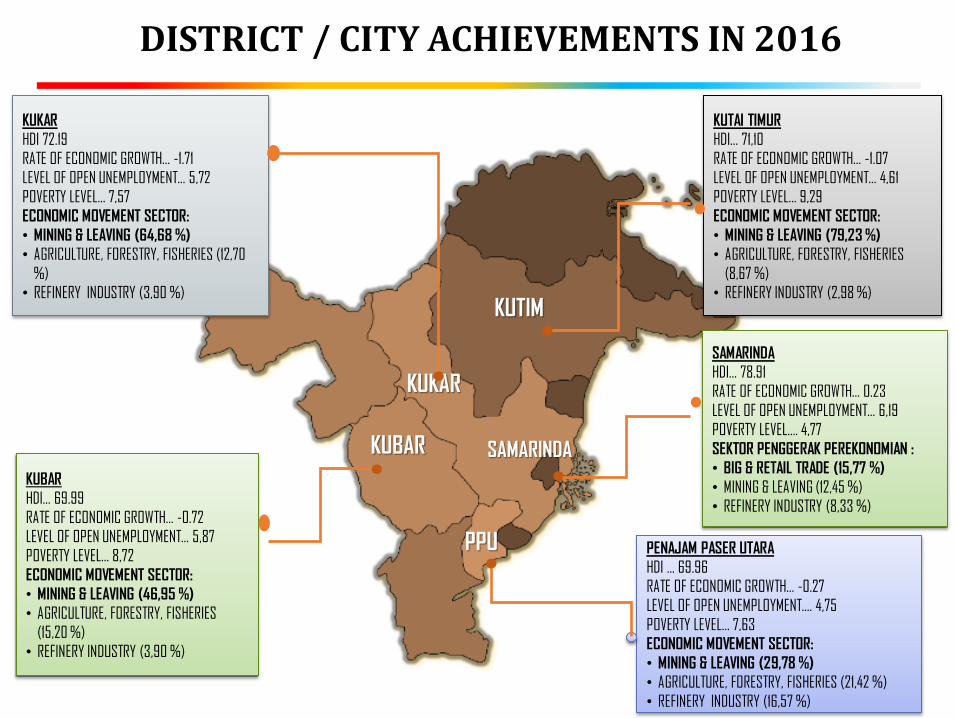
KUTIM
SAMARINDA
PPU
KUKAR
KUBAR
SAMARINDA
HDI… 78.91
RATE OF ECONOMIC GROWTH… 0.23
LEVEL OF OPEN UNEMPLOYMENT… 6,19
POVERTY LEVEL…. 4,77
SEKTOR PENGGERAK PEREKONOMIAN :
• BIG & RETAIL TRADE (15,77 %)
• MINING & LEAVING (12,45 %)
• REFINERY INDUSTRY (8,33 %)
PENAJAM PASER UTARA
HDI … 69.96
RATE OF ECONOMIC GROWTH… -0.27
LEVEL OF OPEN UNEMPLOYMENT…. 4,75
POVERTY LEVEL… 7,63
ECONOMIC MOVEMENT SECTOR:
• MINING & LEAVING (29,78 %)
• AGRICULTURE, FORESTRY, FISHERIES (21,42 %)
• REFINERY INDUSTRY (16,57 %)
KUKAR
HDI 72.19
RATE OF ECONOMIC GROWTH… -1.71
LEVEL OF OPEN UNEMPLOYMENT… 5,72
POVERTY LEVEL… 7,57
ECONOMIC MOVEMENT SECTOR:
• MINING & LEAVING (64,68 %)
• AGRICULTURE, FORESTRY, FISHERIES (12,70
%)
• REFINERY INDUSTRY (3,90 %)
KUBAR
HDI… 69.99
RATE OF ECONOMIC GROWTH… -0.72
LEVEL OF OPEN UNEMPLOYMENT… 5,87
POVERTY LEVEL… 8,72
ECONOMIC MOVEMENT SECTOR:
• MINING & LEAVING (46,95 %)
• AGRICULTURE, FORESTRY, FISHERIES
(15,20 %)
• REFINERY INDUSTRY (3,90 %)
KUTAI TIMUR
HDI… 71,10
RATE OF ECONOMIC GROWTH… -1.07
LEVEL OF OPEN UNEMPLOYMENT… 4,61
POVERTY LEVEL… 9,29
ECONOMIC MOVEMENT SECTOR:
• MINING & LEAVING (79,23 %)
• AGRICULTURE, FORESTRY, FISHERIES
(8,67 %)
• REFINERY INDUSTRY (2,98 %)
DISTRICT / CITY ACHIEVEMENTS IN 2016
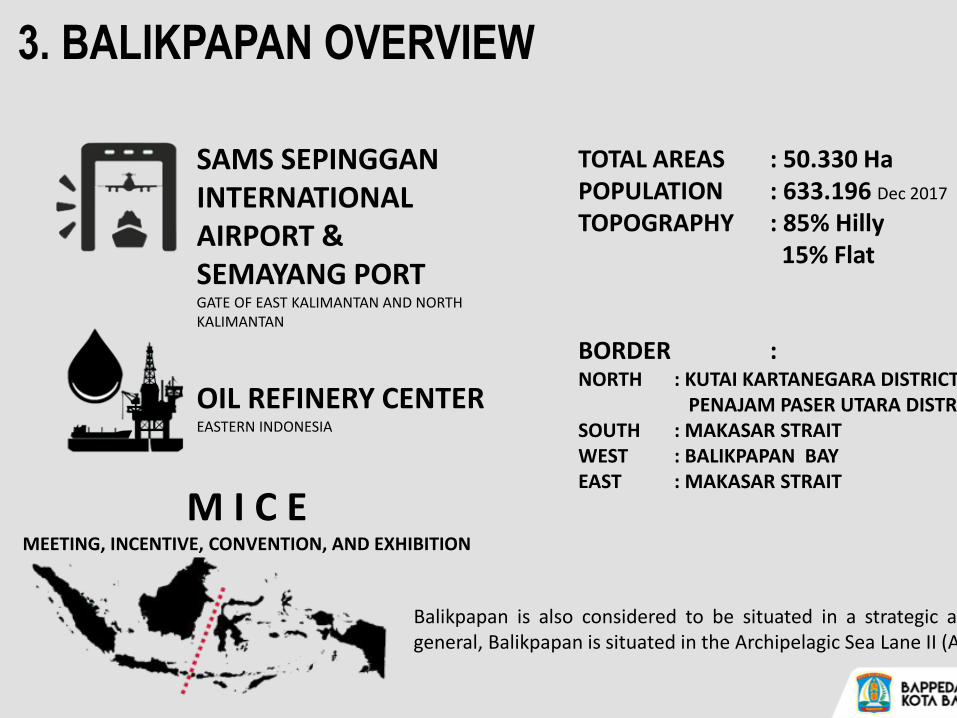
3. BALIKPAPAN OVERVIEW
SAMS SEPINGGAN INTERNATIONAL AIRPORT & SEMAYANG PORT GATE OF EAST KALIMANTAN AND NORTH KALIMANTAN
OIL REFINERY CENTER EASTERN INDONESIA
M I C E MEETING, INCENTIVE, CONVENTION, AND EXHIBITION
TOTAL AREAS : 50.330 Ha POPULATION : 633.196 Dec 2017
TOPOGRAPHY : 85% Hilly 15% Flat BORDER : NORTH : KUTAI KARTANEGARA DISTRICT PENAJAM PASER UTARA DISTRICT SOUTH : MAKASAR STRAIT WEST : BALIKPAPAN BAY EAST : MAKASAR STRAIT
Balikpapan is also considered to be situated in a strategic area. In general, Balikpapan is situated in the Archipelagic Sea Lane II (ALK II).
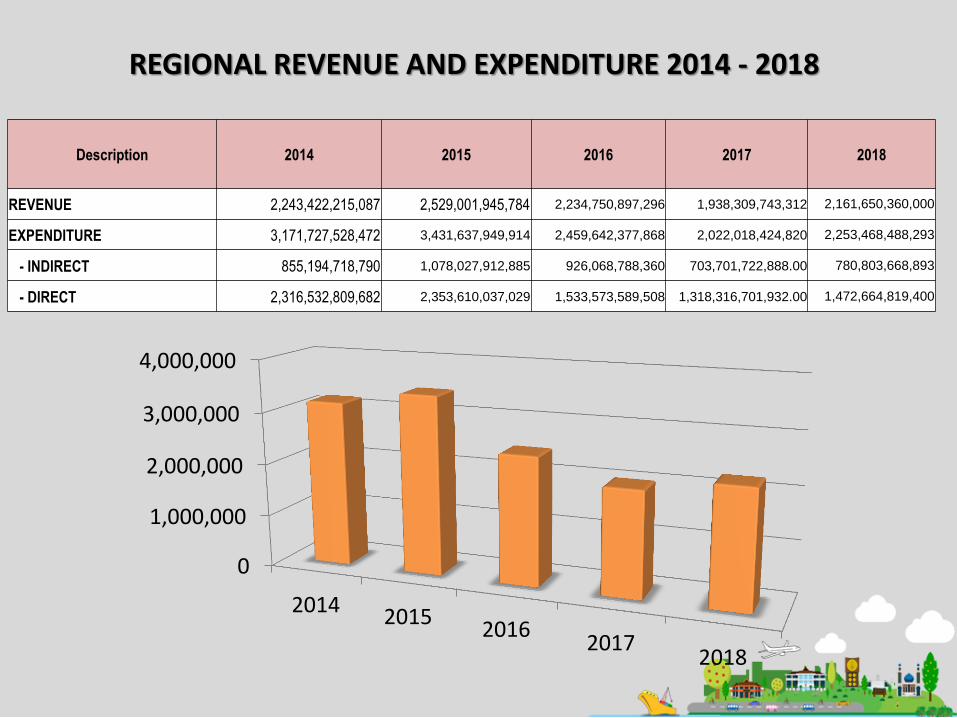
REGIONAL REVENUE AND EXPENDITURE 2014 - 2018
Description 2014 2015 2016 2017 2018
REVENUE 2,243,422,215,087 2,529,001,945,784 2,234,750,897,296 1,938,309,743,312 2,161,650,360,000
EXPENDITURE 3,171,727,528,472 3,431,637,949,914 2,459,642,377,868 2,022,018,424,820 2,253,468,488,293
- INDIRECT 855,194,718,790 1,078,027,912,885 926,068,788,360 703,701,722,888.00 780,803,668,893
- DIRECT 2,316,532,809,682 2,353,610,037,029 1,533,573,589,508 1,318,316,701,932.00 1,472,664,819,400
0
1,000,000
2,000,000
3,000,000
4,000,000
2014 20152016
20172018

ECONOMIC
Source : Statistic of Balikpapan Municipality
68,963,949 69,859,174 73,185,376 75,955,381
118.37 120.66
127.24
136.37
108.00
113.00
118.00
123.00
128.00
133.00
138.00
62,000,000
65,000,000
68,000,000
71,000,000
74,000,000
77,000,000
80,000,000
2014 2015 2016 2017
PDRB ADHK
PDRB PER KAPITA
6.26
4.13
2.45
0
2
4
6
8
2015 2016 2017
INFLATION
0
1
2
3
4
5
2014 2015 2016 2017
4.64
1.3
4.76
3.78
ECONOMIC GROWTH
GROSS DOMESTIC REGIONAL PRODUCT AT COSTANT PRICES (MILLION RUPIAH)
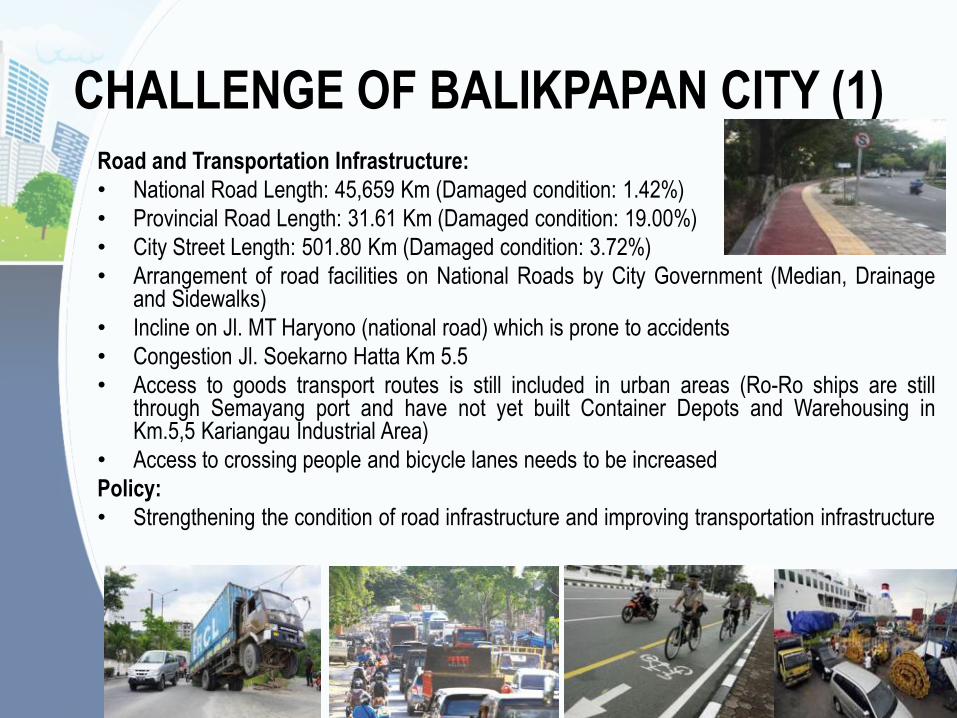
CHALLENGE OF BALIKPAPAN CITY (1) Road and Transportation Infrastructure:
• National Road Length: 45,659 Km (Damaged condition: 1.42%)
• Provincial Road Length: 31.61 Km (Damaged condition: 19.00%)
• City Street Length: 501.80 Km (Damaged condition: 3.72%)
• Arrangement of road facilities on National Roads by City Government (Median, Drainage and Sidewalks)
• Incline on Jl. MT Haryono (national road) which is prone to accidents
• Congestion Jl. Soekarno Hatta Km 5.5
• Access to goods transport routes is still included in urban areas (Ro-Ro ships are still through Semayang port and have not yet built Container Depots and Warehousing in Km.5,5 Kariangau Industrial Area)
• Access to crossing people and bicycle lanes needs to be increased
Policy:
• Strengthening the condition of road infrastructure and improving transportation infrastructure

CHALLENGE OF BALIKPAPAN CITY (2) Provision of Housing Backlogs: 110.338 (data RP3KP 2013)
ACHIEVEMENT 2016 2017
Number of Developers 35 39
Total Development Range 335 Ha 590 Ha
Number of units 16.151 Unit 11.608 Unit
Number of units MBR 10.318 Unit 6.385 Unit
Policy:
Reducing the Number of Unqualified Houses: 1,035 (Data Collection 2016) • Self Help / Home Surgery Stimulant Assistance 2017 :
250 Unit
• Housing Special Allocation Fund 2017 : 55 Unit
• Review of Self-Help Housing / Home Surgery Stimulant Assistance 2018: 250 Unit
• Review Housing Special Allocation Fund : 97 Unit
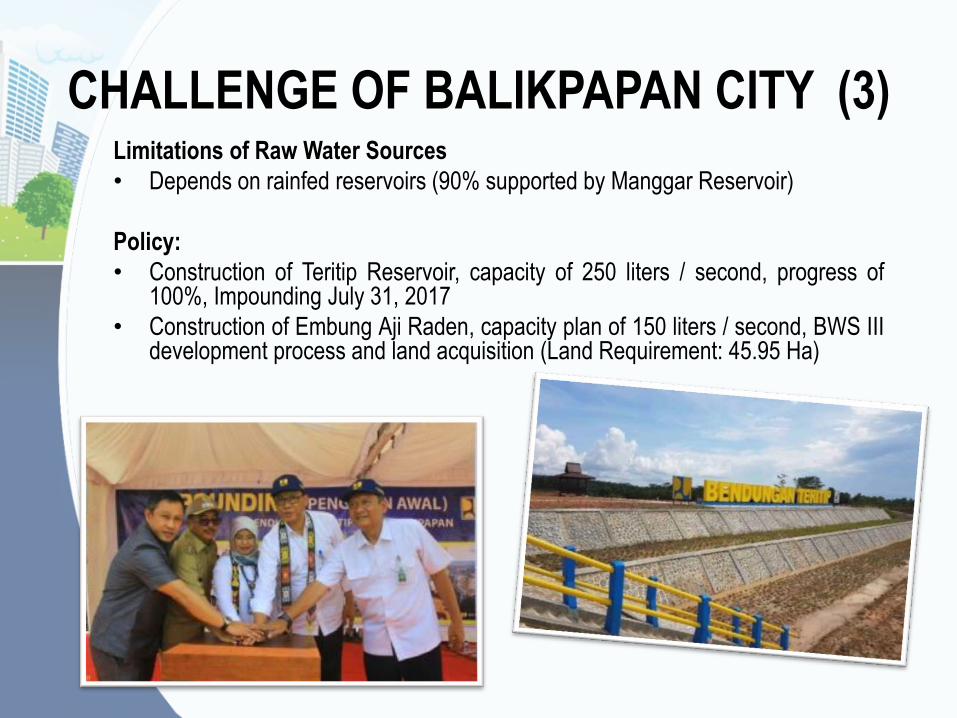
CHALLENGE OF BALIKPAPAN CITY (3) Limitations of Raw Water Sources
• Depends on rainfed reservoirs (90% supported by Manggar Reservoir)
Policy:
• Construction of Teritip Reservoir, capacity of 250 liters / second, progress of 100%, Impounding July 31, 2017
• Construction of Embung Aji Raden, capacity plan of 150 liters / second, BWS III development process and land acquisition (Land Requirement: 45.95 Ha)

CHALLENGE OF BALIKPAPAN CITY (4)
Water and Sanitation Needs
- Program Progress 100-0-100 (Source: Baseline Data dated 22 January 2018) • Achievement of Decent Drinking Water: 90% (PDAM Services 76.56%)
• Achievement of Eligible Sanitation: 92%
• Area of Slums: 248.25 Ha (of 282.2 Ha)
- Water needs 1,600 liters / second, providing 1,220 liters / second
Policy:
• To support the Teritip Reservoir and Embung Aji Raden, it is currently in the process of constructing 2018 Phase I Barnacles IPA in the amount of 200 Liters / second from the planned 400 liters / second (Barnacles SPAM)
In the context of the Acceleration of the Development of Teritip SPAM a cooperation agreement was established between the Head of the Center for Groundwater and Raw Water of the Directorate General of Natural Resources, Director of PSPAM, Prov. DPU. East Kalimantan, and the Mayor of Balikpapan
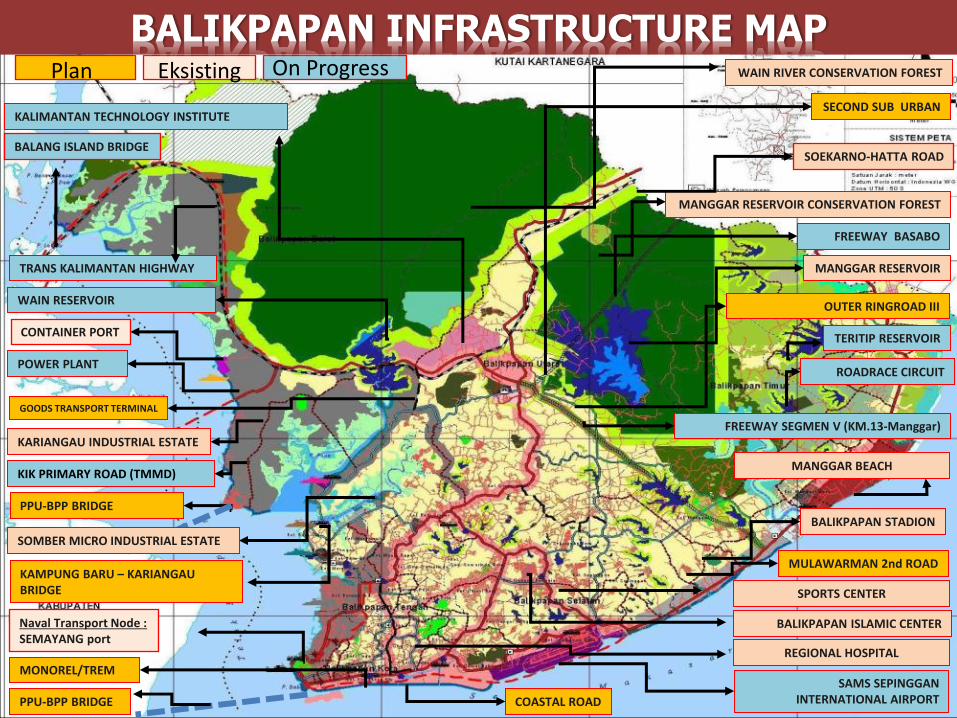
WAIN RIVER CONSERVATION FOREST
SECOND SUB URBAN
MANGGAR RESERVOIR CONSERVATION FOREST
MANGGAR RESERVOIR
OUTER RINGROAD III
SAMS SEPINGGAN INTERNATIONAL AIRPORT COASTAL ROAD
KARIANGAU INDUSTRIAL ESTATE
Naval Transport Node : SEMAYANG port
BALANG ISLAND BRIDGE
MANGGAR BEACH
KAMPUNG BARU – KARIANGAU BRIDGE
TRANS KALIMANTAN HIGHWAY
WAIN RESERVOIR
FREEWAY BASABO
CONTAINER PORT
SOEKARNO-HATTA ROAD
TERITIP RESERVOIR
BALIKPAPAN STADION
FREEWAY SEGMEN V (KM.13-Manggar)
ROADRACE CIRCUIT
KALIMANTAN TECHNOLOGY INSTITUTE
SPORTS CENTER
Plan Eksisting
GOODS TRANSPORT TERMINAL
KIK PRIMARY ROAD (TMMD)
BALIKPAPAN ISLAMIC CENTER
PPU-BPP BRIDGE
MULAWARMAN 2nd ROAD
On Progress
MONOREL/TREM
SOMBER MICRO INDUSTRIAL ESTATE
BALIKPAPAN INFRASTRUCTURE MAP
POWER PLANT
REGIONAL HOSPITAL
PPU-BPP BRIDGE
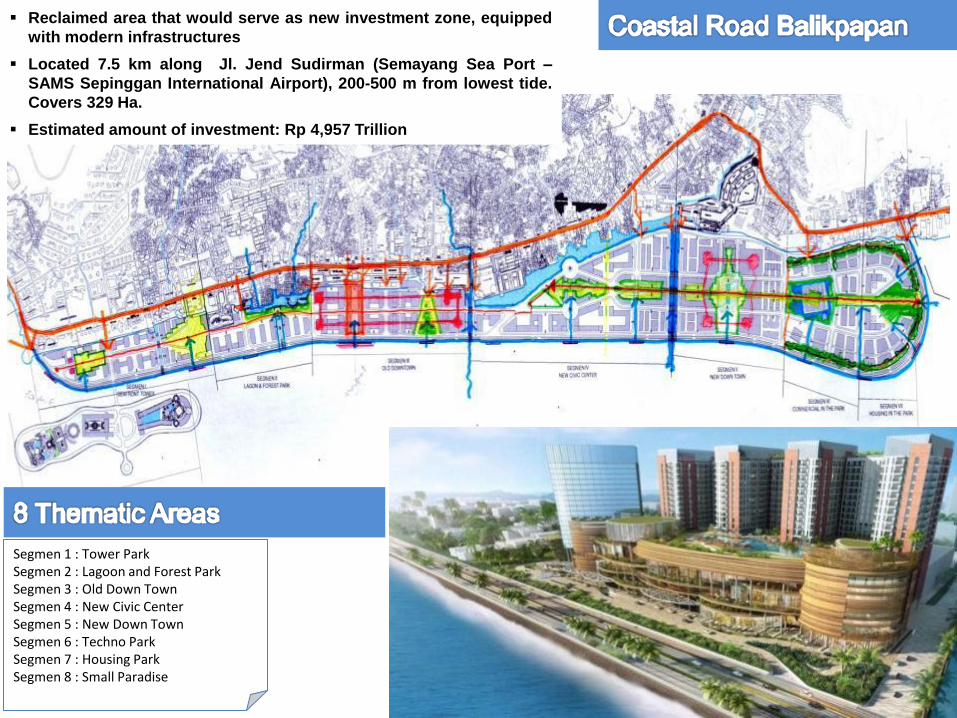
Segmen 1 : Tower Park Segmen 2 : Lagoon and Forest Park Segmen 3 : Old Down Town Segmen 4 : New Civic Center Segmen 5 : New Down Town Segmen 6 : Techno Park Segmen 7 : Housing Park Segmen 8 : Small Paradise
Reclaimed area that would serve as new investment zone, equipped
with modern infrastructures
Located 7.5 km along Jl. Jend Sudirman (Semayang Sea Port –
SAMS Sepinggan International Airport), 200-500 m from lowest tide.
Covers 329 Ha.
Estimated amount of investment: Rp 4,957 Trillion
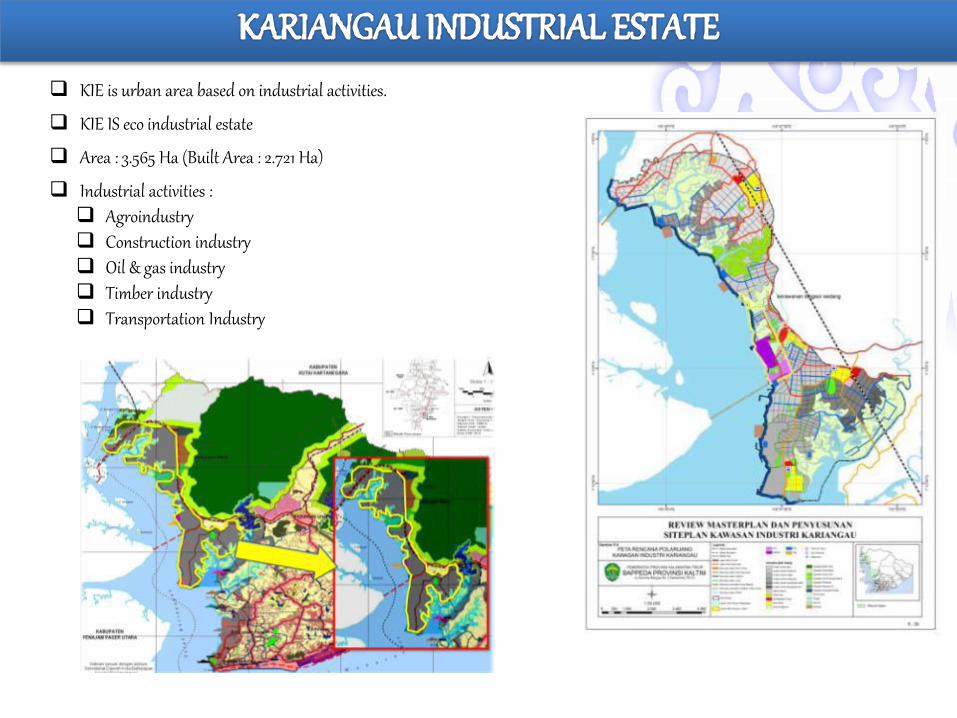
KIE is urban area based on industrial activities.
KIE IS eco industrial estate
Area : 3.565 Ha (Built Area : 2.721 Ha)
Industrial activities : Agroindustry Construction industry Oil & gas industry Timber industry Transportation Industry
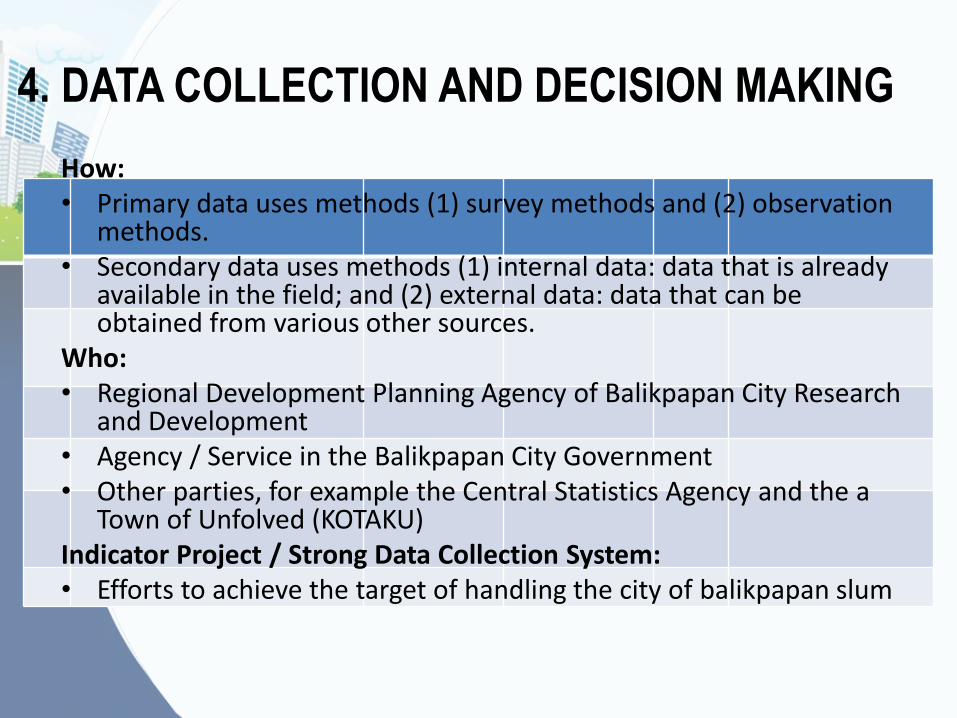
4. DATA COLLECTION AND DECISION MAKING
How: • Primary data uses methods (1) survey methods and (2) observation
methods. • Secondary data uses methods (1) internal data: data that is already
available in the field; and (2) external data: data that can be obtained from various other sources.
Who: • Regional Development Planning Agency of Balikpapan City Research
and Development • Agency / Service in the Balikpapan City Government • Other parties, for example the Central Statistics Agency and the a
Town of Unfolved (KOTAKU) Indicator Project / Strong Data Collection System: • Efforts to achieve the target of handling the city of balikpapan slum
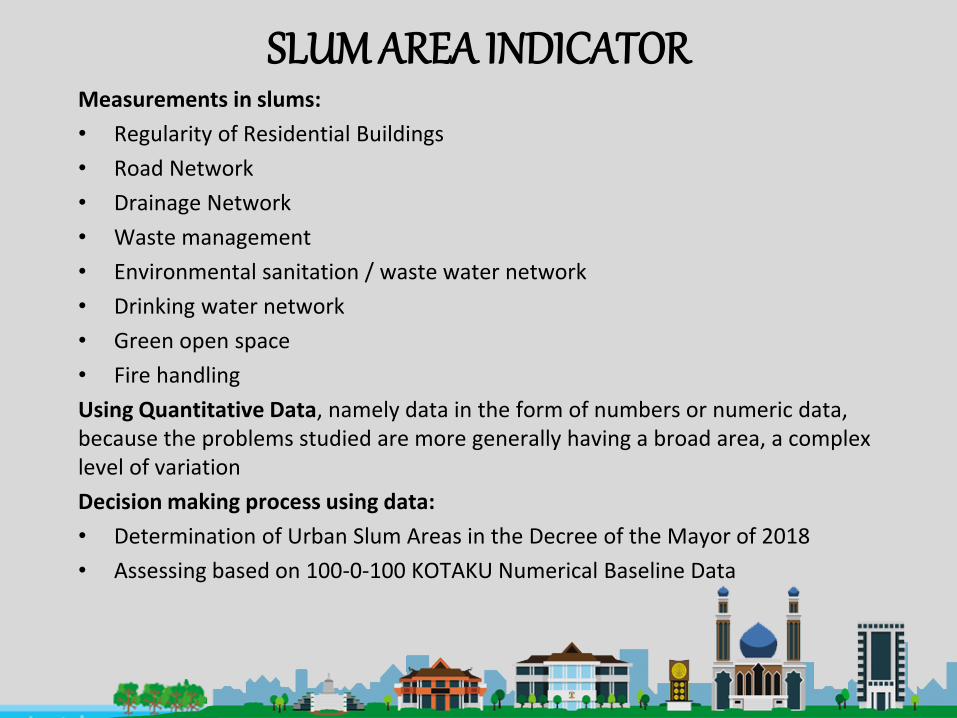
SLUM AREA INDICATOR Measurements in slums:
• Regularity of Residential Buildings
• Road Network
• Drainage Network
• Waste management
• Environmental sanitation / waste water network
• Drinking water network
• Green open space
• Fire handling
Using Quantitative Data, namely data in the form of numbers or numeric data, because the problems studied are more generally having a broad area, a complex level of variation
Decision making process using data:
• Determination of Urban Slum Areas in the Decree of the Mayor of 2018
• Assessing based on 100-0-100 KOTAKU Numerical Baseline Data
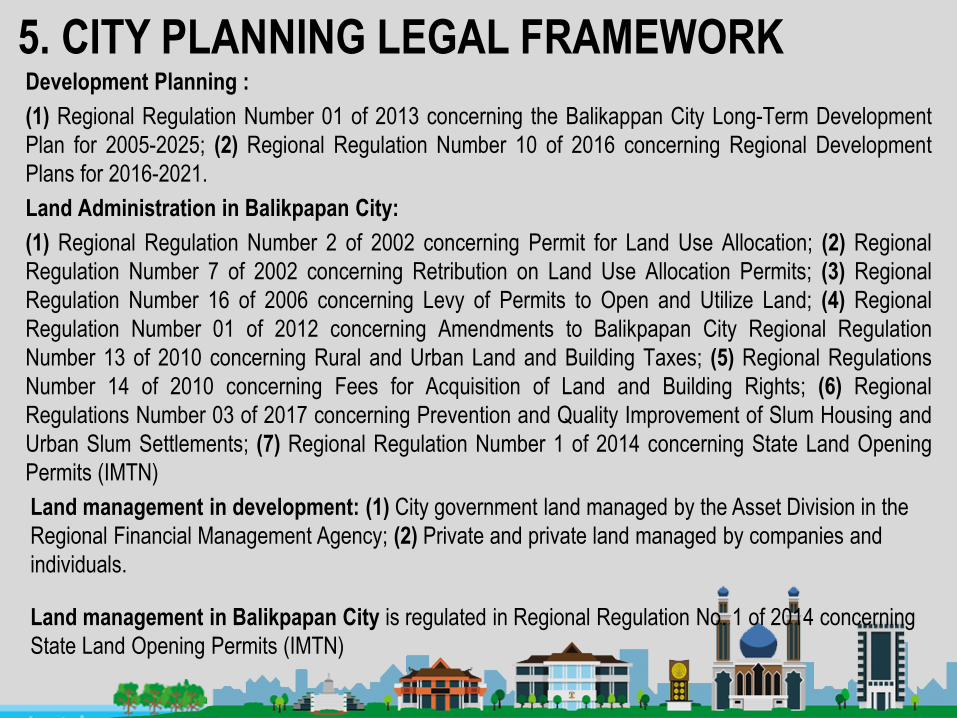
5. CITY PLANNING LEGAL FRAMEWORK Development Planning :
(1) Regional Regulation Number 01 of 2013 concerning the Balikappan City Long-Term Development
Plan for 2005-2025; (2) Regional Regulation Number 10 of 2016 concerning Regional Development
Plans for 2016-2021.
Land Administration in Balikpapan City:
(1) Regional Regulation Number 2 of 2002 concerning Permit for Land Use Allocation; (2) Regional
Regulation Number 7 of 2002 concerning Retribution on Land Use Allocation Permits; (3) Regional
Regulation Number 16 of 2006 concerning Levy of Permits to Open and Utilize Land; (4) Regional
Regulation Number 01 of 2012 concerning Amendments to Balikpapan City Regional Regulation
Number 13 of 2010 concerning Rural and Urban Land and Building Taxes; (5) Regional Regulations
Number 14 of 2010 concerning Fees for Acquisition of Land and Building Rights; (6) Regional
Regulations Number 03 of 2017 concerning Prevention and Quality Improvement of Slum Housing and
Urban Slum Settlements; (7) Regional Regulation Number 1 of 2014 concerning State Land Opening
Permits (IMTN)
Land management in development: (1) City government land managed by the Asset Division in the
Regional Financial Management Agency; (2) Private and private land managed by companies and
individuals.
Land management in Balikpapan City is regulated in Regional Regulation No. 1 of 2014 concerning
State Land Opening Permits (IMTN)
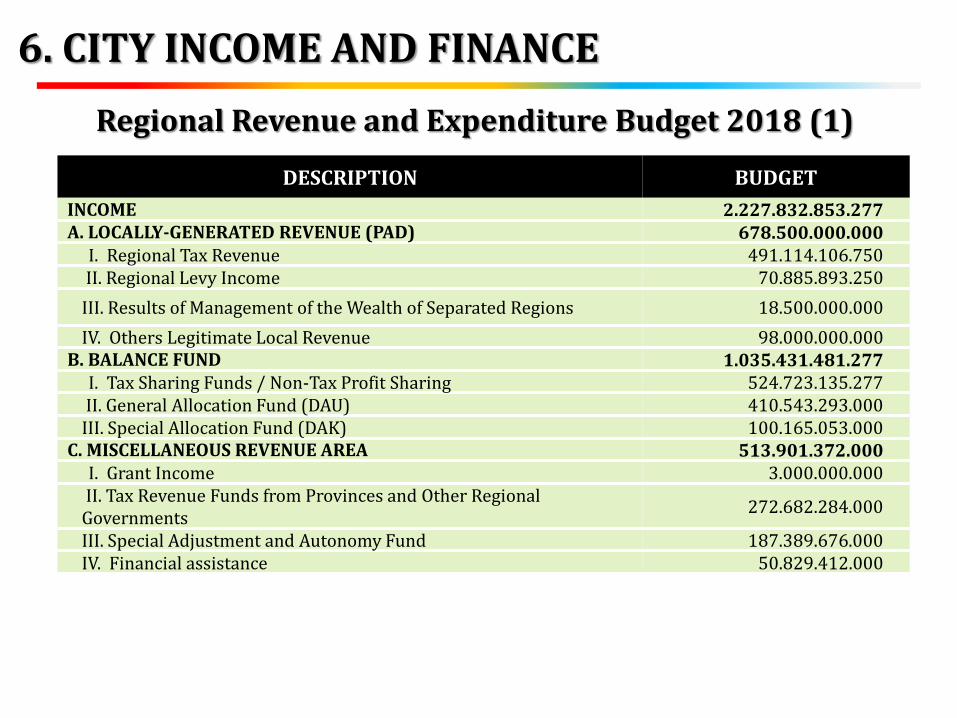
DESCRIPTION BUDGET
INCOME 2.227.832.853.277 A. LOCALLY-GENERATED REVENUE (PAD) 678.500.000.000
I. Regional Tax Revenue 491.114.106.750 II. Regional Levy Income 70.885.893.250
III. Results of Management of the Wealth of Separated Regions 18.500.000.000
IV. Others Legitimate Local Revenue 98.000.000.000 B. BALANCE FUND 1.035.431.481.277
I. Tax Sharing Funds / Non-Tax Profit Sharing 524.723.135.277 II. General Allocation Fund (DAU) 410.543.293.000 III. Special Allocation Fund (DAK) 100.165.053.000
C. MISCELLANEOUS REVENUE AREA 513.901.372.000 I. Grant Income 3.000.000.000
II. Tax Revenue Funds from Provinces and Other Regional Governments
272.682.284.000
III. Special Adjustment and Autonomy Fund 187.389.676.000 IV. Financial assistance 50.829.412.000
6. CITY INCOME AND FINANCE
Regional Revenue and Expenditure Budget 2018 (1)
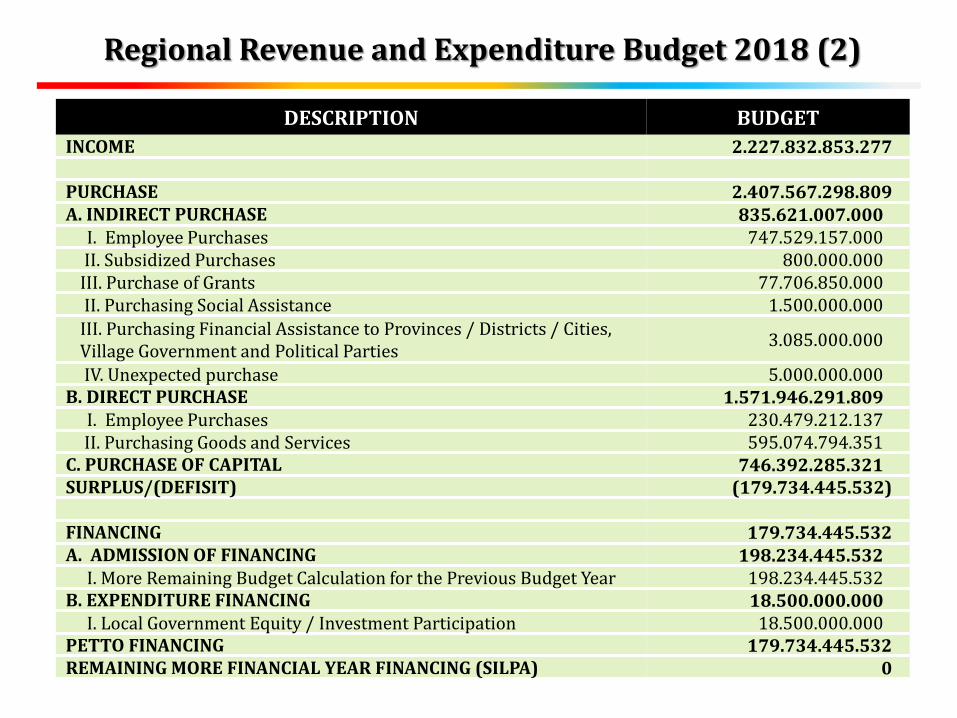
DESCRIPTION BUDGET
INCOME 2.227.832.853.277
PURCHASE 2.407.567.298.809 A. INDIRECT PURCHASE 835.621.007.000
I. Employee Purchases 747.529.157.000 II. Subsidized Purchases 800.000.000 III. Purchase of Grants 77.706.850.000 II. Purchasing Social Assistance 1.500.000.000
III. Purchasing Financial Assistance to Provinces / Districts / Cities, Village Government and Political Parties
3.085.000.000
IV. Unexpected purchase 5.000.000.000 B. DIRECT PURCHASE 1.571.946.291.809
I. Employee Purchases 230.479.212.137 II. Purchasing Goods and Services 595.074.794.351
C. PURCHASE OF CAPITAL 746.392.285.321 SURPLUS/(DEFISIT) (179.734.445.532)
FINANCING 179.734.445.532 A. ADMISSION OF FINANCING 198.234.445.532
I. More Remaining Budget Calculation for the Previous Budget Year 198.234.445.532 B. EXPENDITURE FINANCING 18.500.000.000
I. Local Government Equity / Investment Participation 18.500.000.000 PETTO FINANCING 179.734.445.532 REMAINING MORE FINANCIAL YEAR FINANCING (SILPA) 0
Regional Revenue and Expenditure Budget 2018 (2)
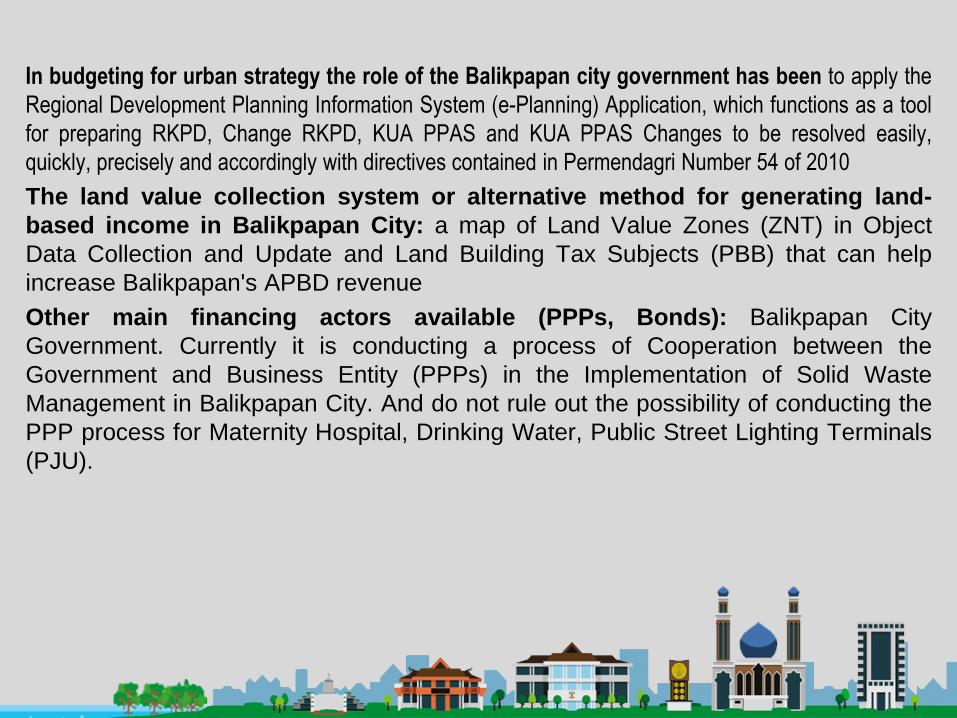
In budgeting for urban strategy the role of the Balikpapan city government has been to apply the
Regional Development Planning Information System (e-Planning) Application, which functions as a tool
for preparing RKPD, Change RKPD, KUA PPAS and KUA PPAS Changes to be resolved easily,
quickly, precisely and accordingly with directives contained in Permendagri Number 54 of 2010
The land value collection system or alternative method for generating land-
based income in Balikpapan City: a map of Land Value Zones (ZNT) in Object
Data Collection and Update and Land Building Tax Subjects (PBB) that can help
increase Balikpapan's APBD revenue
Other main financing actors available (PPPs, Bonds): Balikpapan City
Government. Currently it is conducting a process of Cooperation between the
Government and Business Entity (PPPs) in the Implementation of Solid Waste
Management in Balikpapan City. And do not rule out the possibility of conducting the
PPP process for Maternity Hospital, Drinking Water, Public Street Lighting Terminals
(PJU).

Actors who play a role in planning the government of Balikpapan City are the Regional Development Planning,
Research and Development Agency (Bappedalitbang) as the coordinator in planning and technical guidance to the
local government apparatus in the implementation of the supporting functions of the planning and research and
development fields.
The National Development Planning System includes 5 (five) approaches in the whole set of planning:
1. Political; carried out based on development programs offered by each candidate for Regional Head;
2. Technocratic; carried out using the method and framework of scientific thinking by the institution or Regional
Work Unit that is functionally assigned to it;
3. Participatory; carried out by involving all interested parties (stakeholders) towards development.
4. Top-down; produced through the Aspiration Selection Method which is harmonized through the Development
Planning musrenbang (musrenbang)
5. Bottom-up; produced through the Aspiration Selection Method which is harmonized through the Development
Planning musrenbang (musrenbang)
Residents and urban stakeholders are involved in the Bottom-Up planning process
The scale of the planned development project is still on a local scale with reference to national government
regulations
7. INSTITUTIONAL ARRANGEMENTS

BAPPEDALITBANG 2018