Embed Size (px)
Citation preview

Government of Malawi Department of Fisheries
Analysis of Catch and Effort Data for the Fisheries of Nkhotakota 1976-1999.
R.D. Sipawe, W. Namoto & O.C. Mponda
Fisheries Research Unit P.O. Box 27 Monkey Bay
Fisheries Bulletin No. 50 Department of Fisheries P.O. Box 593 Lilongwe
2001
1
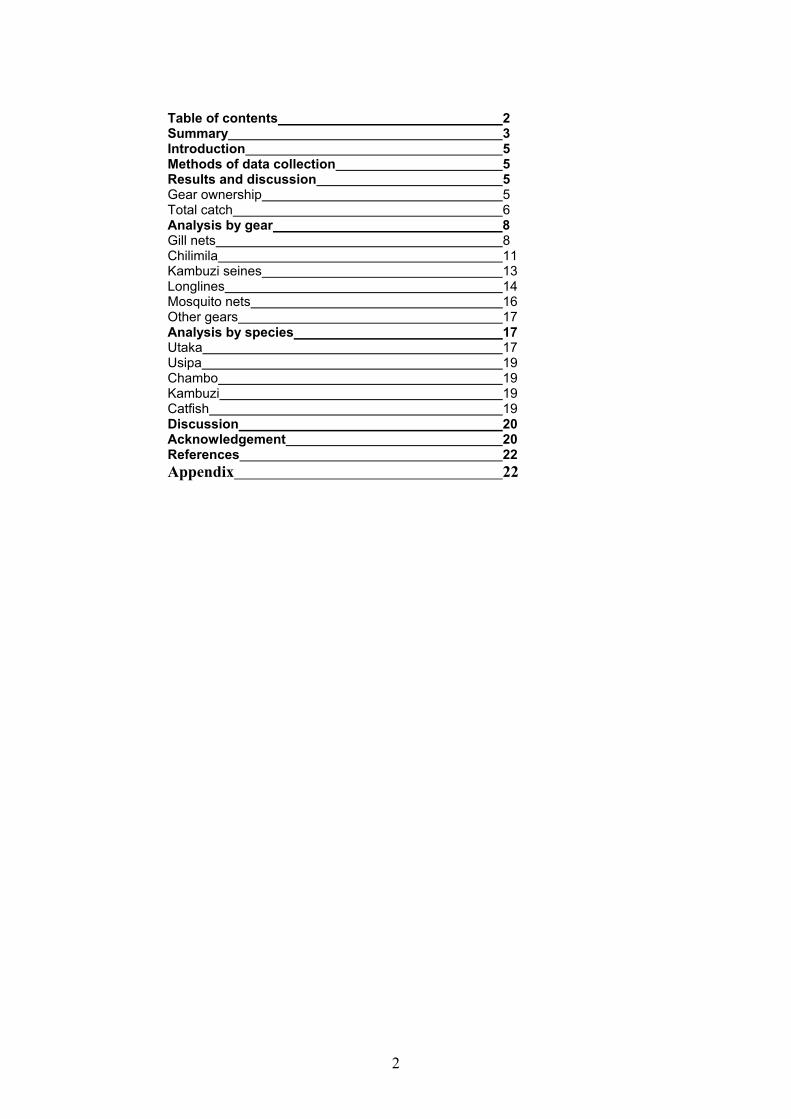
Table of contents 2 Summary 3 Introduction 5
Methods of data collection 5 Results and discussion 5 Gear ownership 5 Total catch 6
Analysis by gear 8 Gill nets 8 Chilimila 11 Kambuzi seines 13
Longlines 14 Mosquito nets 16 Other gears 17 Analysis by species 17 Utaka 17 Usipa 19 Chambo 19 Kambuzi 19 Catfish 19 Discussion 20 Acknowledgement 20 References 22 Appendix 22
2

Summary There has been an increase in the number of canoes and boats without engines in Nkhotakota even though the number of fishermen has remained fairly stable, indicating a possible multiple gear ownership. The number of gill nets has increased significantly over the years. Other gears have either remained stable, as is the case with chilimira nets or have actually declined, as is the case with longlines and kambuzi seines. Fishing effort has increased significantly in all the main fisheries except in the mosquito net fishery. The increase in effort in the chilimira fishery has caused a corresponding increase in catches over the years. This is not the case with gill nets where the increase in effort has not resulted in a corresponding increase in catches. It was not possible to come up with estimates of Maximum Sustainable Yield (MSY) as the large fluctuations exhibited in the catch and effort data for Nkhotakota prevented the use of The Fox (Fox 1970) and Schaefer (Graham 1935) models. As a result, it is not possible at the moment to propose any management strategy for the fishery of Nkhotakota. However, the fishery seems to be in a good state as is evident by increasing catches in most fisheries except for the mosquito net fishery.
3
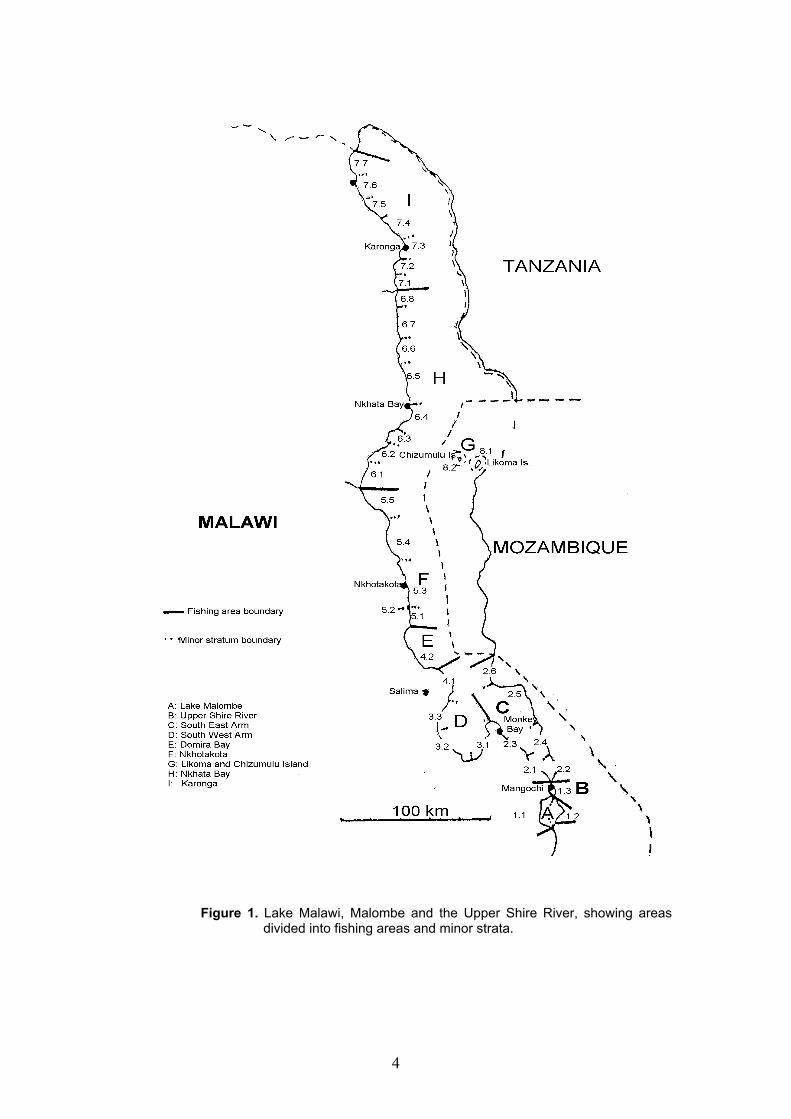
Figure 1. Lake Malawi, Malombe and the Upper Shire River, showing areas
divided into fishing areas and minor strata.
4
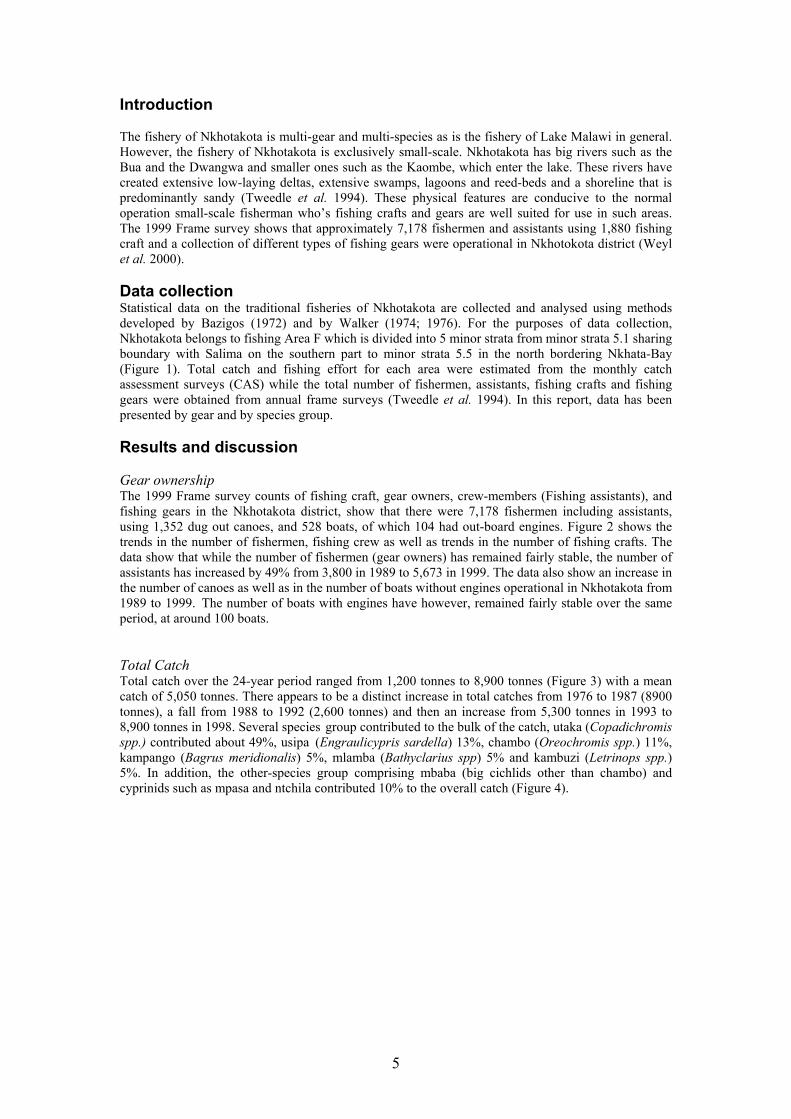
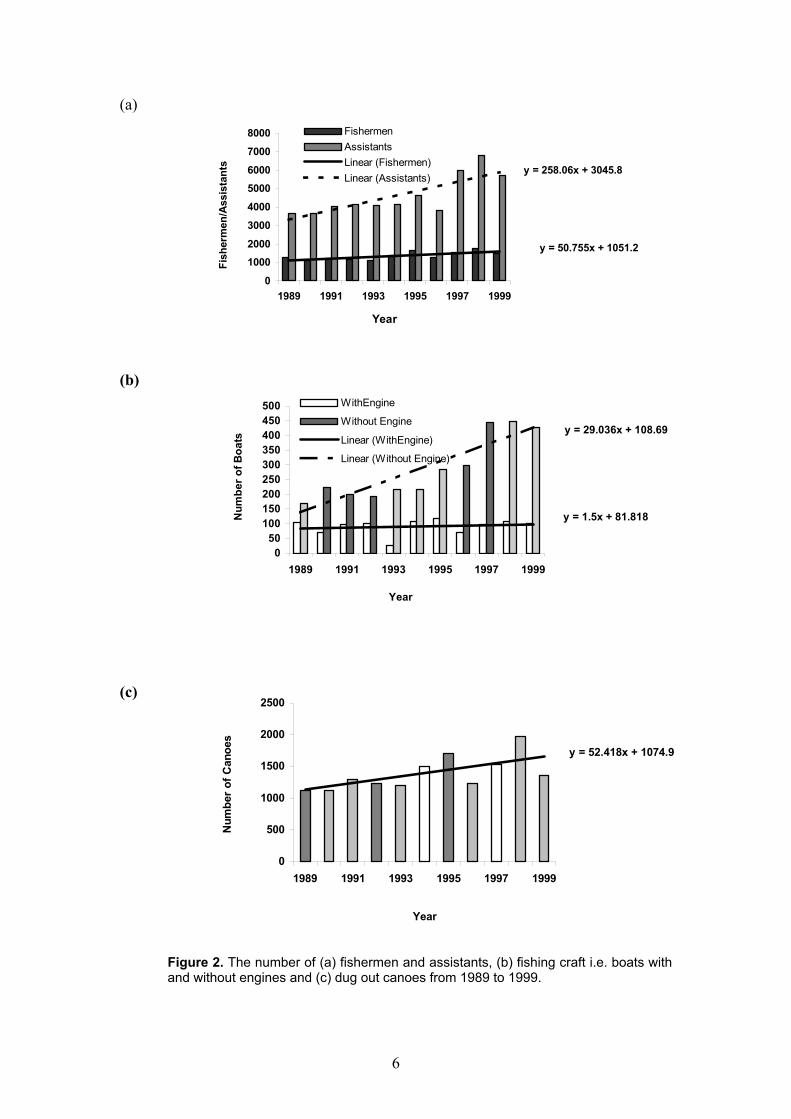
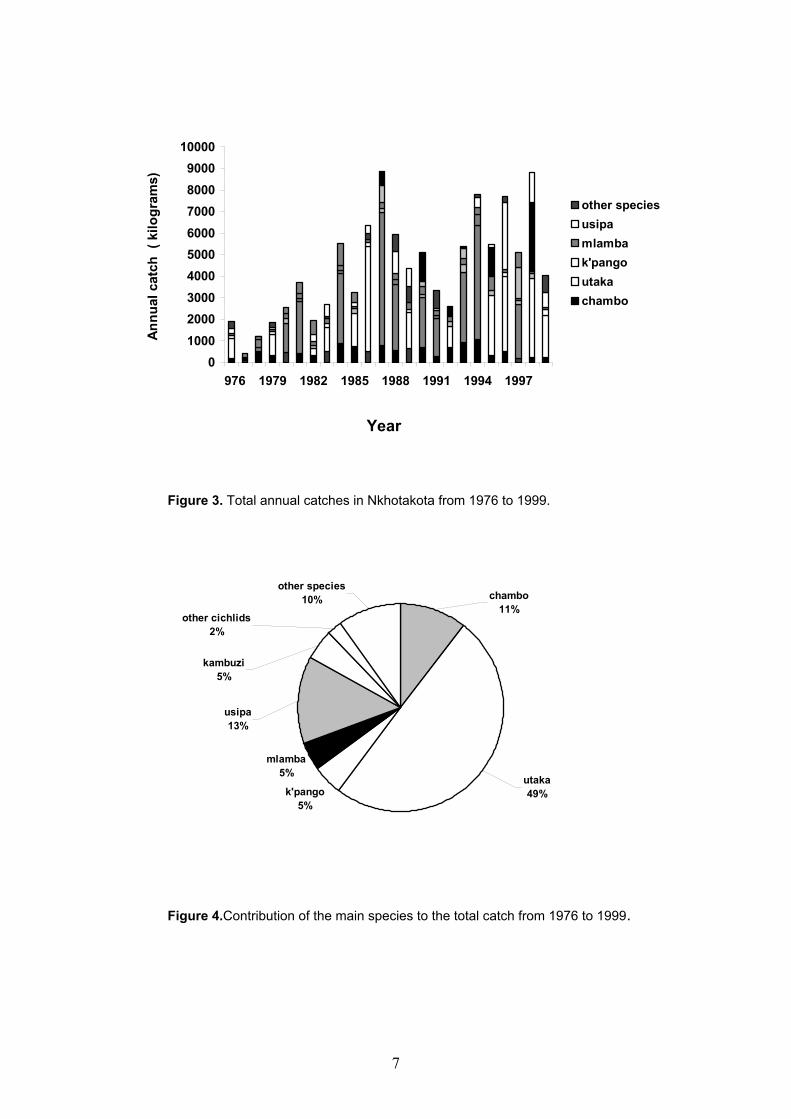
Introduction The fishery of Nkhotakota is multi-gear and multi-species as is the fishery of Lake Malawi in general. However, the fishery of Nkhotakota is exclusively small-scale. Nkhotakota has big rivers such as the Bua and the Dwangwa and smaller ones such as the Kaombe, which enter the lake. These rivers have created extensive low-laying deltas, extensive swamps, lagoons and reed-beds and a shoreline that is predominantly sandy (Tweedle et al. 1994). These physical features are conducive to the normal operation small-scale fisherman who’s fishing crafts and gears are well suited for use in such areas. The 1999 Frame survey shows that approximately 7,178 fishermen and assistants using 1,880 fishing craft and a collection of different types of fishing gears were operational in Nkhotokota district (Weyl et al. 2000). Data collection Statistical data on the traditional fisheries of Nkhotakota are collected and analysed using methods developed by Bazigos (1972) and by Walker (1974; 1976). For the purposes of data collection, Nkhotakota belongs to fishing Area F which is divided into 5 minor strata from minor strata 5.1 sharing boundary with Salima on the southern part to minor strata 5.5 in the north bordering Nkhata-Bay (Figure 1). Total catch and fishing effort for each area were estimated from the monthly catch assessment surveys (CAS) while the total number of fishermen, assistants, fishing crafts and fishing gears were obtained from annual frame surveys (Tweedle et al. 1994). In this report, data has been presented by gear and by species group. Results and discussion Gear ownership The 1999 Frame survey counts of fishing craft, gear owners, crew-members (Fishing assistants), and fishing gears in the Nkhotakota district, show that there were 7,178 fishermen including assistants, using 1,352 dug out canoes, and 528 boats, of which 104 had out-board engines. Figure 2 shows the trends in the number of fishermen, fishing crew as well as trends in the number of fishing crafts. The data show that while the number of fishermen (gear owners) has remained fairly stable, the number of assistants has increased by 49% from 3,800 in 1989 to 5,673 in 1999. The data also show an increase in the number of canoes as well as in the number of boats without engines operational in Nkhotakota from 1989 to 1999. The number of boats with engines have however, remained fairly stable over the same period, at around 100 boats. Total Catch Total catch over the 24-year period ranged from 1,200 tonnes to 8,900 tonnes (Figure 3) with a mean catch of 5,050 tonnes. There appears to be a distinct increase in total catches from 1976 to 1987 (8900 tonnes), a fall from 1988 to 1992 (2,600 tonnes) and then an increase from 5,300 tonnes in 1993 to 8,900 tonnes in 1998. Several species group contributed to the bulk of the catch, utaka (Copadichromis spp.) contributed about 49%, usipa (Engraulicypris sardella) 13%, chambo (Oreochromis spp.) 11%, kampango (Bagrus meridionalis) 5%, mlamba (Bathyclarius spp) 5% and kambuzi (Letrinops spp.) 5%. In addition, the other-species group comprising mbaba (big cichlids other than chambo) and cyprinids such as mpasa and ntchila contributed 10% to the overall catch (Figure 4).
5
(a)
y = 50.755x + 1051.2
y = 258.06x + 3045.8
0
10002000
3000
4000
50006000
7000
8000
1989 1991 1993 1995 1997 1999
Year
Fish
erm
en/A
ssis
tant
s
FishermenAssistantsLinear (Fishermen)Linear (Assistants)
(b)
y = 1.5x + 81.818
y = 29.036x + 108.69
050
100150200250300350400450500
1989 1991 1993 1995 1997 1999
Year
Num
ber o
f Boa
ts
WithEngine
Without Engine
Linear (WithEngine)
Linear (Without Engine)
(c)
y = 52.418x + 1074.9
0
500
1000
1500
2000
2500
1989 1991 1993 1995 1997 1999
Year
Num
ber o
f Can
oes
Figure 2. The number of (a) fishermen and assistants, (b) fishing craft i.e. boats with and without engines and (c) dug out canoes from 1989 to 1999.
6
1
0100020003000400050006000700080009000
10000
976 1979 1982 1985 1988 1991 1994 1997
Year
Annu
al c
atch
( k
ilogr
ams)
other speciesusipamlambak'pangoutakachambo
Figure 3. Total annual catches in Nkhotakota from 1976 to 1999.
k'pango5%
mlamba5%
usipa13%
utaka49%
chambo11%
other species10%
other cichlids2%
kambuzi5%
Figure 4.Contribution of the main species to the total catch from 1976 to 1999.
7
Catch by Gear 1976-1999
Chilimira54%
Gillnet18%
Other gears6%
Longline6%
Kambuzi sie7%
Mosquito net9%
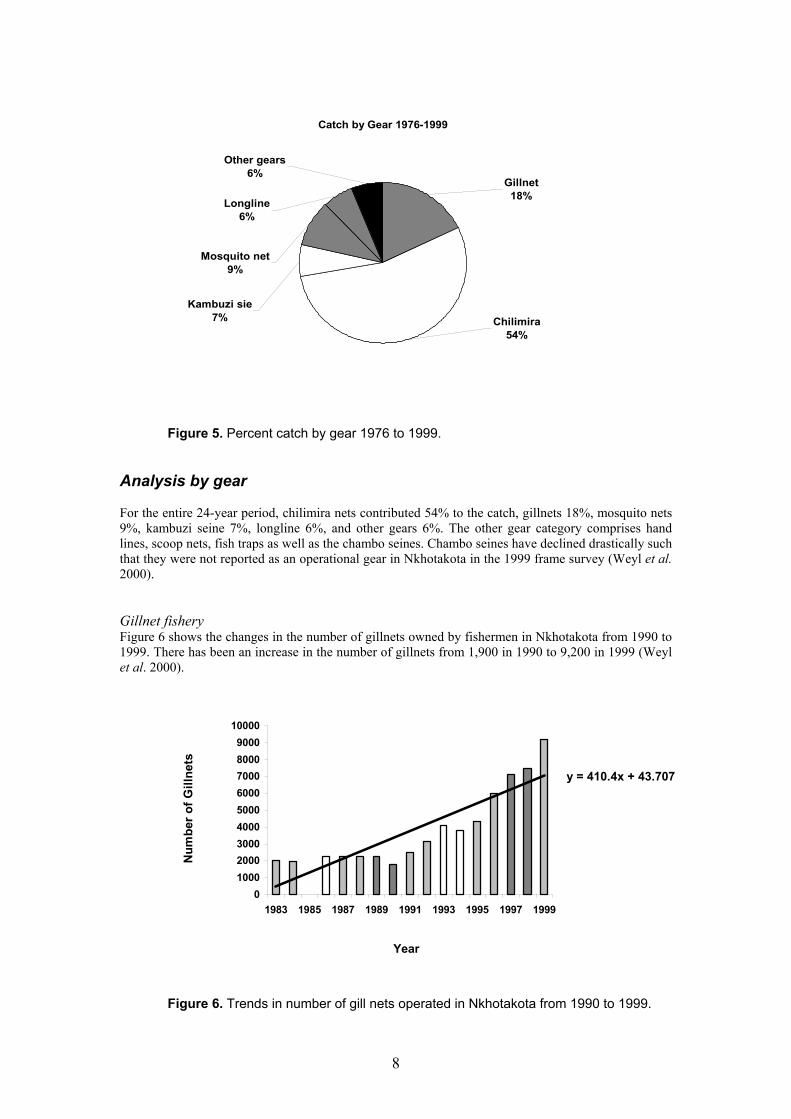
Figure 5. Percent catch by gear 1976 to 1999. Analysis by gear For the entire 24-year period, chilimira nets contributed 54% to the catch, gillnets 18%, mosquito nets 9%, kambuzi seine 7%, longline 6%, and other gears 6%. The other gear category comprises hand lines, scoop nets, fish traps as well as the chambo seines. Chambo seines have declined drastically such that they were not reported as an operational gear in Nkhotakota in the 1999 frame survey (Weyl et al. 2000). Gillnet fishery Figure 6 shows the changes in the number of gillnets owned by fishermen in Nkhotakota from 1990 to 1999. There has been an increase in the number of gillnets from 1,900 in 1990 to 9,200 in 1999 (Weyl et al. 2000).
y = 410.4x + 43.707
0100020003000400050006000700080009000
10000
1983 1985 1987 1989 1991 1993 1995 1997 1999
Year
Num
ber o
f Gill
nets
Figure 6. Trends in number of gill nets operated in Nkhotakota from 1990 to 1999.
8
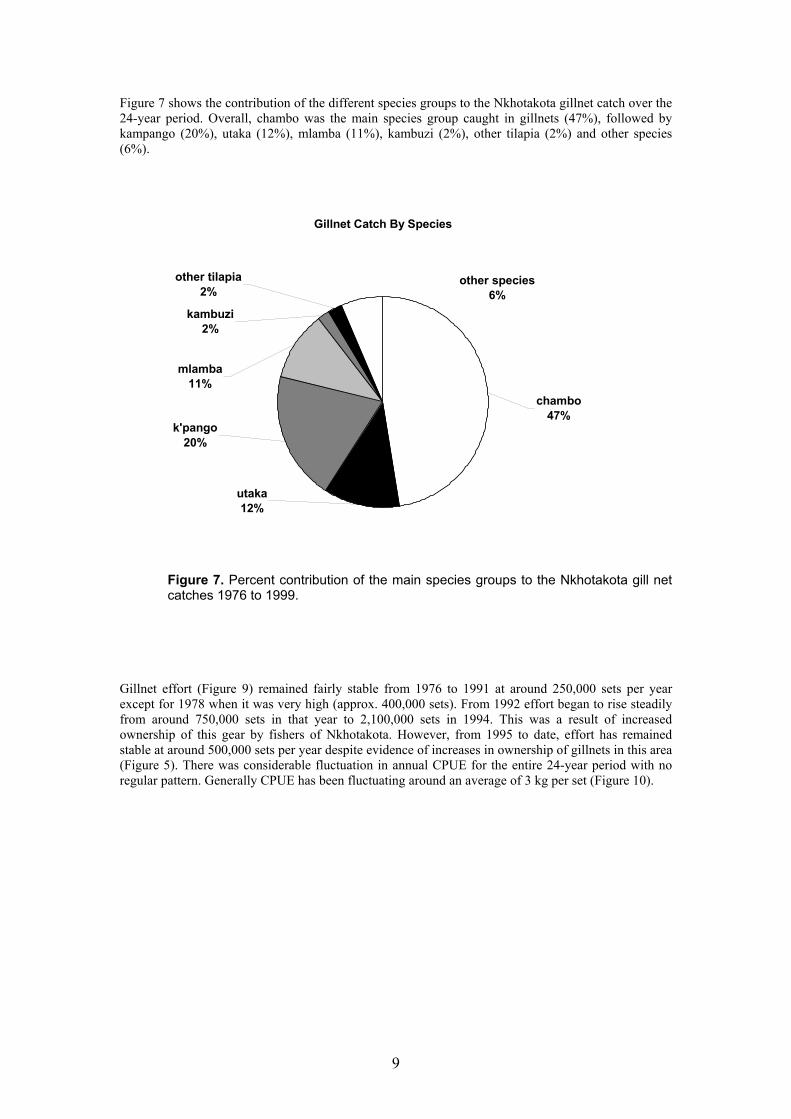
Figure 7 shows the contribution of the different species groups to the Nkhotakota gillnet catch over the 24-year period. Overall, chambo was the main species group caught in gillnets (47%), followed by kampango (20%), utaka (12%), mlamba (11%), kambuzi (2%), other tilapia (2%) and other species (6%). Gillnet Catch By Species
utaka12%
chambo47%
other species6%
other tilapia2%
kambuzi2%
mlamba11%
k'pango20%
Figure 7. Percent contribution of the main species groups to the Nkhotakota gill net catches 1976 to 1999.
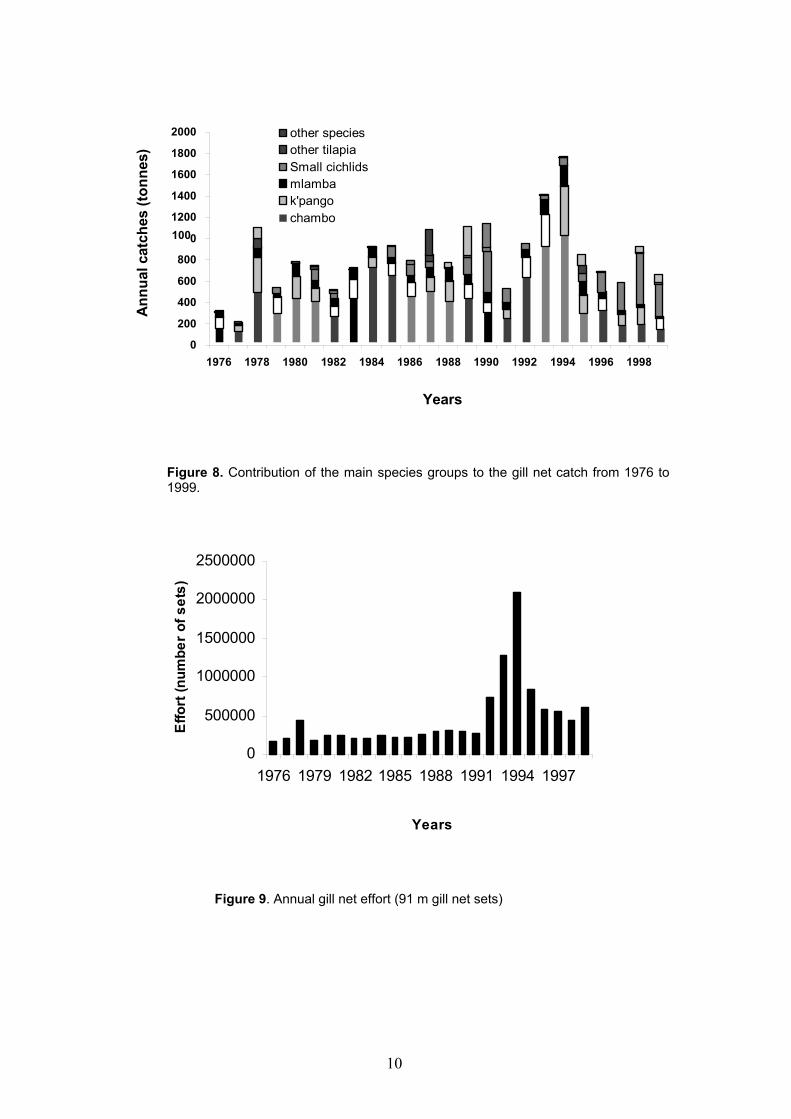
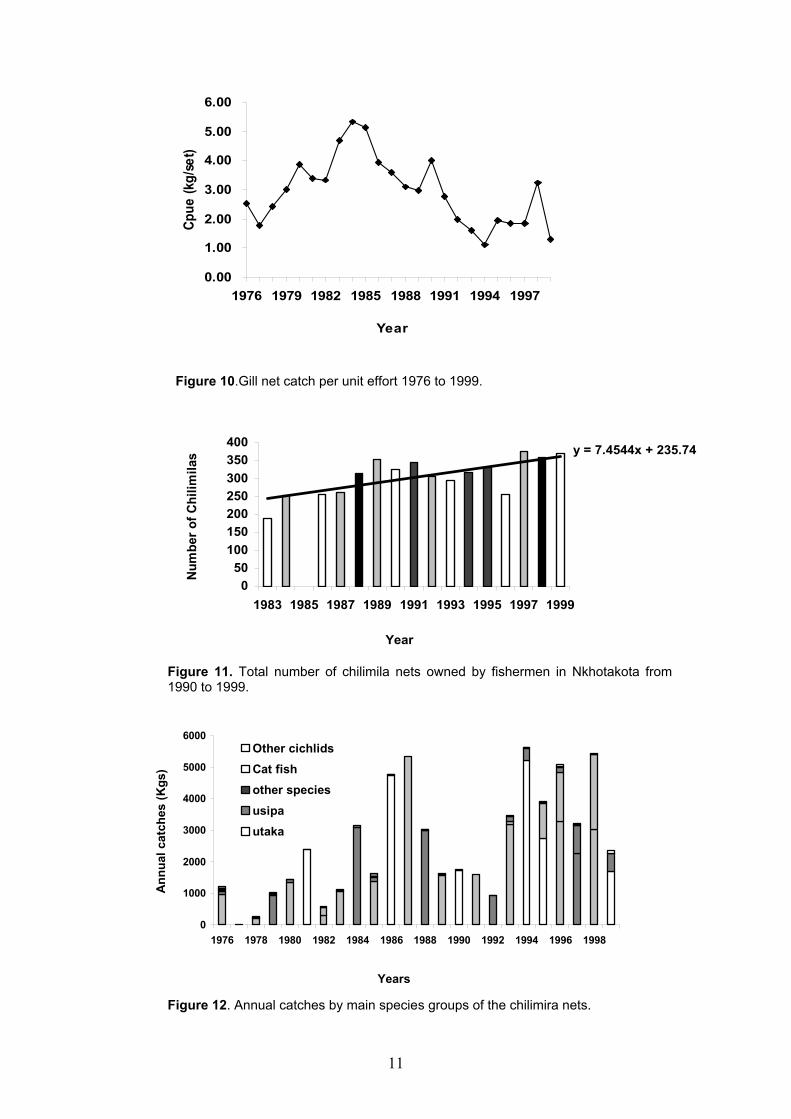
Gillnet effort (Figure 9) remained fairly stable from 1976 to 1991 at around 250,000 sets per year except for 1978 when it was very high (approx. 400,000 sets). From 1992 effort began to rise steadily from around 750,000 sets in that year to 2,100,000 sets in 1994. This was a result of increased ownership of this gear by fishers of Nkhotakota. However, from 1995 to date, effort has remained stable at around 500,000 sets per year despite evidence of increases in ownership of gillnets in this area (Figure 5). There was considerable fluctuation in annual CPUE for the entire 24-year period with no regular pattern. Generally CPUE has been fluctuating around an average of 3 kg per set (Figure 10).
9
100
0
200
400
600
800
0
1200
1400
1600
1800
2000
1976 1978 1980 1982 1984 1986 1988 1990 1992 1994 1996 1998
Years
Ann
ual c
atch
es (t
onne
s)other speciesother tilapiaSmall cichlidsmlambak'pangochambo
Figure 8. Contribution of the main species groups to the gill net catch from 1976 to 1999.
0
500000
1000000
1500000
2000000
2500000
1976 1979 1982 1985 1988 1991 1994 1997
Years
Effo
rt (n
umbe
r of
set
s)
Figure 9. Annual gill net effort (91 m gill net sets)
10
11
0
1000
2000
3000
4000
6000
1976 1978 1980 1982 1984 1986 1988 1990 1992 1994 1996 1998
Years
Ann
ual c
atch
es (K
gs)
Other cichlidsCat fishother speciesusipautaka
1976
0.00
1.00
2.00
3.00
4.00
5.00
6.00
1979 1982 1985 1988 1991 1994 1997
Year
Cpue
(kg/
set)
Figure 10.Gill net catch per unit effort 1976 to 1999. y = 7.4544x + 235.74
050
100150200250300350400
1983 1985 1987 1989 1991 1993 1995 1997 1999
Year
Num
ber o
f Chi
limila
s Figure 11. Total number of chilimila nets owned by fishermen in Nkhotakota from 1990 to 1999.
5000
Figure 12. Annual catches by main species groups of the chilimira nets.
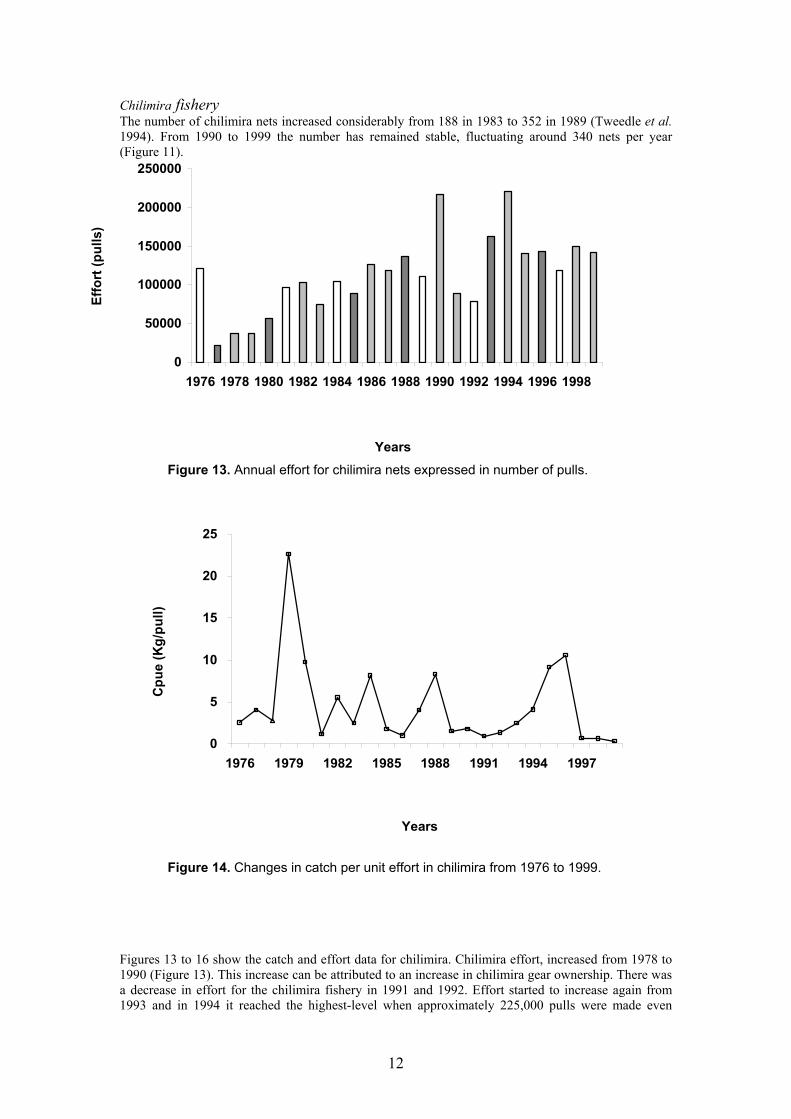
Chilimira fishery The number of chilimira nets increased considerably from 188 in 1983 to 352 in 1989 (Tweedle et al. 1994). From 1990 to 1999 the number has remained stable, fluctuating around 340 nets per year (Figure 11).
1978
0
50000
100000
150000
200000
250000
1976 1980 1982 1984 1986 1988 1990 1992 1994 1996 1998
Years
Effo
rt (p
ulls
)
Figure 13. Annual effort for chilimira nets expressed in number of pulls.
12
0
5
10
15
20
25
1976 1979 1982 1985 1988 1991 1994 1997
Years
Cpu
e (K
g/pu
ll)
Figure 14. Changes in catch per unit effort in chilimira from 1976 to 1999.
Figures 13 to 16 show the catch and effort data for chilimira. Chilimira effort, increased from 1978 to 1990 (Figure 13). This increase can be attributed to an increase in chilimira gear ownership. There was a decrease in effort for the chilimira fishery in 1991 and 1992. Effort started to increase again from 1993 and in 1994 it reached the highest-level when approximately 225,000 pulls were made even
though the number of chilimira nets remained the same as the previous years (Figure 11). Chilimira catch increased significantly though in a fluctuating manner from 400 tonnes in 1978 to 5,389 tonnes in 1987. From 1988 catches started to decline until in 1992 when annual chilimira catch was below 1,000 tonnes. However, from 1993 onwards catches have fluctuated between 2,400 and 5,600 tonnes.
Other cichlids1%
other species1%
utaka86%
usipa12%
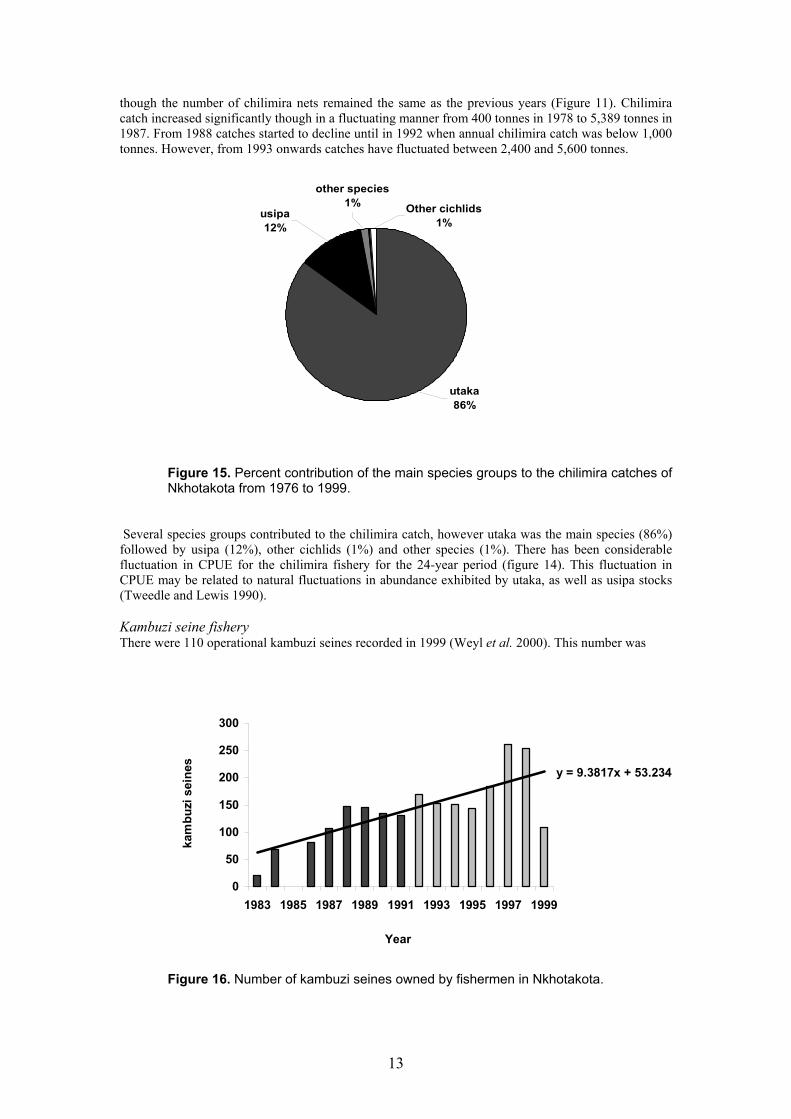
Figure 15. Percent contribution of the main species groups to the chilimira catches of Nkhotakota from 1976 to 1999.
Several species groups contributed to the chilimira catch, however utaka was the main species (86%) followed by usipa (12%), other cichlids (1%) and other species (1%). There has been considerable fluctuation in CPUE for the chilimira fishery for the 24-year period (figure 14). This fluctuation in CPUE may be related to natural fluctuations in abundance exhibited by utaka, as well as usipa stocks (Tweedle and Lewis 1990). Kambuzi seine fishery There were 110 operational kambuzi seines recorded in 1999 (Weyl et al. 2000). This number was
y = 9.3817x + 53.234
0
50
100
150
200
250
300
1983 1985 1987 1989 1991 1993 1995 1997 1999
Year
kam
buzi
sei
nes
Figure 16. Number of kambuzi seines owned by fishermen in Nkhotakota.
13
much lower than in the previous years (Figure 16) when the number of kambuzi seines increased to 250 seines in 1998 (Weyl et al, 2000). The low number of kambuzi seines recorded during the 1999 frame survey could have been due to recording error.
0.00
200.00
400.00
600.00
800.00
1000.00
1200.00
1976 1979 1982 1985 1988 1991 1994 1997
Year
Annu
al c
atch
(ton
nes)
other specieskambuziusipaO. cichlidsCatfishutaka
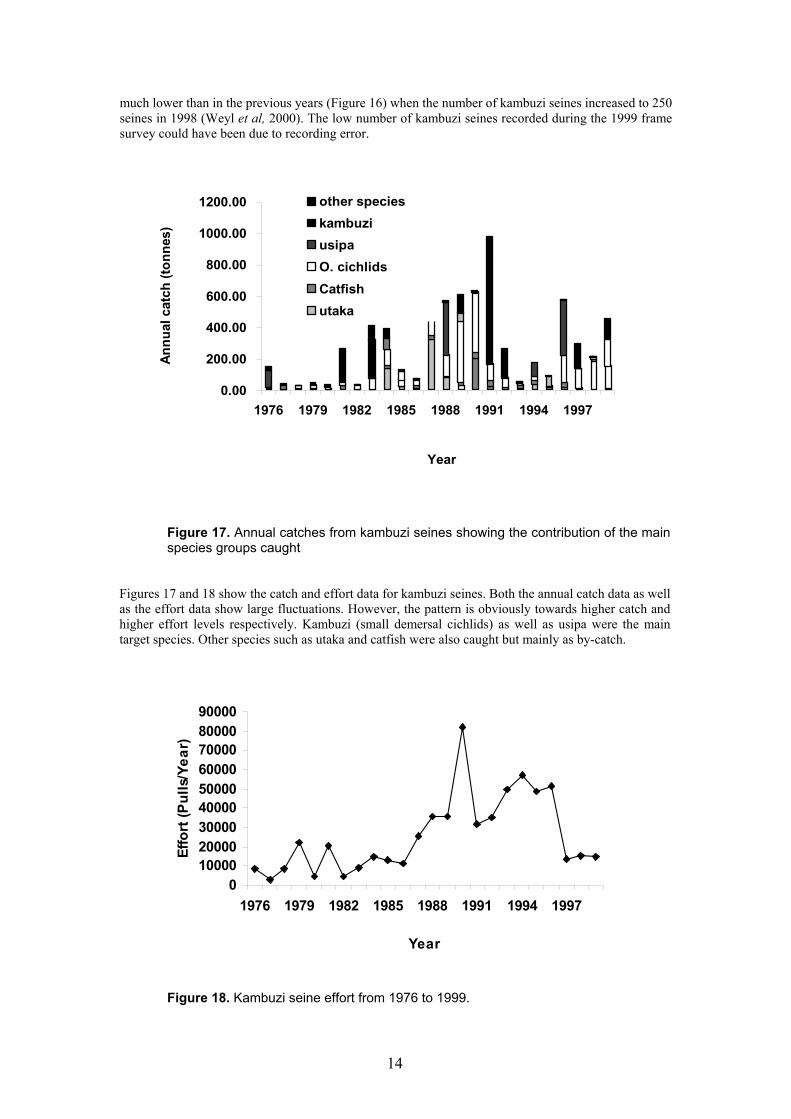
Figure 17. Annual catches from kambuzi seines showing the contribution of the main species groups caught
Figures 17 and 18 show the catch and effort data for kambuzi seines. Both the annual catch data as well as the effort data show large fluctuations. However, the pattern is obviously towards higher catch and higher effort levels respectively. Kambuzi (small demersal cichlids) as well as usipa were the main target species. Other species such as utaka and catfish were also caught but mainly as by-catch.
0100002000030000400005000060000700008000090000
1976 1979 1982 1985 1988 1991 1994 1997
Year
Effo
rt (P
ulls
/Yea
r)
Figure 18. Kambuzi seine effort from 1976 to 1999.
14
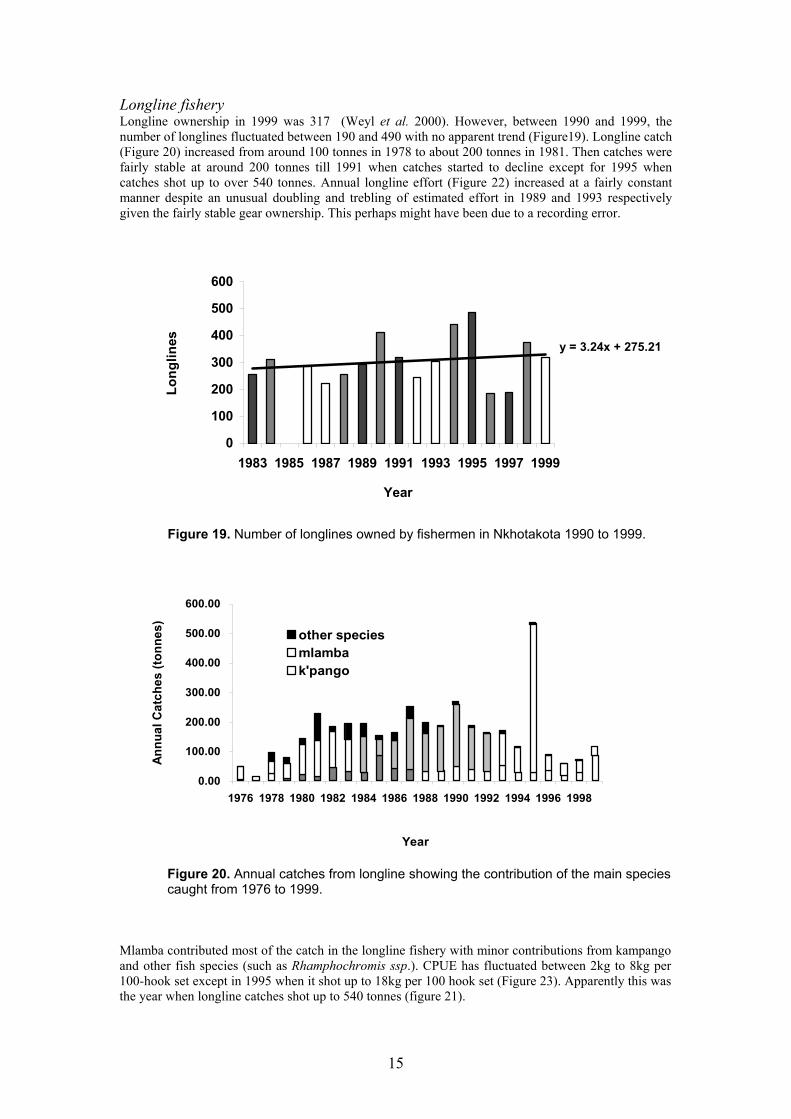
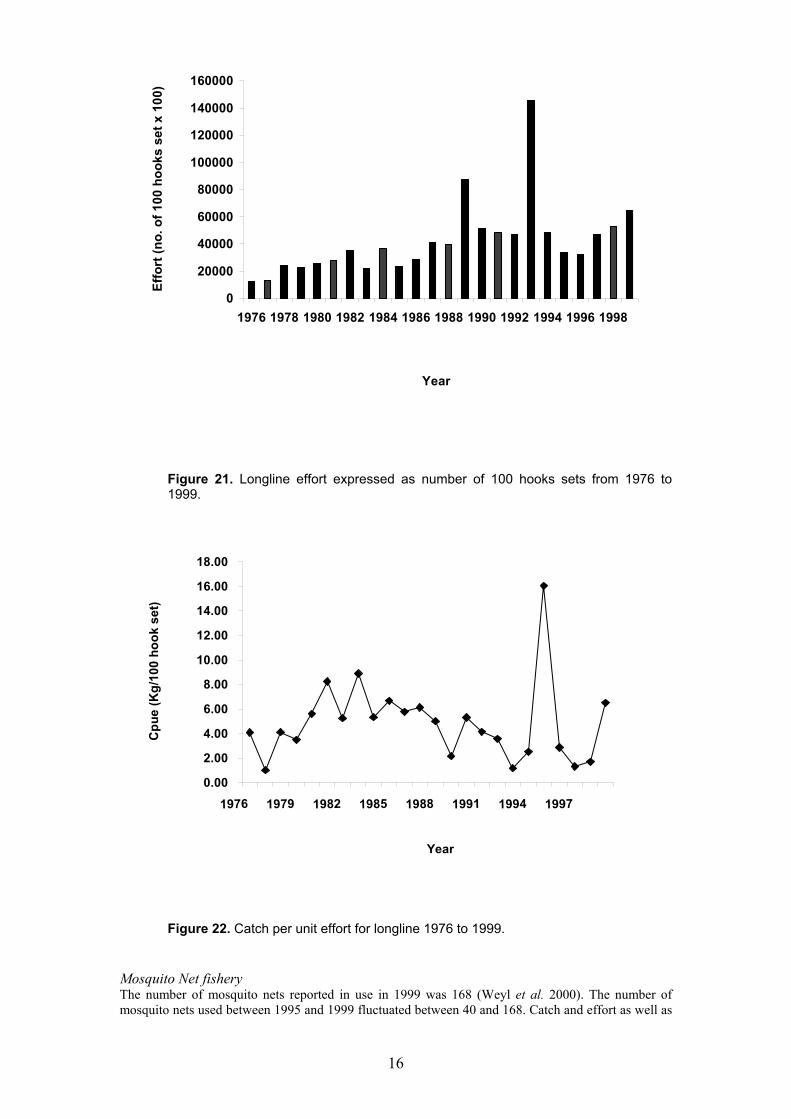
Longline fishery Longline ownership in 1999 was 317 (Weyl et al. 2000). However, between 1990 and 1999, the number of longlines fluctuated between 190 and 490 with no apparent trend (Figure19). Longline catch (Figure 20) increased from around 100 tonnes in 1978 to about 200 tonnes in 1981. Then catches were fairly stable at around 200 tonnes till 1991 when catches started to decline except for 1995 when catches shot up to over 540 tonnes. Annual longline effort (Figure 22) increased at a fairly constant manner despite an unusual doubling and trebling of estimated effort in 1989 and 1993 respectively given the fairly stable gear ownership. This perhaps might have been due to a recording error.
y = 3.24x + 275.21
0
100
200
300
400
500
600
1983 1985 1987 1989 1991 1993 1995 1997 1999
Year
Long
lines
Figure 19. Number of longlines owned by fishermen in Nkhotakota 1990 to 1999.
15
0.00
100.00
200.00
300.00
400.00
500.00
600.00
1976 1978 1980 1982 1984 1986 1988 1990 1992 1994 1996 1998
Year
Annu
al C
atch
es (t
onne
s) other speciesmlambak'pango
Figure 20. Annual catches from longline showing the contribution of the main species caught from 1976 to 1999.
Mlamba contributed most of the catch in the longline fishery with minor contributions from kampango and other fish species (such as Rhamphochromis ssp.). CPUE has fluctuated between 2kg to 8kg per 100-hook set except in 1995 when it shot up to 18kg per 100 hook set (Figure 23). Apparently this was the year when longline catches shot up to 540 tonnes (figure 21).
0
20000
40000
60000
80000
100000
120000
140000
160000
1976 1978 1980 1982 1984 1986 1988 1990 1992 1994 1996 1998
Year
Effo
rt (n
o. o
f 100
hoo
ks s
et x
100
)
Figure 21. Longline effort expressed as number of 100 hooks sets from 1976 to 1999.
0.00
2.00
4.00
6.00
8.00
10.00
12.00
14.00
16.00
18.00
1976 1979 1982 1985 1988 1991 1994 1997
Year
Cpu
e (K
g/10
0 ho
ok s
et)
Figure 22. Catch per unit effort for longline 1976 to 1999. Mosquito Net fishery The number of mosquito nets reported in use in 1999 was 168 (Weyl et al. 2000). The number of mosquito nets used between 1995 and 1999 fluctuated between 40 and 168. Catch and effort as well as
16
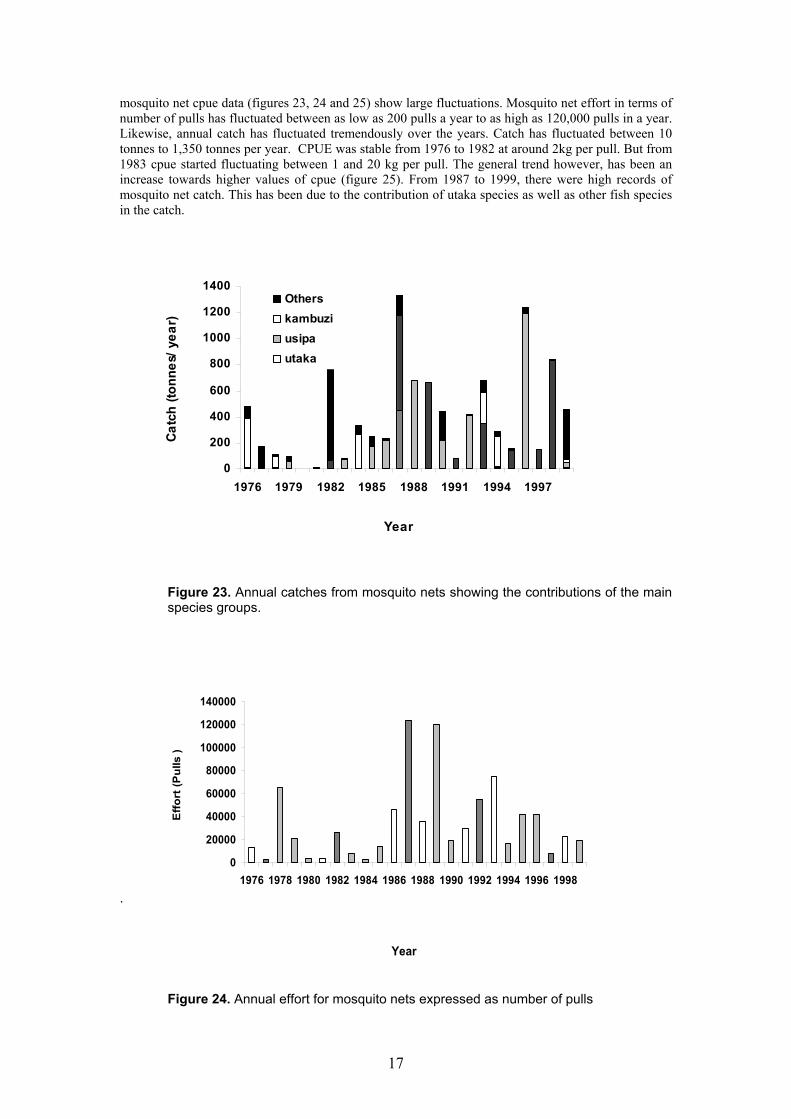
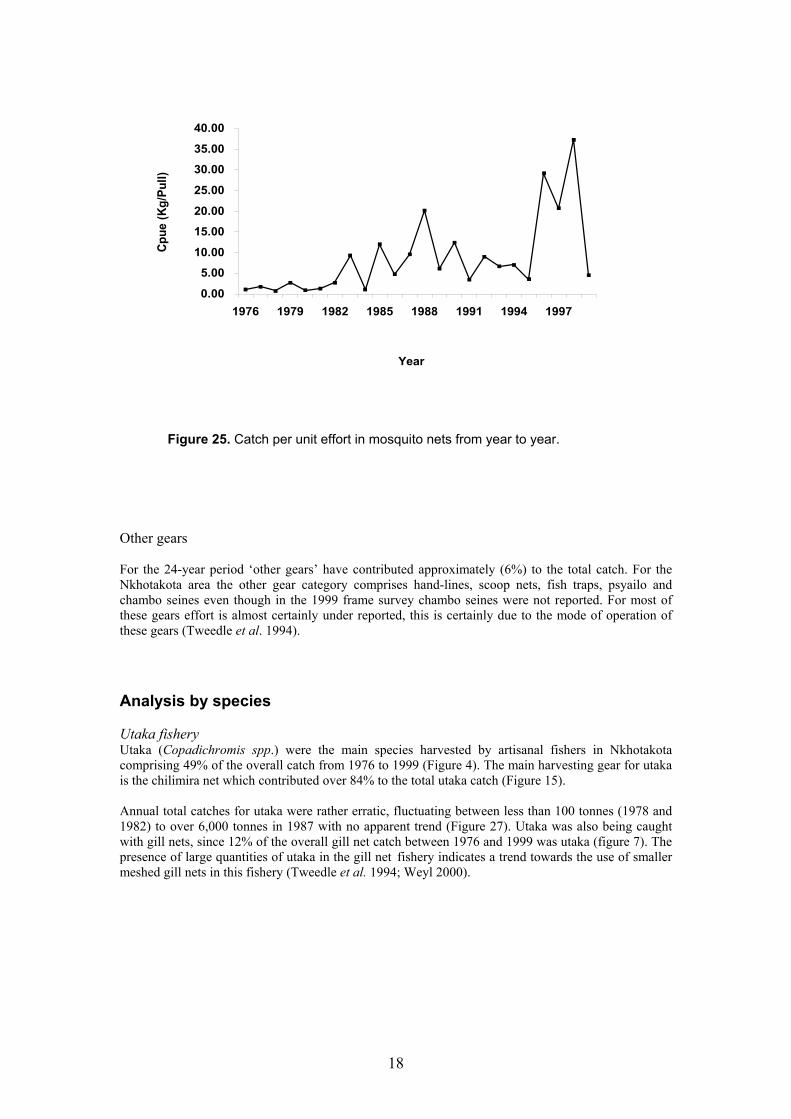
mosquito net cpue data (figures 23, 24 and 25) show large fluctuations. Mosquito net effort in terms of number of pulls has fluctuated between as low as 200 pulls a year to as high as 120,000 pulls in a year. Likewise, annual catch has fluctuated tremendously over the years. Catch has fluctuated between 10 tonnes to 1,350 tonnes per year. CPUE was stable from 1976 to 1982 at around 2kg per pull. But from 1983 cpue started fluctuating between 1 and 20 kg per pull. The general trend however, has been an increase towards higher values of cpue (figure 25). From 1987 to 1999, there were high records of mosquito net catch. This has been due to the contribution of utaka species as well as other fish species in the catch.
0
200
400
600
800
1000
1200
1400
1976 1979 1982 1985 1988 1991 1994 1997
Year
Catc
h (to
nnes
/ yea
r)
Otherskambuziusipautaka
Figure 23. Annual catches from mosquito nets showing the contributions of the main species groups.
17
0
20000
40000
60000
80000
100000
120000
140000
1976 1978 1980 1982 1984 1986 1988 1990 1992 1994 1996 1998
Year
Eff
ort (
Pul
ls )
.
Figure 24. Annual effort for mosquito nets expressed as number of pulls
0.00
5.00
10.00
15.00
20.00
25.00
30.00
35.00
40.00
1976 1979 1982 1985 1988 1991 1994 1997
Year
Cpue
(Kg/
Pull)
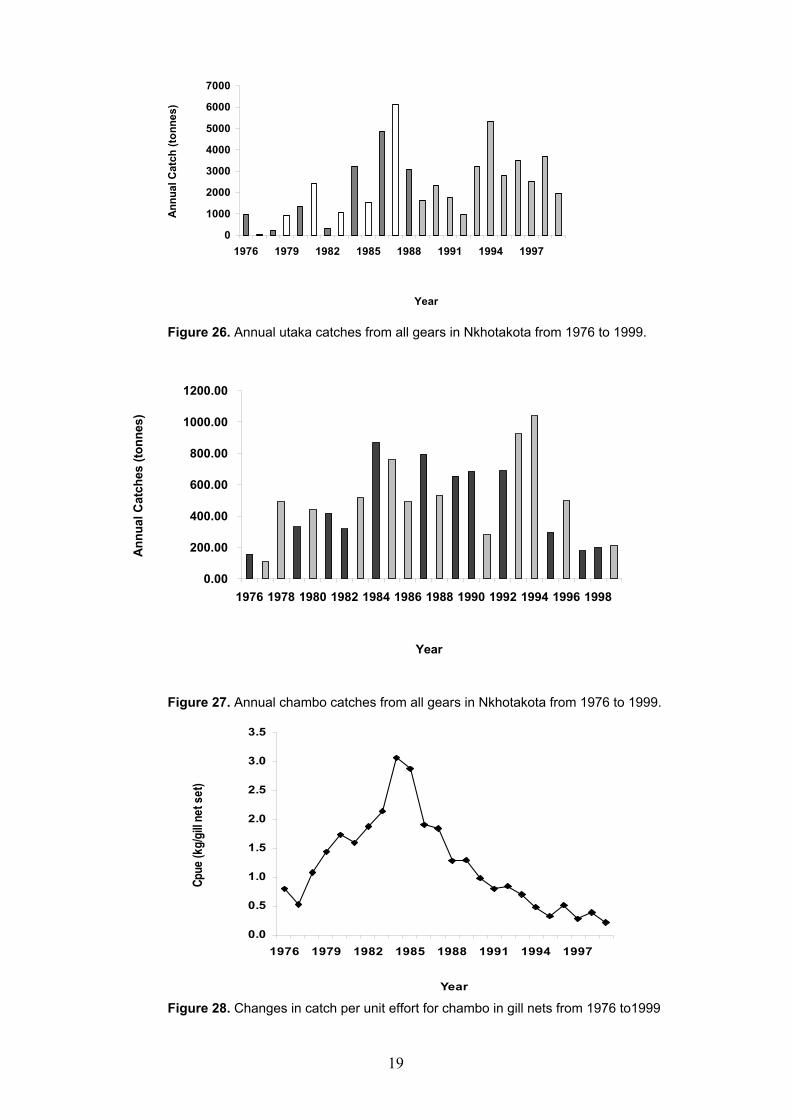
Figure 25. Catch per unit effort in mosquito nets from year to year. Other gears For the 24-year period ‘other gears’ have contributed approximately (6%) to the total catch. For the Nkhotakota area the other gear category comprises hand-lines, scoop nets, fish traps, psyailo and chambo seines even though in the 1999 frame survey chambo seines were not reported. For most of these gears effort is almost certainly under reported, this is certainly due to the mode of operation of these gears (Tweedle et al. 1994). Analysis by species Utaka fishery Utaka (Copadichromis spp.) were the main species harvested by artisanal fishers in Nkhotakota comprising 49% of the overall catch from 1976 to 1999 (Figure 4). The main harvesting gear for utaka is the chilimira net which contributed over 84% to the total utaka catch (Figure 15). Annual total catches for utaka were rather erratic, fluctuating between less than 100 tonnes (1978 and 1982) to over 6,000 tonnes in 1987 with no apparent trend (Figure 27). Utaka was also being caught with gill nets, since 12% of the overall gill net catch between 1976 and 1999 was utaka (figure 7). The presence of large quantities of utaka in the gill net fishery indicates a trend towards the use of smaller meshed gill nets in this fishery (Tweedle et al. 1994; Weyl 2000).
18
0
1000
2000
3000
4000
5000
6000
7000
1976 1979 1982 1985 1988 1991 1994 1997
Year
Annu
al C
atch
(ton
nes)
Figure 26. Annual utaka catches from all gears in Nkhotakota from 1976 to 1999.
0.00
200.00
400.00
600.00
800.00
1000.00
1200.00
1976 1978 1980 1982 1984 1986 1988 1990 1992 1994 1996 1998
Year
Annu
al C
atch
es (t
onne
s)
Figure 27. Annual chambo catches from all gears in Nkhotakota from 1976 to 1999.
0.0
0.5
1.0
1.5
2.0
2.5
3.0
3.5
1976 1979 1982 1985 1988 1991 1994 1997
Year
Cpue
(kg/
gill n
et s
et)
Figure 28. Changes in catch per unit effort for chambo in gill nets from 1976 to1999
19
Usipa fishery Usipa was the second in importance to utaka in overall catches in the area as it constituted 13% to the total catch from 1976 to 1999 (Figure 4). The main harvesting gears for usipa in Nkhotakota were chilimira nets and mosquito nets (Figure 13). Estimated annual usipa catches have been erratic ranging from 100 tonnes to more than 3,500 tonnes per annum. Despite strong fluctuations in catches, estimated annual catches from mid- to late 1990s were much higher than in the previous years. Mosquito net catches (Figure 24) and mosquito net cpue (Figure 26) appear to be highly erratic and as it is equally true with utaka, this fishery likely follows annual trends of stock abundance (Weyl 2001). Chambo fishery Chambo was the third important species harvested by Nkhotakota fishermen since it contributed about 11% to the total catch for the entire 24-year period (Figure 4). Gill nets were the main gear used to harvest this species as they have contributed approximately 47% to the overall catch (Figure 7). The chambo gill net catch has fluctuated. Catch has ranged as low as 100 tonnes per year to as high as 1,000 tonnes per year. From the late 1970s to the early 1990s catches were high but from the mid-1990s the catch has shown a declining trend from almost 1,000 tonnes to less than 200 tonnes per year (Figure 28). The high catches for chambo in 1992, 1993, and 1994 (Figure 8 and Figure 28) can be explained by the high levels in the gillnet effort expended (Figure 9) and not necessarily a boost in gear ownership (Figure 6). The apparent decline in total catches being experienced from the mid-1990s is due to a decline in CPUE for the gillnets and not a reduction in effort since there is evidence of significant increase in gillnet ownership in Nkhotakota (Figure 6). Recent findings from some studies in the gillnet fishery of Nkhotakota have shown that reported levels of catch for chambo from gillnets are under-estimated. The current catch and effort statistics may only reflect the chambo catch from passive gillnets, which at the moment are losing popularity in Nkhotakota. Most gillnet fishermen in many important beaches in Nkhotakota have switched from using the old passive gillnets to chiombera gill nets which are actively fished. Catch in these active chiombera gillnets are high with CPUE values as high as 30 kg/set for 91m net (Banda and Sipawe, 2000). Kambuzi fishery The main harvesting gear for kambuzi in Nkhotakota is the kambuzi seine (figure 17) Kambuzi catch contributed only about 5% to the total catch for the entire 24-year period (Figure 4). The total annual catch for this species was very erratic over the entire 24-year period with very high peaks of total catch (above 200 tonnes) in 1976, 1984, 1993 and 1994. The other years had negligible catch levels (Figure 18). From the late 1980s kambuzi started appearing in the gillnet catches. This is clear evidence that small meshed gillnets are becoming common in the gillnet fishery (Tweedle et al. 1994). Catfish fishery For the entire 24-year period, catfish (kampango and mlamba) have contributed approximately 10% to the total catch (Figure 4). The catfish catch was fairly stable from 1978 to 1986 when it started to rise until 1995 when a decline in catch started to appear. Catfish were mainly caught in gillnets and in longlines. Kampango are mainly caught in gillnets while mlamba are mainly caught in longlines. The total catch for kampango in gillnets appears to be relatively stable in the region of 100 to 200 tonnes (Figure 8). Annual catch for mlamba from gillnets has remained fairly stable for most of the period at around less than 100 tonnes per year. In longline fishery, Kampango and mlamba catches have been fairly stable at around 50 tonnes or less for kampango and more than 100 tonnes for mlamba respectively. Longline effort (Figure 21) has remained fairly stable for the entire period. The high effort in 1989 and 1993 are probably outliers, as longline ownership has remained stable. Longline cpue has fluctuated between 2 and 8 kg/100hook set. The high CPUE value for 1995 resulted from the high catch in mlamba in the longline fishery. However, no proper explanation can be reached for this apparent deviation since there is no evidence that there was a tremendous increase in longline ownership in 1995 (Figure 19).
20
General discussion There has been an increase in the number of canoes and boats without engines from 1995 to 1999 though the number of fishermen (gear owners) has remained fairly stable over the same period. This may indicate multiple fishing craft ownership by many fishermen in Nkhotakota. It is worth pointing out that there has been a significant increase (p<0.05) in gill net ownership in Nkhotakota. Other gears have either remained stable, as was the case of chilimira or have actually declined, as was the case of longlines and kambuzi seines. Fishing effort has increased significantly (p<0.05) in all the main fisheries except in the mosquito net fishery where less than 2,000 pulls were made in the 1998-1999 seasons as opposed to over 6000 pulls in 1994. While the increase in effort in the chilimira fishery has caused a corresponding increase in the chilimira catches over the years, the increase in the number of gill nets being operated (which has increase effort), has not lead to a corresponding increase in gill net catches. Whether this result is a true reflection of what is really happening in the gill net fishery of Nkhotakota remains unclear. A preliminary study on the gill net fishery of Nkhotakota conducted from December 1999 to December 2000 indicated that more chambo is being caught from gill nets in Nkhotakota than what is being reported in the catch assessment surveys. During this survey, chiwombera gillnets, a popular type of modified gill nets in Nkhotakota registered very high chambo catches, with Cpue as high as 30 kg per fishing trip (Banda and Sipawe 2000). It is generally agreed that the accuracy of fisheries data in Malawi at the moment is questionable (Tweedle 1994, Weyl 1999). The large fluctuations exhibited in the catch and effort values for Nkhotakota negates the application of The Fox (Fox 1970) and Schaefer (Graham 1935) models. With this drawback, it is not possible to either recommend effort reduction or effort increase for the fisheries of Nkhotakota. Maintaining effort at the current level coupled with accurate data collection and reporting for three to four years will reveal whether it will be necessary to reduce or increase effort to a certain level where sustainable harvesting would be optimised. Acknowledgements Grateful thanks are due to Dr. O.L.F. Weyl, the Fisheries Research Adviser for his useful comments. I am also indebted to all my fellow researchers for their criticisms and comments.
21
References. Banda, M. C. and Sipawe, R. D. 2000. A preliminary investigation on the Chiombera gill net fishery of Nkhotakota. FRU Technical report. Bazigos, G.P. 1972. The design of fisheries statistical surveys-inland waters. FAO Fish. Tech. Pap. 133:122p. Tweedle, D., Alimoso, S.B., & Sodzapanja, G. 1994. Analysis of catch and effort data for the fisheries of Nkhotakota area-Lake Malawi 1976-1989. Government of Malawi, Fisheries Bulletin No. 11. Tweedle, D., and Lewis, D.S.C. 1990. The Biology of usipa (Engraulicypris sardella) in relation to fluctuation in productivity of Lake Malawi and species introductions. Collected reports on Fisheries Research in Malawi, Occasional papers, Vol. 1. ODA, London. Walker, R.S. (1974). Collection of catch assessment data in tropical fisheries (Inland waters)> Notes for Malawian Fisheries Dept. use, 6pp. Walker, R.S. (1976). Statistical studies of the traditional fisheries of Malawi: a final report prepared for Malawi Government. Rome, FAO. Weyl, O.L.F. 1999. Artisanal fishery catch assessment for the southeast arm of Lake Malawi 1994-1998. NARMAP Technical Report No.2 41p. Weyl, O.L.F., Banda, M.C., Sodzapanja, G. Mwenekiombwe, L.H., Namoto, W. and Mponda, O.C., 2000. Annual Frame Survey 1999. Malawi Government. Fisheries Bulletin No. 42. Weyl, O.L.F., Manase, M.M. and Banda M. 2000. Considerations for the management of the gillnet fishery of the Southeast arm of Lake Malawi. NARMAP Technical Report No.3.
22