Embed Size (px)
Citation preview

GOVERNMENT OF THE REPUBLIC OF ZAMBIAMINISTRY OF NATIONAL DEVELOPMENT PLANNING
National Investment Plan to Reduce Deforestation and Forest Degradation
Presented at the FIP Sub-Committee MeetingWashington D.C., 14th December 2017

Partners in the Development of the Investment Plan

NATIONAL CONTEXT
POPULATION
Population of 17 million.
Total land area 752,614Km²
60% live in rural areas
Rural poverty rates (70 percent) are double urban (35 percent)
Population growth: 2.8% per year
ECONOMY
GDP growth currently around 4%
Copper mining: 77% of exports.
Land-use change main source of GHG emissions at 61%
Forestry: 4.9% to GDP; but rises to 6.3% when tourism and NTFPs are considered.

Forest Cover:
Vegetation Type:
Plantations:
Deforestation rate
Drivers
49.9 million ha (66% of land cover)
Mainly Miombo woodlands: Semi-evergreen forests; Deciduous Forests; Evergreen forests; Shrub thickets, grasslands, wooded grasslands
61,000 ha
276,000 per annum
Unsustainable agricultural practices; Charcoal and wood fuel use; Timber production; Infrastructure development (includes mining)
Forest Resources

National Policy Frameworks
• Second National Biodiversity Strategy and Action Plan (NBSAP2, 2015)
• National Policy on Environment (NPE, 2007)• National Policy on Climate Change (NPCC,
2017)• National Climate Change Response Strategy
(NCCRS, 2012)• Zambia National Forest Policy (2014) and
Forests Act (2015)• National Agriculture Policy (NAP, 2016)• Environmental Management Act (EMA,
2011)• National Energy Policy (NEP, 2008)

National REDD+ Processes undertaken
National REDD+
Strategy
National Forest
Monitoring System
Safeguards Information
System
Forest Reference Emission
Level
4/CP.1512/CP.1713/CP.19
4/CP.1511/CP.19
1/CP.1615/CP.19
12/CP.1712/CP.19
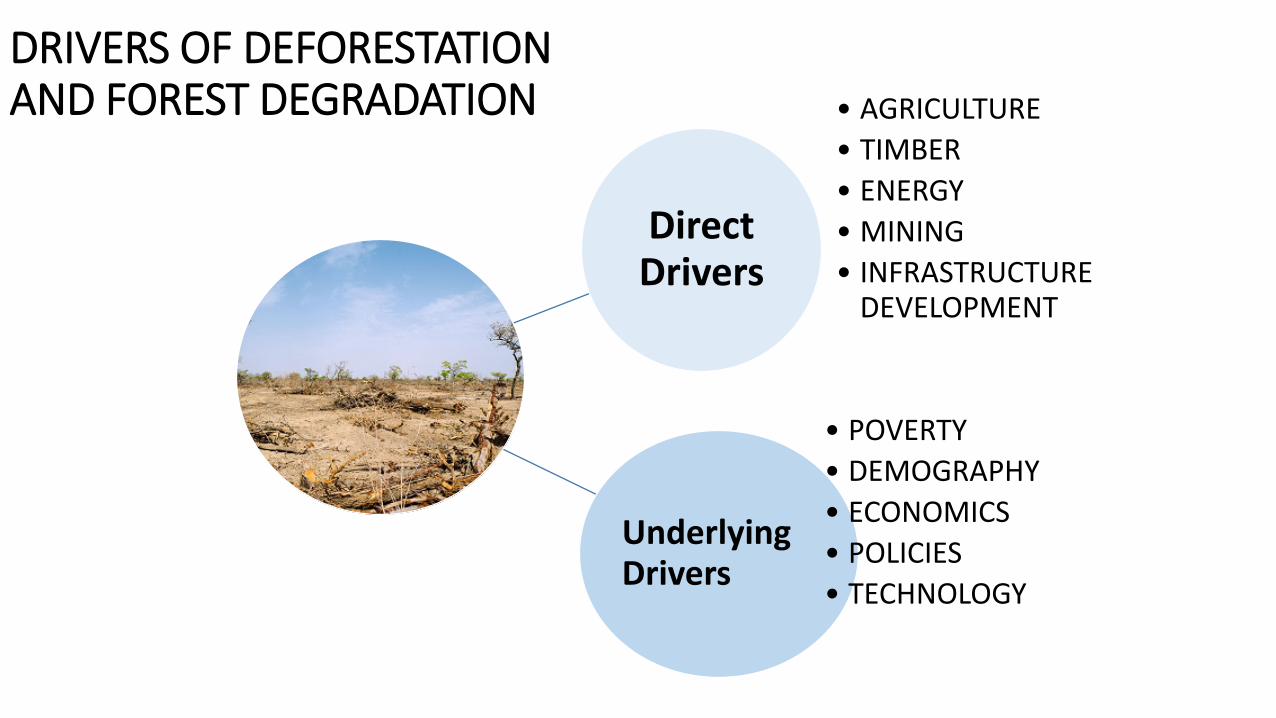
DRIVERS OF DEFORESTATION AND FOREST DEGRADATION
Direct Drivers
• AGRICULTURE• TIMBER• ENERGY• MINING• INFRASTRUCTURE
DEVELOPMENT
Underlying Drivers
• POVERTY• DEMOGRAPHY• ECONOMICS• POLICIES• TECHNOLOGY

REDD
+ St
rate
gic
Obj
ectiv
es
Reduce GHG emissions
Open access forests & customary forests
Forest Management Plans
Sustainable agriculture
Sustainable wood fuel
Alternative energy sources
Land use planning

Investment Plan to reduce Deforestation and forest Degradation

Three approaches to reducing deforestation
Innovative Forest Conservation Approaches Recover
degraded forests
Restoration of deforested areas

CURRENT SITUATION● Poor agricultural practices● Unsustainable extraction of wood● Untapped alternative livelihoods ● Weak Community Participation in Forest Management
IMPLEMENTATION OF IP● Creating enabling environment● Participatory land-use planning● Promote sustainable agriculture practices● Sustainable landscape managementStrengthen Forest Governance
OUTCOMES● Increased diversification of agricultural and livelihoods enterprices● Improved forest, wildlife and land management● Resilient and productive landscapes ● Increased carbon mitigation from forests and agriculture
IMPACTS• Reduced
poverty• Shared
prosperity• Reduced
emission
The Theory of Change for the Investment Plan

Landscape Approach to Implementation of IP

Why a Landscape Approach?
• Community-centred investments;
• Inclusive decisions;
• Integrated actions;
• Integrates high value ecosystems’ management and restoration;
• Management of trade-offs;
• Promotes long-term perspective

Consideration for selection of priority areas
• Forest Cover mapping;
• Conservation Value Map;
• Population density
• Carbon Map
• Potential for Conservation/Natural regeneration/Tree planting/Degradation

Land cover Map 2014
Forest land
Grassland
Cropland
Other lands
Settlements

Results of Forest Loss detection
-
50,000
100,000
150,000
200,000
250,000
300,000
2010-2014 2000-2010

Potential for Conservation and Natural regeneration

Carbon Map

Conservation Value Map

Population Density
Population/km2

Watersheds in Zambia and Priority Areas for IP

Priority Investment Areas and CostsNO CORE THEMATIC AREAS COMPONENTS
1. Enabling Environment Land-use planning; Community participation and social inclusion; Research and development; Implementation of policies ( e.g. statutory Instruments put in place to support
landscape collective actions)US$32mil
2. Conservation and Management of High Value Forest Areas (Conserve/Maintain/ Avoid loss)
Conservation and natural regeneration: Promotion of sustainable wood based energy and alternative energy sources Eco-tourism (including game ranching) Climate Smart AgricultureUS$196.4mil
3 Resilient landscapes, sustainable agriculture and energy (recover and increase forest cover)
Promote community forests; Protection of ecologically sensitive areas Regulated commercial production of charcoal/wood-fuel and its utilization Climate smart AgricultureUS$178.1mil

Institutional Arrangement based on REDD+ Strategy

STAKEHOLDERS ENGAGEMENT
Public sectorCivil Society Organizations
Private SectorDevelopment partners
CBOs

Way Forward
• Continue to engage strategic partners including the World Bank, AfDB UNDP in developing projects based on the Investment Plan;
• Establish public private partnerships in infrastructure and energy related investments;
• Continue in-country stakeholder engagement to strengthen private and community forest management
• Explore potential funding initiatives including the Green Climate Fund (GCF)

Thank you