Embed Size (px)
Citation preview
Governmental Relations Network Meeting
2011 KASB ConventionMark Tallman
December 4, 2011
Advocacy Action Plan (Handout)• Standing Committee on Federal Issues• Special Committee on Mandates• Special Committee on College and Career Readiness• Governmental Relations Seminar (Feb. 29-Mar. 1)– Day 1 – Issues and Advocacy for Public Education– Day 2 – College and Career Readiness
• Spring Regional Meetings/Candidate Forms– By State Senate District (after re-apportionment)– Legislative Update– Legislators, Candidates Invited
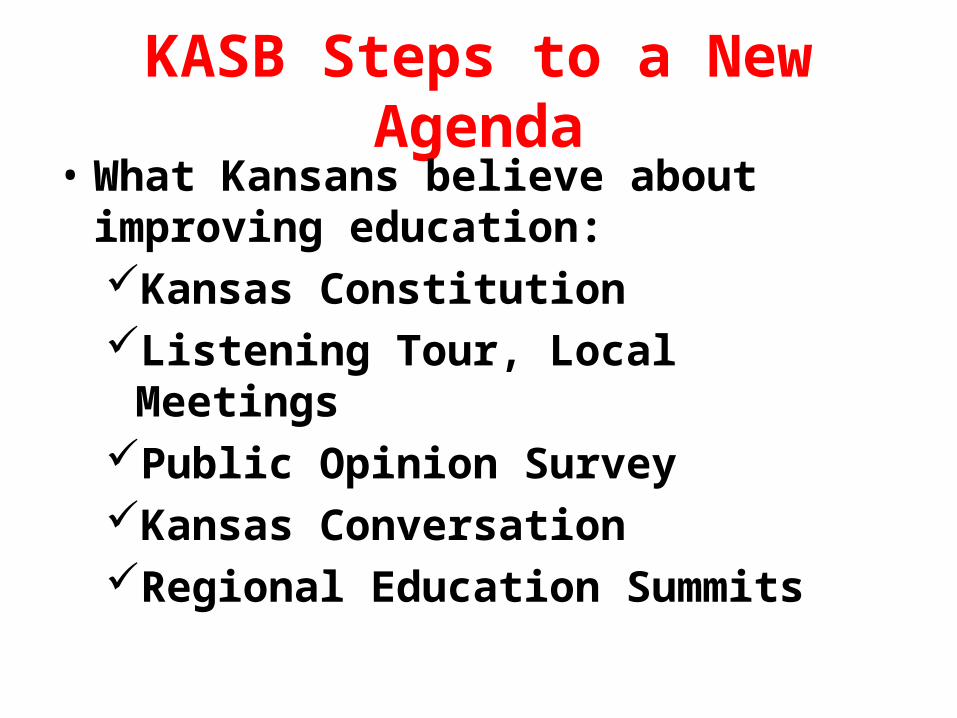
KASB Steps to a New Agenda• What Kansans believe about improving
education:Kansas ConstitutionListening Tour, Local MeetingsPublic Opinion SurveyKansas ConversationRegional Education Summits
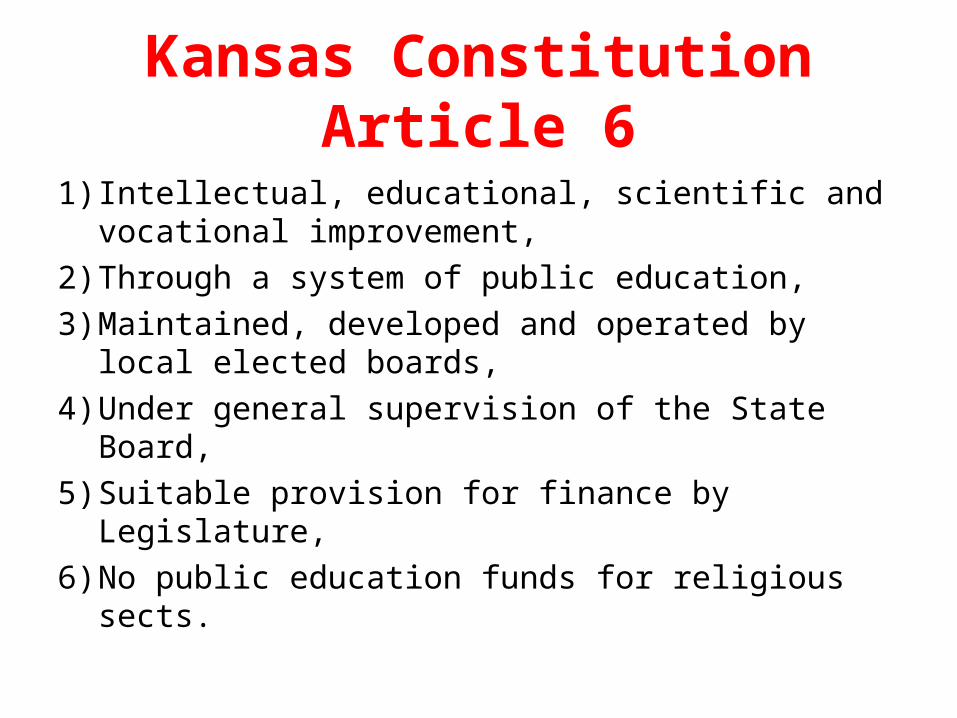
Kansas Constitution Article 6
1) Intellectual, educational, scientific and vocational improvement,
2) Through a system of public education,3) Maintained, developed and operated by local
elected boards,4) Under general supervision of the State Board,5) Suitable provision for finance by Legislature,6) No public education funds for religious sects.
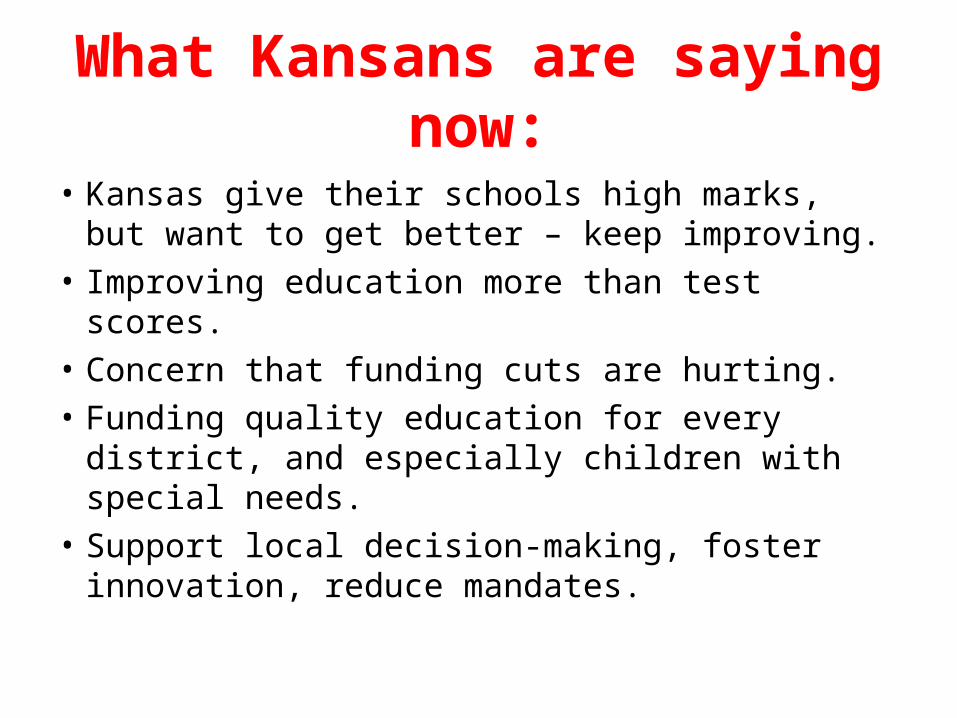
What Kansans are saying now:
• Kansas give their schools high marks, but want to get better – keep improving.
• Improving education more than test scores.• Concern that funding cuts are hurting.• Funding quality education for every district,
and especially children with special needs.• Support local decision-making, foster
innovation, reduce mandates.
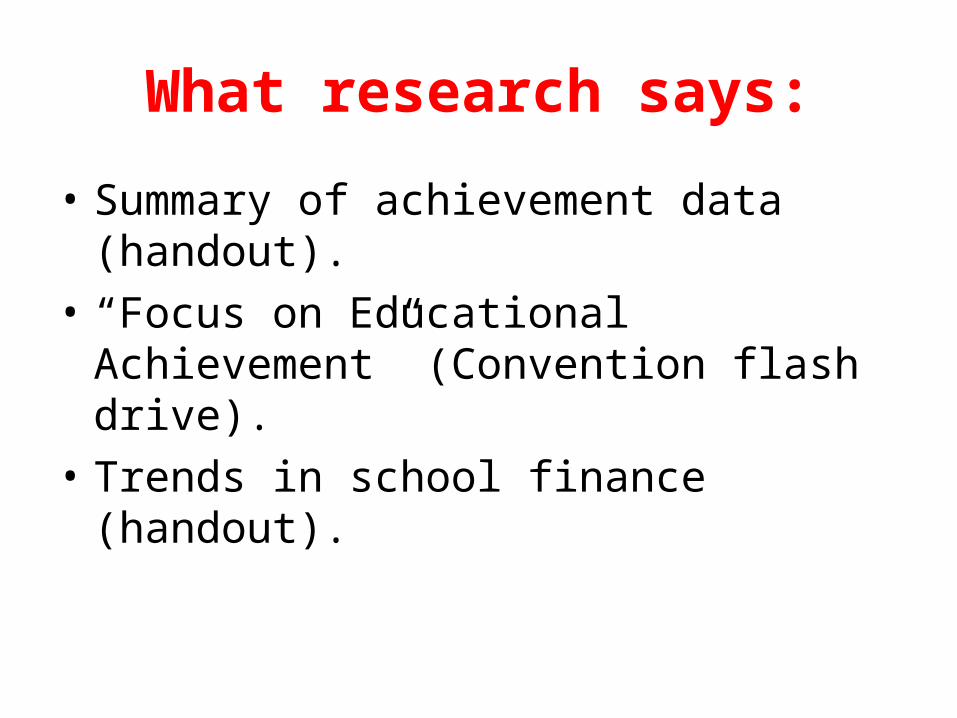
What research says:
• Summary of achievement data (handout).• “Focus on Educational Achievement”
(Convention flash drive).• Trends in school finance (handout).
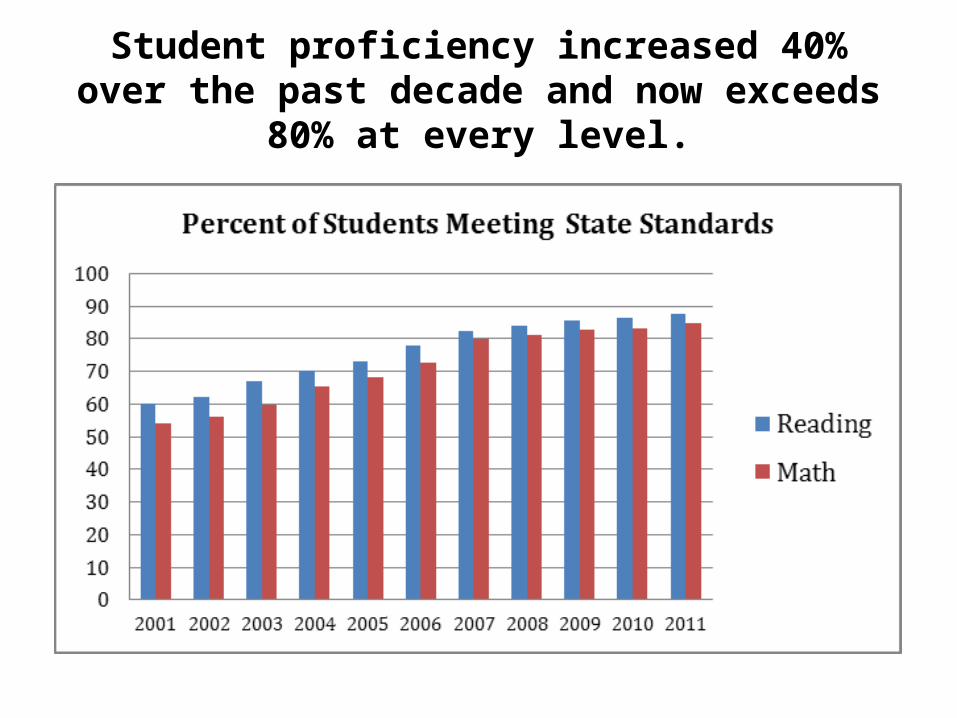
Student proficiency increased 40% over the past decade and now exceeds 80% at every level.
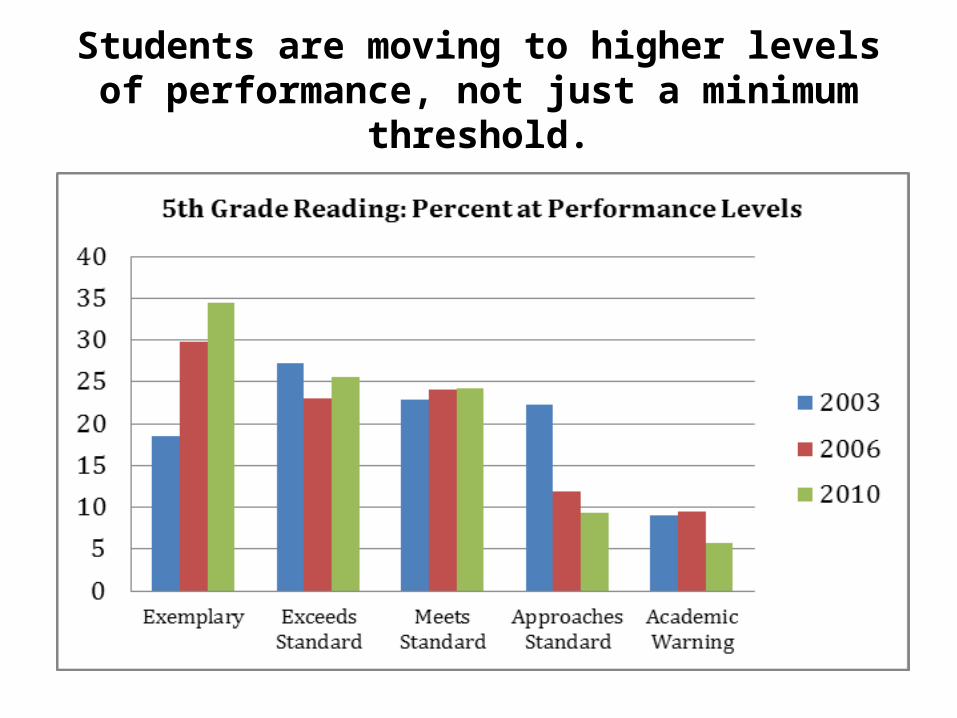
Students are moving to higher levels of performance, not just a minimum threshold.
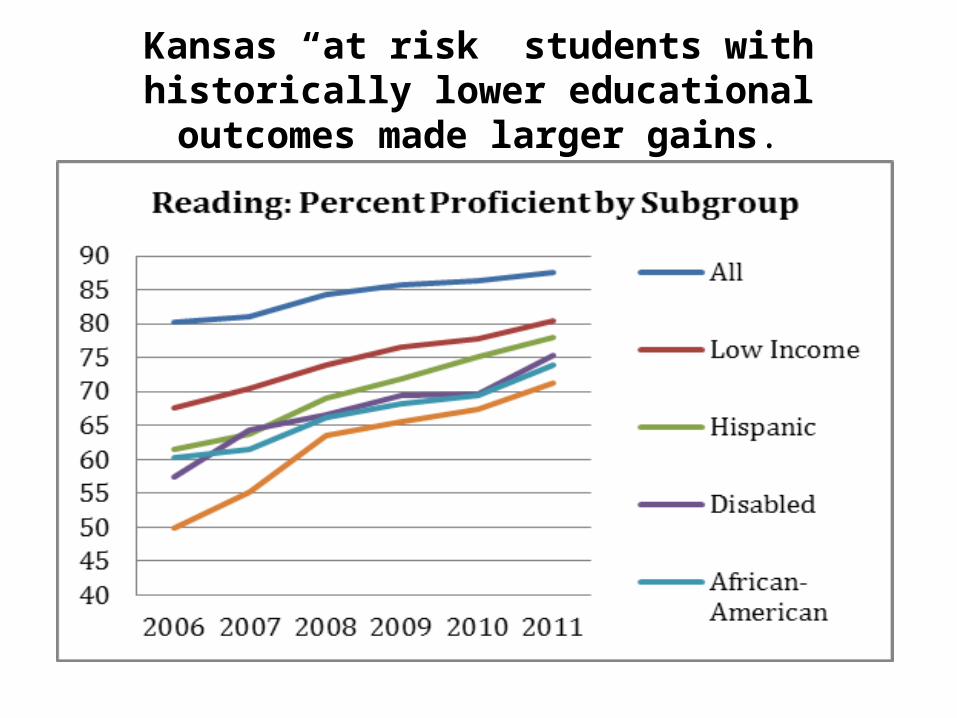
Kansas “at risk” students with historically lower educational outcomes made larger gains.
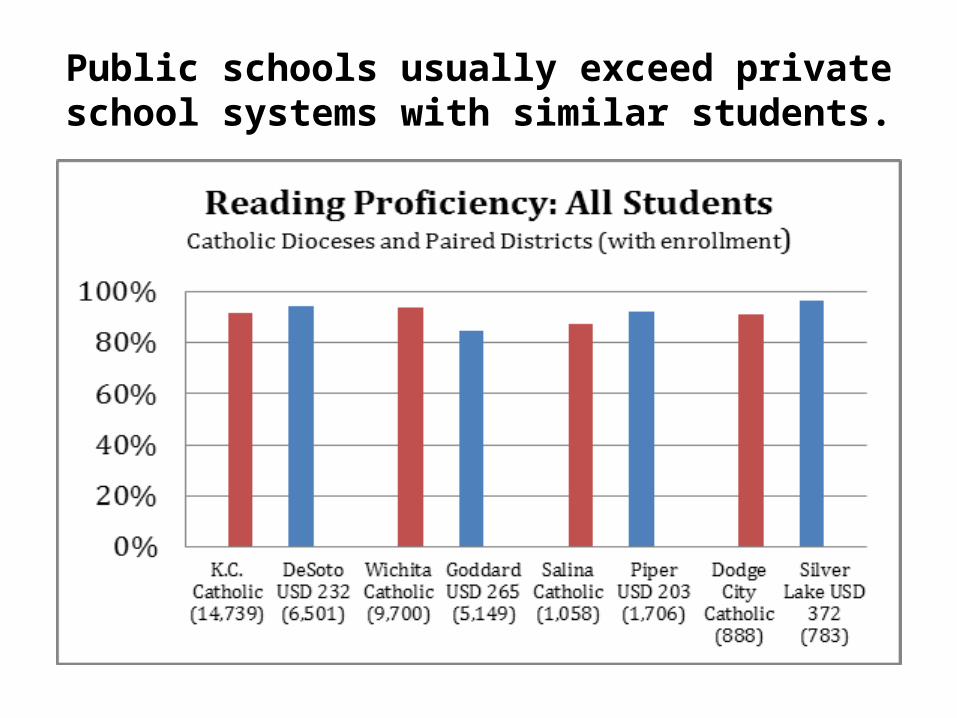
Public schools usually exceed private school systems with similar students.
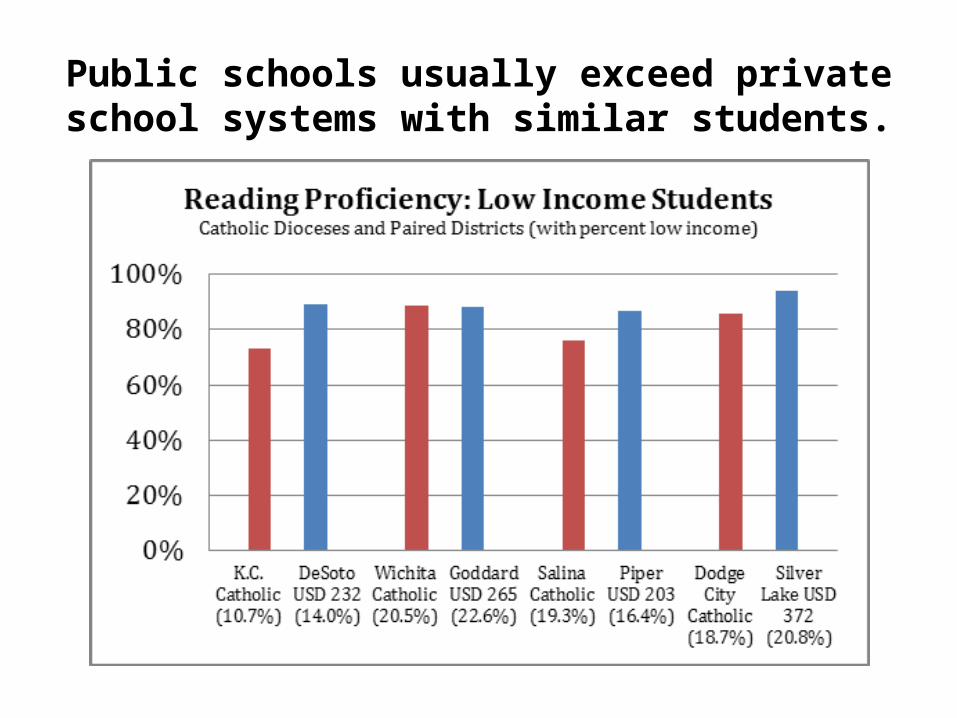
Public schools usually exceed private school systems with similar students.
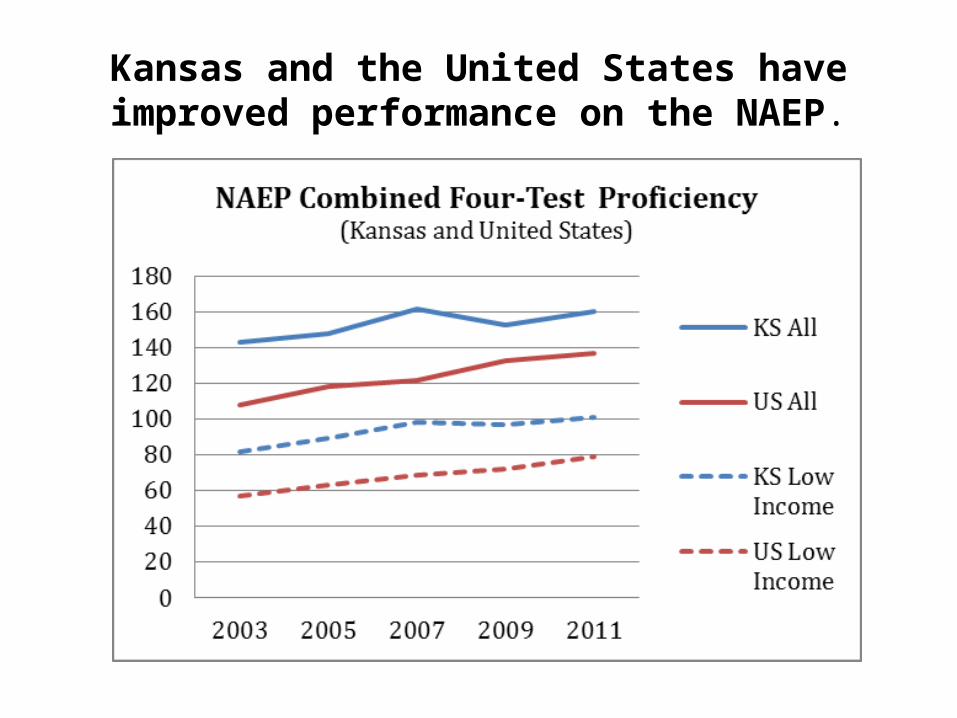
Kansas and the United States have improved performance on the NAEP.
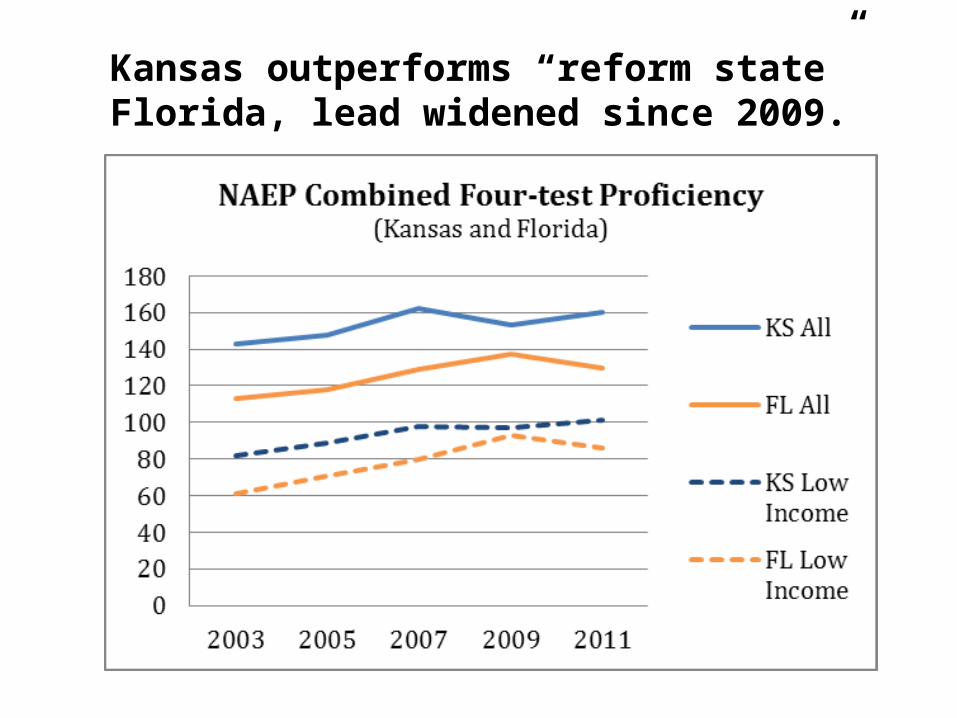
Kansas outperforms “reform state” Florida, lead widened since 2009.
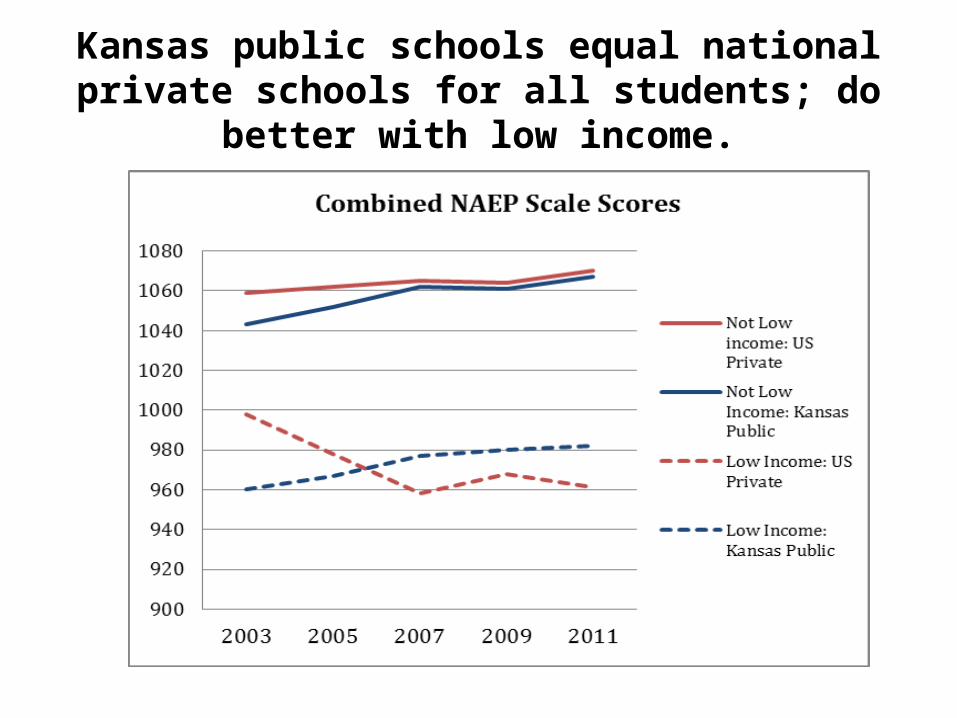
Kansas public schools equal national private schools for all students; do better with low income.
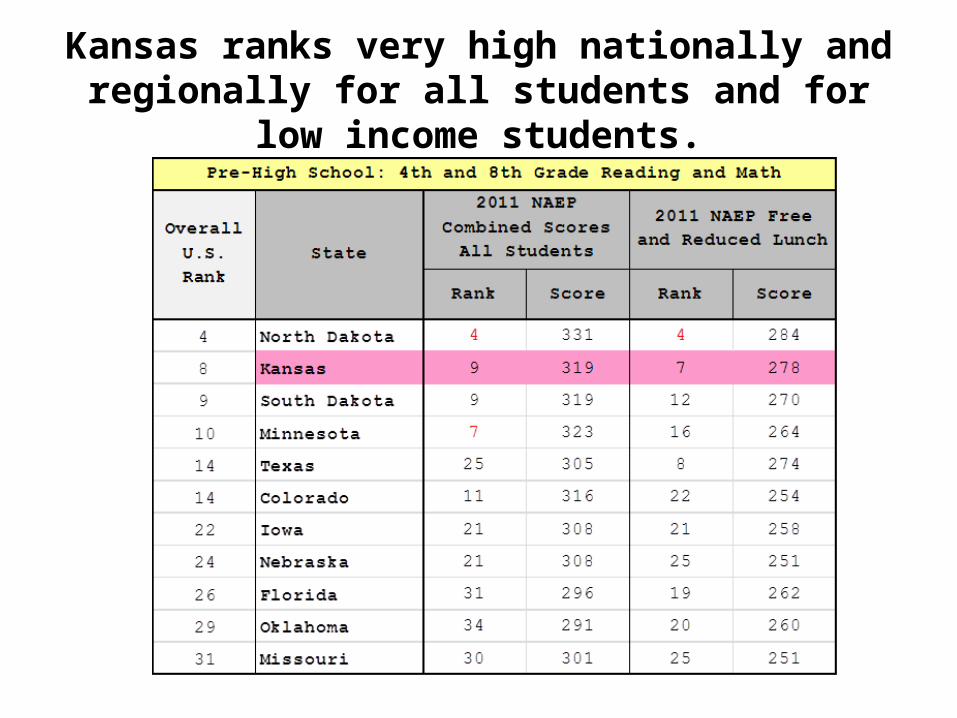
Kansas ranks very high nationally and regionally for all students and for low income students.
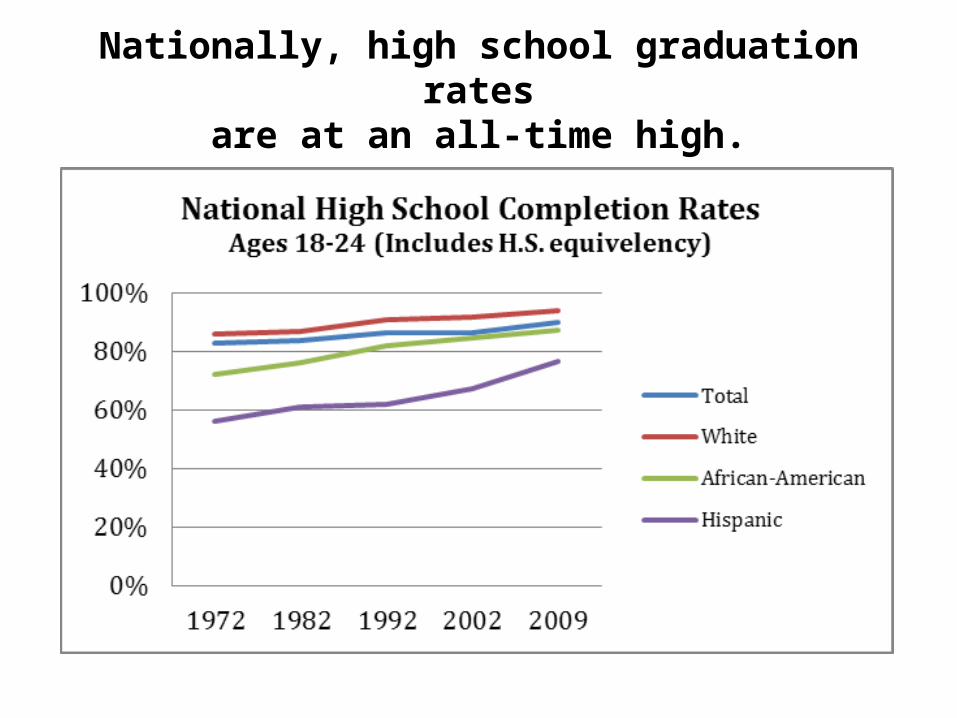
Nationally, high school graduation ratesare at an all-time high.
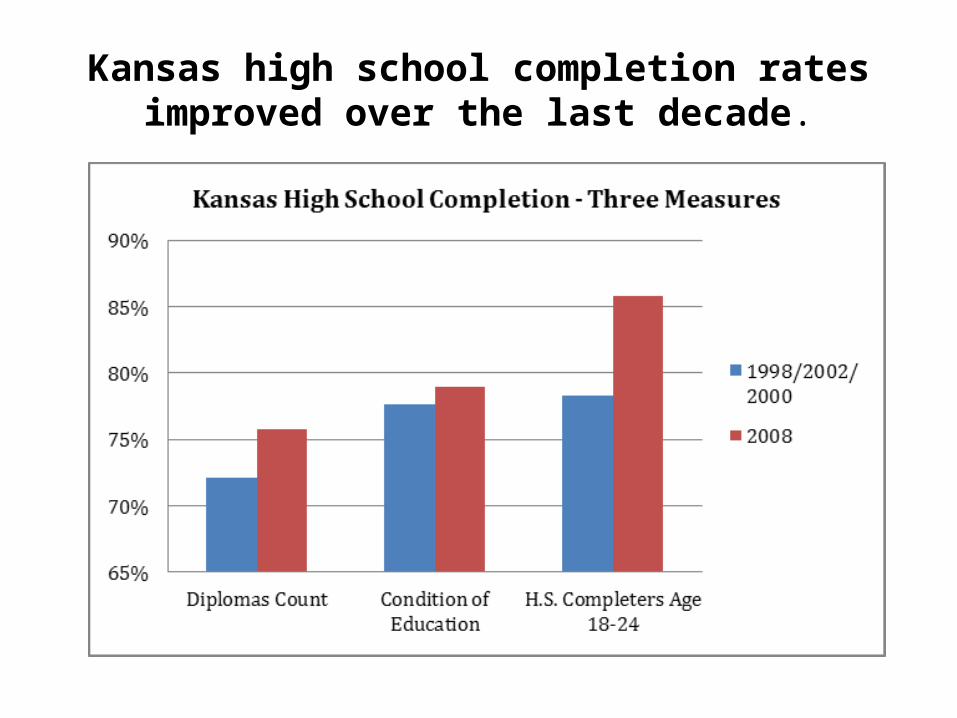
Kansas high school completion rates improved over the last decade.
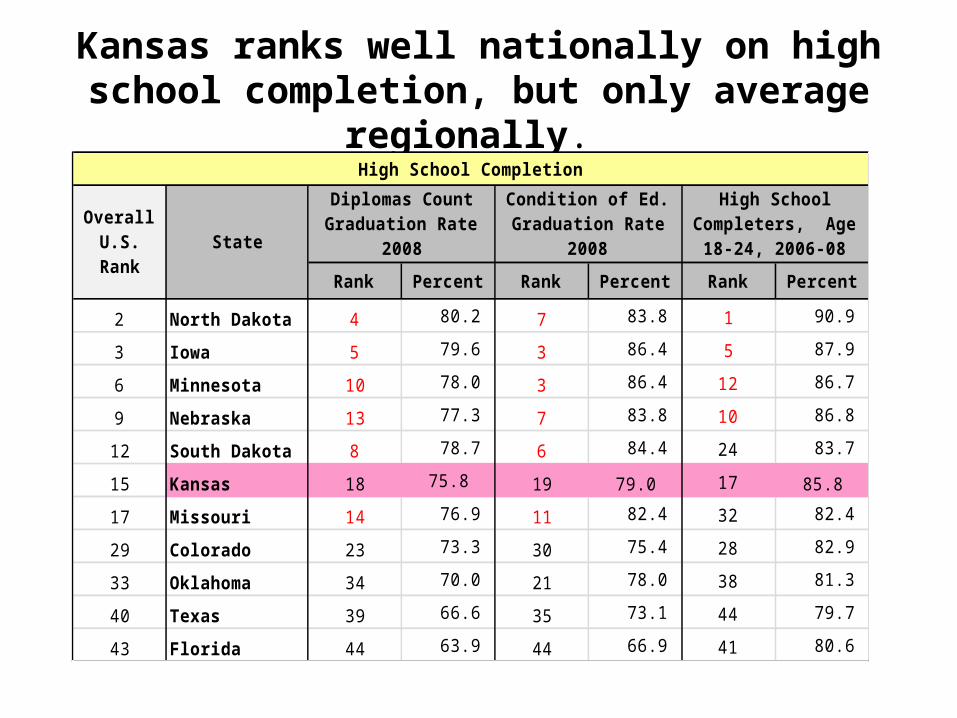
Kansas ranks well nationally on high school completion, but only average regionally.
Rank Percent Rank Percent Rank Percent
2 North Dakota 4 80.2 7 83.8 1 90.9
3 Iowa 5 79.6 3 86.4 5 87.9
6 Minnesota 10 78.0 3 86.4 12 86.7
9 Nebraska 13 77.3 7 83.8 10 86.8
12 South Dakota 8 78.7 6 84.4 24 83.7
15 Kansas 18 75.8 19 79.0 17 85.8
17 Missouri 14 76.9 11 82.4 32 82.4
29 Colorado 23 73.3 30 75.4 28 82.9
33 Oklahoma 34 70.0 21 78.0 38 81.3
40 Texas 39 66.6 35 73.1 44 79.7
43 Florida 44 63.9 44 66.9 41 80.6
High School Completion
Overall U.S. Rank
State
Diplomas Count Graduation Rate
2008
Condition of Ed. Graduation Rate
2008
High School Completers, Age 18-24, 2006-08
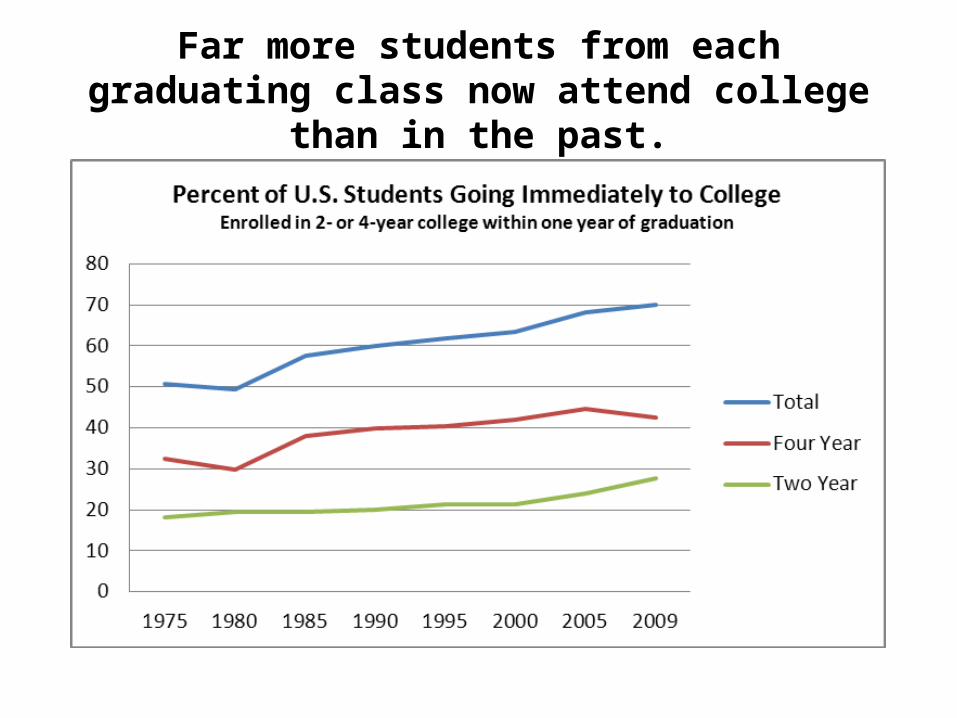
Far more students from each graduating class now attend college than in the past.
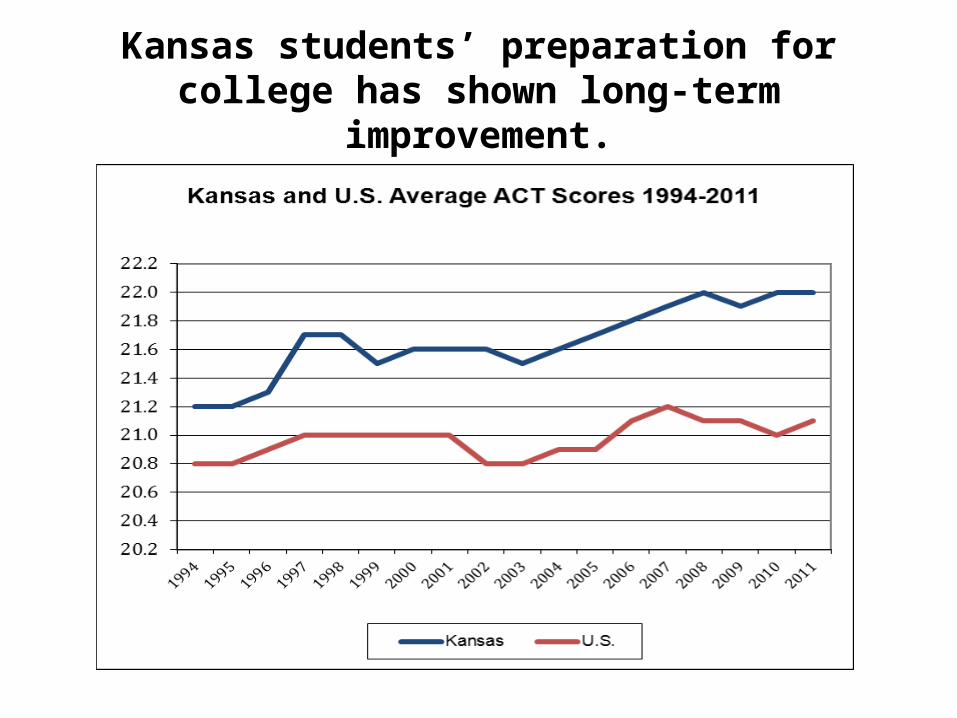
Kansas students’ preparation for college has shown long-term improvement.
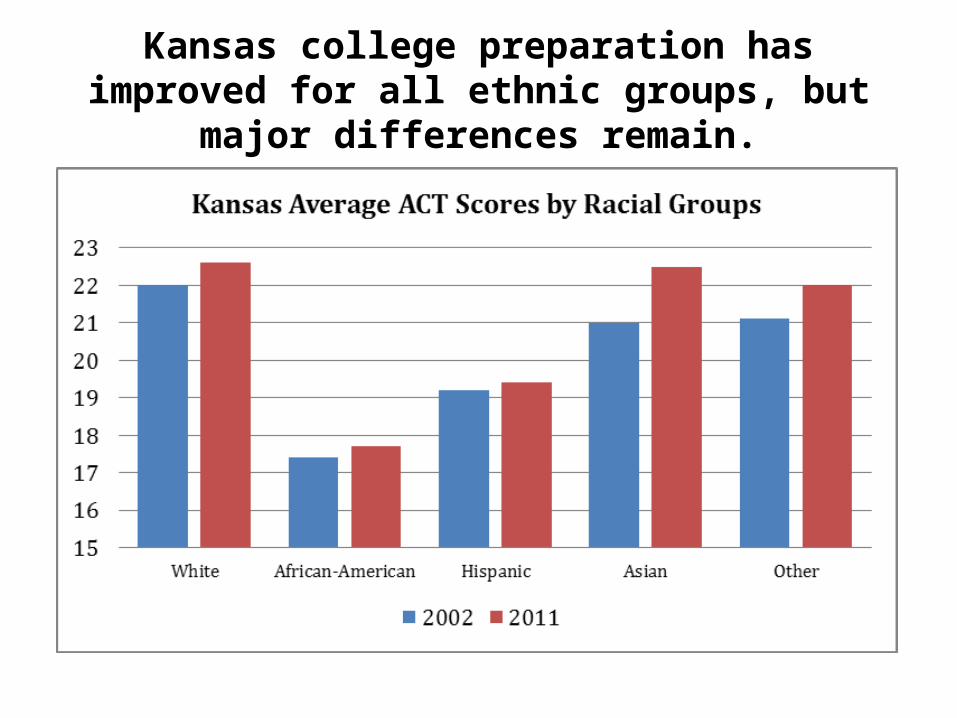
Kansas college preparation has improved for all ethnic groups, but major differences remain.
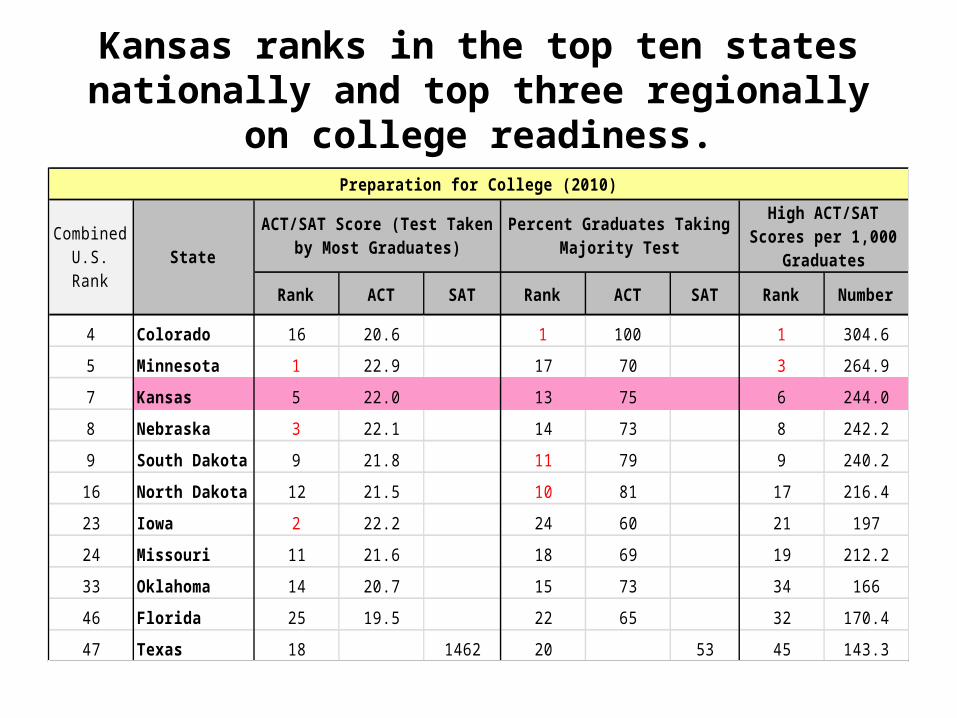
Kansas ranks in the top ten states nationally and top three regionally on college readiness.
Rank ACT SAT Rank ACT SAT Rank Number
4 Colorado 16 20.6 1 100 1 304.6
5 Minnesota 1 22.9 17 70 3 264.9
7 Kansas 5 22.0 13 75 6 244.0
8 Nebraska 3 22.1 14 73 8 242.2
9 South Dakota 9 21.8 11 79 9 240.2
16 North Dakota 12 21.5 10 81 17 216.4
23 Iowa 2 22.2 24 60 21 197
24 Missouri 11 21.6 18 69 19 212.2
33 Oklahoma 14 20.7 15 73 34 166
46 Florida 25 19.5 22 65 32 170.4
47 Texas 18 1462 20 53 45 143.3
Preparation for College (2010)
Combined U.S. Rank
State
ACT/SAT Score (Test Taken by Most Graduates)
Percent Graduates Taking Majority Test
High ACT/SAT Scores per 1,000
Graduates
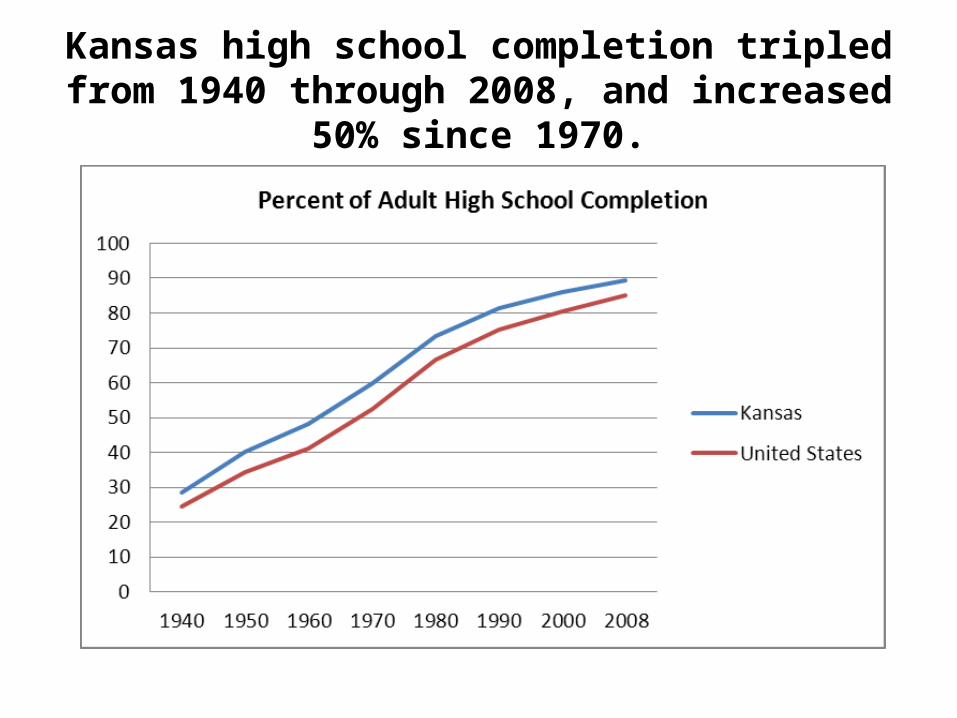
Kansas high school completion tripled from 1940 through 2008, and increased 50% since 1970.
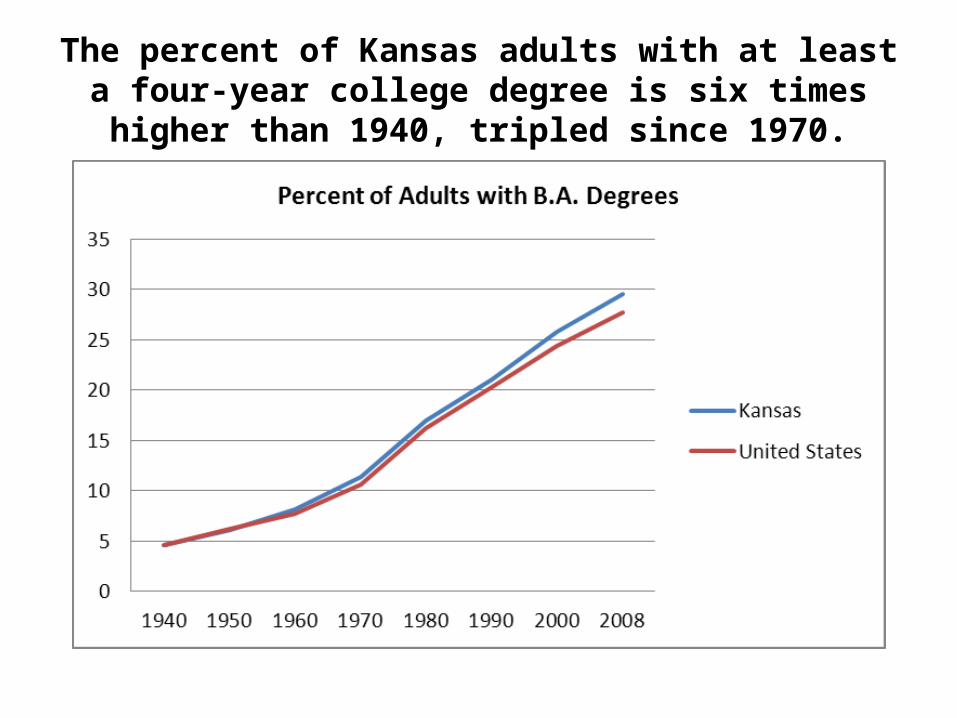
The percent of Kansas adults with at least a four-year college degree is six times higher than 1940, tripled since 1970.
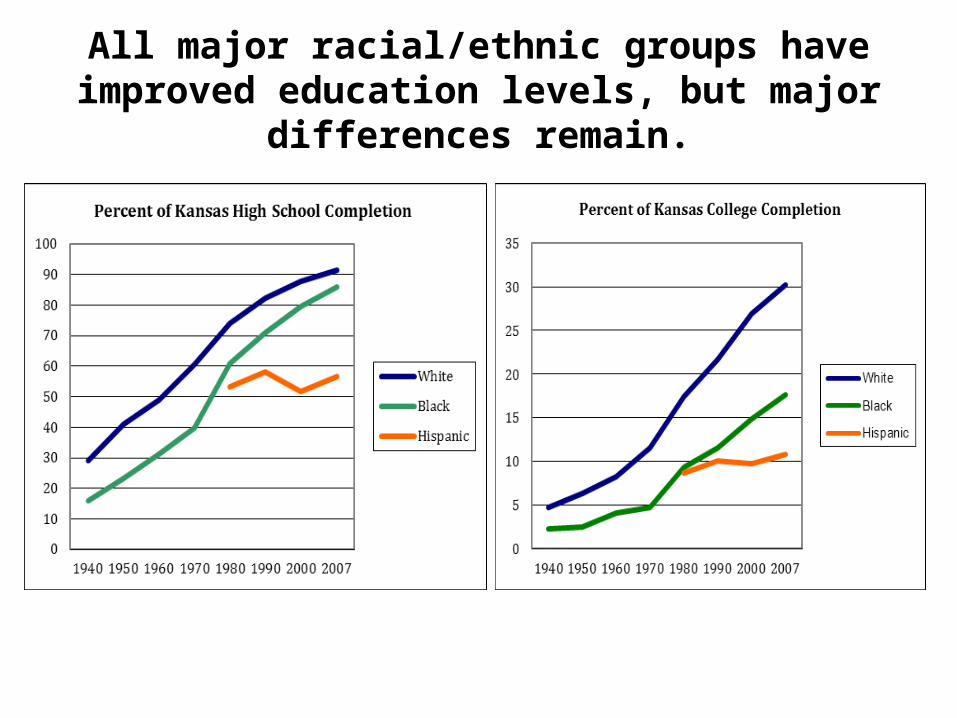
All major racial/ethnic groups have improved education levels, but major differences remain.
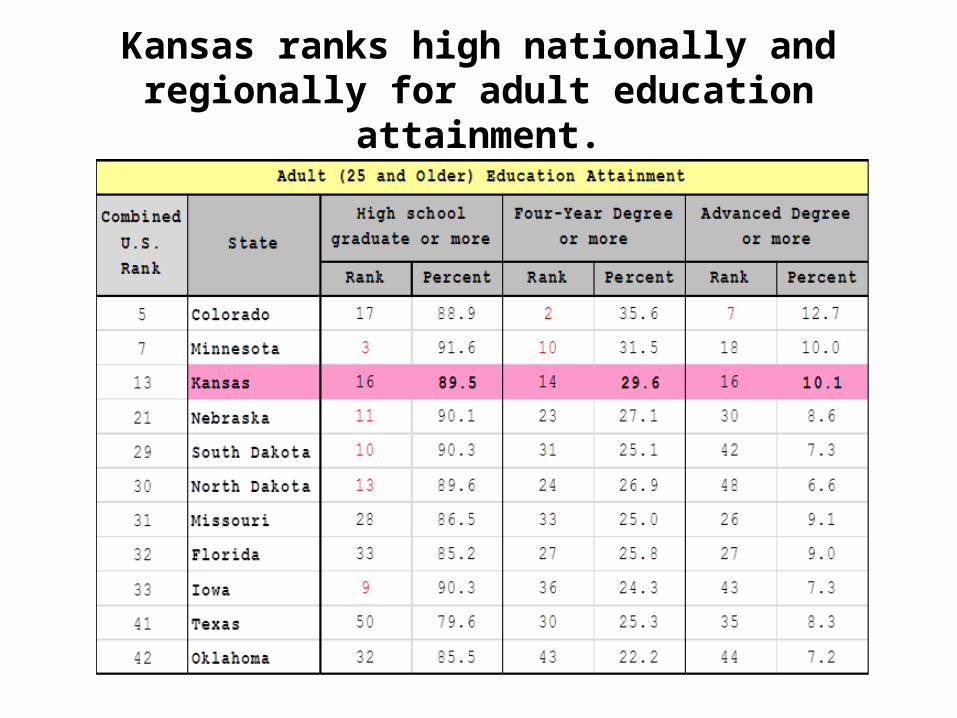
Kansas ranks high nationally and regionally for adult education attainment.
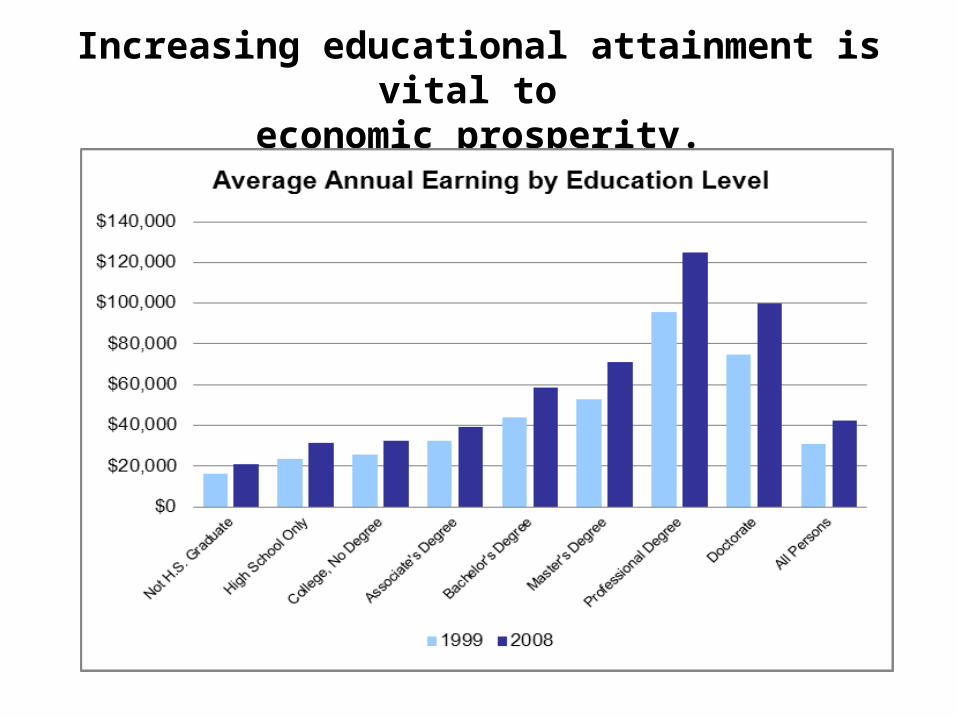
Increasing educational attainment is vital to economic prosperity.
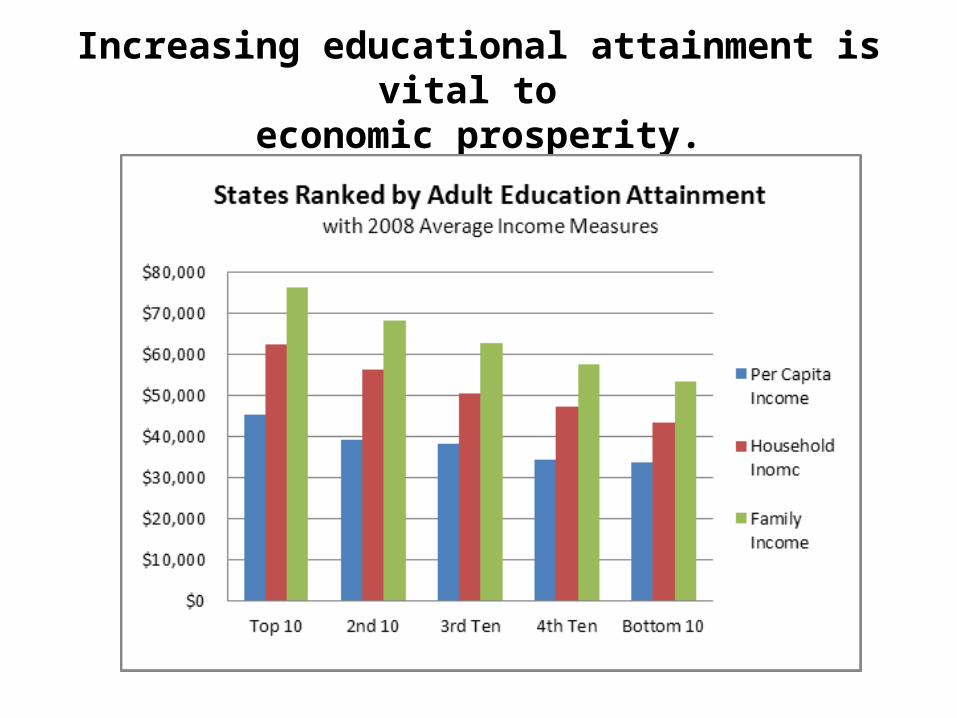
Increasing educational attainment is vital to economic prosperity.
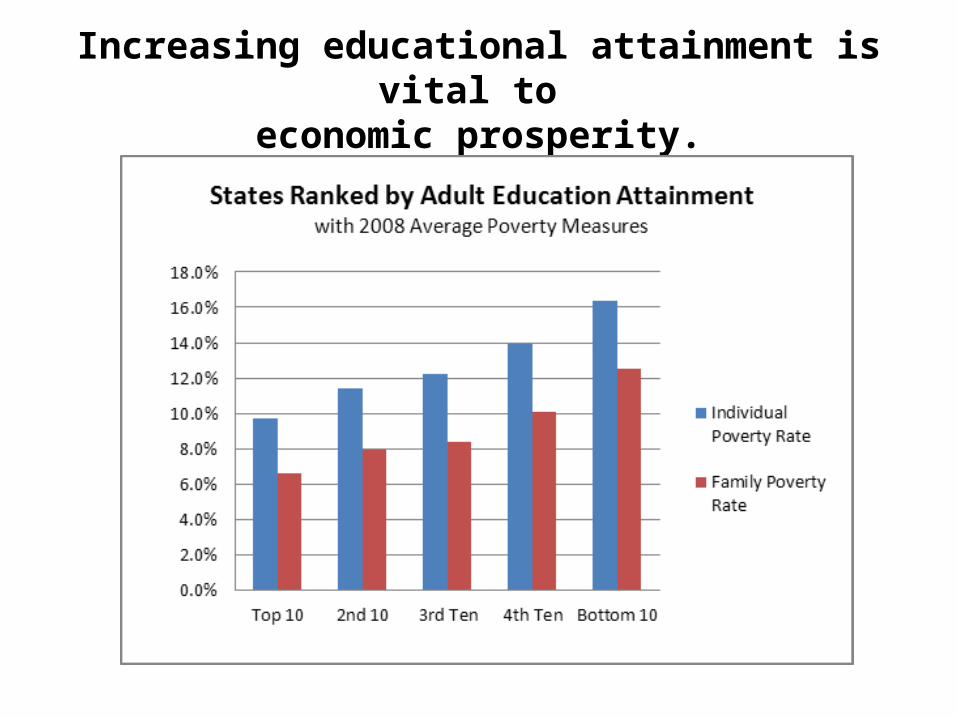
Increasing educational attainment is vital to economic prosperity.
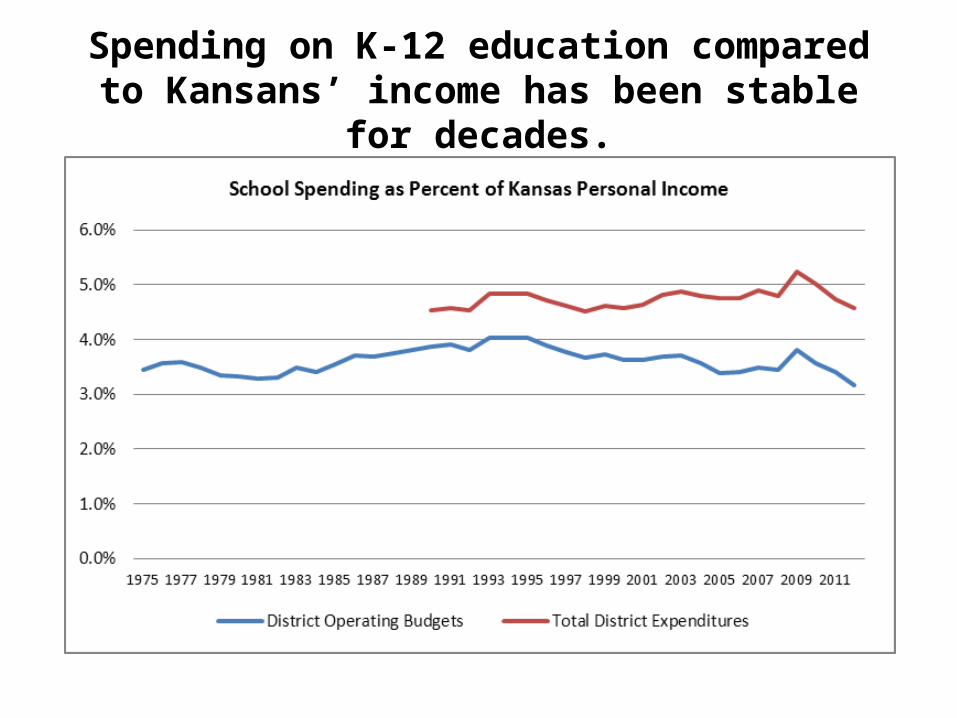
Spending on K-12 education compared to Kansans’ income has been stable for decades.
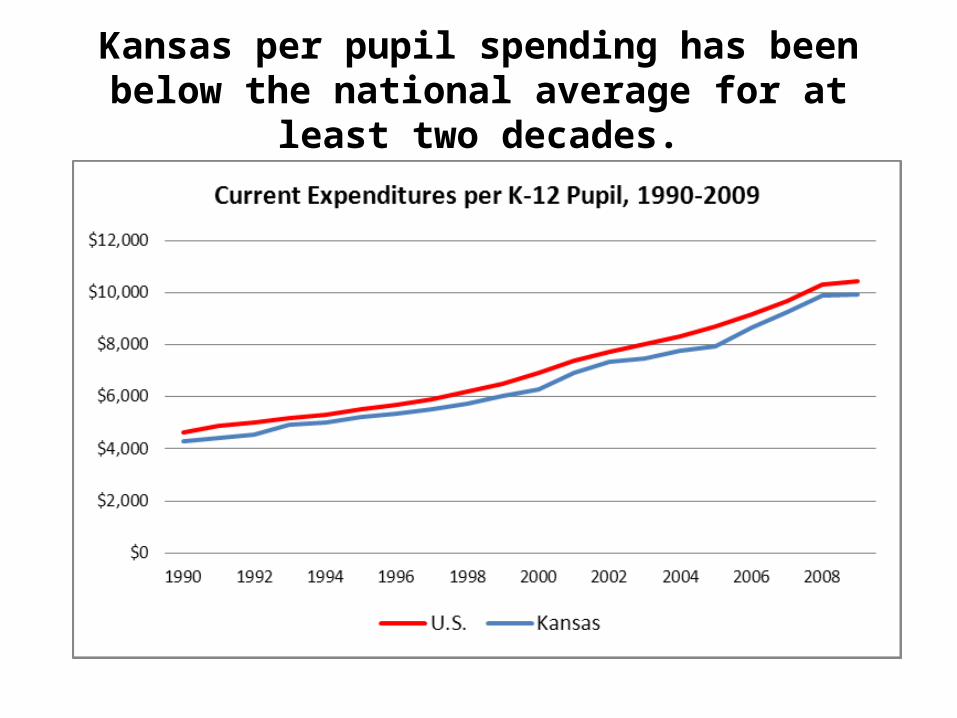
Kansas per pupil spending has been below the national average for at least two decades.
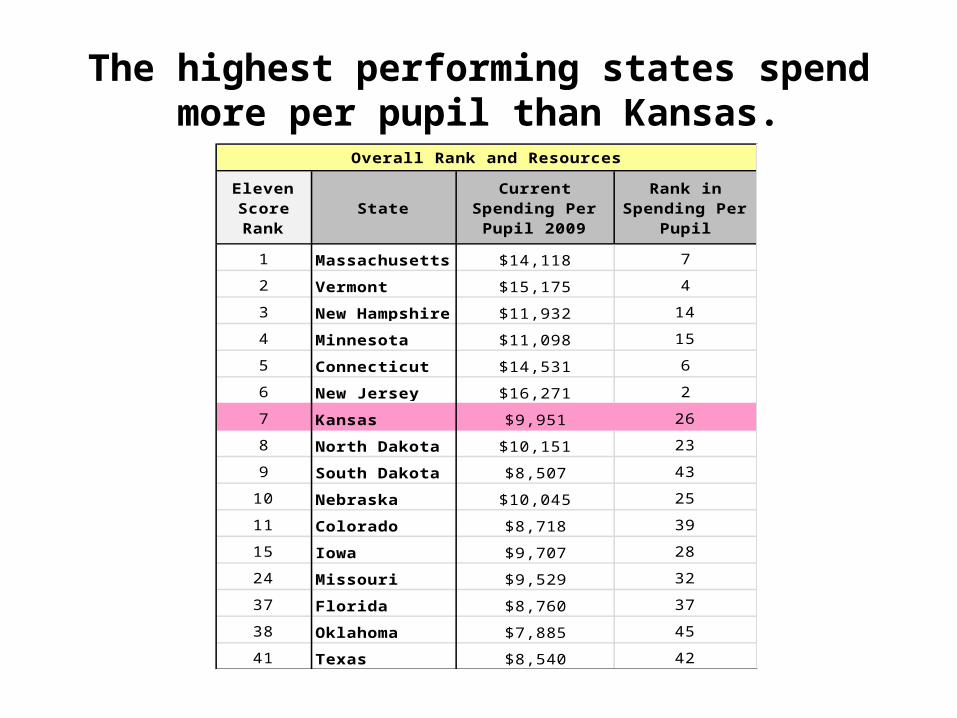
The highest performing states spend more per pupil than Kansas.
Eleven Score Rank
StateCurrent
Spending Per Pupil 2009
Rank in Spending Per
Pupil
1 Massachusetts $14,118 7
2 Vermont $15,175 4
3 New Hampshire $11,932 14
4 Minnesota $11,098 15
5 Connecticut $14,531 6
6 New Jersey $16,271 2
7 Kansas $9,951 26
8 North Dakota $10,151 23
9 South Dakota $8,507 43
10 Nebraska $10,045 25
11 Colorado $8,718 39
15 Iowa $9,707 28
24 Missouri $9,529 32
37 Florida $8,760 37
38 Oklahoma $7,885 45
41 Texas $8,540 42
Overall Rank and Resources
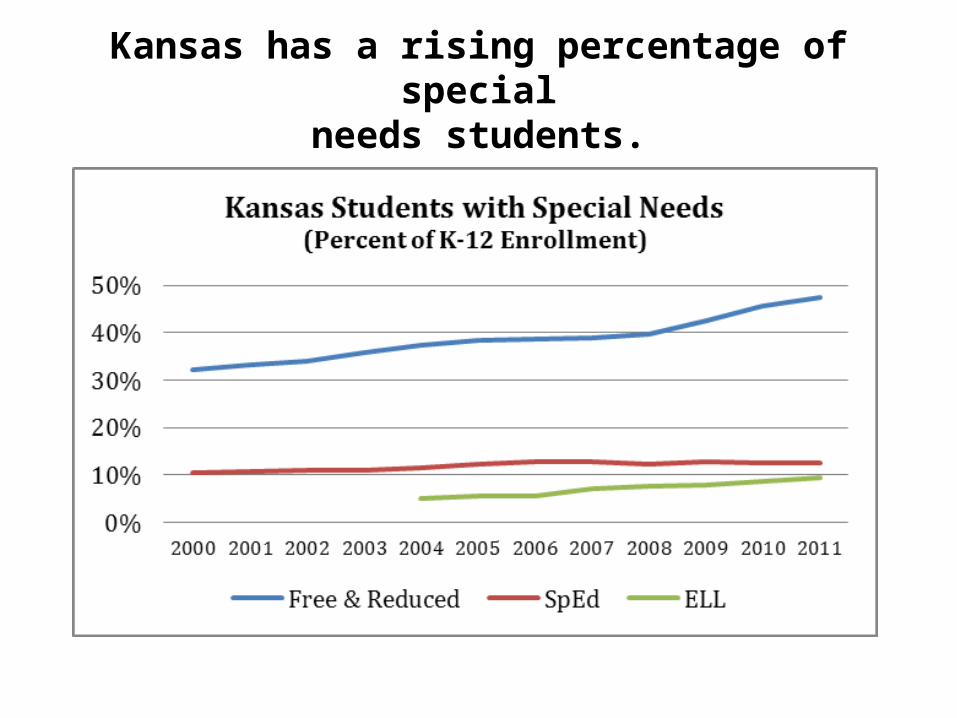
Kansas has a rising percentage of specialneeds students.
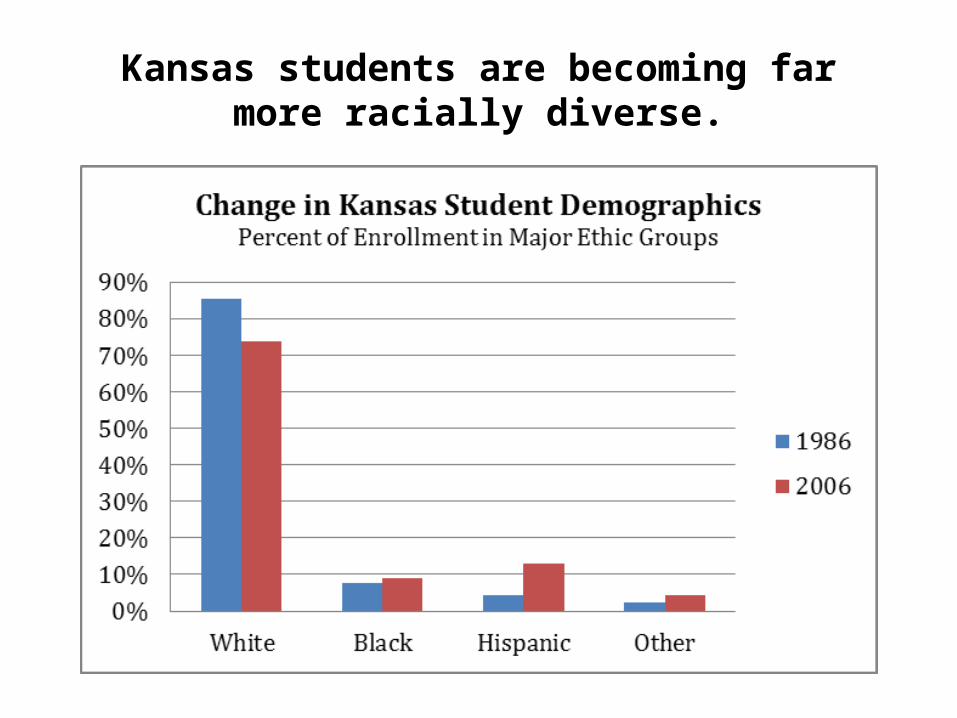
Kansas students are becoming farmore racially diverse.
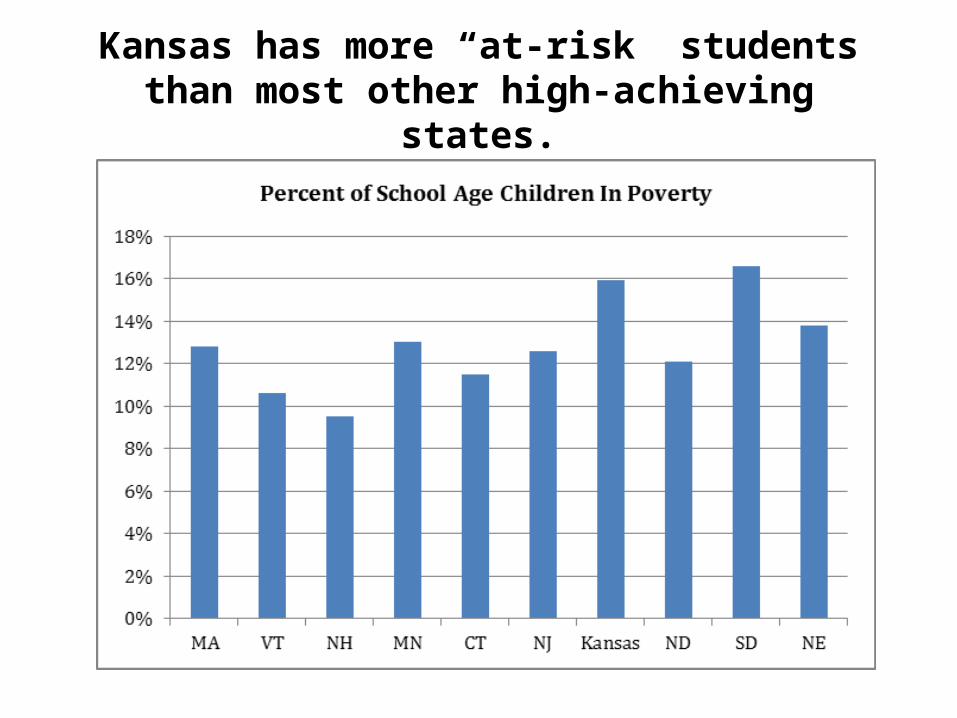
Kansas has more “at-risk” students than most other high-achieving states.
Conclusions:
• Commit to be “First in Education, the Kansas Way.”
• Change the school accountability system: first real chance since NCLB passed 10 years ago.
• Make school finance work for improvement: can we change for the better?
• Empower, rather than circumvent, local boards.
School Finance: the Big Picture• Start by understanding the very complex school
finance system in its basic parts.• Kansas school districts will receive and spend about
$5.5 billion from all sources and for all purposes this year.
• Divide that by about 460,000 students comes to about $12,000 per student – three times the base budget per pupil.
• It may be helpful to divide that $5.5 billion roughly into four major categories.
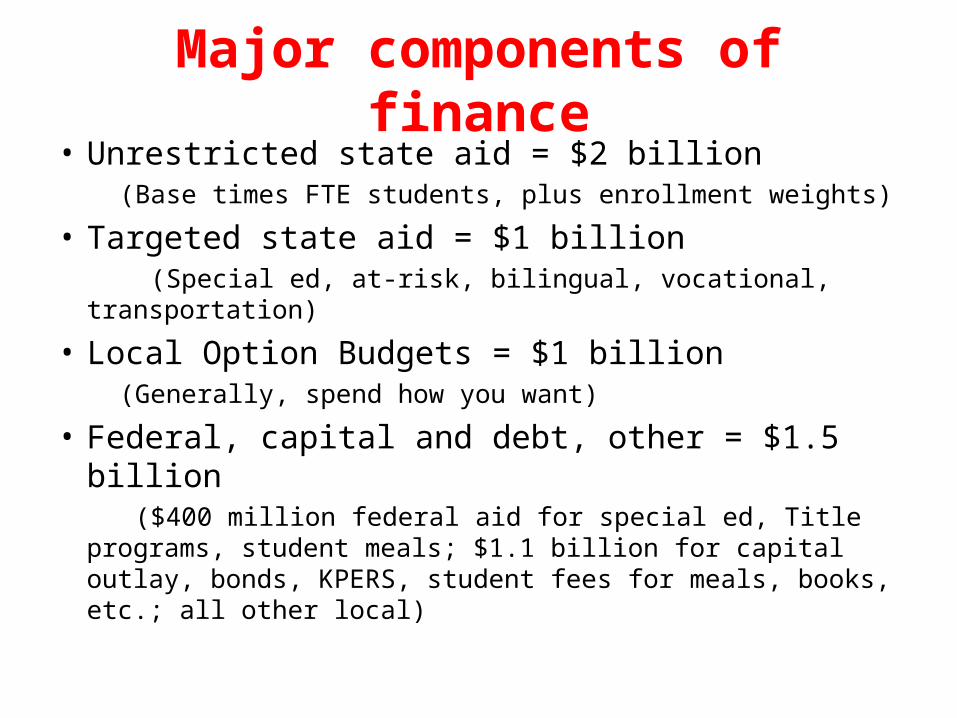
Major components of finance• Unrestricted state aid = $2 billion (Base times FTE students, plus enrollment weights)
• Targeted state aid = $1 billion (Special ed, at-risk, bilingual, vocational, transportation)
• Local Option Budgets = $1 billion (Generally, spend how you want)
• Federal, capital and debt, other = $1.5 billion ($400 million federal aid for special ed, Title programs,
student meals; $1.1 billion for capital outlay, bonds, KPERS, student fees for meals, books, etc.; all other local)
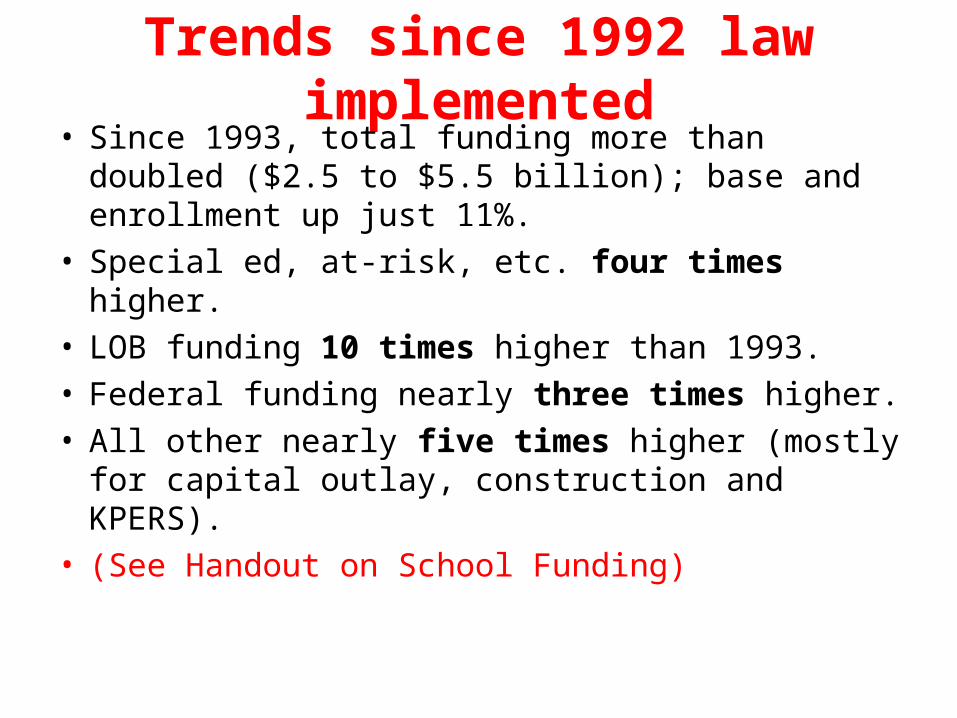
Trends since 1992 law implemented• Since 1993, total funding more than doubled ($2.5 to
$5.5 billion); base and enrollment up just 11%.• Special ed, at-risk, etc. four times higher.• LOB funding 10 times higher than 1993.• Federal funding nearly three times higher.• All other nearly five times higher (mostly for capital
outlay, construction and KPERS).• (See Handout on School Funding)
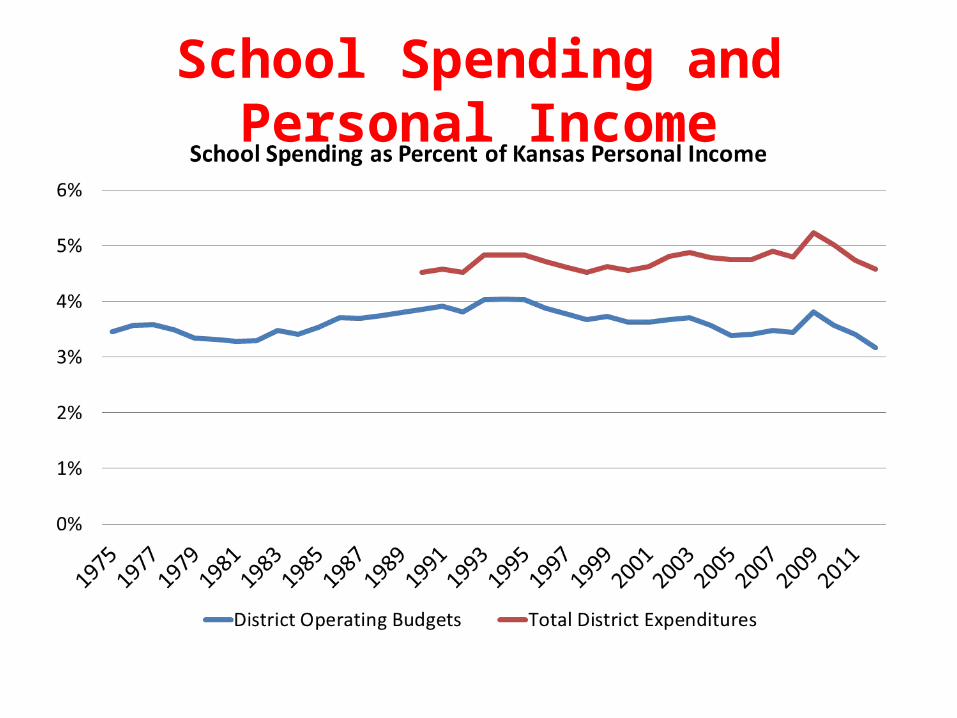
School Spending and Personal Income
How the system has changed• State funding much more targeted at special needs
students; local funds for general programs.• Much more reliance on local funding (LOB, capital
outlay and bonding, other local) – which is limited by state, with some state aid in some programs.
• Despite No child Left Behind costs, percentage from federal remains small part of budget.
• Despite increased spending on K-12 education, school revenues have actually decreased compared to total personal income in Kansas.
How was increased funding used?• Since 1993: total school funding increased $3 billion.• Keeping up with inflation/teacher salaries (60%
increase) alone required $1.5 billion. (Base aid and enrollment weightings plus LOB increased just $1.2 billion.)
• Special ed aid, targeted weightings and federal aid increased $1 billion to improve achievement.
• Remaining $500 million: KPERS increase; buildings and equipment from capital outlay, bonds approved by local voters.
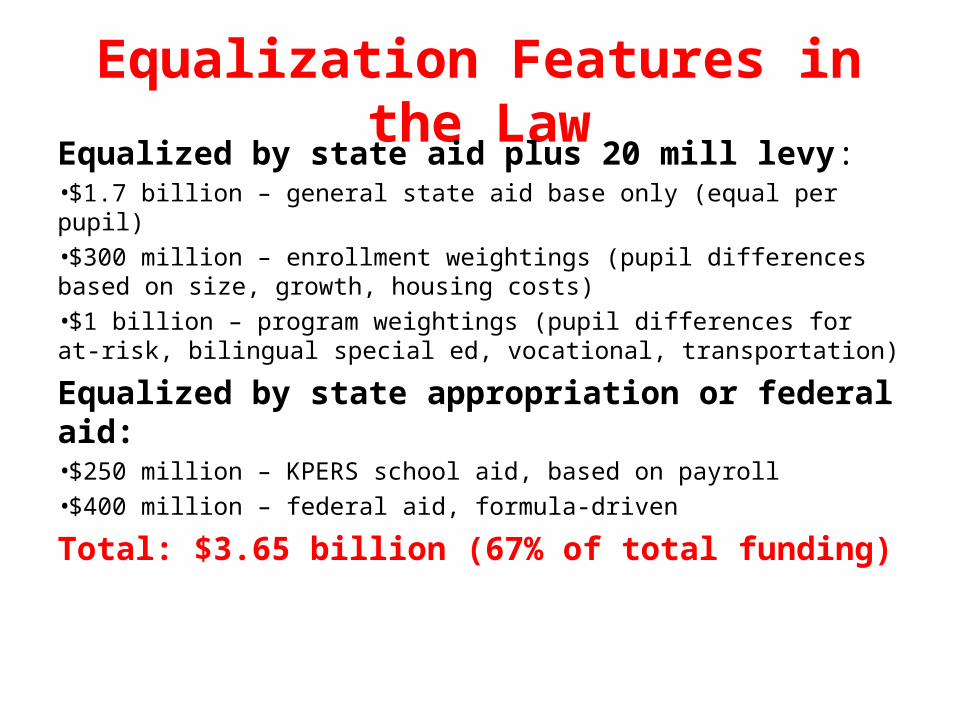
Equalization Features in the LawEqualized by state aid plus 20 mill levy:•$1.7 billion – general state aid base only (equal per pupil)•$300 million – enrollment weightings (pupil differences based on size, growth, housing costs)•$1 billion – program weightings (pupil differences for at-risk, bilingual special ed, vocational, transportation)
Equalized by state appropriation or federal aid:•$250 million – KPERS school aid, based on payroll•$400 million – federal aid, formula-driven
Total: $3.65 billion (67% of total funding)
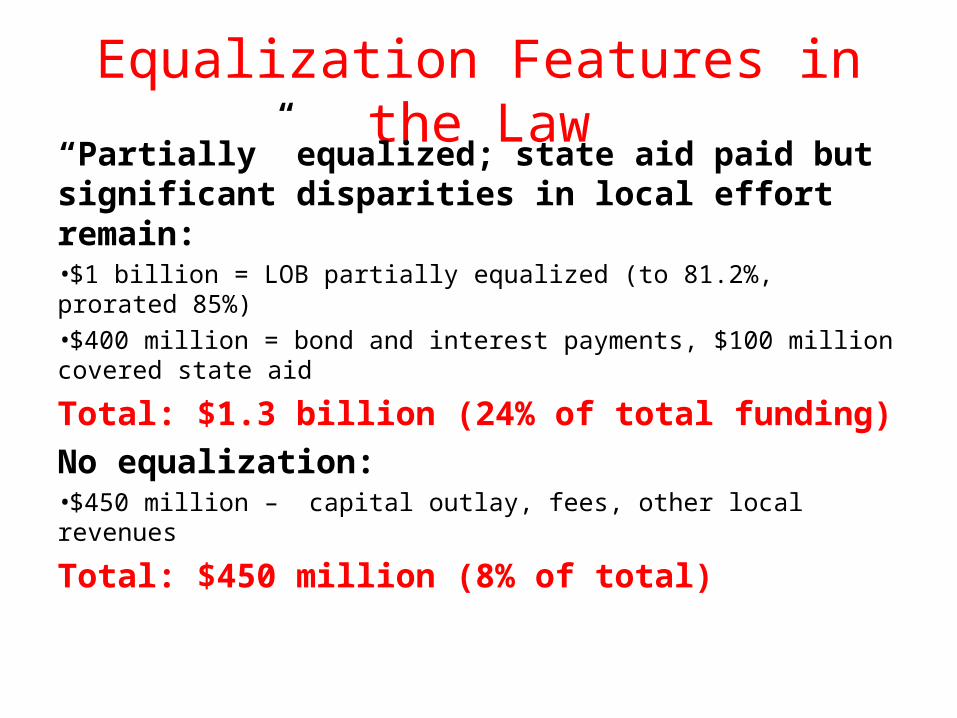
Equalization Features in the Law“Partially” equalized; state aid paid but significant disparities in local effort remain:•$1 billion = LOB partially equalized (to 81.2%, prorated 85%)•$400 million = bond and interest payments, $100 million covered state aid
Total: $1.3 billion (24% of total funding)No equalization:•$450 million – capital outlay, fees, other local revenues
Total: $450 million (8% of total)
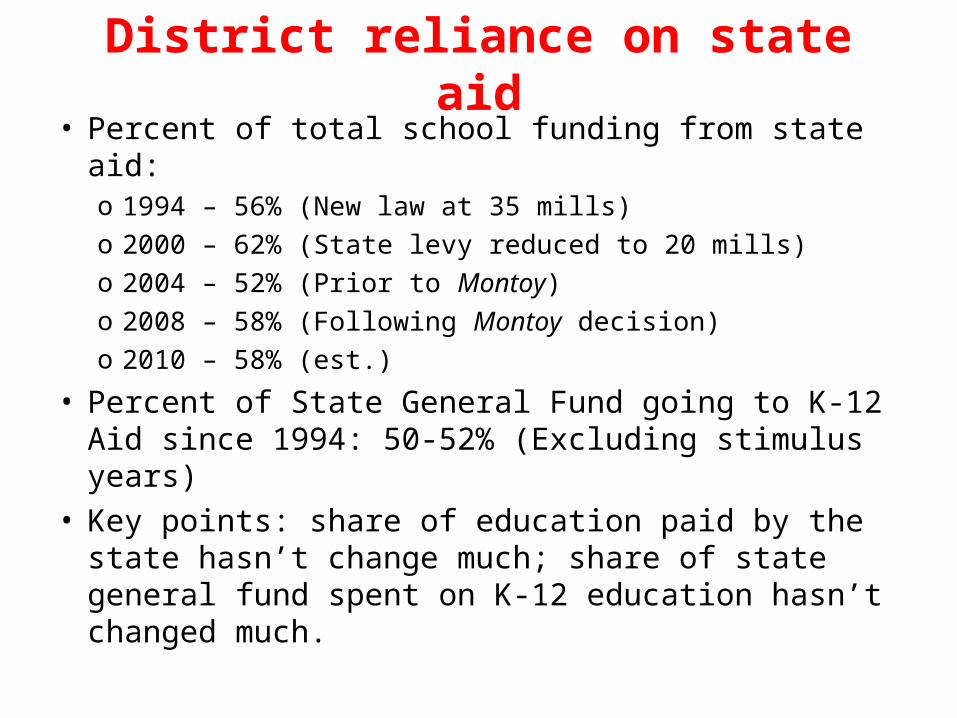
District reliance on state aid• Percent of total school funding from state aid:
o 1994 – 56% (New law at 35 mills)o 2000 – 62% (State levy reduced to 20 mills)o 2004 – 52% (Prior to Montoy)o 2008 – 58% (Following Montoy decision)o 2010 – 58% (est.)
• Percent of State General Fund going to K-12 Aid since 1994: 50-52% (Excluding stimulus years)
• Key points: share of education paid by the state hasn’t change much; share of state general fund spent on K-12 education hasn’t changed much.
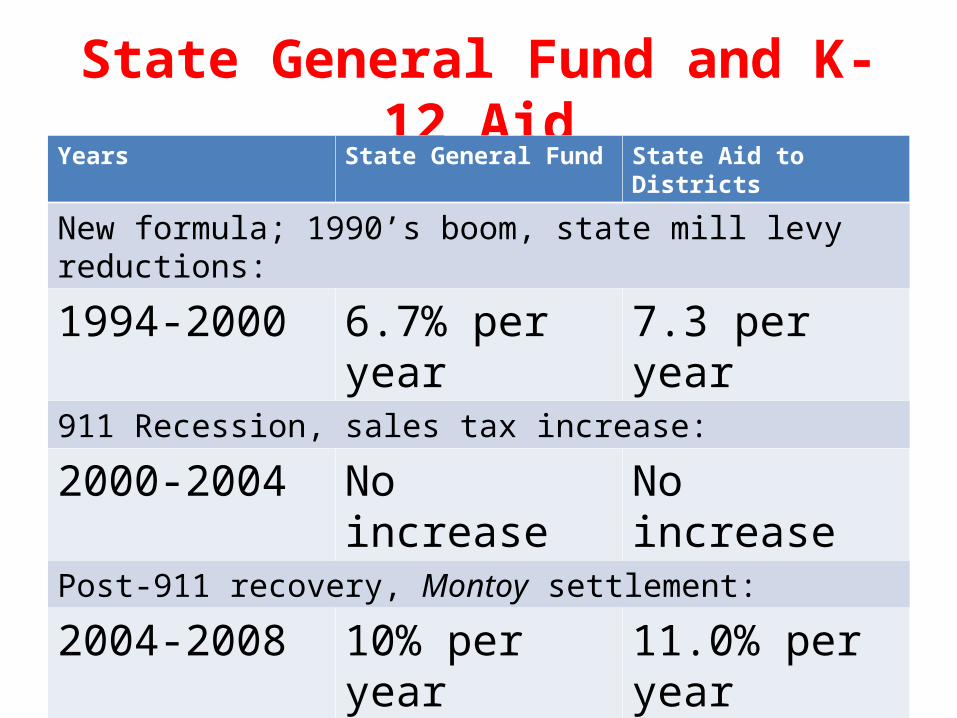
State General Fund and K-12 AidYears State General Fund State Aid to Districts
New formula; 1990’s boom, state mill levy reductions:
1994-2000 6.7% per year 7.3 per year911 Recession, sales tax increase:
2000-2004 No increase No increasePost-911 recovery, Montoy settlement:
2004-2008 10% per year 11.0% per yearGreat Recession, weak recovery:
2008-2012 No increase No increase
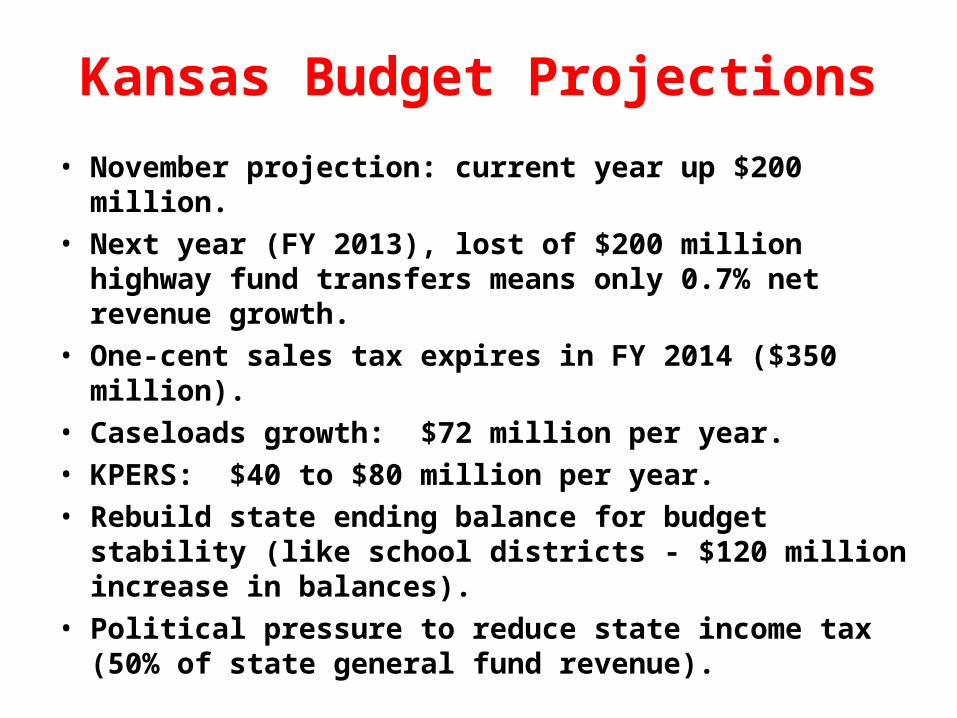
Kansas Budget Projections
• November projection: current year up $200 million.• Next year (FY 2013), lost of $200 million highway fund
transfers means only 0.7% net revenue growth.• One-cent sales tax expires in FY 2014 ($350 million).• Caseloads growth: $72 million per year.• KPERS: $40 to $80 million per year.• Rebuild state ending balance for budget stability (like school
districts - $120 million increase in balances).• Political pressure to reduce state income tax (50% of state
general fund revenue).
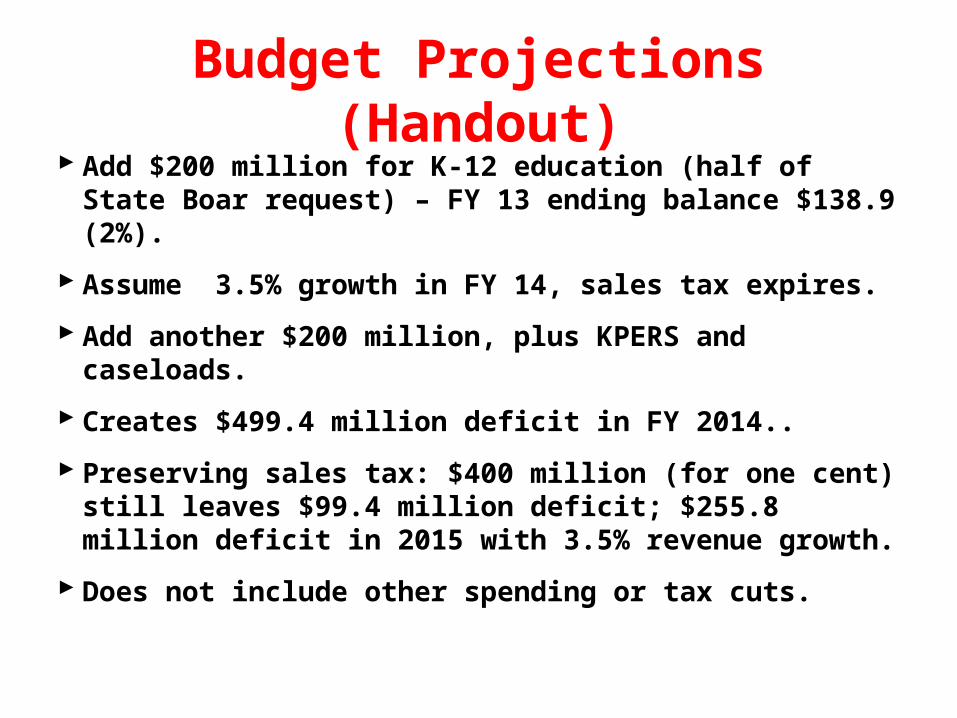
Budget Projections (Handout) Add $200 million for K-12 education (half of State Boar
request) – FY 13 ending balance $138.9 (2%).
Assume 3.5% growth in FY 14, sales tax expires.
Add another $200 million, plus KPERS and caseloads.
Creates $499.4 million deficit in FY 2014..
Preserving sales tax: $400 million (for one cent) still leaves $99.4 million deficit; $255.8 million deficit in 2015 with 3.5% revenue growth.
Does not include other spending or tax cuts.
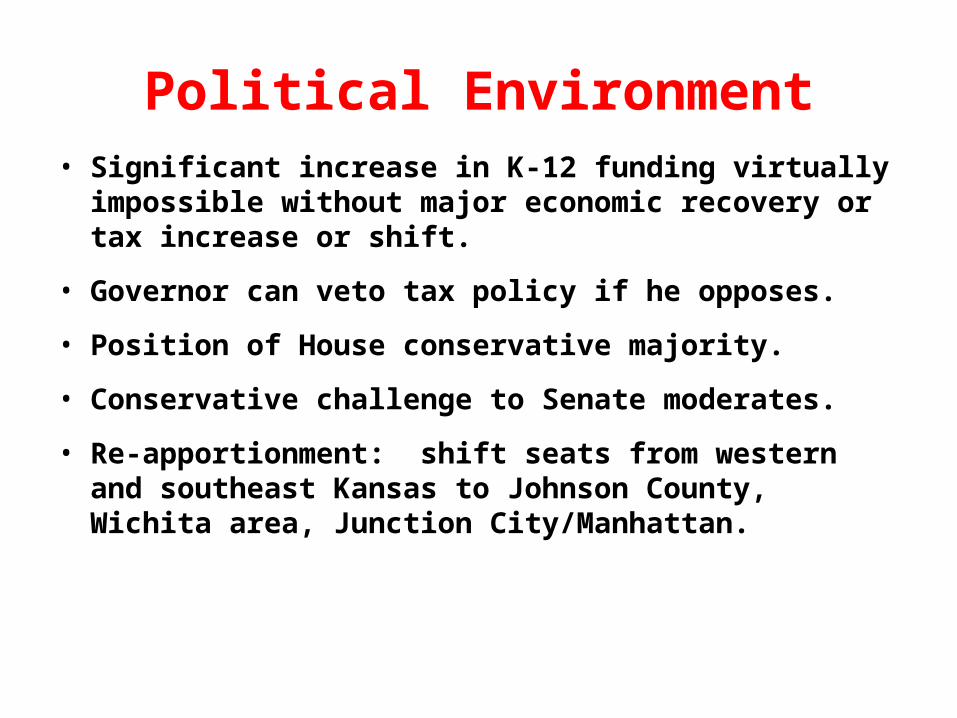
Political Environment• Significant increase in K-12 funding virtually impossible
without major economic recovery or tax increase or shift.
• Governor can veto tax policy if he opposes.
• Position of House conservative majority.
• Conservative challenge to Senate moderates.
• Re-apportionment: shift seats from western and southeast Kansas to Johnson County, Wichita area, Junction City/Manhattan.
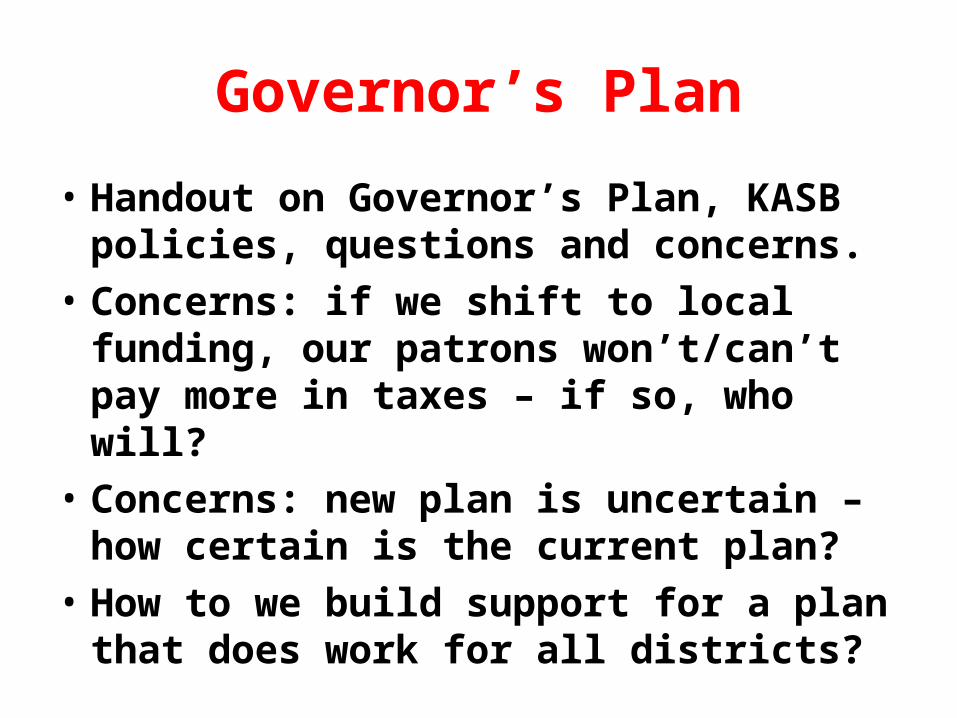
Governor’s Plan
• Handout on Governor’s Plan, KASB policies, questions and concerns.
• Concerns: if we shift to local funding, our patrons won’t/can’t pay more in taxes – if so, who will?
• Concerns: new plan is uncertain – how certain is the current plan?
• How to we build support for a plan that does work for all districts?
Governor’s Concepts Review
• Offers opportunity for increased local funding with some equalization features when state funding may be limited for years.
• Alternative may be NO increased state funding AND more local authority with NO equalization aid.
• May provide increase in both state and local funding.
• May provide more stable and flexible use of some funds.
• Supporting some aspects of plan could result in positive movement, not deadlock or worse. Career/tech, innovation, performance incentives.
Governor’s Concepts Review (continued)
Specific numbers unavailable.
Breaks link between increased local effort and equalization; could be much harder for low wealth districts to maintain quality programs, outcomes.
Breaks link between base and weightings.
Increased reliance on local funding sources makes equalization much more difficult because of disparity on local resources.
Current system produced significant improvement and high national ranking – should we risk change?
NCLB and Kansas Accreditation• Obama administration to allow waiver of No Child Left
Behind if states develop alternative systems.
• Must adopt Common Core standards, college and career-ready achievement, focus on lowest performing schools, teacher evaluation linked to performance.
• Allows broader curriculum focus, less rigid measurement.
• Congress could override – similar plan in Senate.
Kansas Accreditation Issues• State Board to seek waiver in February.
• Revisions to Quality Performance Accreditation.
• Proposed 21st Century model: based on results plus other areas of “best practice.”
• Key issue: state evaluation model (KEEP), must be negotiated under current law.
• Accreditation model vs. other reform initiatives: grading schools, social promotion, school choice, alternative accreditation.
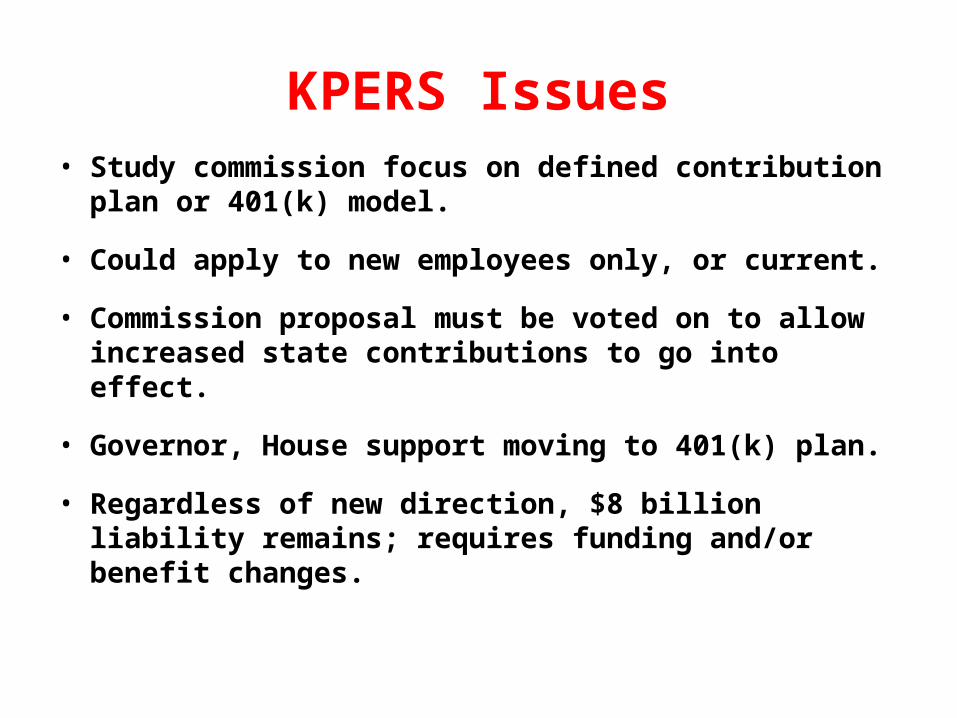
KPERS Issues• Study commission focus on defined contribution plan or
401(k) model.
• Could apply to new employees only, or current.
• Commission proposal must be voted on to allow increased state contributions to go into effect.
• Governor, House support moving to 401(k) plan.
• Regardless of new direction, $8 billion liability remains; requires funding and/or benefit changes.
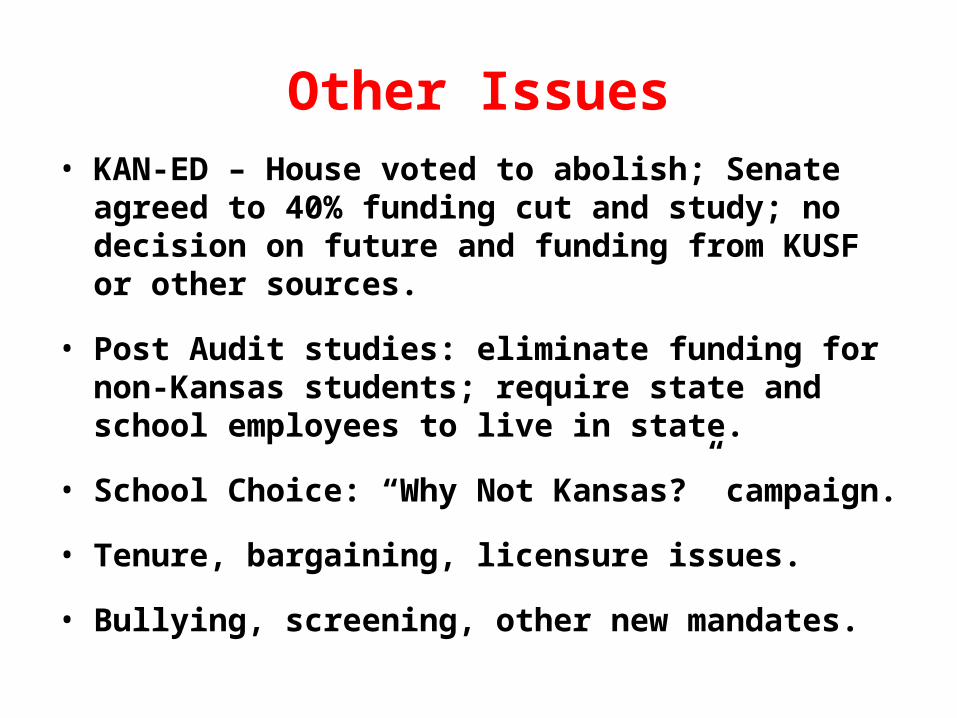
Other Issues• KAN-ED – House voted to abolish; Senate agreed to 40%
funding cut and study; no decision on future and funding from KUSF or other sources.
• Post Audit studies: eliminate funding for non-Kansas students; require state and school employees to live in state.
• School Choice: “Why Not Kansas?” campaign.
• Tenure, bargaining, licensure issues.
• Bullying, screening, other new mandates.
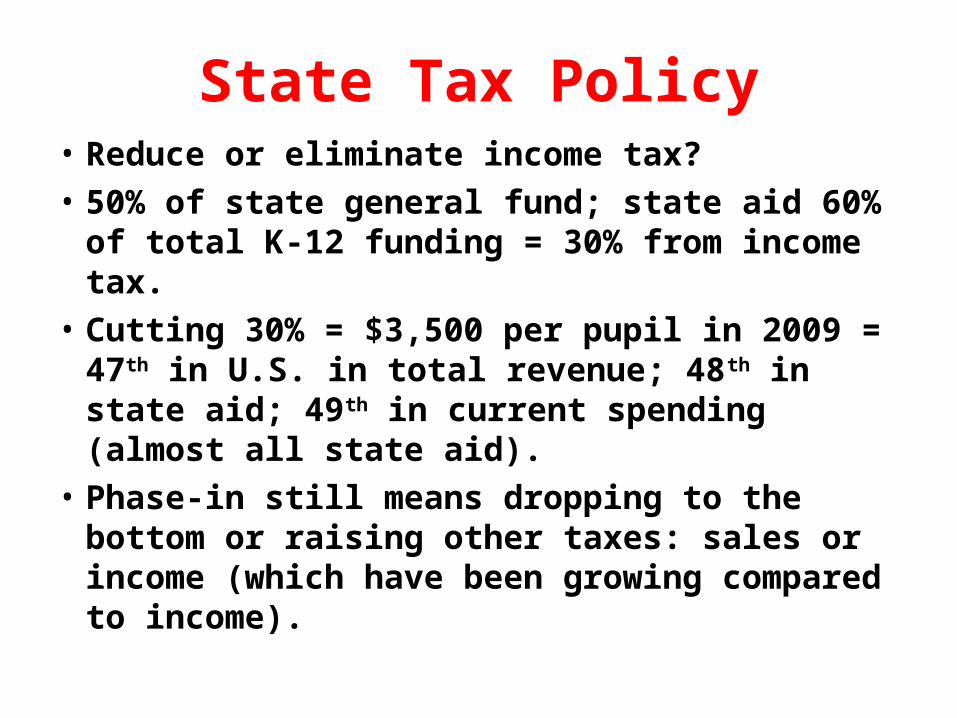
State Tax Policy• Reduce or eliminate income tax?• 50% of state general fund; state aid 60% of
total K-12 funding = 30% from income tax.• Cutting 30% = $3,500 per pupil in 2009 = 47th
in U.S. in total revenue; 48th in state aid; 49th in current spending (almost all state aid).
• Phase-in still means dropping to the bottom or raising other taxes: sales or income (which have been growing compared to income).
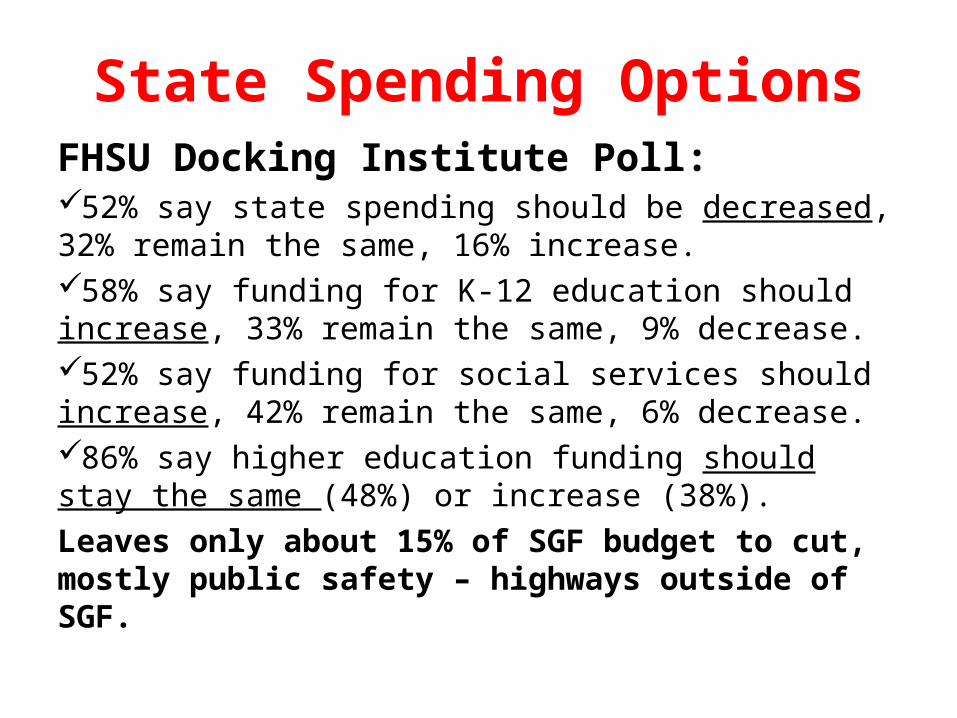
State Spending OptionsFHSU Docking Institute Poll:52% say state spending should be decreased, 32% remain the same, 16% increase.58% say funding for K-12 education should increase, 33% remain the same, 9% decrease.52% say funding for social services should increase, 42% remain the same, 6% decrease.86% say higher education funding should stay the same (48%) or increase (38%).Leaves only about 15% of SGF budget to cut, mostly public safety – highways outside of SGF.
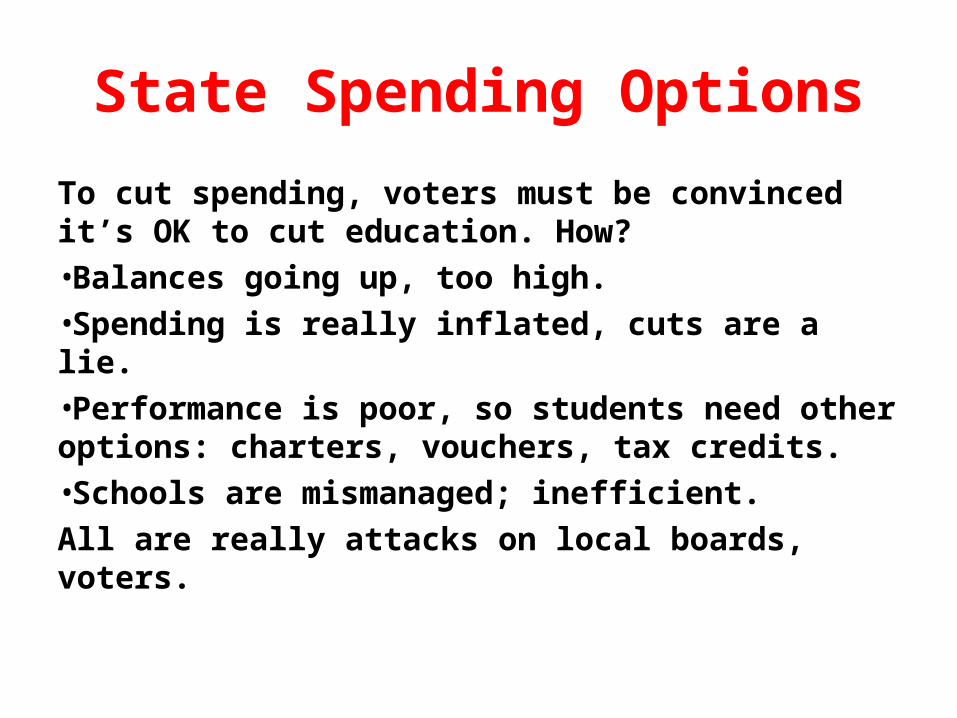
State Spending Options
To cut spending, voters must be convinced it’s OK to cut education. How?•Balances going up, too high.•Spending is really inflated, cuts are a lie.•Performance is poor, so students need other options: charters, vouchers, tax credits.•Schools are mismanaged; inefficient.All are really attacks on local boards, voters.
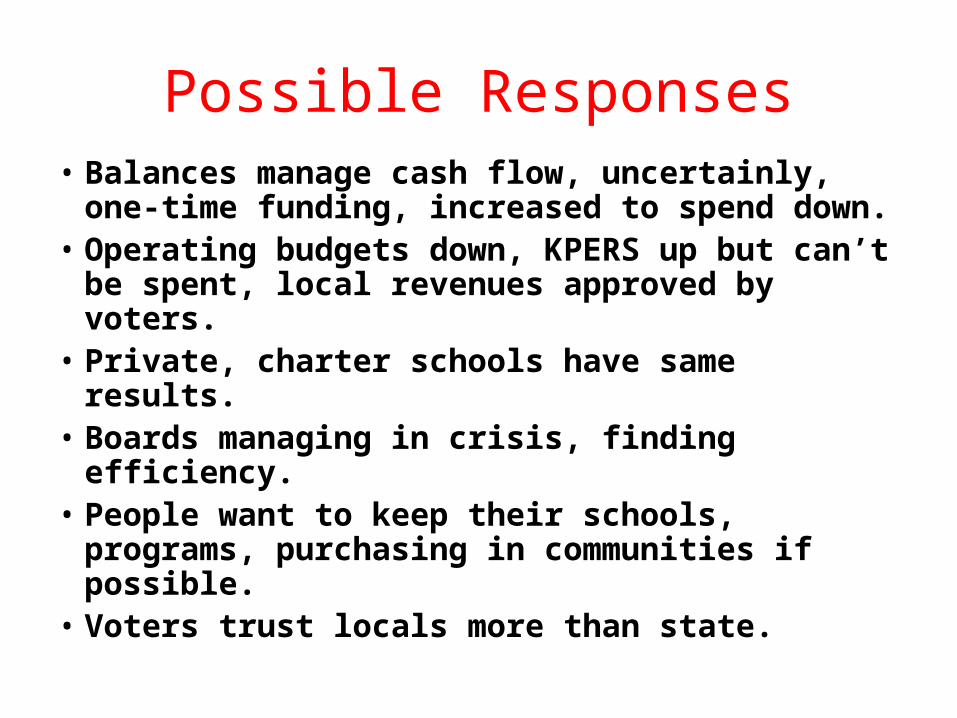
Possible Responses• Balances manage cash flow, uncertainly, one-
time funding, increased to spend down.• Operating budgets down, KPERS up but can’t
be spent, local revenues approved by voters.• Private, charter schools have same results.• Boards managing in crisis, finding efficiency.• People want to keep their schools, programs,
purchasing in communities if possible.• Voters trust locals more than state.
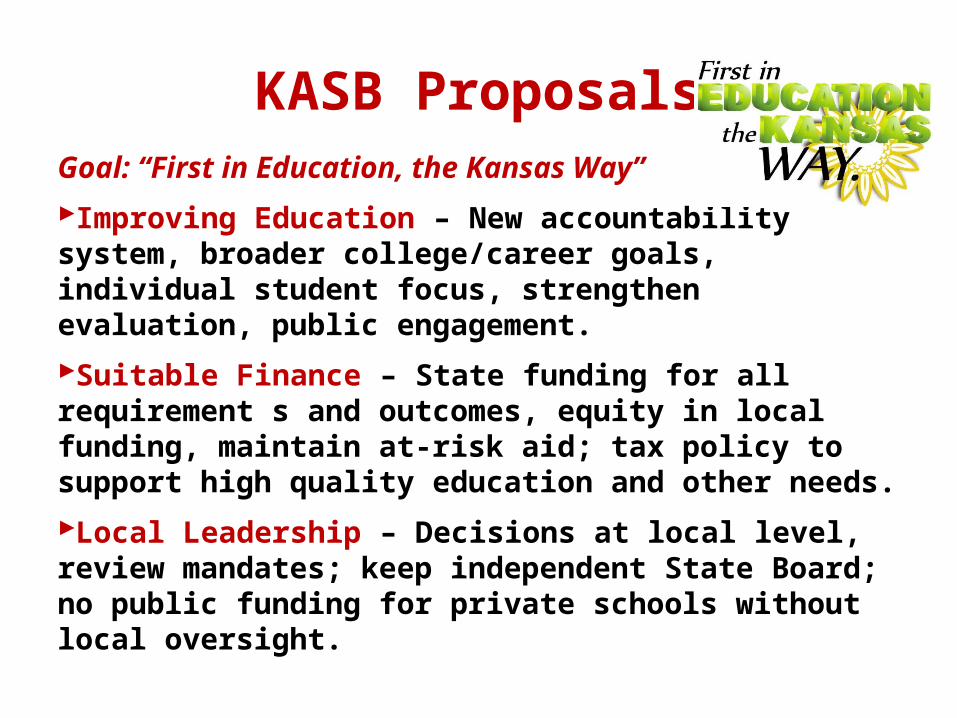
KASB ProposalsGoal: “First in Education, the Kansas Way”
Improving Education – New accountability system, broader college/career goals, individual student focus, strengthen evaluation, public engagement.
Suitable Finance – State funding for all requirement s and outcomes, equity in local funding, maintain at-risk aid; tax policy to support high quality education and other needs.
Local Leadership – Decisions at local level, review mandates; keep independent State Board; no public funding for private schools without local oversight.
Your Next Steps
• Use this information to tell district’s story.• Create a district Legislative program.• Meet your local, area Legislators.• Build a local advocacy team – staff, site
councils, parents, business, community.• Stay active all session.• Get active in the 2012 election: voter
registration/education; personal involvement.