Embed Size (px)
Citation preview
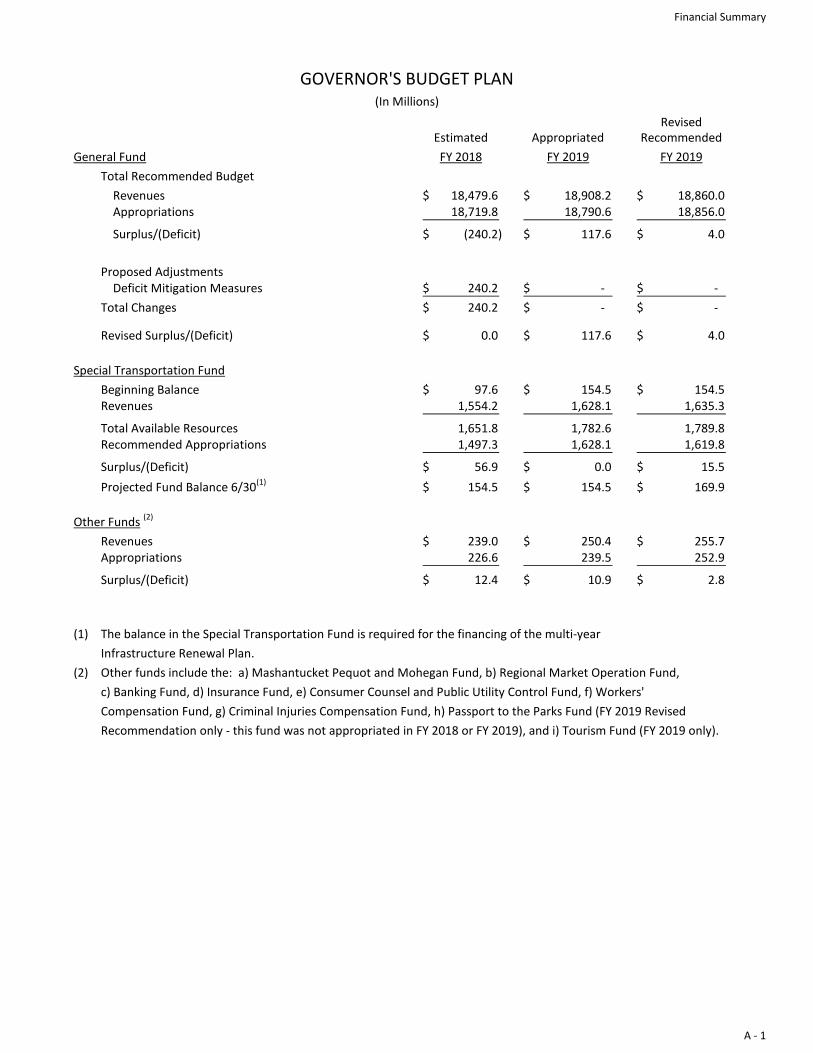
RevisedEstimated Appropriated Recommended
General Fund FY 2018 FY 2019 FY 2019
Total Recommended Budget
Revenues 18,479.6$ 18,908.2$ 18,860.0$ Appropriations 18,719.8 18,790.6 18,856.0
Surplus/(Deficit) (240.2)$ 117.6$ 4.0$
Proposed Adjustments Deficit Mitigation Measures 240.2$ -$ -$
Total Changes 240.2$ -$ -$
Revised Surplus/(Deficit) 0.0$ 117.6$ 4.0$
Special Transportation Fund
Beginning Balance 97.6$ 154.5$ 154.5$ Revenues 1,554.2 1,628.1 1,635.3
Total Available Resources 1,651.8 1,782.6 1,789.8 Recommended Appropriations 1,497.3 1,628.1 1,619.8
Surplus/(Deficit) 56.9$ 0.0$ 15.5$
Projected Fund Balance 6/30(1) 154.5$ 154.5$ 169.9$
Other Funds (2)
Revenues 239.0$ 250.4$ 255.7$ Appropriations 226.6 239.5 252.9
Surplus/(Deficit) 12.4$ 10.9$ 2.8$
(1) The balance in the Special Transportation Fund is required for the financing of the multi-year
Infrastructure Renewal Plan.
(2) Other funds include the: a) Mashantucket Pequot and Mohegan Fund, b) Regional Market Operation Fund,
c) Banking Fund, d) Insurance Fund, e) Consumer Counsel and Public Utility Control Fund, f) Workers'
Compensation Fund, g) Criminal Injuries Compensation Fund, h) Passport to the Parks Fund (FY 2019 Revised
Recommendation only - this fund was not appropriated in FY 2018 or FY 2019), and i) Tourism Fund (FY 2019 only).
GOVERNOR'S BUDGET PLAN(In Millions)
Financial Summary
A - 1
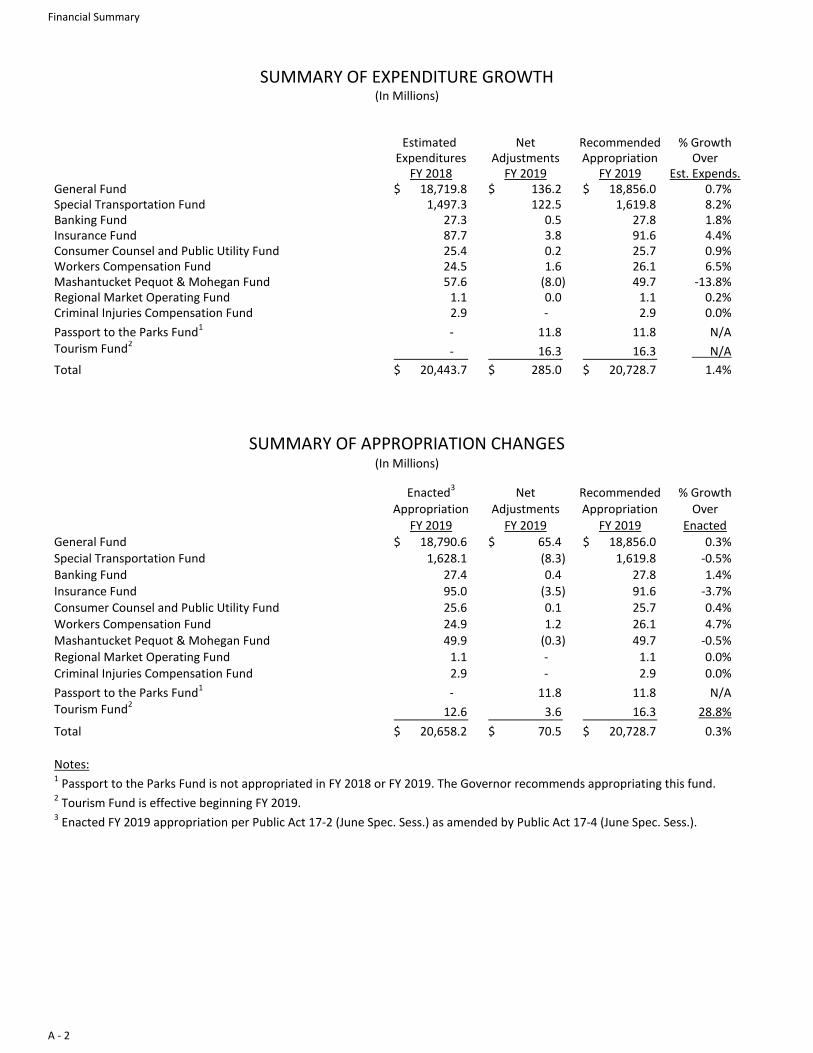
Estimated Net Recommended % GrowthExpenditures Adjustments Appropriation Over
FY 2018 FY 2019 FY 2019 Est. Expends.General Fund 18,719.8$ 136.2$ 18,856.0$ 0.7%Special Transportation Fund 1,497.3 122.5 1,619.8 8.2%Banking Fund 27.3 0.5 27.8 1.8%Insurance Fund 87.7 3.8 91.6 4.4%Consumer Counsel and Public Utility Fund 25.4 0.2 25.7 0.9%Workers Compensation Fund 24.5 1.6 26.1 6.5%Mashantucket Pequot & Mohegan Fund 57.6 (8.0) 49.7 -13.8%Regional Market Operating Fund 1.1 0.0 1.1 0.2%Criminal Injuries Compensation Fund 2.9 - 2.9 0.0%
Passport to the Parks Fund1 - 11.8 11.8 N/ATourism Fund2
- 16.3 16.3 N/A
Total 20,443.7$ 285.0$ 20,728.7$ 1.4%
Enacted3 Net Recommended % GrowthAppropriation Adjustments Appropriation Over
FY 2019 FY 2019 FY 2019 EnactedGeneral Fund 18,790.6$ 65.4$ 18,856.0$ 0.3%Special Transportation Fund 1,628.1 (8.3) 1,619.8 -0.5%Banking Fund 27.4 0.4 27.8 1.4%Insurance Fund 95.0 (3.5) 91.6 -3.7%Consumer Counsel and Public Utility Fund 25.6 0.1 25.7 0.4%Workers Compensation Fund 24.9 1.2 26.1 4.7%Mashantucket Pequot & Mohegan Fund 49.9 (0.3) 49.7 -0.5%Regional Market Operating Fund 1.1 - 1.1 0.0%Criminal Injuries Compensation Fund 2.9 - 2.9 0.0%
Passport to the Parks Fund1 - 11.8 11.8 N/ATourism Fund2
12.6 3.6 16.3 28.8%
Total 20,658.2$ 70.5$ 20,728.7$ 0.3%
Notes:1 Passport to the Parks Fund is not appropriated in FY 2018 or FY 2019. The Governor recommends appropriating this fund.2 Tourism Fund is effective beginning FY 2019.3 Enacted FY 2019 appropriation per Public Act 17-2 (June Spec. Sess.) as amended by Public Act 17-4 (June Spec. Sess.).
SUMMARY OF APPROPRIATION CHANGES(In Millions)
SUMMARY OF EXPENDITURE GROWTH(In Millions)
Financial Summary
A - 2

SPENDING CAP CALCULATIONS
For FY 2019
(in millions)
FY 2018 FY 2019
FY 2018 FY 2018 FY 2019 FY 2019
Biennial FY 2017-18 Revised Biennial Revised
Budget Revisions Cap Budget Budget
Total All Appropriated Funds - Prior Year 19,739.2$ -$ 19,739.2$ 20,430.5$ 20,414.3$
Base adjustment for gross funding of Medicaid 78.6 - 78.6 - -
Newborn screening 3.2 - 3.2 - -
Women's business program DECD (0.4) - (0.4) - -
Passport to Parks (3.6) 3.6 - (1) (4.1) -
Base adjustment for gross funding of ARP - - - - 26.0
Adjusted Total All Appropriated Funds 19,817.0$ 3.6$ 19,820.6$ 20,426.4$ 20,440.3$
Less "Non-Capped" Expenditures:
Debt Service 2,626.1 - 2,626.1 2,925.7 2,897.6
SERS/TRS/JRS Unfunded Actuarial Accrued Liability 1,890.0 - 1,890.0 2,205.3 2,088.5 (3)
Federal Funds 1,257.6 - 1,257.6 (2) 1,717.7 (2) 1,567.8 (4)
Total "Non-Capped" Expenditures - Prior Year $5,773.7 - $5,773.7 $6,848.8 $6,554.0
Total "Capped" Expenditures $14,043.3 - $14,046.9 $13,577.6 $13,886.3
Allowable Cap Growth Rate (5) 2.22% - 2.22% 2.42% 1.77%
Allowable "Capped" Growth 311.9 0.1 312.0 328.9 245.1
"Capped" Expenditures $14,355.2 $3.7 $14,358.9 $13,906.5 $14,131.4
Plus "Non-Capped" Expenditures:
Debt Service $2,925.7 ($28.1) $2,897.6 (1) $2,893.8 $2,873.2
Federal Mandates and Court Orders (new $) 9.6 - 9.6 3.6 10.2
SERS/TRS/JRS Unfunded Actuarial Accrued Liability 2,205.3 - 2,205.3 2,397.1 2,234.9
Federal Funds 1,717.7 (33.4) 1,684.3 (1) 1,647.3 (2) 1,649.1
Total "Non-Capped" Expenditures $6,858.4 ($61.5) $6,796.9 $6,941.8 $6,767.5
Total All Expenditures Allowed $21,213.6 ($57.8) $21,155.7 $20,848.3 $20,899.0
Appropriation for this year $20,430.5 ($16.2) $20,414.3 (1) $20,658.2 $20,728.7
Amount Total Appropriations are Over/
(Under) the Cap (783.0)$ 41.6$ (741.4)$ (190.1)$ (170.2)$
(1) Reflects proposed FY 2018 deficiency bill and passage of Public Act 17-1, January 2018 Special Session.
(2) Number reflects Finance, Revenue, and Bonding Committee estimates of federal grants revenue.
(3) Rebased to reflect OPM estimate of payment of unfunded liabilities.
(4) Rebased to reflect January 16, 2018 consensus revenue.
(5) Growth rate in FY 2018 and FY 2019 based on inflation; original FY 2019 rate based on personal income.
Financial Summary
A - 3
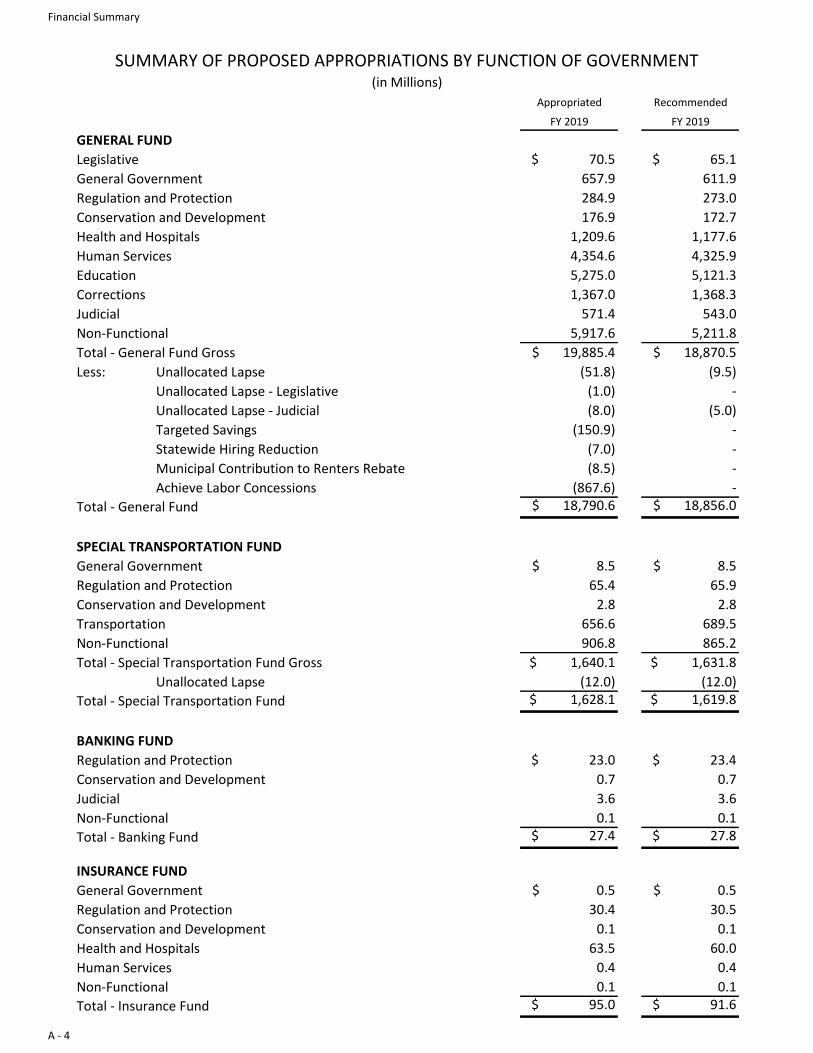
Appropriated Recommended
FY 2019 FY 2019
GENERAL FUND
Legislative $ 70.5 $ 65.1
General Government 657.9 611.9
Regulation and Protection 284.9 273.0
Conservation and Development 176.9 172.7
Health and Hospitals 1,209.6 1,177.6
Human Services 4,354.6 4,325.9
Education 5,275.0 5,121.3
Corrections 1,367.0 1,368.3
Judicial 571.4 543.0
Non-Functional 5,917.6 5,211.8
Total - General Fund Gross $ 19,885.4 $ 18,870.5
Less: Unallocated Lapse (51.8) (9.5)
Unallocated Lapse - Legislative (1.0) -
Unallocated Lapse - Judicial (8.0) (5.0)
Targeted Savings (150.9) -
Statewide Hiring Reduction (7.0) -
Municipal Contribution to Renters Rebate (8.5) -
Achieve Labor Concessions (867.6) -
Total - General Fund $ 18,790.6 $ 18,856.0
SPECIAL TRANSPORTATION FUND
General Government $ 8.5 $ 8.5
Regulation and Protection 65.4 65.9
Conservation and Development 2.8 2.8
Transportation 656.6 689.5
Non-Functional 906.8 865.2
Total - Special Transportation Fund Gross $ 1,640.1 $ 1,631.8
Unallocated Lapse (12.0) (12.0)
Total - Special Transportation Fund $ 1,628.1 $ 1,619.8
BANKING FUND
Regulation and Protection $ 23.0 $ 23.4
Conservation and Development 0.7 0.7
Judicial 3.6 3.6
Non-Functional 0.1 0.1
Total - Banking Fund $ 27.4 $ 27.8
INSURANCE FUND
General Government $ 0.5 $ 0.5
Regulation and Protection 30.4 30.5
Conservation and Development 0.1 0.1
Health and Hospitals 63.5 60.0
Human Services 0.4 0.4
Non-Functional 0.1 0.1
Total - Insurance Fund $ 95.0 $ 91.6
SUMMARY OF PROPOSED APPROPRIATIONS BY FUNCTION OF GOVERNMENT(in Millions)
Financial Summary
A - 4
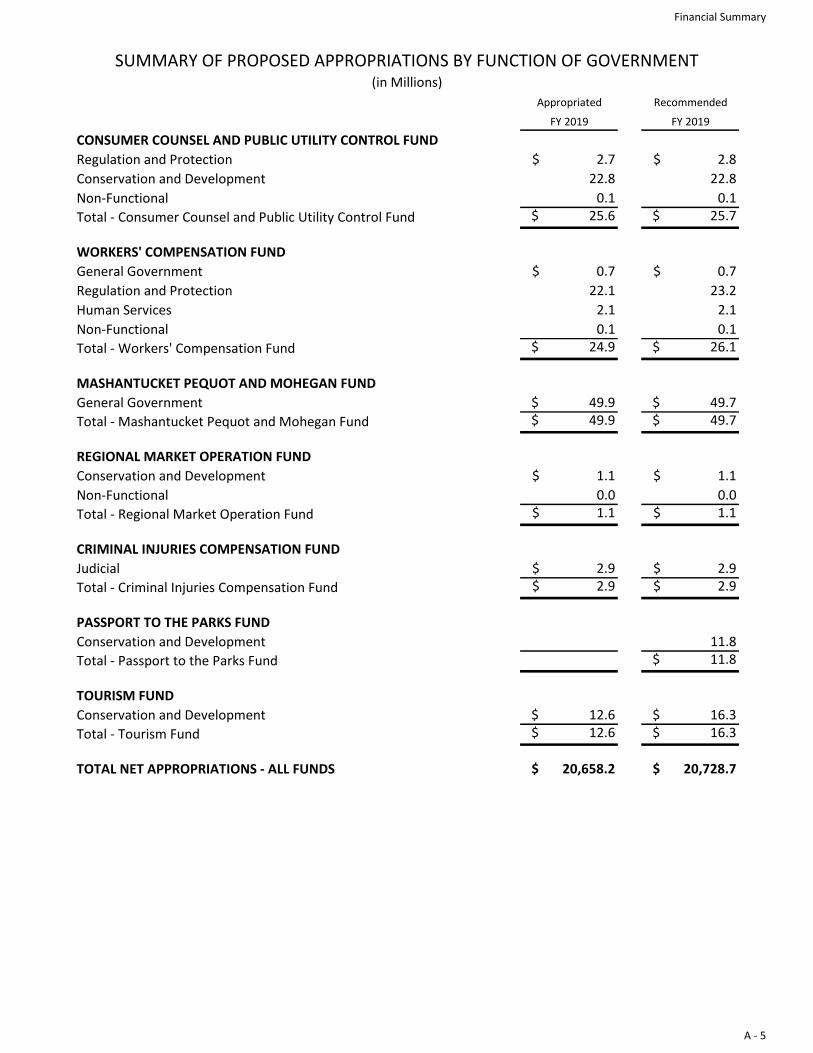
Appropriated Recommended
FY 2019 FY 2019
CONSUMER COUNSEL AND PUBLIC UTILITY CONTROL FUND
Regulation and Protection $ 2.7 $ 2.8
Conservation and Development 22.8 22.8
Non-Functional 0.1 0.1
Total - Consumer Counsel and Public Utility Control Fund $ 25.6 $ 25.7
WORKERS' COMPENSATION FUND
General Government $ 0.7 $ 0.7
Regulation and Protection 22.1 23.2
Human Services 2.1 2.1
Non-Functional 0.1 0.1
Total - Workers' Compensation Fund $ 24.9 $ 26.1
MASHANTUCKET PEQUOT AND MOHEGAN FUND
General Government $ 49.9 $ 49.7
Total - Mashantucket Pequot and Mohegan Fund $ 49.9 $ 49.7
REGIONAL MARKET OPERATION FUND
Conservation and Development $ 1.1 $ 1.1
Non-Functional 0.0 0.0
Total - Regional Market Operation Fund $ 1.1 $ 1.1
CRIMINAL INJURIES COMPENSATION FUND
Judicial $ 2.9 $ 2.9
Total - Criminal Injuries Compensation Fund $ 2.9 $ 2.9
PASSPORT TO THE PARKS FUND
Conservation and Development 11.8
Total - Passport to the Parks Fund $ 11.8
TOURISM FUND
Conservation and Development $ 12.6 $ 16.3
Total - Tourism Fund $ 12.6 $ 16.3
TOTAL NET APPROPRIATIONS - ALL FUNDS $ 20,658.2 $ 20,728.7
SUMMARY OF PROPOSED APPROPRIATIONS BY FUNCTION OF GOVERNMENT(in Millions)
Financial Summary
A - 5
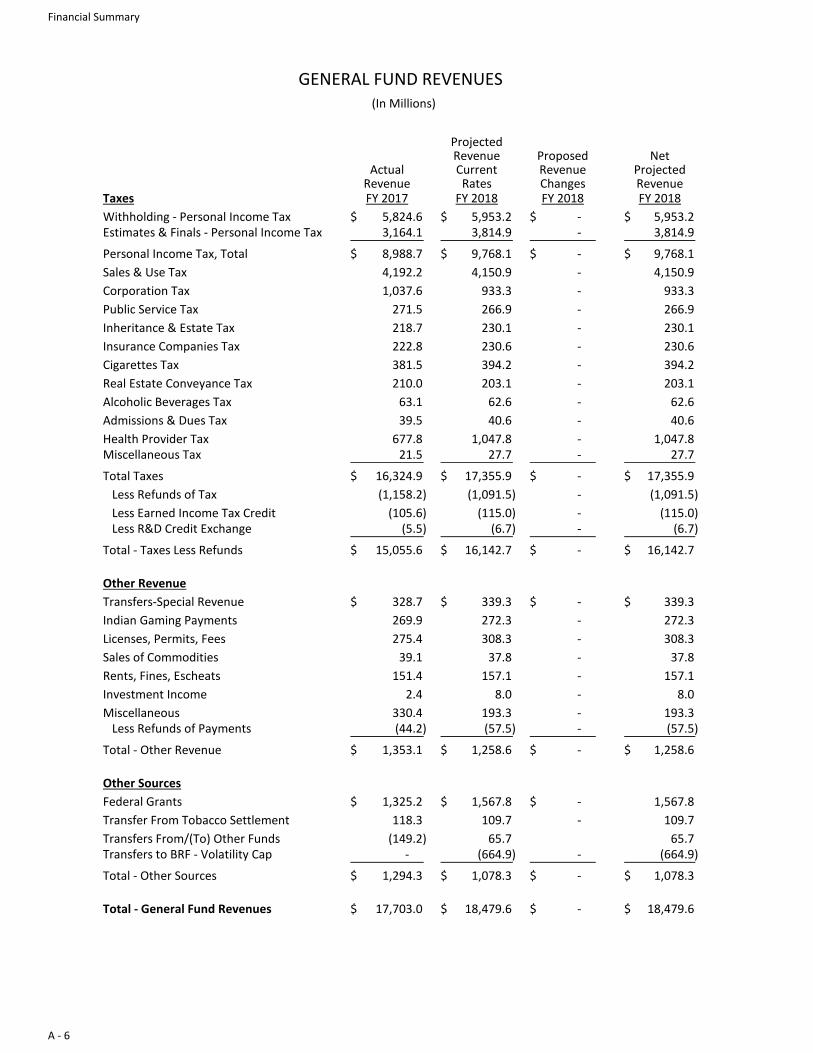
ProjectedRevenue Proposed Net
Actual Current Revenue ProjectedRevenue Rates Changes Revenue
Taxes FY 2017 FY 2018 FY 2018 FY 2018
Withholding - Personal Income Tax 5,824.6$ 5,953.2$ -$ 5,953.2$ Estimates & Finals - Personal Income Tax 3,164.1 3,814.9 - 3,814.9
Personal Income Tax, Total 8,988.7$ 9,768.1$ -$ 9,768.1$
Sales & Use Tax 4,192.2 4,150.9 - 4,150.9
Corporation Tax 1,037.6 933.3 - 933.3
Public Service Tax 271.5 266.9 - 266.9
Inheritance & Estate Tax 218.7 230.1 - 230.1
Insurance Companies Tax 222.8 230.6 - 230.6
Cigarettes Tax 381.5 394.2 - 394.2
Real Estate Conveyance Tax 210.0 203.1 - 203.1
Alcoholic Beverages Tax 63.1 62.6 - 62.6
Admissions & Dues Tax 39.5 40.6 - 40.6
Health Provider Tax 677.8 1,047.8 - 1,047.8 Miscellaneous Tax 21.5 27.7 - 27.7
Total Taxes 16,324.9$ 17,355.9$ -$ 17,355.9$
Less Refunds of Tax (1,158.2) (1,091.5) - (1,091.5)
Less Earned Income Tax Credit (105.6) (115.0) - (115.0) Less R&D Credit Exchange (5.5) (6.7) - (6.7)
Total - Taxes Less Refunds 15,055.6$ 16,142.7$ -$ 16,142.7$
Other Revenue
Transfers-Special Revenue 328.7$ 339.3$ -$ 339.3$
Indian Gaming Payments 269.9 272.3 - 272.3
Licenses, Permits, Fees 275.4 308.3 - 308.3
Sales of Commodities 39.1 37.8 - 37.8
Rents, Fines, Escheats 151.4 157.1 - 157.1
Investment Income 2.4 8.0 - 8.0
Miscellaneous 330.4 193.3 - 193.3 Less Refunds of Payments (44.2) (57.5) - (57.5)
Total - Other Revenue 1,353.1$ 1,258.6$ -$ 1,258.6$
Other Sources
Federal Grants 1,325.2$ 1,567.8$ -$ 1,567.8
Transfer From Tobacco Settlement 118.3 109.7 - 109.7
Transfers From/(To) Other Funds (149.2) 65.7 65.7 Transfers to BRF - Volatility Cap - (664.9) - (664.9)
Total - Other Sources 1,294.3$ 1,078.3$ -$ 1,078.3$
Total - General Fund Revenues 17,703.0$ 18,479.6$ -$ 18,479.6$
GENERAL FUND REVENUES (In Millions)
Financial Summary
A - 6
ProjectedRevenue Proposed NetCurrent Revenue ProjectedRates Changes Revenue
FY 2019 FY 2019 FY 2019
6,059.0$ 16.1$ 6,075.1$ 3,163.1 (600.0) 2,563.1
9,222.1$ (583.9)$ 8,638.2$
4,182.6 33.6 4,216.2
988.9 647.0 1,635.9
244.8 - 244.8
176.2 - 176.2
234.3 - 234.3
390.1 34.2 424.3
209.4 22.9 232.3
63.0 1.5 64.5
41.8 - 41.8
1,049.2 (0.9) 1,048.3 33.1 - 33.1
16,835.5$ 154.4$ 16,989.9$
(1,146.0) 49.7 (1,096.3)
(118.3) - (118.3) (6.9) - (6.9)
15,564.3$ 204.1$ 15,768.4$
346.4$ -$ 346.4$
202.7 - 202.7
341.3 0.1 341.4
38.7 - 38.7
143.7 20.0 163.7
9.5 - 9.5
189.1 35.5 224.6 (58.8) - (58.8)
1,212.6$ 55.6$ 1,268.2$
1,645.3$ 3.8$ 1,649.1$
110.2 - 110.2
106.1 (29.0) 77.2 (13.1) - (13.1)
1,848.5$ (25.2)$ 1,823.4$
18,625.4$ 234.6$ 18,860.0$
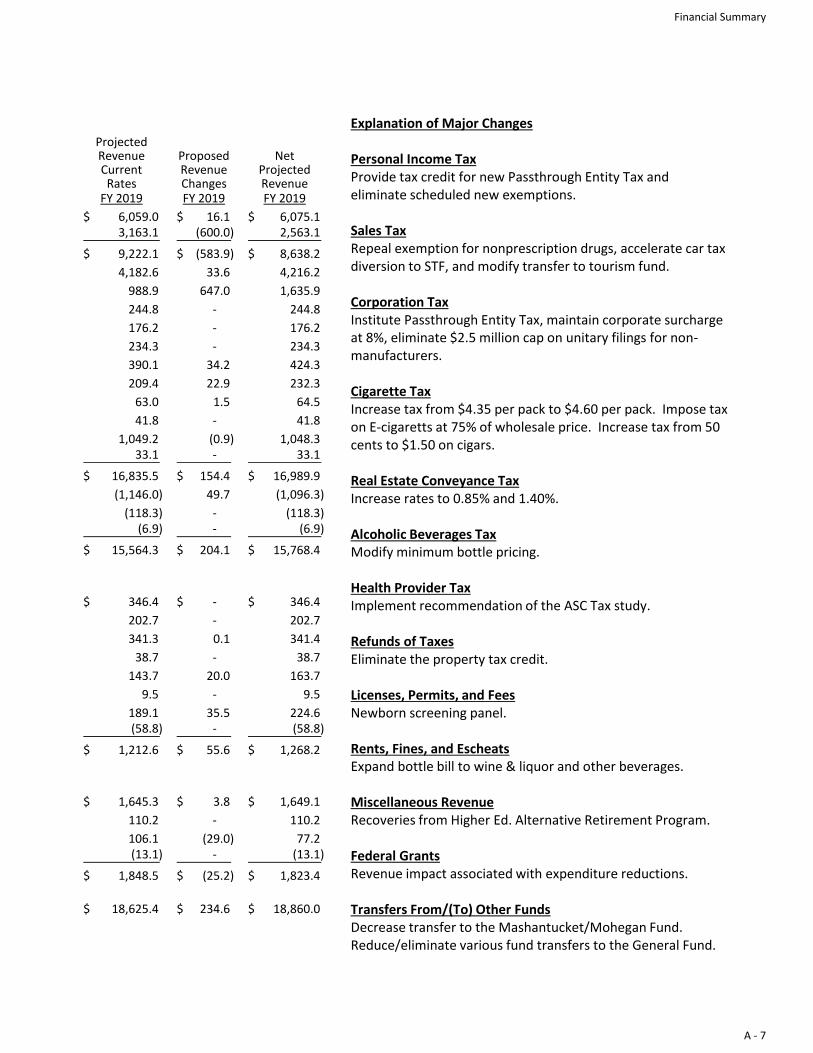
Explanation of Major Changes
Personal Income TaxProvide tax credit for new Passthrough Entity Tax and eliminate scheduled new exemptions.
Sales Tax Repeal exemption for nonprescription drugs, accelerate car tax diversion to STF, and modify transfer to tourism fund.
Corporation TaxInstitute Passthrough Entity Tax, maintain corporate surcharge at 8%, eliminate $2.5 million cap on unitary filings for non-manufacturers.
Cigarette TaxIncrease tax from $4.35 per pack to $4.60 per pack. Impose tax on E-cigaretts at 75% of wholesale price. Increase tax from 50 cents to $1.50 on cigars.
Real Estate Conveyance TaxIncrease rates to 0.85% and 1.40%.
Alcoholic Beverages TaxModify minimum bottle pricing.
Health Provider TaxImplement recommendation of the ASC Tax study.
Refunds of TaxesEliminate the property tax credit.
Licenses, Permits, and FeesNewborn screening panel.
Rents, Fines, and EscheatsExpand bottle bill to wine & liquor and other beverages.
Miscellaneous RevenueRecoveries from Higher Ed. Alternative Retirement Program.
Federal Grants Revenue impact associated with expenditure reductions.
Transfers From/(To) Other FundsDecrease transfer to the Mashantucket/Mohegan Fund. Reduce/eliminate various fund transfers to the General Fund.
Financial Summary
A - 7
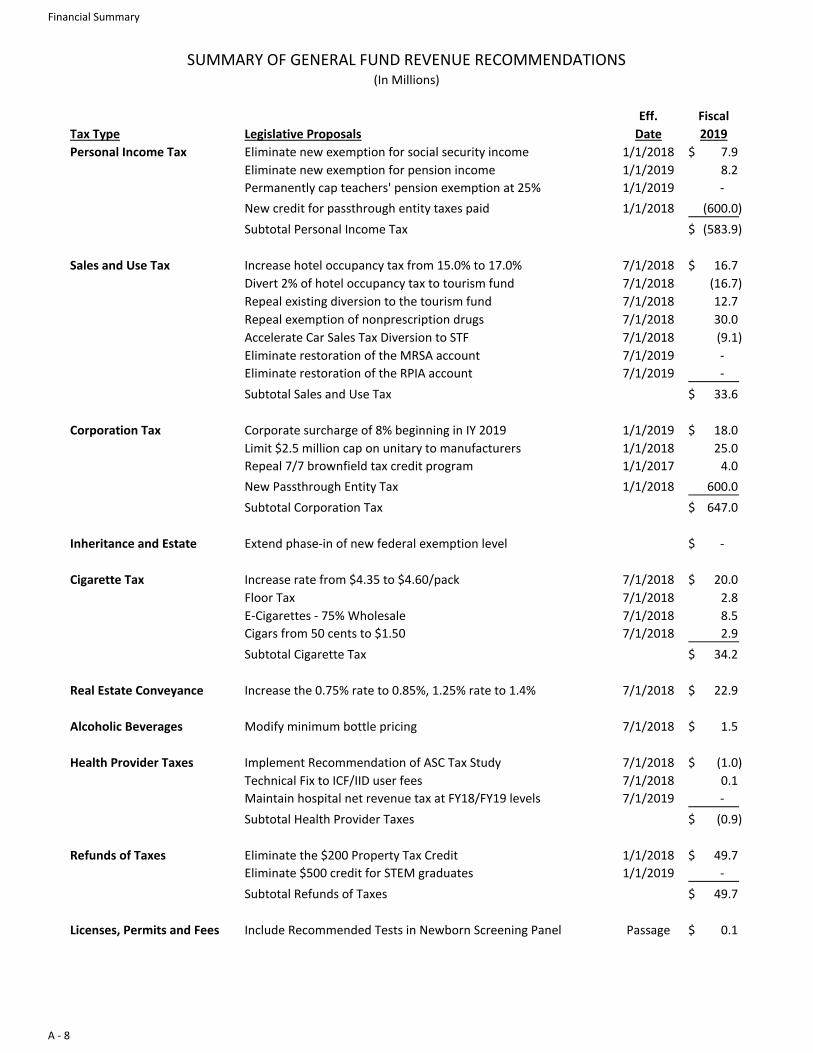
SUMMARY OF GENERAL FUND REVENUE RECOMMENDATIONS(In Millions)
Eff. Fiscal
Tax Type Legislative Proposals Date 2019
Personal Income Tax Eliminate new exemption for social security income 1/1/2018 7.9$
Eliminate new exemption for pension income 1/1/2019 8.2
Permanently cap teachers' pension exemption at 25% 1/1/2019 -
New credit for passthrough entity taxes paid 1/1/2018 (600.0)
Subtotal Personal Income Tax (583.9)$
Sales and Use Tax Increase hotel occupancy tax from 15.0% to 17.0% 7/1/2018 16.7$
Divert 2% of hotel occupancy tax to tourism fund 7/1/2018 (16.7)
Repeal existing diversion to the tourism fund 7/1/2018 12.7
Repeal exemption of nonprescription drugs 7/1/2018 30.0
Accelerate Car Sales Tax Diversion to STF 7/1/2018 (9.1)
Eliminate restoration of the MRSA account 7/1/2019 -
Eliminate restoration of the RPIA account 7/1/2019 -
Subtotal Sales and Use Tax 33.6$
Corporation Tax Corporate surcharge of 8% beginning in IY 2019 1/1/2019 18.0$
Limit $2.5 million cap on unitary to manufacturers 1/1/2018 25.0
Repeal 7/7 brownfield tax credit program 1/1/2017 4.0
New Passthrough Entity Tax 1/1/2018 600.0
Subtotal Corporation Tax 647.0$
Inheritance and Estate Extend phase-in of new federal exemption level -$
Cigarette Tax Increase rate from $4.35 to $4.60/pack 7/1/2018 20.0$
Floor Tax 7/1/2018 2.8
E-Cigarettes - 75% Wholesale 7/1/2018 8.5
Cigars from 50 cents to $1.50 7/1/2018 2.9
Subtotal Cigarette Tax 34.2$
Real Estate Conveyance Increase the 0.75% rate to 0.85%, 1.25% rate to 1.4% 7/1/2018 22.9$
Alcoholic Beverages Modify minimum bottle pricing 7/1/2018 1.5$
Health Provider Taxes Implement Recommendation of ASC Tax Study 7/1/2018 (1.0)$
Technical Fix to ICF/IID user fees 7/1/2018 0.1
Maintain hospital net revenue tax at FY18/FY19 levels 7/1/2019 -
Subtotal Health Provider Taxes (0.9)$
Refunds of Taxes Eliminate the $200 Property Tax Credit 1/1/2018 49.7$
Eliminate $500 credit for STEM graduates 1/1/2019 -
Subtotal Refunds of Taxes 49.7$
Licenses, Permits and Fees Include Recommended Tests in Newborn Screening Panel Passage 0.1$
Financial Summary
A - 8
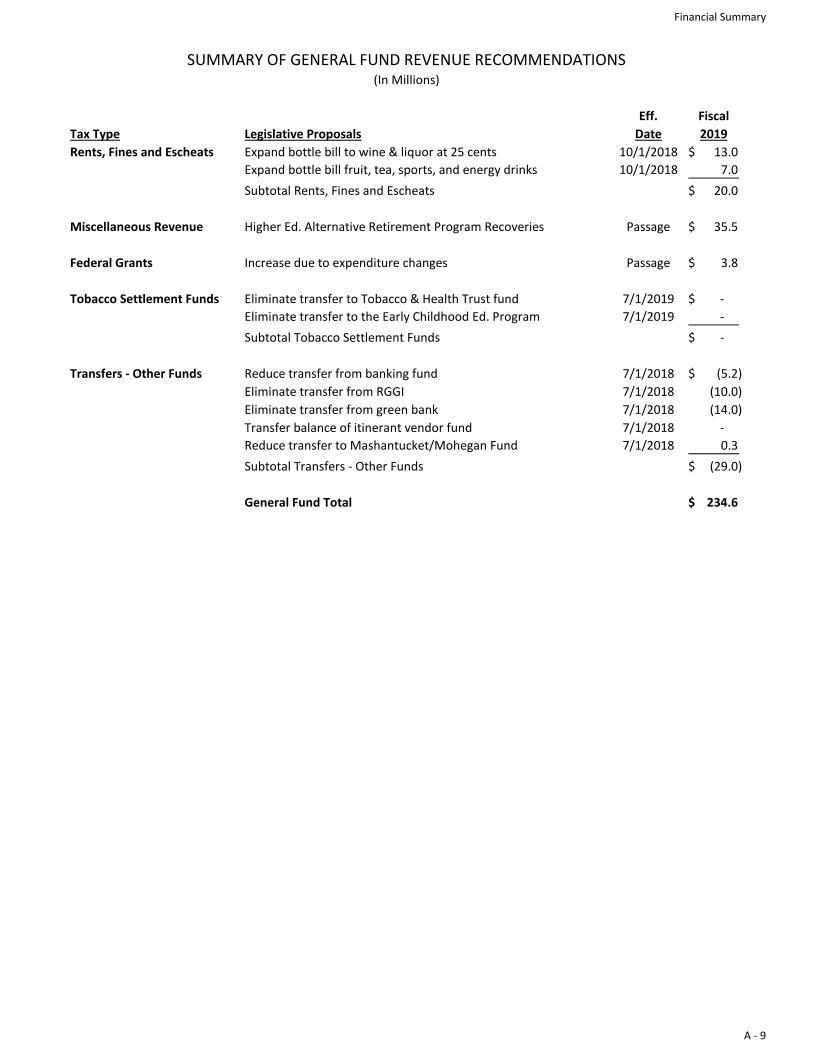
SUMMARY OF GENERAL FUND REVENUE RECOMMENDATIONS(In Millions)
Eff. Fiscal
Tax Type Legislative Proposals Date 2019
Rents, Fines and Escheats Expand bottle bill to wine & liquor at 25 cents 10/1/2018 13.0$
Expand bottle bill fruit, tea, sports, and energy drinks 10/1/2018 7.0
Subtotal Rents, Fines and Escheats 20.0$
Miscellaneous Revenue Higher Ed. Alternative Retirement Program Recoveries Passage 35.5$
Federal Grants Increase due to expenditure changes Passage 3.8$
Tobacco Settlement Funds Eliminate transfer to Tobacco & Health Trust fund 7/1/2019 -$
Eliminate transfer to the Early Childhood Ed. Program 7/1/2019 -
Subtotal Tobacco Settlement Funds -$
Transfers - Other Funds Reduce transfer from banking fund 7/1/2018 (5.2)$
Eliminate transfer from RGGI 7/1/2018 (10.0)
Eliminate transfer from green bank 7/1/2018 (14.0)
Transfer balance of itinerant vendor fund 7/1/2018 -
Reduce transfer to Mashantucket/Mohegan Fund 7/1/2018 0.3
Subtotal Transfers - Other Funds (29.0)$
General Fund Total 234.6$
Financial Summary
A - 9
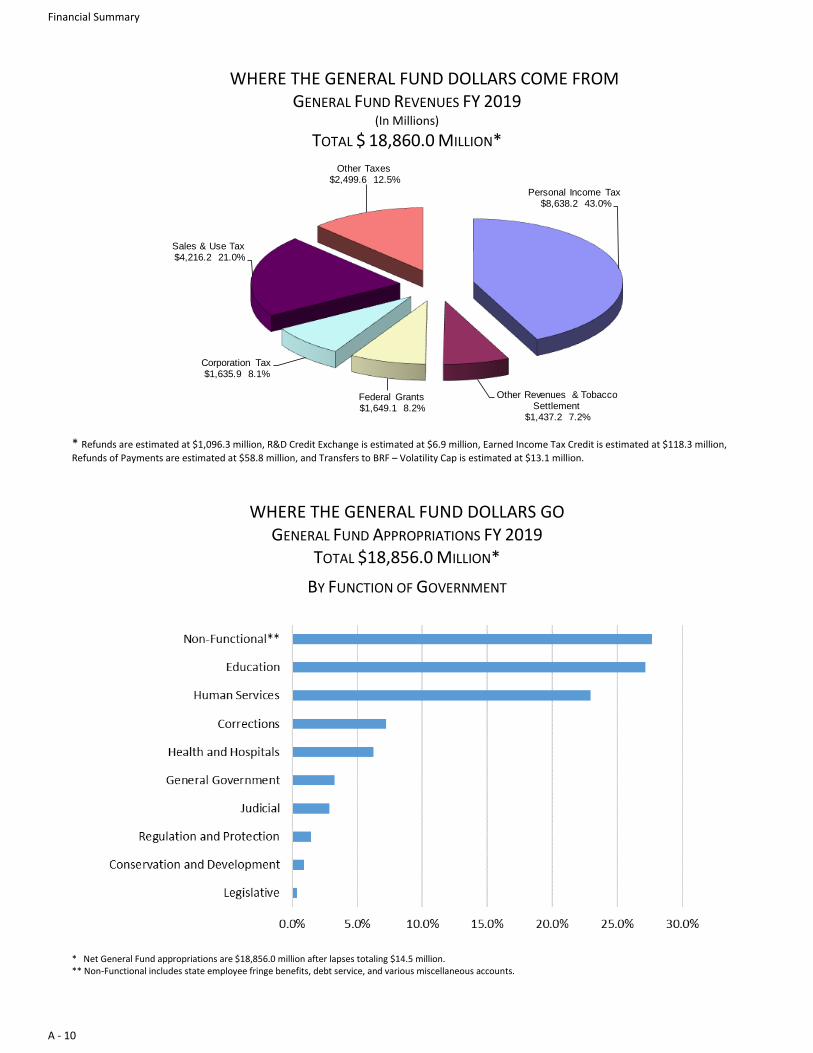
WHERE THE GENERAL FUND DOLLARS COME FROM GENERAL FUND REVENUES FY 2019
(In Millions)
TOTAL $ 18,860.0 MILLION*
Personal Income Tax$8,638.2 43.0%
Other Revenues & Tobacco Settlement
$1,437.2 7.2%
Federal Grants$1,649.1 8.2%
Corporation Tax$1,635.9 8.1%
Sales & Use Tax$4,216.2 21.0%
Other Taxes$2,499.6 12.5%
* Refunds are estimated at $1,096.3 million, R&D Credit Exchange is estimated at $6.9 million, Earned Income Tax Credit is estimated at $118.3 million,
Refunds of Payments are estimated at $58.8 million, and Transfers to BRF – Volatility Cap is estimated at $13.1 million.
WHERE THE GENERAL FUND DOLLARS GO
GENERAL FUND APPROPRIATIONS FY 2019 TOTAL $18,856.0 MILLION*
BY FUNCTION OF GOVERNMENT
* Net General Fund appropriations are $18,856.0 million after lapses totaling $14.5 million. ** Non-Functional includes state employee fringe benefits, debt service, and various miscellaneous accounts.
Financial Summary
A - 10
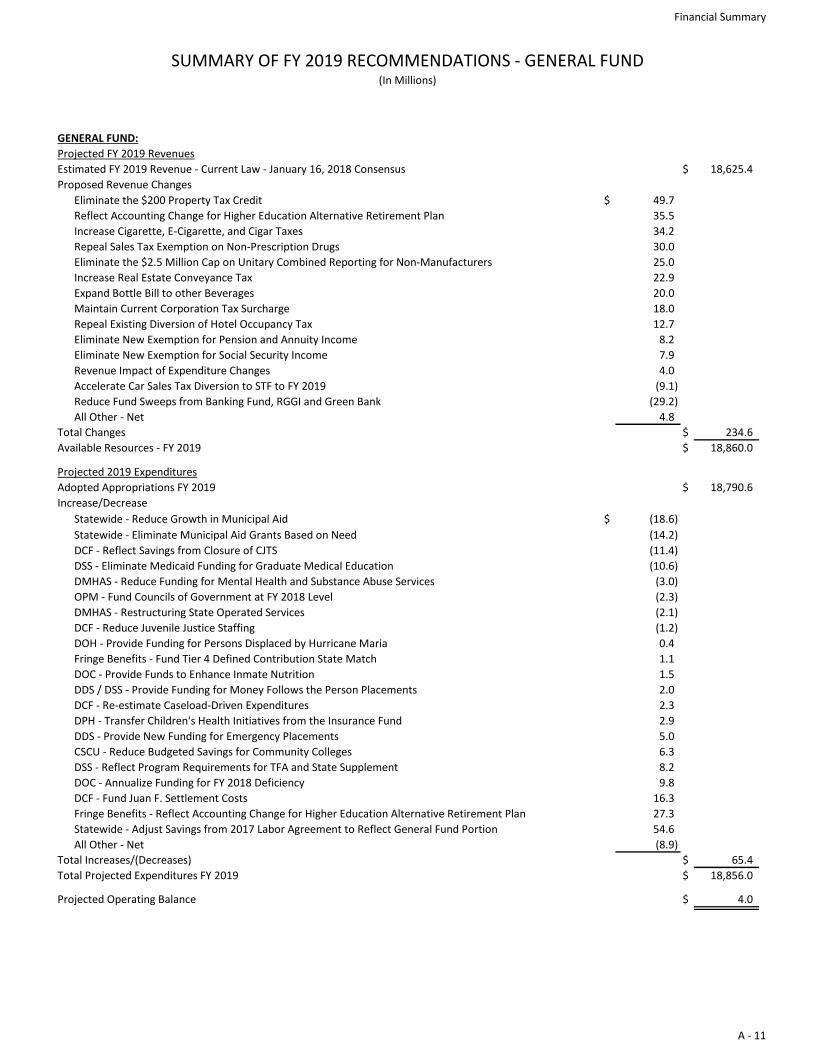
Projected FY 2019 Revenues
Estimated FY 2019 Revenue - Current Law - January 16, 2018 Consensus $ 18,625.4
Proposed Revenue Changes
Eliminate the $200 Property Tax Credit $ 49.7
Reflect Accounting Change for Higher Education Alternative Retirement Plan 35.5
Increase Cigarette, E-Cigarette, and Cigar Taxes 34.2
Repeal Sales Tax Exemption on Non-Prescription Drugs 30.0
Eliminate the $2.5 Million Cap on Unitary Combined Reporting for Non-Manufacturers 25.0
Increase Real Estate Conveyance Tax 22.9
Expand Bottle Bill to other Beverages 20.0
Maintain Current Corporation Tax Surcharge 18.0
Repeal Existing Diversion of Hotel Occupancy Tax 12.7
Eliminate New Exemption for Pension and Annuity Income 8.2
Eliminate New Exemption for Social Security Income 7.9
Revenue Impact of Expenditure Changes 4.0
Accelerate Car Sales Tax Diversion to STF to FY 2019 (9.1)
Reduce Fund Sweeps from Banking Fund, RGGI and Green Bank (29.2)
All Other - Net 4.8
Total Changes $ 234.6
Available Resources - FY 2019 $ 18,860.0
Projected 2019 Expenditures
Adopted Appropriations FY 2019 $ 18,790.6
Increase/Decrease
Statewide - Reduce Growth in Municipal Aid $ (18.6)
Statewide - Eliminate Municipal Aid Grants Based on Need (14.2)
DCF - Reflect Savings from Closure of CJTS (11.4)
DSS - Eliminate Medicaid Funding for Graduate Medical Education (10.6)
DMHAS - Reduce Funding for Mental Health and Substance Abuse Services (3.0)
OPM - Fund Councils of Government at FY 2018 Level (2.3)
DMHAS - Restructuring State Operated Services (2.1)
DCF - Reduce Juvenile Justice Staffing (1.2)
DOH - Provide Funding for Persons Displaced by Hurricane Maria 0.4
Fringe Benefits - Fund Tier 4 Defined Contribution State Match 1.1
DOC - Provide Funds to Enhance Inmate Nutrition 1.5
DDS / DSS - Provide Funding for Money Follows the Person Placements 2.0
DCF - Re-estimate Caseload-Driven Expenditures 2.3
DPH - Transfer Children's Health Initiatives from the Insurance Fund 2.9
DDS - Provide New Funding for Emergency Placements 5.0
CSCU - Reduce Budgeted Savings for Community Colleges 6.3
DSS - Reflect Program Requirements for TFA and State Supplement 8.2
DOC - Annualize Funding for FY 2018 Deficiency 9.8
DCF - Fund Juan F. Settlement Costs 16.3
Fringe Benefits - Reflect Accounting Change for Higher Education Alternative Retirement Plan 27.3
Statewide - Adjust Savings from 2017 Labor Agreement to Reflect General Fund Portion 54.6
All Other - Net (8.9)
Total Increases/(Decreases) $ 65.4
Total Projected Expenditures FY 2019 $ 18,856.0
Projected Operating Balance $ 4.0
SUMMARY OF FY 2019 RECOMMENDATIONS - GENERAL FUND(In Millions)
GENERAL FUND:
Financial Summary
A - 11
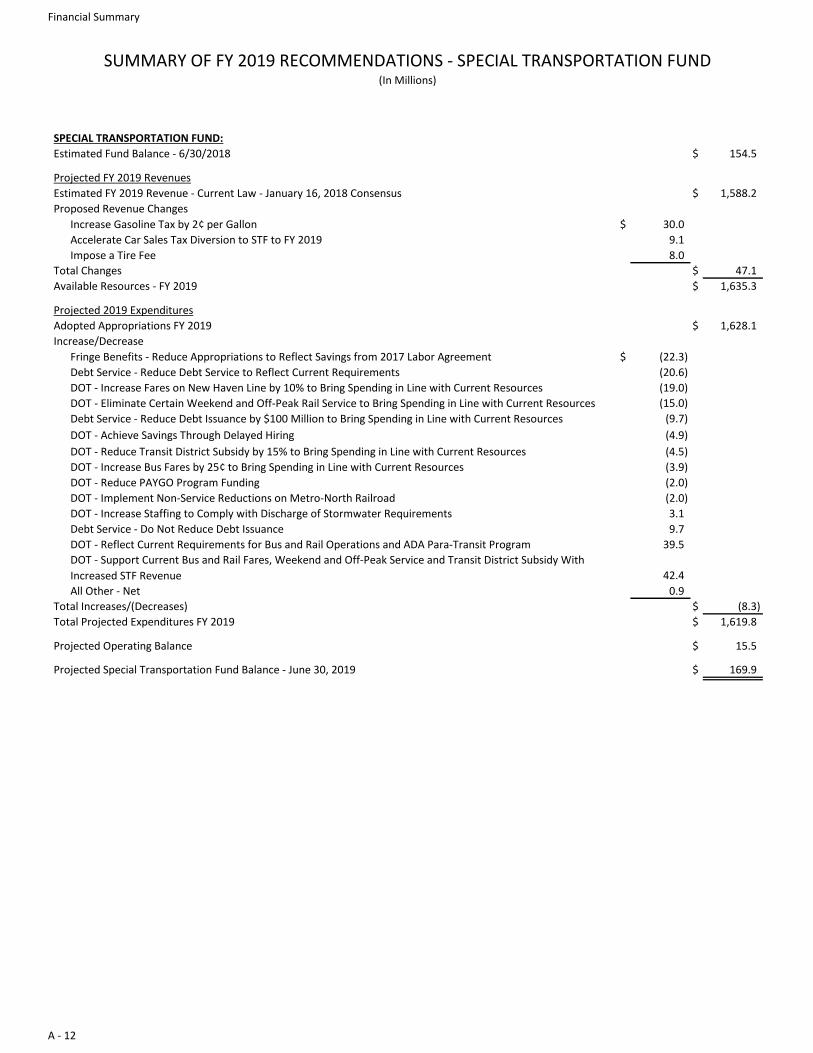
Estimated Fund Balance - 6/30/2018 $ 154.5
Projected FY 2019 Revenues
Estimated FY 2019 Revenue - Current Law - January 16, 2018 Consensus $ 1,588.2
Proposed Revenue Changes
Increase Gasoline Tax by 2¢ per Gallon $ 30.0
Accelerate Car Sales Tax Diversion to STF to FY 2019 9.1
Impose a Tire Fee 8.0
Total Changes $ 47.1
Available Resources - FY 2019 $ 1,635.3
Projected 2019 Expenditures
Adopted Appropriations FY 2019 $ 1,628.1
Increase/Decrease
Fringe Benefits - Reduce Appropriations to Reflect Savings from 2017 Labor Agreement $ (22.3)
Debt Service - Reduce Debt Service to Reflect Current Requirements (20.6)
DOT - Increase Fares on New Haven Line by 10% to Bring Spending in Line with Current Resources (19.0)
DOT - Eliminate Certain Weekend and Off-Peak Rail Service to Bring Spending in Line with Current Resources (15.0)
Debt Service - Reduce Debt Issuance by $100 Million to Bring Spending in Line with Current Resources (9.7)
DOT - Achieve Savings Through Delayed Hiring (4.9)
DOT - Reduce Transit District Subsidy by 15% to Bring Spending in Line with Current Resources (4.5)
DOT - Increase Bus Fares by 25¢ to Bring Spending in Line with Current Resources (3.9)
DOT - Reduce PAYGO Program Funding (2.0)
DOT - Implement Non-Service Reductions on Metro-North Railroad (2.0)
DOT - Increase Staffing to Comply with Discharge of Stormwater Requirements 3.1
Debt Service - Do Not Reduce Debt Issuance 9.7
DOT - Reflect Current Requirements for Bus and Rail Operations and ADA Para-Transit Program 39.5
DOT - Support Current Bus and Rail Fares, Weekend and Off-Peak Service and Transit District Subsidy With
Increased STF Revenue 42.4
All Other - Net 0.9
Total Increases/(Decreases) $ (8.3)
Total Projected Expenditures FY 2019 $ 1,619.8
Projected Operating Balance $ 15.5
Projected Special Transportation Fund Balance - June 30, 2019 $ 169.9
SUMMARY OF FY 2019 RECOMMENDATIONS - SPECIAL TRANSPORTATION FUND(In Millions)
SPECIAL TRANSPORTATION FUND:
Financial Summary
A - 12
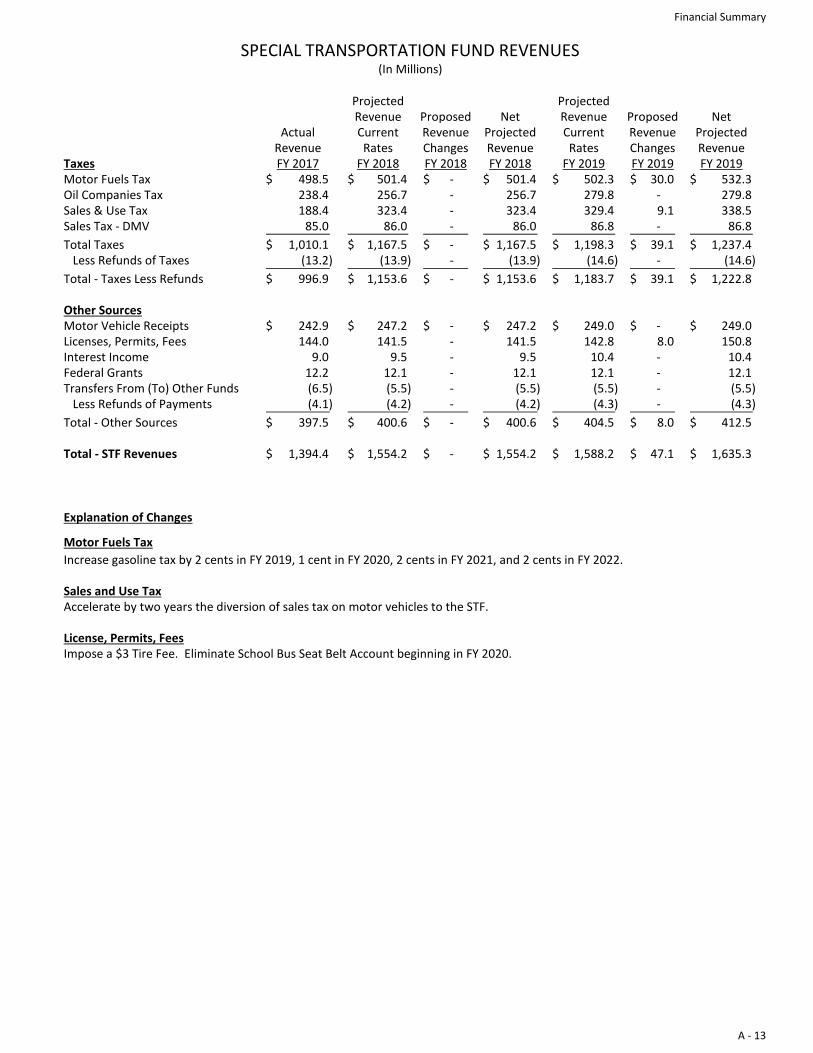
Projected ProjectedRevenue Proposed Net Revenue Proposed Net
Actual Current Revenue Projected Current Revenue ProjectedRevenue Rates Changes Revenue Rates Changes Revenue
Taxes FY 2017 FY 2018 FY 2018 FY 2018 FY 2019 FY 2019 FY 2019Motor Fuels Tax 498.5$ 501.4$ -$ 501.4$ 502.3$ 30.0$ 532.3$ Oil Companies Tax 238.4 256.7 - 256.7 279.8 - 279.8 Sales & Use Tax 188.4 323.4 - 323.4 329.4 9.1 338.5 Sales Tax - DMV 85.0 86.0 - 86.0 86.8 - 86.8
Total Taxes 1,010.1$ 1,167.5$ -$ 1,167.5$ 1,198.3$ 39.1$ 1,237.4$ Less Refunds of Taxes (13.2) (13.9) - (13.9) (14.6) - (14.6)
Total - Taxes Less Refunds 996.9$ 1,153.6$ -$ 1,153.6$ 1,183.7$ 39.1$ 1,222.8$
Other SourcesMotor Vehicle Receipts 242.9$ 247.2$ -$ 247.2$ 249.0$ -$ 249.0$ Licenses, Permits, Fees 144.0 141.5 - 141.5 142.8 8.0 150.8 Interest Income 9.0 9.5 - 9.5 10.4 - 10.4 Federal Grants 12.2 12.1 - 12.1 12.1 - 12.1 Transfers From (To) Other Funds (6.5) (5.5) - (5.5) (5.5) - (5.5) Less Refunds of Payments (4.1) (4.2) - (4.2) (4.3) - (4.3)
Total - Other Sources 397.5$ 400.6$ -$ 400.6$ 404.5$ 8.0$ 412.5$
Total - STF Revenues 1,394.4$ 1,554.2$ -$ 1,554.2$ 1,588.2$ 47.1$ 1,635.3$
Explanation of Changes
Motor Fuels Tax
Increase gasoline tax by 2 cents in FY 2019, 1 cent in FY 2020, 2 cents in FY 2021, and 2 cents in FY 2022.
Sales and Use TaxAccelerate by two years the diversion of sales tax on motor vehicles to the STF.
License, Permits, FeesImpose a $3 Tire Fee. Eliminate School Bus Seat Belt Account beginning in FY 2020.
SPECIAL TRANSPORTATION FUND REVENUES(In Millions)
Financial Summary
A - 13
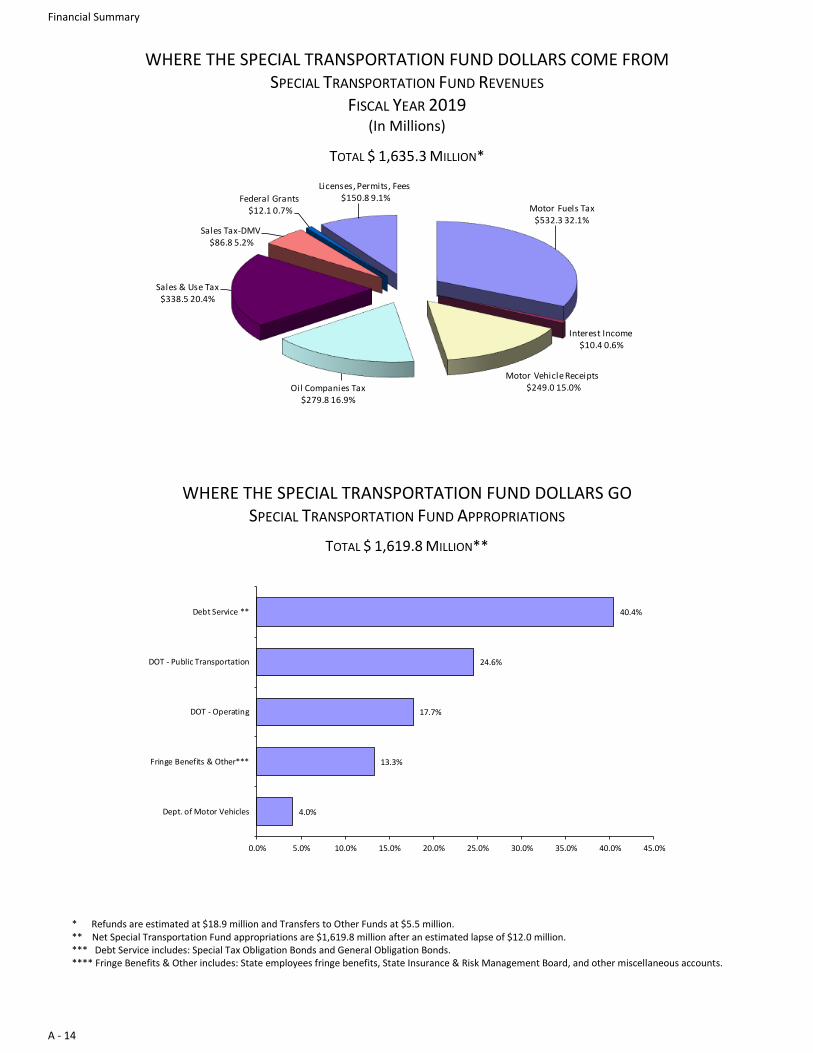
WHERE THE SPECIAL TRANSPORTATION FUND DOLLARS COME FROM SPECIAL TRANSPORTATION FUND REVENUES
FISCAL YEAR 2019 (In Millions)
TOTAL $ 1,635.3 MILLION*
Motor Fuels Tax$532.3 32.1%
Interest Income $10.4 0.6%
Motor Vehicle Receipts$249.0 15.0%Oil Companies Tax
$279.8 16.9%
Sales & Use Tax$338.5 20.4%
Sales Tax-DMV$86.8 5.2%
Federal Grants$12.1 0.7%
Licenses, Permits, Fees$150.8 9.1%
WHERE THE SPECIAL TRANSPORTATION FUND DOLLARS GO
SPECIAL TRANSPORTATION FUND APPROPRIATIONS
TOTAL $ 1,619.8 MILLION**
4.0%
13.3%
17.7%
24.6%
40.4%
0.0% 5.0% 10.0% 15.0% 20.0% 25.0% 30.0% 35.0% 40.0% 45.0%
Dept. of Motor Vehicles
Fringe Benefits & Other***
DOT - Operating
DOT - Public Transportation
Debt Service **
* Refunds are estimated at $18.9 million and Transfers to Other Funds at $5.5 million. ** Net Special Transportation Fund appropriations are $1,619.8 million after an estimated lapse of $12.0 million. *** Debt Service includes: Special Tax Obligation Bonds and General Obligation Bonds. **** Fringe Benefits & Other includes: State employees fringe benefits, State Insurance & Risk Management Board, and other miscellaneous accounts.
Financial Summary
A - 14
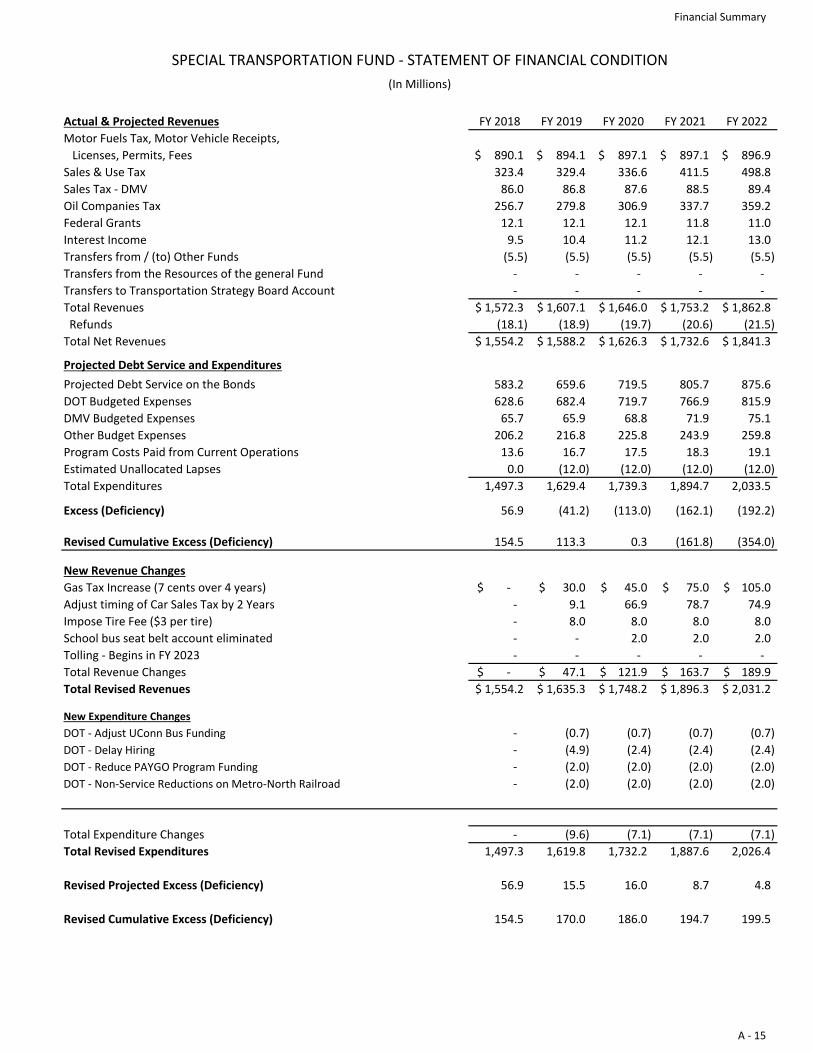
Actual & Projected Revenues FY 2018 FY 2019 FY 2020 FY 2021 FY 2022
Motor Fuels Tax, Motor Vehicle Receipts,
Licenses, Permits, Fees 890.1$ 894.1$ 897.1$ 897.1$ 896.9$
Sales & Use Tax 323.4 329.4 336.6 411.5 498.8
Sales Tax - DMV 86.0 86.8 87.6 88.5 89.4
Oil Companies Tax 256.7 279.8 306.9 337.7 359.2
Federal Grants 12.1 12.1 12.1 11.8 11.0
Interest Income 9.5 10.4 11.2 12.1 13.0
Transfers from / (to) Other Funds (5.5) (5.5) (5.5) (5.5) (5.5)
Transfers from the Resources of the general Fund - - - - -
Transfers to Transportation Strategy Board Account - - - - -
Total Revenues 1,572.3$ 1,607.1$ 1,646.0$ 1,753.2$ 1,862.8$
Refunds (18.1) (18.9) (19.7) (20.6) (21.5)
Total Net Revenues 1,554.2$ 1,588.2$ 1,626.3$ 1,732.6$ 1,841.3$
Projected Debt Service and Expenditures
Projected Debt Service on the Bonds 583.2 659.6 719.5 805.7 875.6
DOT Budgeted Expenses 628.6 682.4 719.7 766.9 815.9
DMV Budgeted Expenses 65.7 65.9 68.8 71.9 75.1
Other Budget Expenses 206.2 216.8 225.8 243.9 259.8
Program Costs Paid from Current Operations 13.6 16.7 17.5 18.3 19.1
Estimated Unallocated Lapses 0.0 (12.0) (12.0) (12.0) (12.0)
Total Expenditures 1,497.3 1,629.4 1,739.3 1,894.7 2,033.5
Excess (Deficiency) 56.9 (41.2) (113.0) (162.1) (192.2)
Revised Cumulative Excess (Deficiency) 154.5 113.3 0.3 (161.8) (354.0)
New Revenue Changes
Gas Tax Increase (7 cents over 4 years) -$ 30.0$ 45.0$ 75.0$ 105.0$
Adjust timing of Car Sales Tax by 2 Years - 9.1 66.9 78.7 74.9
Impose Tire Fee ($3 per tire) - 8.0 8.0 8.0 8.0
School bus seat belt account eliminated - - 2.0 2.0 2.0
Tolling - Begins in FY 2023 - - - - -
Total Revenue Changes -$ 47.1$ 121.9$ 163.7$ 189.9$
Total Revised Revenues 1,554.2$ 1,635.3$ 1,748.2$ 1,896.3$ 2,031.2$
New Expenditure Changes
DOT - Adjust UConn Bus Funding - (0.7) (0.7) (0.7) (0.7)
DOT - Delay Hiring - (4.9) (2.4) (2.4) (2.4)
DOT - Reduce PAYGO Program Funding - (2.0) (2.0) (2.0) (2.0)
DOT - Non-Service Reductions on Metro-North Railroad - (2.0) (2.0) (2.0) (2.0)
Total Expenditure Changes - (9.6) (7.1) (7.1) (7.1)
Total Revised Expenditures 1,497.3 1,619.8 1,732.2 1,887.6 2,026.4
Revised Projected Excess (Deficiency) 56.9 15.5 16.0 8.7 4.8
Revised Cumulative Excess (Deficiency) 154.5 170.0 186.0 194.7 199.5
SPECIAL TRANSPORTATION FUND - STATEMENT OF FINANCIAL CONDITION
(In Millions)
Financial Summary
A - 15
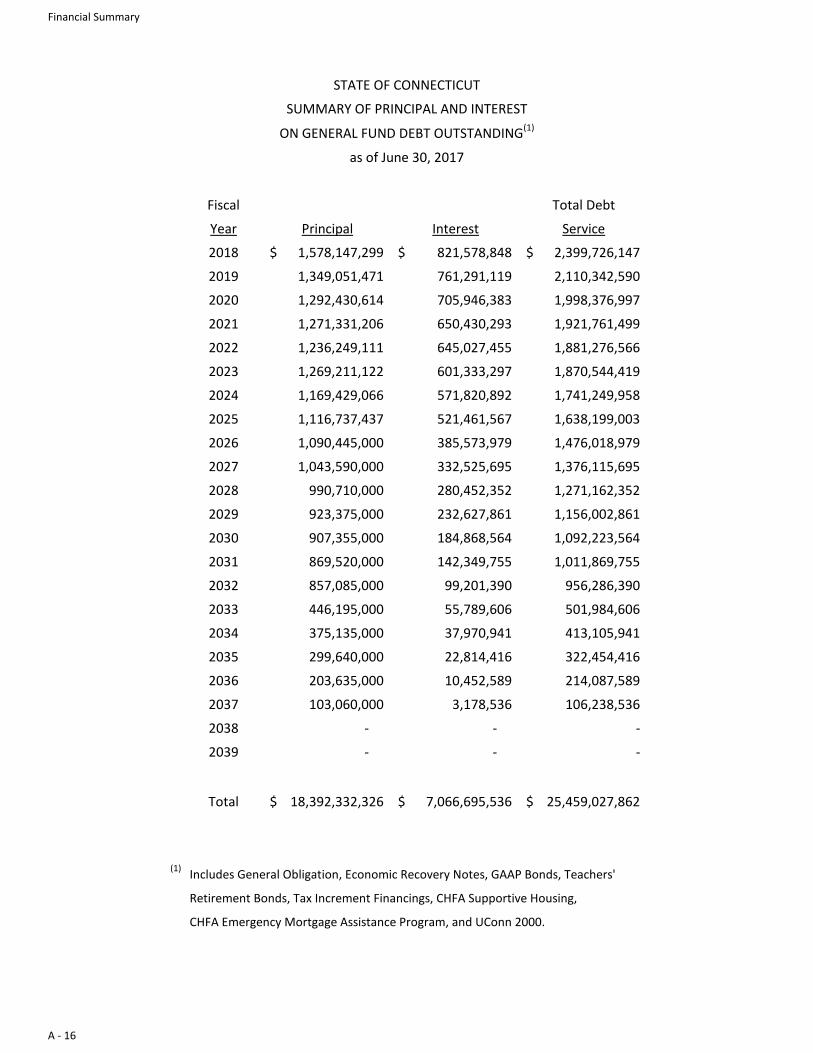
Fiscal Total Debt
Year Principal Interest Service
2018 1,578,147,299$ 821,578,848$ 2,399,726,147$
2019 1,349,051,471 761,291,119 2,110,342,590
2020 1,292,430,614 705,946,383 1,998,376,997
2021 1,271,331,206 650,430,293 1,921,761,499
2022 1,236,249,111 645,027,455 1,881,276,566
2023 1,269,211,122 601,333,297 1,870,544,419
2024 1,169,429,066 571,820,892 1,741,249,958
2025 1,116,737,437 521,461,567 1,638,199,003
2026 1,090,445,000 385,573,979 1,476,018,979
2027 1,043,590,000 332,525,695 1,376,115,695
2028 990,710,000 280,452,352 1,271,162,352
2029 923,375,000 232,627,861 1,156,002,861
2030 907,355,000 184,868,564 1,092,223,564
2031 869,520,000 142,349,755 1,011,869,755
2032 857,085,000 99,201,390 956,286,390
2033 446,195,000 55,789,606 501,984,606
2034 375,135,000 37,970,941 413,105,941
2035 299,640,000 22,814,416 322,454,416
2036 203,635,000 10,452,589 214,087,589
2037 103,060,000 3,178,536 106,238,536
2038 - - -
2039 - - -
Total 18,392,332,326$ 7,066,695,536$ 25,459,027,862$
(1)Includes General Obligation, Economic Recovery Notes, GAAP Bonds, Teachers'
Retirement Bonds, Tax Increment Financings, CHFA Supportive Housing,
CHFA Emergency Mortgage Assistance Program, and UConn 2000.
STATE OF CONNECTICUT
SUMMARY OF PRINCIPAL AND INTEREST
ON GENERAL FUND DEBT OUTSTANDING(1)
as of June 30, 2017
Financial Summary
A - 16
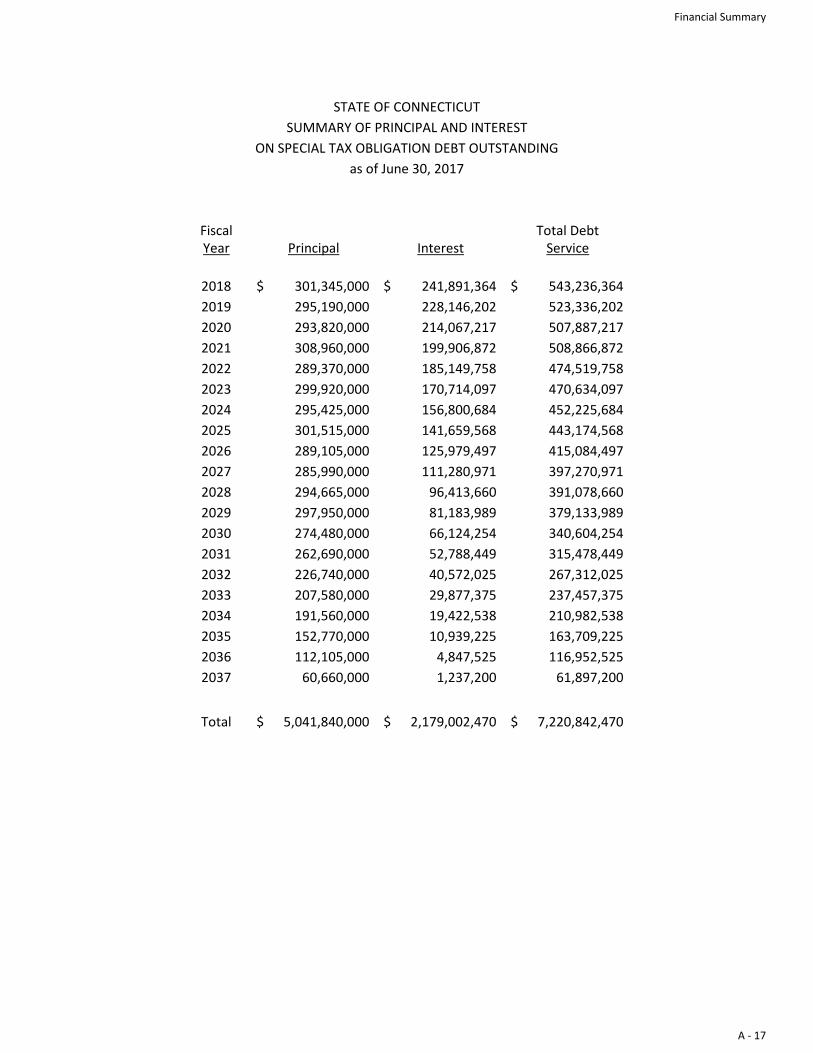
Fiscal Total DebtYear Principal Interest Service
2018 301,345,000$ 241,891,364$ 543,236,364$
2019 295,190,000 228,146,202 523,336,202
2020 293,820,000 214,067,217 507,887,217
2021 308,960,000 199,906,872 508,866,872
2022 289,370,000 185,149,758 474,519,758
2023 299,920,000 170,714,097 470,634,097
2024 295,425,000 156,800,684 452,225,684
2025 301,515,000 141,659,568 443,174,568
2026 289,105,000 125,979,497 415,084,497
2027 285,990,000 111,280,971 397,270,971
2028 294,665,000 96,413,660 391,078,660
2029 297,950,000 81,183,989 379,133,989
2030 274,480,000 66,124,254 340,604,254
2031 262,690,000 52,788,449 315,478,449
2032 226,740,000 40,572,025 267,312,025
2033 207,580,000 29,877,375 237,457,375
2034 191,560,000 19,422,538 210,982,538
2035 152,770,000 10,939,225 163,709,225
2036 112,105,000 4,847,525 116,952,525
2037 60,660,000 1,237,200 61,897,200
Total 5,041,840,000$ 2,179,002,470$ 7,220,842,470$
STATE OF CONNECTICUT
SUMMARY OF PRINCIPAL AND INTEREST
ON SPECIAL TAX OBLIGATION DEBT OUTSTANDING
as of June 30, 2017
Financial Summary
A - 17
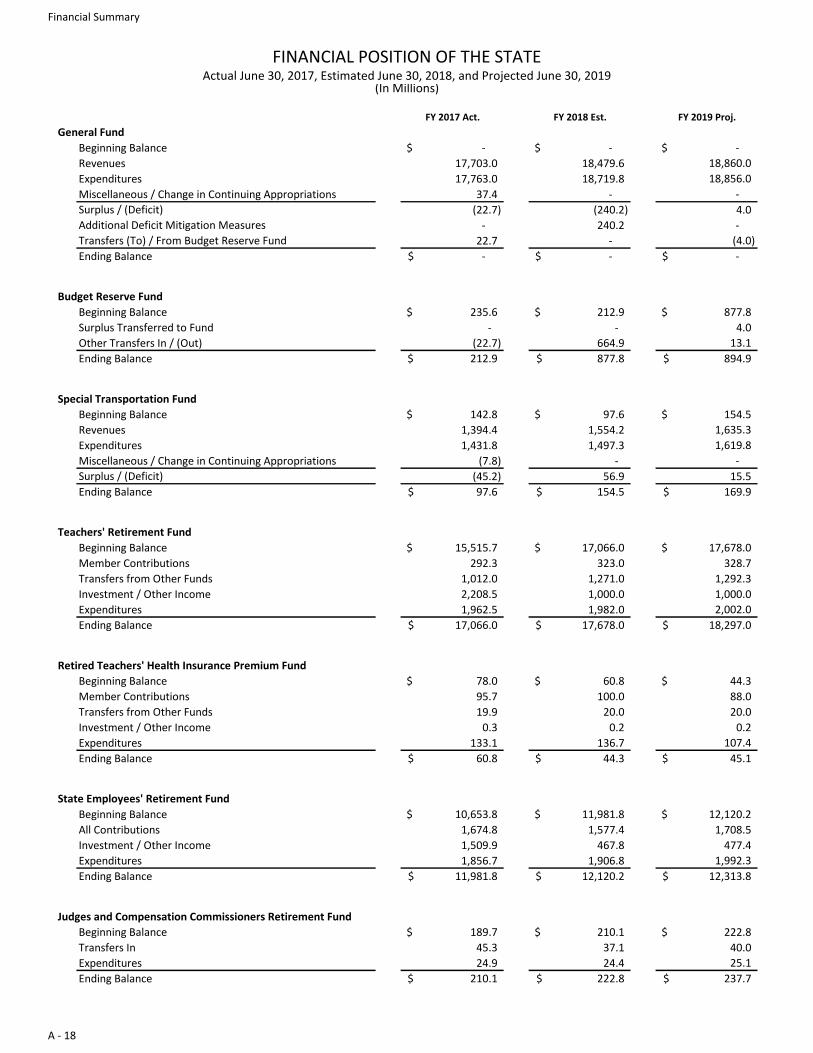
FY 2017 Act. FY 2018 Est. FY 2019 Proj.
General Fund
Beginning Balance -$ -$ -$
Revenues 17,703.0 18,479.6 18,860.0
Expenditures 17,763.0 18,719.8 18,856.0
Miscellaneous / Change in Continuing Appropriations 37.4 - -
Surplus / (Deficit) (22.7) (240.2) 4.0
Additional Deficit Mitigation Measures - 240.2 -
Transfers (To) / From Budget Reserve Fund 22.7 - (4.0)
Ending Balance -$ -$ -$
Budget Reserve Fund
Beginning Balance 235.6$ 212.9$ 877.8$
Surplus Transferred to Fund - - 4.0
Other Transfers In / (Out) (22.7) 664.9 13.1
Ending Balance 212.9$ 877.8$ 894.9$
Special Transportation Fund
Beginning Balance 142.8$ 97.6$ 154.5$
Revenues 1,394.4 1,554.2 1,635.3
Expenditures 1,431.8 1,497.3 1,619.8
Miscellaneous / Change in Continuing Appropriations (7.8) - -
Surplus / (Deficit) (45.2) 56.9 15.5
Ending Balance 97.6$ 154.5$ 169.9$
Teachers' Retirement Fund
Beginning Balance 15,515.7$ 17,066.0$ 17,678.0$
Member Contributions 292.3 323.0 328.7
Transfers from Other Funds 1,012.0 1,271.0 1,292.3
Investment / Other Income 2,208.5 1,000.0 1,000.0
Expenditures 1,962.5 1,982.0 2,002.0
Ending Balance 17,066.0$ 17,678.0$ 18,297.0$
Retired Teachers' Health Insurance Premium Fund
Beginning Balance 78.0$ 60.8$ 44.3$
Member Contributions 95.7 100.0 88.0
Transfers from Other Funds 19.9 20.0 20.0
Investment / Other Income 0.3 0.2 0.2
Expenditures 133.1 136.7 107.4
Ending Balance 60.8$ 44.3$ 45.1$
State Employees' Retirement Fund
Beginning Balance 10,653.8$ 11,981.8$ 12,120.2$
All Contributions 1,674.8 1,577.4 1,708.5
Investment / Other Income 1,509.9 467.8 477.4
Expenditures 1,856.7 1,906.8 1,992.3
Ending Balance 11,981.8$ 12,120.2$ 12,313.8$
Judges and Compensation Commissioners Retirement Fund
Beginning Balance 189.7$ 210.1$ 222.8$
Transfers In 45.3 37.1 40.0
Expenditures 24.9 24.4 25.1
Ending Balance 210.1$ 222.8$ 237.7$
FINANCIAL POSITION OF THE STATEActual June 30, 2017, Estimated June 30, 2018, and Projected June 30, 2019
(In Millions)
Financial Summary
A - 18
FY 2017 Act. FY 2018 Est. FY 2019 Proj.
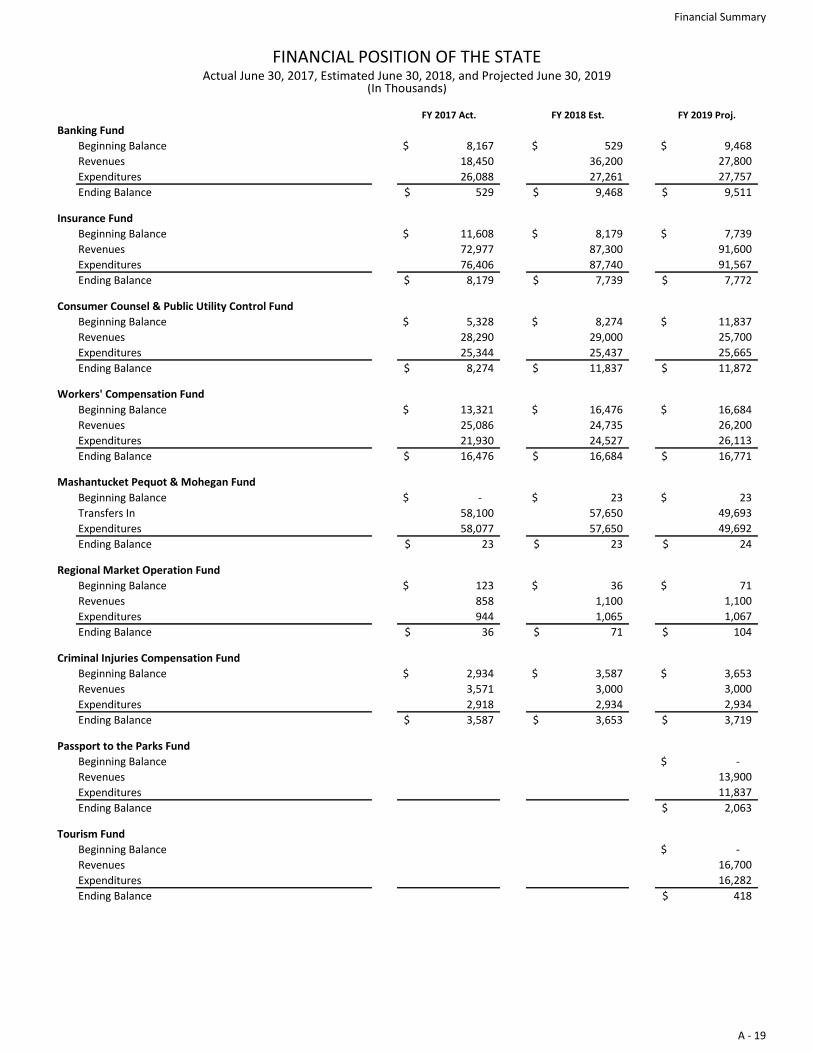
Banking Fund
Beginning Balance 8,167$ 529$ 9,468$
Revenues 18,450 36,200 27,800
Expenditures 26,088 27,261 27,757
Ending Balance 529$ 9,468$ 9,511$
Insurance Fund
Beginning Balance 11,608$ 8,179$ 7,739$
Revenues 72,977 87,300 91,600
Expenditures 76,406 87,740 91,567
Ending Balance 8,179$ 7,739$ 7,772$
Consumer Counsel & Public Utility Control Fund
Beginning Balance 5,328$ 8,274$ 11,837$
Revenues 28,290 29,000 25,700
Expenditures 25,344 25,437 25,665
Ending Balance 8,274$ 11,837$ 11,872$
Workers' Compensation Fund
Beginning Balance 13,321$ 16,476$ 16,684$
Revenues 25,086 24,735 26,200
Expenditures 21,930 24,527 26,113
Ending Balance 16,476$ 16,684$ 16,771$
Mashantucket Pequot & Mohegan Fund
Beginning Balance -$ 23$ 23$
Transfers In 58,100 57,650 49,693
Expenditures 58,077 57,650 49,692
Ending Balance 23$ 23$ 24$
Regional Market Operation Fund
Beginning Balance 123$ 36$ 71$
Revenues 858 1,100 1,100
Expenditures 944 1,065 1,067
Ending Balance 36$ 71$ 104$
Criminal Injuries Compensation Fund
Beginning Balance 2,934$ 3,587$ 3,653$
Revenues 3,571 3,000 3,000
Expenditures 2,918 2,934 2,934
Ending Balance 3,587$ 3,653$ 3,719$
Passport to the Parks Fund
Beginning Balance -$
Revenues 13,900
Expenditures 11,837
Ending Balance 2,063$
Tourism Fund
Beginning Balance -$
Revenues 16,700
Expenditures 16,282
Ending Balance 418$
FINANCIAL POSITION OF THE STATEActual June 30, 2017, Estimated June 30, 2018, and Projected June 30, 2019
(In Thousands)
Financial Summary
A - 19
FY 2017 Act. FY 2018 Est. FY 2019 Proj.
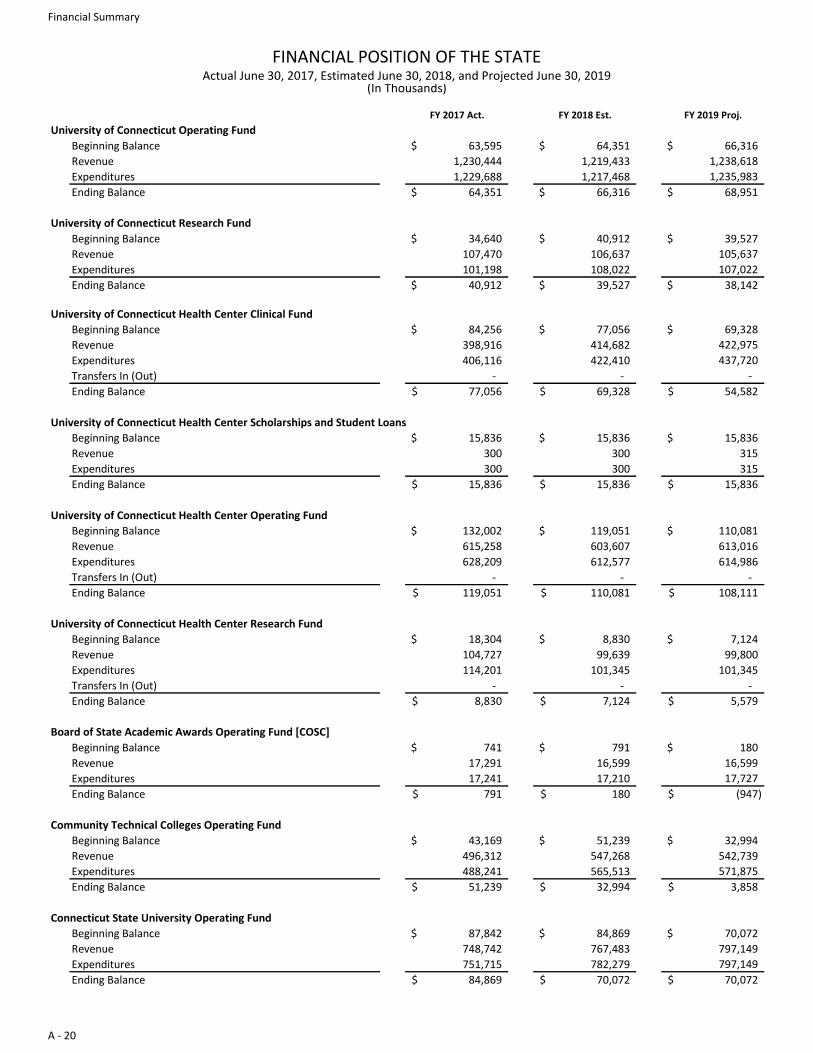
University of Connecticut Operating Fund
Beginning Balance 63,595$ 64,351$ 66,316$
Revenue 1,230,444 1,219,433 1,238,618
Expenditures 1,229,688 1,217,468 1,235,983
Ending Balance 64,351$ 66,316$ 68,951$
University of Connecticut Research Fund
Beginning Balance 34,640$ 40,912$ 39,527$
Revenue 107,470 106,637 105,637
Expenditures 101,198 108,022 107,022
Ending Balance 40,912$ 39,527$ 38,142$
University of Connecticut Health Center Clinical Fund
Beginning Balance 84,256$ 77,056$ 69,328$
Revenue 398,916 414,682 422,975
Expenditures 406,116 422,410 437,720
Transfers In (Out) - - -
Ending Balance 77,056$ 69,328$ 54,582$
University of Connecticut Health Center Scholarships and Student Loans
Beginning Balance 15,836$ 15,836$ 15,836$
Revenue 300 300 315
Expenditures 300 300 315
Ending Balance 15,836$ 15,836$ 15,836$
University of Connecticut Health Center Operating Fund
Beginning Balance 132,002$ 119,051$ 110,081$
Revenue 615,258 603,607 613,016
Expenditures 628,209 612,577 614,986
Transfers In (Out) - - -
Ending Balance 119,051$ 110,081$ 108,111$
University of Connecticut Health Center Research Fund
Beginning Balance 18,304$ 8,830$ 7,124$
Revenue 104,727 99,639 99,800
Expenditures 114,201 101,345 101,345
Transfers In (Out) - - -
Ending Balance 8,830$ 7,124$ 5,579$
Board of State Academic Awards Operating Fund [COSC]
Beginning Balance 741$ 791$ 180$
Revenue 17,291 16,599 16,599
Expenditures 17,241 17,210 17,727
Ending Balance 791$ 180$ (947)$
Community Technical Colleges Operating Fund
Beginning Balance 43,169$ 51,239$ 32,994$
Revenue 496,312 547,268 542,739
Expenditures 488,241 565,513 571,875
Ending Balance 51,239$ 32,994$ 3,858$
Connecticut State University Operating Fund
Beginning Balance 87,842$ 84,869$ 70,072$
Revenue 748,742 767,483 797,149
Expenditures 751,715 782,279 797,149
Ending Balance 84,869$ 70,072$ 70,072$
FINANCIAL POSITION OF THE STATEActual June 30, 2017, Estimated June 30, 2018, and Projected June 30, 2019
(In Thousands)
Financial Summary
A - 20
FY 2017 Act. FY 2018 Est. FY 2019 Proj.
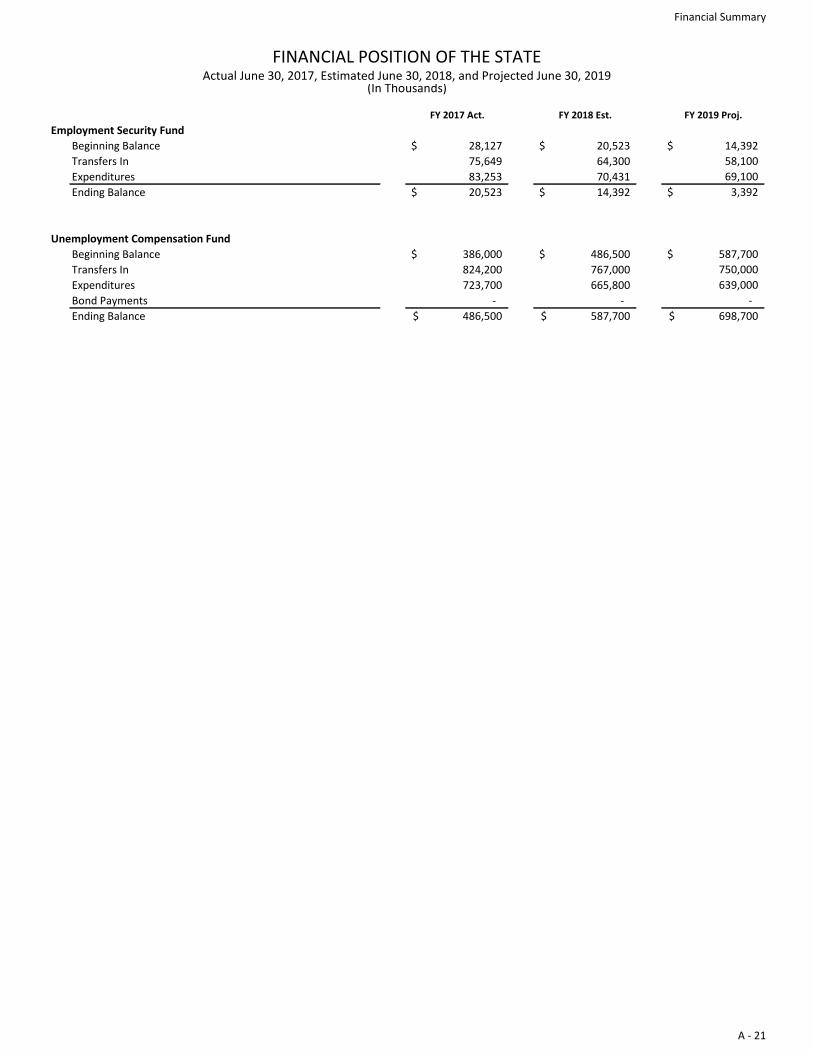
Employment Security Fund
Beginning Balance 28,127$ 20,523$ 14,392$
Transfers In 75,649 64,300 58,100
Expenditures 83,253 70,431 69,100
Ending Balance 20,523$ 14,392$ 3,392$
Unemployment Compensation Fund
Beginning Balance 386,000$ 486,500$ 587,700$
Transfers In 824,200 767,000 750,000
Expenditures 723,700 665,800 639,000
Bond Payments - - -
Ending Balance 486,500$ 587,700$ 698,700$
FINANCIAL POSITION OF THE STATEActual June 30, 2017, Estimated June 30, 2018, and Projected June 30, 2019
(In Thousands)
Financial Summary
A - 21
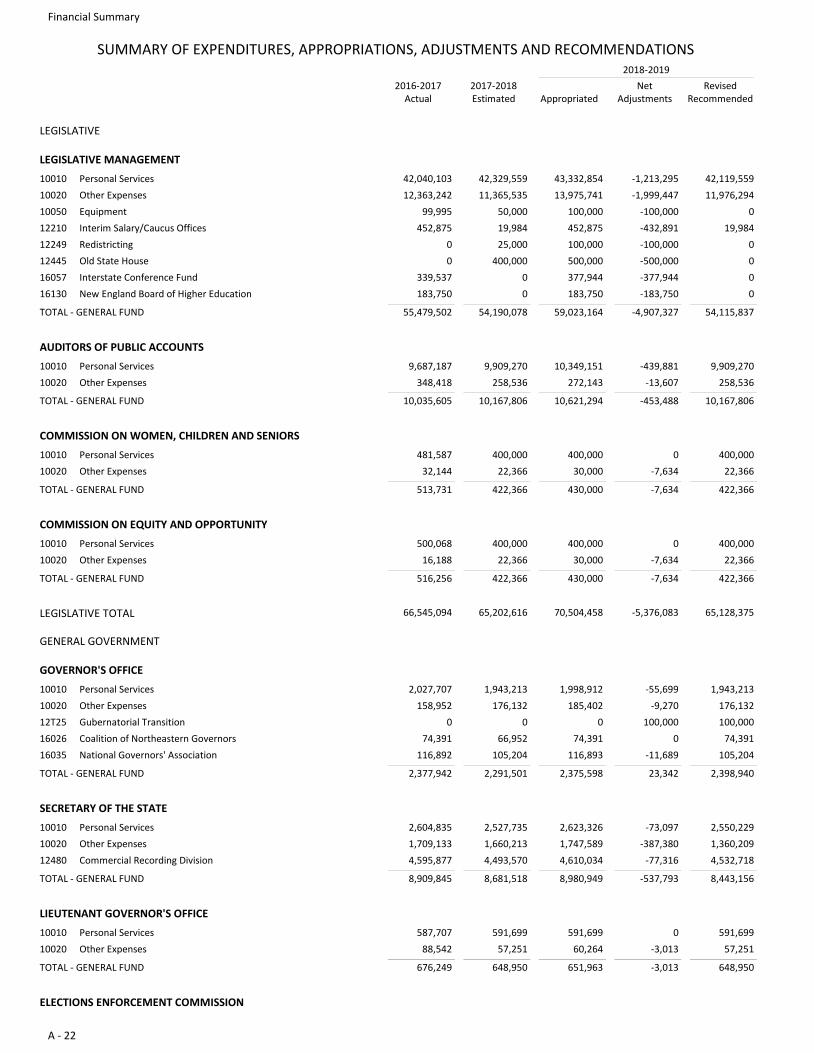
SUMMARY OF EXPENDITURES, APPROPRIATIONS, ADJUSTMENTS AND RECOMMENDATIONS
2016-2017Actual
2017-2018Estimated
RevisedRecommendedAppropriated
NetAdjustments
2018-2019
LEGISLATIVE
LEGISLATIVE MANAGEMENT
10010 Personal Services 42,040,103 43,332,85442,329,559 42,119,559-1,213,295
10020 Other Expenses 12,363,242 13,975,74111,365,535 11,976,294-1,999,447
10050 Equipment 99,995 100,00050,000 0-100,000
12210 Interim Salary/Caucus Offices 452,875 452,87519,984 19,984-432,891
12249 Redistricting 0 100,00025,000 0-100,000
12445 Old State House 0 500,000400,000 0-500,000
16057 Interstate Conference Fund 339,537 377,9440 0-377,944
16130 New England Board of Higher Education 183,750 183,7500 0-183,750
TOTAL - GENERAL FUND 55,479,502 54,190,078 -4,907,32759,023,164 54,115,837
AUDITORS OF PUBLIC ACCOUNTS
10010 Personal Services 9,687,187 10,349,1519,909,270 9,909,270-439,881
10020 Other Expenses 348,418 272,143258,536 258,536-13,607
TOTAL - GENERAL FUND 10,035,605 10,167,806 -453,48810,621,294 10,167,806
COMMISSION ON WOMEN, CHILDREN AND SENIORS
10010 Personal Services 481,587 400,000400,000 400,0000
10020 Other Expenses 32,144 30,00022,366 22,366-7,634
TOTAL - GENERAL FUND 513,731 422,366 -7,634430,000 422,366
COMMISSION ON EQUITY AND OPPORTUNITY
10010 Personal Services 500,068 400,000400,000 400,0000
10020 Other Expenses 16,188 30,00022,366 22,366-7,634
TOTAL - GENERAL FUND 516,256 422,366 -7,634430,000 422,366
LEGISLATIVE TOTAL 66,545,094 65,202,616 -5,376,08370,504,458 65,128,375
GENERAL GOVERNMENT
GOVERNOR'S OFFICE
10010 Personal Services 2,027,707 1,998,9121,943,213 1,943,213-55,699
10020 Other Expenses 158,952 185,402176,132 176,132-9,270
12T25 Gubernatorial Transition 0 00 100,000100,000
16026 Coalition of Northeastern Governors 74,391 74,39166,952 74,3910
16035 National Governors' Association 116,892 116,893105,204 105,204-11,689
TOTAL - GENERAL FUND 2,377,942 2,291,501 23,3422,375,598 2,398,940
SECRETARY OF THE STATE
10010 Personal Services 2,604,835 2,623,3262,527,735 2,550,229-73,097
10020 Other Expenses 1,709,133 1,747,5891,660,213 1,360,209-387,380
12480 Commercial Recording Division 4,595,877 4,610,0344,493,570 4,532,718-77,316
TOTAL - GENERAL FUND 8,909,845 8,681,518 -537,7938,980,949 8,443,156
LIEUTENANT GOVERNOR'S OFFICE
10010 Personal Services 587,707 591,699591,699 591,6990
10020 Other Expenses 88,542 60,26457,251 57,251-3,013
TOTAL - GENERAL FUND 676,249 648,950 -3,013651,963 648,950
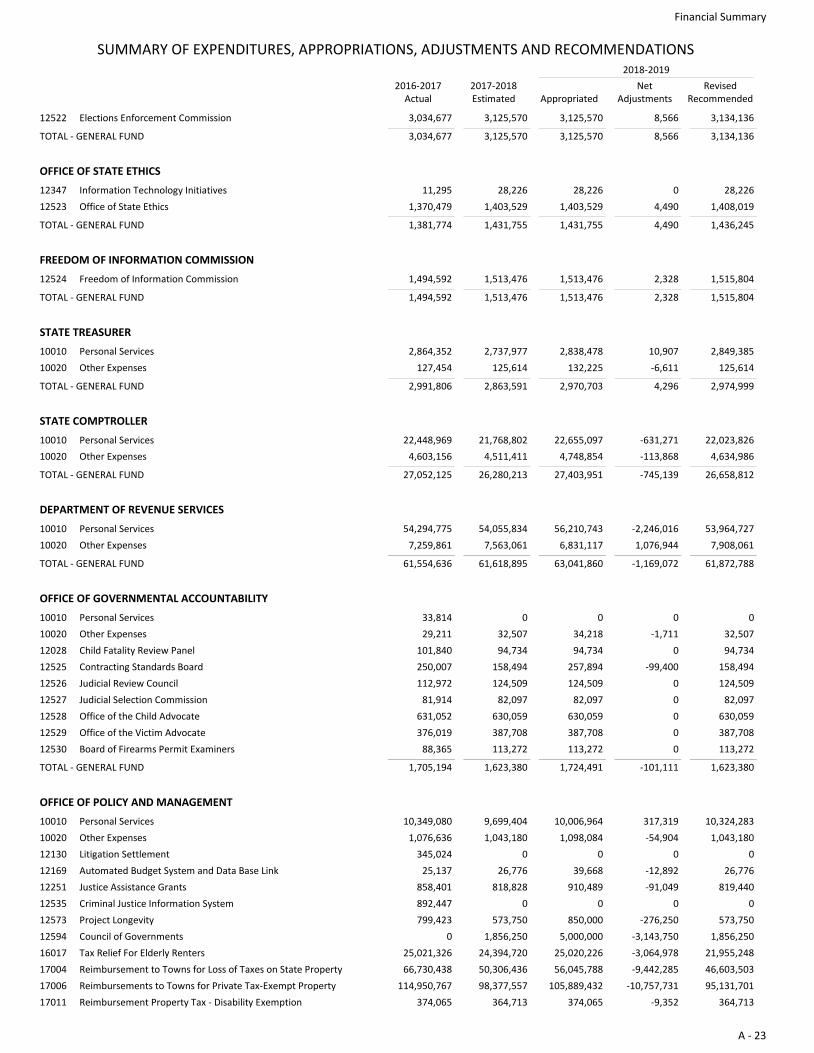
ELECTIONS ENFORCEMENT COMMISSION
Financial Summary
A - 22
SUMMARY OF EXPENDITURES, APPROPRIATIONS, ADJUSTMENTS AND RECOMMENDATIONS
2016-2017Actual
2017-2018Estimated
RevisedRecommendedAppropriated
NetAdjustments
2018-2019
12522 Elections Enforcement Commission 3,034,677 3,125,5703,125,570 3,134,1368,566
TOTAL - GENERAL FUND 3,034,677 3,125,570 8,5663,125,570 3,134,136
OFFICE OF STATE ETHICS
12347 Information Technology Initiatives 11,295 28,22628,226 28,2260
12523 Office of State Ethics 1,370,479 1,403,5291,403,529 1,408,0194,490
TOTAL - GENERAL FUND 1,381,774 1,431,755 4,4901,431,755 1,436,245
FREEDOM OF INFORMATION COMMISSION
12524 Freedom of Information Commission 1,494,592 1,513,4761,513,476 1,515,8042,328
TOTAL - GENERAL FUND 1,494,592 1,513,476 2,3281,513,476 1,515,804
STATE TREASURER
10010 Personal Services 2,864,352 2,838,4782,737,977 2,849,38510,907
10020 Other Expenses 127,454 132,225125,614 125,614-6,611
TOTAL - GENERAL FUND 2,991,806 2,863,591 4,2962,970,703 2,974,999
STATE COMPTROLLER
10010 Personal Services 22,448,969 22,655,09721,768,802 22,023,826-631,271
10020 Other Expenses 4,603,156 4,748,8544,511,411 4,634,986-113,868
TOTAL - GENERAL FUND 27,052,125 26,280,213 -745,13927,403,951 26,658,812
DEPARTMENT OF REVENUE SERVICES
10010 Personal Services 54,294,775 56,210,74354,055,834 53,964,727-2,246,016
10020 Other Expenses 7,259,861 6,831,1177,563,061 7,908,0611,076,944
TOTAL - GENERAL FUND 61,554,636 61,618,895 -1,169,07263,041,860 61,872,788
OFFICE OF GOVERNMENTAL ACCOUNTABILITY
10010 Personal Services 33,814 00 00
10020 Other Expenses 29,211 34,21832,507 32,507-1,711
12028 Child Fatality Review Panel 101,840 94,73494,734 94,7340
12525 Contracting Standards Board 250,007 257,894158,494 158,494-99,400
12526 Judicial Review Council 112,972 124,509124,509 124,5090
12527 Judicial Selection Commission 81,914 82,09782,097 82,0970
12528 Office of the Child Advocate 631,052 630,059630,059 630,0590
12529 Office of the Victim Advocate 376,019 387,708387,708 387,7080
12530 Board of Firearms Permit Examiners 88,365 113,272113,272 113,2720
TOTAL - GENERAL FUND 1,705,194 1,623,380 -101,1111,724,491 1,623,380
OFFICE OF POLICY AND MANAGEMENT
10010 Personal Services 10,349,080 10,006,9649,699,404 10,324,283317,319
10020 Other Expenses 1,076,636 1,098,0841,043,180 1,043,180-54,904
12130 Litigation Settlement 345,024 00 00
12169 Automated Budget System and Data Base Link 25,137 39,66826,776 26,776-12,892
12251 Justice Assistance Grants 858,401 910,489818,828 819,440-91,049
12535 Criminal Justice Information System 892,447 00 00
12573 Project Longevity 799,423 850,000573,750 573,750-276,250
12594 Council of Governments 0 5,000,0001,856,250 1,856,250-3,143,750
16017 Tax Relief For Elderly Renters 25,021,326 25,020,22624,394,720 21,955,248-3,064,978
17004 Reimbursement to Towns for Loss of Taxes on State Property 66,730,438 56,045,78850,306,436 46,603,503-9,442,285
17006 Reimbursements to Towns for Private Tax-Exempt Property 114,950,767 105,889,43298,377,557 95,131,701-10,757,731
17011 Reimbursement Property Tax - Disability Exemption 374,065 374,065364,713 364,713-9,352
Financial Summary
A - 23
SUMMARY OF EXPENDITURES, APPROPRIATIONS, ADJUSTMENTS AND RECOMMENDATIONS
2016-2017Actual
2017-2018Estimated
RevisedRecommendedAppropriated
NetAdjustments
2018-2019
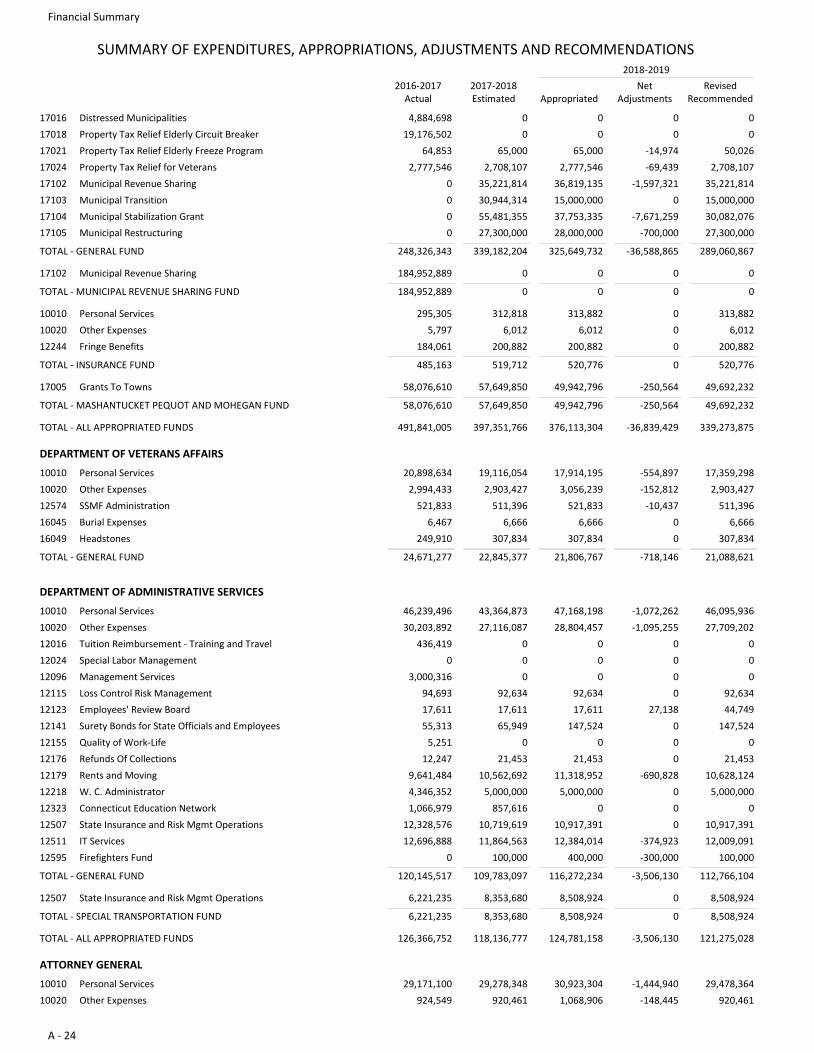
17016 Distressed Municipalities 4,884,698 00 00
17018 Property Tax Relief Elderly Circuit Breaker 19,176,502 00 00
17021 Property Tax Relief Elderly Freeze Program 64,853 65,00065,000 50,026-14,974
17024 Property Tax Relief for Veterans 2,777,546 2,777,5462,708,107 2,708,107-69,439
17102 Municipal Revenue Sharing 0 36,819,13535,221,814 35,221,814-1,597,321
17103 Municipal Transition 0 15,000,00030,944,314 15,000,0000
17104 Municipal Stabilization Grant 0 37,753,33555,481,355 30,082,076-7,671,259
17105 Municipal Restructuring 0 28,000,00027,300,000 27,300,000-700,000
TOTAL - GENERAL FUND 248,326,343 339,182,204 -36,588,865325,649,732 289,060,867
17102 Municipal Revenue Sharing 184,952,889 00 00
TOTAL - MUNICIPAL REVENUE SHARING FUND 184,952,889 0 00 0
10010 Personal Services 295,305 313,882312,818 313,8820
10020 Other Expenses 5,797 6,0126,012 6,0120
12244 Fringe Benefits 184,061 200,882200,882 200,8820
TOTAL - INSURANCE FUND 485,163 519,712 0520,776 520,776
17005 Grants To Towns 58,076,610 49,942,79657,649,850 49,692,232-250,564
TOTAL - MASHANTUCKET PEQUOT AND MOHEGAN FUND 58,076,610 57,649,850 -250,56449,942,796 49,692,232
491,841,005 397,351,766 -36,839,429376,113,304 339,273,875TOTAL - ALL APPROPRIATED FUNDS
DEPARTMENT OF VETERANS AFFAIRS
10010 Personal Services 20,898,634 17,914,19519,116,054 17,359,298-554,897
10020 Other Expenses 2,994,433 3,056,2392,903,427 2,903,427-152,812
12574 SSMF Administration 521,833 521,833511,396 511,396-10,437
16045 Burial Expenses 6,467 6,6666,666 6,6660
16049 Headstones 249,910 307,834307,834 307,8340
TOTAL - GENERAL FUND 24,671,277 22,845,377 -718,14621,806,767 21,088,621
DEPARTMENT OF ADMINISTRATIVE SERVICES
10010 Personal Services 46,239,496 47,168,19843,364,873 46,095,936-1,072,262
10020 Other Expenses 30,203,892 28,804,45727,116,087 27,709,202-1,095,255
12016 Tuition Reimbursement - Training and Travel 436,419 00 00
12024 Special Labor Management 0 00 00
12096 Management Services 3,000,316 00 00
12115 Loss Control Risk Management 94,693 92,63492,634 92,6340
12123 Employees' Review Board 17,611 17,61117,611 44,74927,138
12141 Surety Bonds for State Officials and Employees 55,313 147,52465,949 147,5240
12155 Quality of Work-Life 5,251 00 00
12176 Refunds Of Collections 12,247 21,45321,453 21,4530
12179 Rents and Moving 9,641,484 11,318,95210,562,692 10,628,124-690,828
12218 W. C. Administrator 4,346,352 5,000,0005,000,000 5,000,0000
12323 Connecticut Education Network 1,066,979 0857,616 00
12507 State Insurance and Risk Mgmt Operations 12,328,576 10,917,39110,719,619 10,917,3910
12511 IT Services 12,696,888 12,384,01411,864,563 12,009,091-374,923
12595 Firefighters Fund 0 400,000100,000 100,000-300,000
TOTAL - GENERAL FUND 120,145,517 109,783,097 -3,506,130116,272,234 112,766,104
12507 State Insurance and Risk Mgmt Operations 6,221,235 8,508,9248,353,680 8,508,9240
TOTAL - SPECIAL TRANSPORTATION FUND 6,221,235 8,353,680 08,508,924 8,508,924
126,366,752 118,136,777 -3,506,130124,781,158 121,275,028TOTAL - ALL APPROPRIATED FUNDS
ATTORNEY GENERAL
10010 Personal Services 29,171,100 30,923,30429,278,348 29,478,364-1,444,940
10020 Other Expenses 924,549 1,068,906920,461 920,461-148,445
Financial Summary
A - 24
SUMMARY OF EXPENDITURES, APPROPRIATIONS, ADJUSTMENTS AND RECOMMENDATIONS
2016-2017Actual
2017-2018Estimated
RevisedRecommendedAppropriated
NetAdjustments
2018-2019
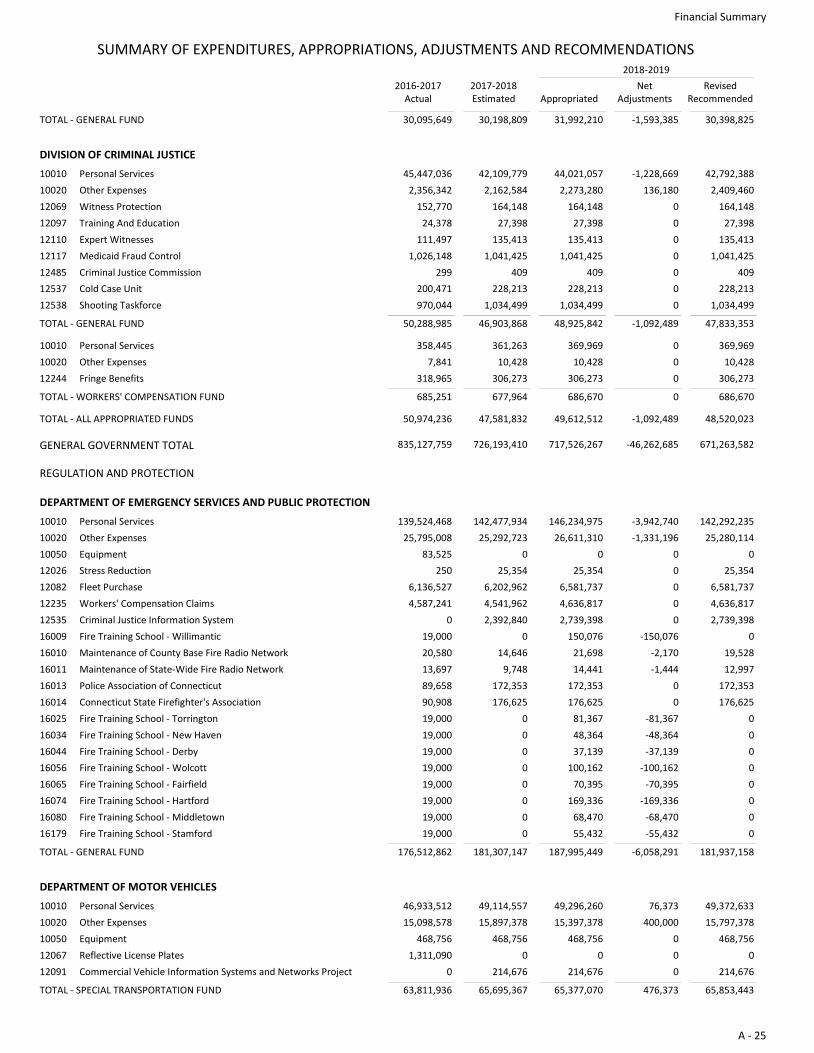
TOTAL - GENERAL FUND 30,095,649 30,198,809 -1,593,38531,992,210 30,398,825
DIVISION OF CRIMINAL JUSTICE
10010 Personal Services 45,447,036 44,021,05742,109,779 42,792,388-1,228,669
10020 Other Expenses 2,356,342 2,273,2802,162,584 2,409,460136,180
12069 Witness Protection 152,770 164,148164,148 164,1480
12097 Training And Education 24,378 27,39827,398 27,3980
12110 Expert Witnesses 111,497 135,413135,413 135,4130
12117 Medicaid Fraud Control 1,026,148 1,041,4251,041,425 1,041,4250
12485 Criminal Justice Commission 299 409409 4090
12537 Cold Case Unit 200,471 228,213228,213 228,2130
12538 Shooting Taskforce 970,044 1,034,4991,034,499 1,034,4990
TOTAL - GENERAL FUND 50,288,985 46,903,868 -1,092,48948,925,842 47,833,353
10010 Personal Services 358,445 369,969361,263 369,9690
10020 Other Expenses 7,841 10,42810,428 10,4280
12244 Fringe Benefits 318,965 306,273306,273 306,2730
TOTAL - WORKERS' COMPENSATION FUND 685,251 677,964 0686,670 686,670
50,974,236 47,581,832 -1,092,48949,612,512 48,520,023TOTAL - ALL APPROPRIATED FUNDS
GENERAL GOVERNMENT TOTAL 835,127,759 726,193,410 -46,262,685717,526,267 671,263,582
REGULATION AND PROTECTION
DEPARTMENT OF EMERGENCY SERVICES AND PUBLIC PROTECTION
10010 Personal Services 139,524,468 146,234,975142,477,934 142,292,235-3,942,740
10020 Other Expenses 25,795,008 26,611,31025,292,723 25,280,114-1,331,196
10050 Equipment 83,525 00 00
12026 Stress Reduction 250 25,35425,354 25,3540
12082 Fleet Purchase 6,136,527 6,581,7376,202,962 6,581,7370
12235 Workers' Compensation Claims 4,587,241 4,636,8174,541,962 4,636,8170
12535 Criminal Justice Information System 0 2,739,3982,392,840 2,739,3980
16009 Fire Training School - Willimantic 19,000 150,0760 0-150,076
16010 Maintenance of County Base Fire Radio Network 20,580 21,69814,646 19,528-2,170
16011 Maintenance of State-Wide Fire Radio Network 13,697 14,4419,748 12,997-1,444
16013 Police Association of Connecticut 89,658 172,353172,353 172,3530
16014 Connecticut State Firefighter's Association 90,908 176,625176,625 176,6250
16025 Fire Training School - Torrington 19,000 81,3670 0-81,367
16034 Fire Training School - New Haven 19,000 48,3640 0-48,364
16044 Fire Training School - Derby 19,000 37,1390 0-37,139
16056 Fire Training School - Wolcott 19,000 100,1620 0-100,162
16065 Fire Training School - Fairfield 19,000 70,3950 0-70,395
16074 Fire Training School - Hartford 19,000 169,3360 0-169,336
16080 Fire Training School - Middletown 19,000 68,4700 0-68,470
16179 Fire Training School - Stamford 19,000 55,4320 0-55,432
TOTAL - GENERAL FUND 176,512,862 181,307,147 -6,058,291187,995,449 181,937,158
DEPARTMENT OF MOTOR VEHICLES
10010 Personal Services 46,933,512 49,296,26049,114,557 49,372,63376,373
10020 Other Expenses 15,098,578 15,397,37815,897,378 15,797,378400,000
10050 Equipment 468,756 468,756468,756 468,7560
12067 Reflective License Plates 1,311,090 00 00
12091 Commercial Vehicle Information Systems and Networks Project 0 214,676214,676 214,6760
TOTAL - SPECIAL TRANSPORTATION FUND 63,811,936 65,695,367 476,37365,377,070 65,853,443
Financial Summary
A - 25
SUMMARY OF EXPENDITURES, APPROPRIATIONS, ADJUSTMENTS AND RECOMMENDATIONS
2016-2017Actual
2017-2018Estimated
RevisedRecommendedAppropriated
NetAdjustments
2018-2019
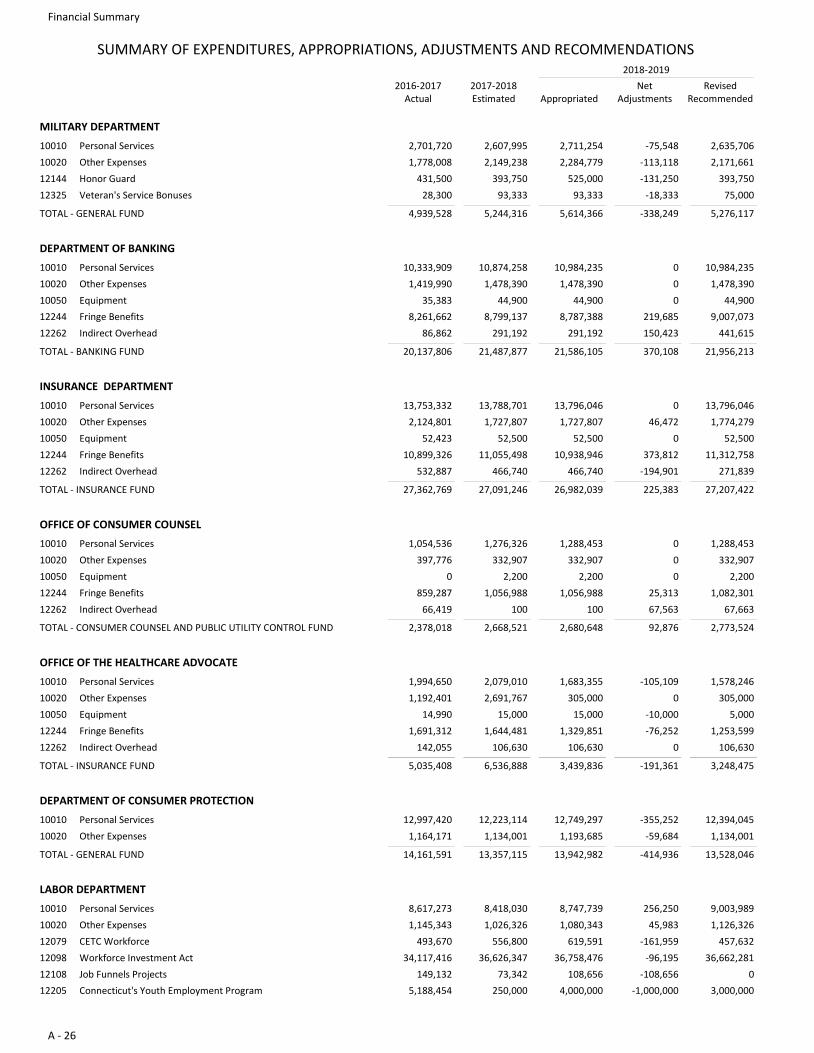
MILITARY DEPARTMENT
10010 Personal Services 2,701,720 2,711,2542,607,995 2,635,706-75,548
10020 Other Expenses 1,778,008 2,284,7792,149,238 2,171,661-113,118
12144 Honor Guard 431,500 525,000393,750 393,750-131,250
12325 Veteran's Service Bonuses 28,300 93,33393,333 75,000-18,333
TOTAL - GENERAL FUND 4,939,528 5,244,316 -338,2495,614,366 5,276,117
DEPARTMENT OF BANKING
10010 Personal Services 10,333,909 10,984,23510,874,258 10,984,2350
10020 Other Expenses 1,419,990 1,478,3901,478,390 1,478,3900
10050 Equipment 35,383 44,90044,900 44,9000
12244 Fringe Benefits 8,261,662 8,787,3888,799,137 9,007,073219,685
12262 Indirect Overhead 86,862 291,192291,192 441,615150,423
TOTAL - BANKING FUND 20,137,806 21,487,877 370,10821,586,105 21,956,213
INSURANCE DEPARTMENT
10010 Personal Services 13,753,332 13,796,04613,788,701 13,796,0460
10020 Other Expenses 2,124,801 1,727,8071,727,807 1,774,27946,472
10050 Equipment 52,423 52,50052,500 52,5000
12244 Fringe Benefits 10,899,326 10,938,94611,055,498 11,312,758373,812
12262 Indirect Overhead 532,887 466,740466,740 271,839-194,901
TOTAL - INSURANCE FUND 27,362,769 27,091,246 225,38326,982,039 27,207,422
OFFICE OF CONSUMER COUNSEL
10010 Personal Services 1,054,536 1,288,4531,276,326 1,288,4530
10020 Other Expenses 397,776 332,907332,907 332,9070
10050 Equipment 0 2,2002,200 2,2000
12244 Fringe Benefits 859,287 1,056,9881,056,988 1,082,30125,313
12262 Indirect Overhead 66,419 100100 67,66367,563
TOTAL - CONSUMER COUNSEL AND PUBLIC UTILITY CONTROL FUND 2,378,018 2,668,521 92,8762,680,648 2,773,524
OFFICE OF THE HEALTHCARE ADVOCATE
10010 Personal Services 1,994,650 1,683,3552,079,010 1,578,246-105,109
10020 Other Expenses 1,192,401 305,0002,691,767 305,0000
10050 Equipment 14,990 15,00015,000 5,000-10,000
12244 Fringe Benefits 1,691,312 1,329,8511,644,481 1,253,599-76,252
12262 Indirect Overhead 142,055 106,630106,630 106,6300
TOTAL - INSURANCE FUND 5,035,408 6,536,888 -191,3613,439,836 3,248,475
DEPARTMENT OF CONSUMER PROTECTION
10010 Personal Services 12,997,420 12,749,29712,223,114 12,394,045-355,252
10020 Other Expenses 1,164,171 1,193,6851,134,001 1,134,001-59,684
TOTAL - GENERAL FUND 14,161,591 13,357,115 -414,93613,942,982 13,528,046
LABOR DEPARTMENT
10010 Personal Services 8,617,273 8,747,7398,418,030 9,003,989256,250
10020 Other Expenses 1,145,343 1,080,3431,026,326 1,126,32645,983
12079 CETC Workforce 493,670 619,591556,800 457,632-161,959
12098 Workforce Investment Act 34,117,416 36,758,47636,626,347 36,662,281-96,195
12108 Job Funnels Projects 149,132 108,65673,342 0-108,656
12205 Connecticut's Youth Employment Program 5,188,454 4,000,000250,000 3,000,000-1,000,000
Financial Summary
A - 26
SUMMARY OF EXPENDITURES, APPROPRIATIONS, ADJUSTMENTS AND RECOMMENDATIONS
2016-2017Actual
2017-2018Estimated
RevisedRecommendedAppropriated
NetAdjustments
2018-2019
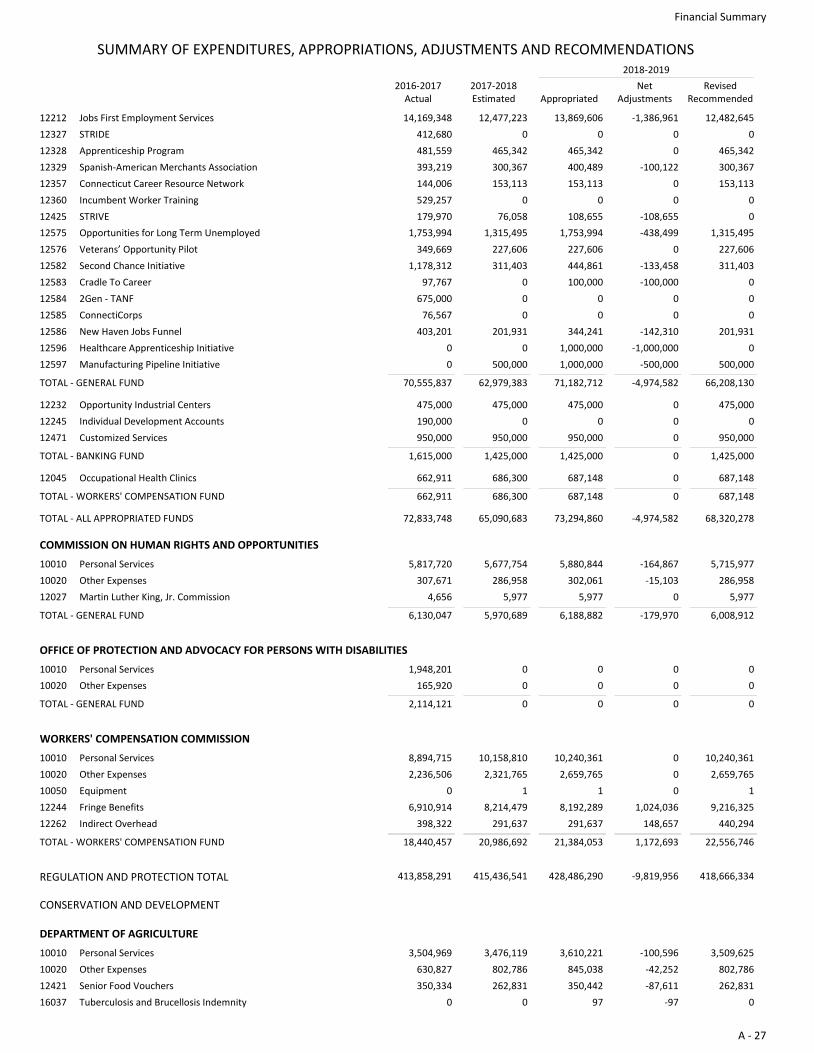
12212 Jobs First Employment Services 14,169,348 13,869,60612,477,223 12,482,645-1,386,961
12327 STRIDE 412,680 00 00
12328 Apprenticeship Program 481,559 465,342465,342 465,3420
12329 Spanish-American Merchants Association 393,219 400,489300,367 300,367-100,122
12357 Connecticut Career Resource Network 144,006 153,113153,113 153,1130
12360 Incumbent Worker Training 529,257 00 00
12425 STRIVE 179,970 108,65576,058 0-108,655
12575 Opportunities for Long Term Unemployed 1,753,994 1,753,9941,315,495 1,315,495-438,499
12576 Veterans’ Opportunity Pilot 349,669 227,606227,606 227,6060
12582 Second Chance Initiative 1,178,312 444,861311,403 311,403-133,458
12583 Cradle To Career 97,767 100,0000 0-100,000
12584 2Gen - TANF 675,000 00 00
12585 ConnectiCorps 76,567 00 00
12586 New Haven Jobs Funnel 403,201 344,241201,931 201,931-142,310
12596 Healthcare Apprenticeship Initiative 0 1,000,0000 0-1,000,000
12597 Manufacturing Pipeline Initiative 0 1,000,000500,000 500,000-500,000
TOTAL - GENERAL FUND 70,555,837 62,979,383 -4,974,58271,182,712 66,208,130
12232 Opportunity Industrial Centers 475,000 475,000475,000 475,0000
12245 Individual Development Accounts 190,000 00 00
12471 Customized Services 950,000 950,000950,000 950,0000
TOTAL - BANKING FUND 1,615,000 1,425,000 01,425,000 1,425,000
12045 Occupational Health Clinics 662,911 687,148686,300 687,1480
TOTAL - WORKERS' COMPENSATION FUND 662,911 686,300 0687,148 687,148
72,833,748 65,090,683 -4,974,58273,294,860 68,320,278TOTAL - ALL APPROPRIATED FUNDS
COMMISSION ON HUMAN RIGHTS AND OPPORTUNITIES
10010 Personal Services 5,817,720 5,880,8445,677,754 5,715,977-164,867
10020 Other Expenses 307,671 302,061286,958 286,958-15,103
12027 Martin Luther King, Jr. Commission 4,656 5,9775,977 5,9770
TOTAL - GENERAL FUND 6,130,047 5,970,689 -179,9706,188,882 6,008,912
OFFICE OF PROTECTION AND ADVOCACY FOR PERSONS WITH DISABILITIES
10010 Personal Services 1,948,201 00 00
10020 Other Expenses 165,920 00 00
TOTAL - GENERAL FUND 2,114,121 0 00 0
WORKERS' COMPENSATION COMMISSION
10010 Personal Services 8,894,715 10,240,36110,158,810 10,240,3610
10020 Other Expenses 2,236,506 2,659,7652,321,765 2,659,7650
10050 Equipment 0 11 10
12244 Fringe Benefits 6,910,914 8,192,2898,214,479 9,216,3251,024,036
12262 Indirect Overhead 398,322 291,637291,637 440,294148,657
TOTAL - WORKERS' COMPENSATION FUND 18,440,457 20,986,692 1,172,69321,384,053 22,556,746
REGULATION AND PROTECTION TOTAL 413,858,291 415,436,541 -9,819,956428,486,290 418,666,334
CONSERVATION AND DEVELOPMENT
DEPARTMENT OF AGRICULTURE
10010 Personal Services 3,504,969 3,610,2213,476,119 3,509,625-100,596
10020 Other Expenses 630,827 845,038802,786 802,786-42,252
12421 Senior Food Vouchers 350,334 350,442262,831 262,831-87,611
16037 Tuberculosis and Brucellosis Indemnity 0 970 0-97
Financial Summary
A - 27
SUMMARY OF EXPENDITURES, APPROPRIATIONS, ADJUSTMENTS AND RECOMMENDATIONS
2016-2017Actual
2017-2018Estimated
RevisedRecommendedAppropriated
NetAdjustments
2018-2019
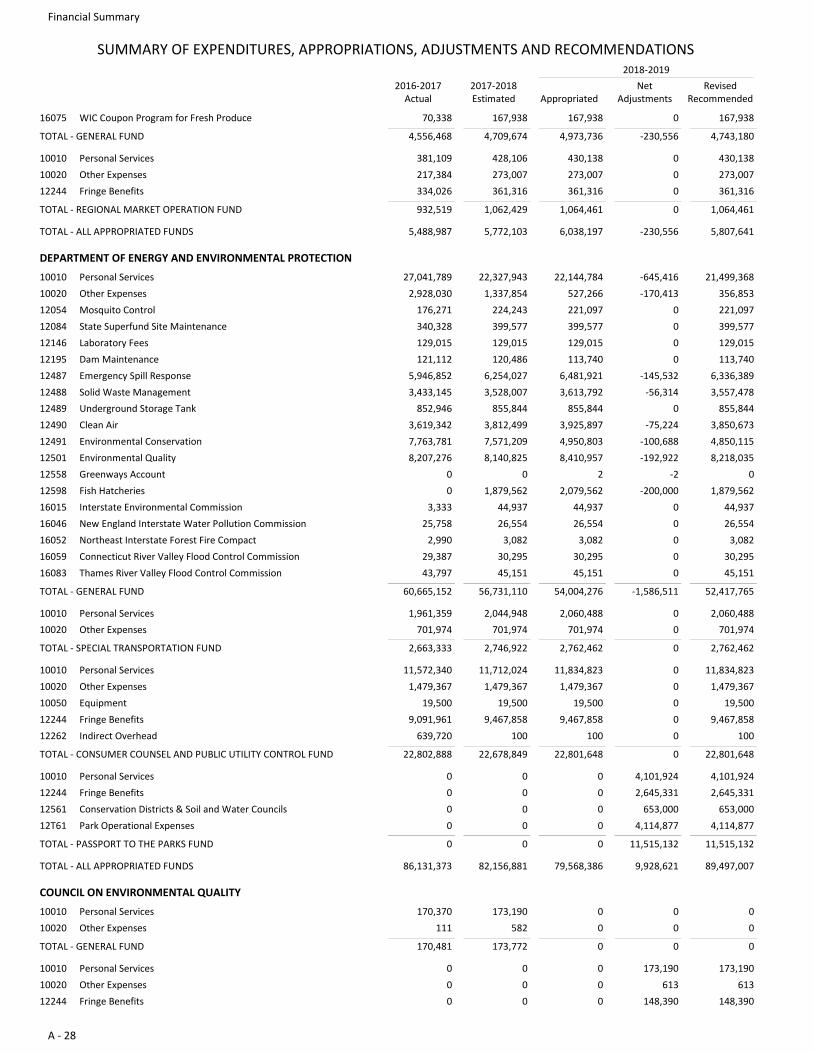
16075 WIC Coupon Program for Fresh Produce 70,338 167,938167,938 167,9380
TOTAL - GENERAL FUND 4,556,468 4,709,674 -230,5564,973,736 4,743,180
10010 Personal Services 381,109 430,138428,106 430,1380
10020 Other Expenses 217,384 273,007273,007 273,0070
12244 Fringe Benefits 334,026 361,316361,316 361,3160
TOTAL - REGIONAL MARKET OPERATION FUND 932,519 1,062,429 01,064,461 1,064,461
5,488,987 5,772,103 -230,5566,038,197 5,807,641TOTAL - ALL APPROPRIATED FUNDS
DEPARTMENT OF ENERGY AND ENVIRONMENTAL PROTECTION
10010 Personal Services 27,041,789 22,144,78422,327,943 21,499,368-645,416
10020 Other Expenses 2,928,030 527,2661,337,854 356,853-170,413
12054 Mosquito Control 176,271 221,097224,243 221,0970
12084 State Superfund Site Maintenance 340,328 399,577399,577 399,5770
12146 Laboratory Fees 129,015 129,015129,015 129,0150
12195 Dam Maintenance 121,112 113,740120,486 113,7400
12487 Emergency Spill Response 5,946,852 6,481,9216,254,027 6,336,389-145,532
12488 Solid Waste Management 3,433,145 3,613,7923,528,007 3,557,478-56,314
12489 Underground Storage Tank 852,946 855,844855,844 855,8440
12490 Clean Air 3,619,342 3,925,8973,812,499 3,850,673-75,224
12491 Environmental Conservation 7,763,781 4,950,8037,571,209 4,850,115-100,688
12501 Environmental Quality 8,207,276 8,410,9578,140,825 8,218,035-192,922
12558 Greenways Account 0 20 0-2
12598 Fish Hatcheries 0 2,079,5621,879,562 1,879,562-200,000
16015 Interstate Environmental Commission 3,333 44,93744,937 44,9370
16046 New England Interstate Water Pollution Commission 25,758 26,55426,554 26,5540
16052 Northeast Interstate Forest Fire Compact 2,990 3,0823,082 3,0820
16059 Connecticut River Valley Flood Control Commission 29,387 30,29530,295 30,2950
16083 Thames River Valley Flood Control Commission 43,797 45,15145,151 45,1510
TOTAL - GENERAL FUND 60,665,152 56,731,110 -1,586,51154,004,276 52,417,765
10010 Personal Services 1,961,359 2,060,4882,044,948 2,060,4880
10020 Other Expenses 701,974 701,974701,974 701,9740
TOTAL - SPECIAL TRANSPORTATION FUND 2,663,333 2,746,922 02,762,462 2,762,462
10010 Personal Services 11,572,340 11,834,82311,712,024 11,834,8230
10020 Other Expenses 1,479,367 1,479,3671,479,367 1,479,3670
10050 Equipment 19,500 19,50019,500 19,5000
12244 Fringe Benefits 9,091,961 9,467,8589,467,858 9,467,8580
12262 Indirect Overhead 639,720 100100 1000
TOTAL - CONSUMER COUNSEL AND PUBLIC UTILITY CONTROL FUND 22,802,888 22,678,849 022,801,648 22,801,648
10010 Personal Services 0 00 4,101,9244,101,924
12244 Fringe Benefits 0 00 2,645,3312,645,331
12561 Conservation Districts & Soil and Water Councils 0 00 653,000653,000
12T61 Park Operational Expenses 0 00 4,114,8774,114,877
TOTAL - PASSPORT TO THE PARKS FUND 0 0 11,515,1320 11,515,132
86,131,373 82,156,881 9,928,62179,568,386 89,497,007TOTAL - ALL APPROPRIATED FUNDS
COUNCIL ON ENVIRONMENTAL QUALITY
10010 Personal Services 170,370 0173,190 00
10020 Other Expenses 111 0582 00
TOTAL - GENERAL FUND 170,481 173,772 00 0
10010 Personal Services 0 00 173,190173,190
10020 Other Expenses 0 00 613613
12244 Fringe Benefits 0 00 148,390148,390
Financial Summary
A - 28
SUMMARY OF EXPENDITURES, APPROPRIATIONS, ADJUSTMENTS AND RECOMMENDATIONS
2016-2017Actual
2017-2018Estimated
RevisedRecommendedAppropriated
NetAdjustments
2018-2019
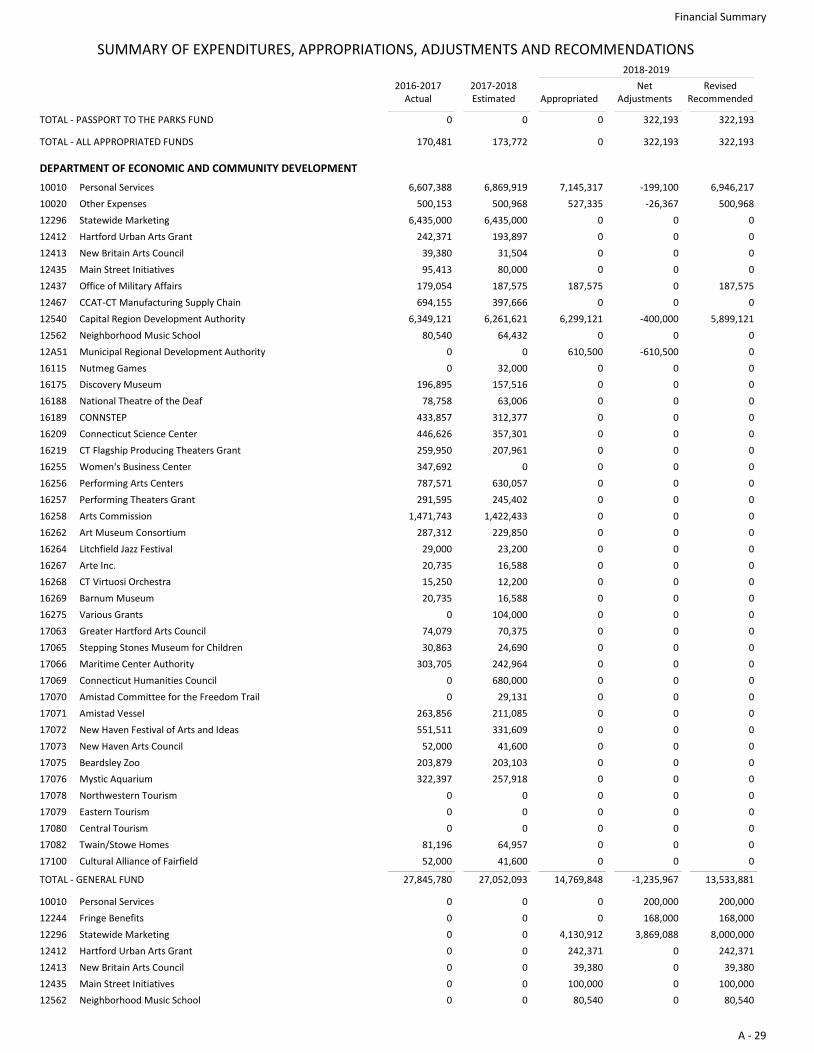
TOTAL - PASSPORT TO THE PARKS FUND 0 0 322,1930 322,193
170,481 173,772 322,1930 322,193TOTAL - ALL APPROPRIATED FUNDS
DEPARTMENT OF ECONOMIC AND COMMUNITY DEVELOPMENT
10010 Personal Services 6,607,388 7,145,3176,869,919 6,946,217-199,100
10020 Other Expenses 500,153 527,335500,968 500,968-26,367
12296 Statewide Marketing 6,435,000 06,435,000 00
12412 Hartford Urban Arts Grant 242,371 0193,897 00
12413 New Britain Arts Council 39,380 031,504 00
12435 Main Street Initiatives 95,413 080,000 00
12437 Office of Military Affairs 179,054 187,575187,575 187,5750
12467 CCAT-CT Manufacturing Supply Chain 694,155 0397,666 00
12540 Capital Region Development Authority 6,349,121 6,299,1216,261,621 5,899,121-400,000
12562 Neighborhood Music School 80,540 064,432 00
12A51 Municipal Regional Development Authority 0 610,5000 0-610,500
16115 Nutmeg Games 0 032,000 00
16175 Discovery Museum 196,895 0157,516 00
16188 National Theatre of the Deaf 78,758 063,006 00
16189 CONNSTEP 433,857 0312,377 00
16209 Connecticut Science Center 446,626 0357,301 00
16219 CT Flagship Producing Theaters Grant 259,950 0207,961 00
16255 Women's Business Center 347,692 00 00
16256 Performing Arts Centers 787,571 0630,057 00
16257 Performing Theaters Grant 291,595 0245,402 00
16258 Arts Commission 1,471,743 01,422,433 00
16262 Art Museum Consortium 287,312 0229,850 00
16264 Litchfield Jazz Festival 29,000 023,200 00
16267 Arte Inc. 20,735 016,588 00
16268 CT Virtuosi Orchestra 15,250 012,200 00
16269 Barnum Museum 20,735 016,588 00
16275 Various Grants 0 0104,000 00
17063 Greater Hartford Arts Council 74,079 070,375 00
17065 Stepping Stones Museum for Children 30,863 024,690 00
17066 Maritime Center Authority 303,705 0242,964 00
17069 Connecticut Humanities Council 0 0680,000 00
17070 Amistad Committee for the Freedom Trail 0 029,131 00
17071 Amistad Vessel 263,856 0211,085 00
17072 New Haven Festival of Arts and Ideas 551,511 0331,609 00
17073 New Haven Arts Council 52,000 041,600 00
17075 Beardsley Zoo 203,879 0203,103 00
17076 Mystic Aquarium 322,397 0257,918 00
17078 Northwestern Tourism 0 00 00
17079 Eastern Tourism 0 00 00
17080 Central Tourism 0 00 00
17082 Twain/Stowe Homes 81,196 064,957 00
17100 Cultural Alliance of Fairfield 52,000 041,600 00
TOTAL - GENERAL FUND 27,845,780 27,052,093 -1,235,96714,769,848 13,533,881
10010 Personal Services 0 00 200,000200,000
12244 Fringe Benefits 0 00 168,000168,000
12296 Statewide Marketing 0 4,130,9120 8,000,0003,869,088
12412 Hartford Urban Arts Grant 0 242,3710 242,3710
12413 New Britain Arts Council 0 39,3800 39,3800
12435 Main Street Initiatives 0 100,0000 100,0000
12562 Neighborhood Music School 0 80,5400 80,5400
Financial Summary
A - 29
SUMMARY OF EXPENDITURES, APPROPRIATIONS, ADJUSTMENTS AND RECOMMENDATIONS
2016-2017Actual
2017-2018Estimated
RevisedRecommendedAppropriated
NetAdjustments
2018-2019
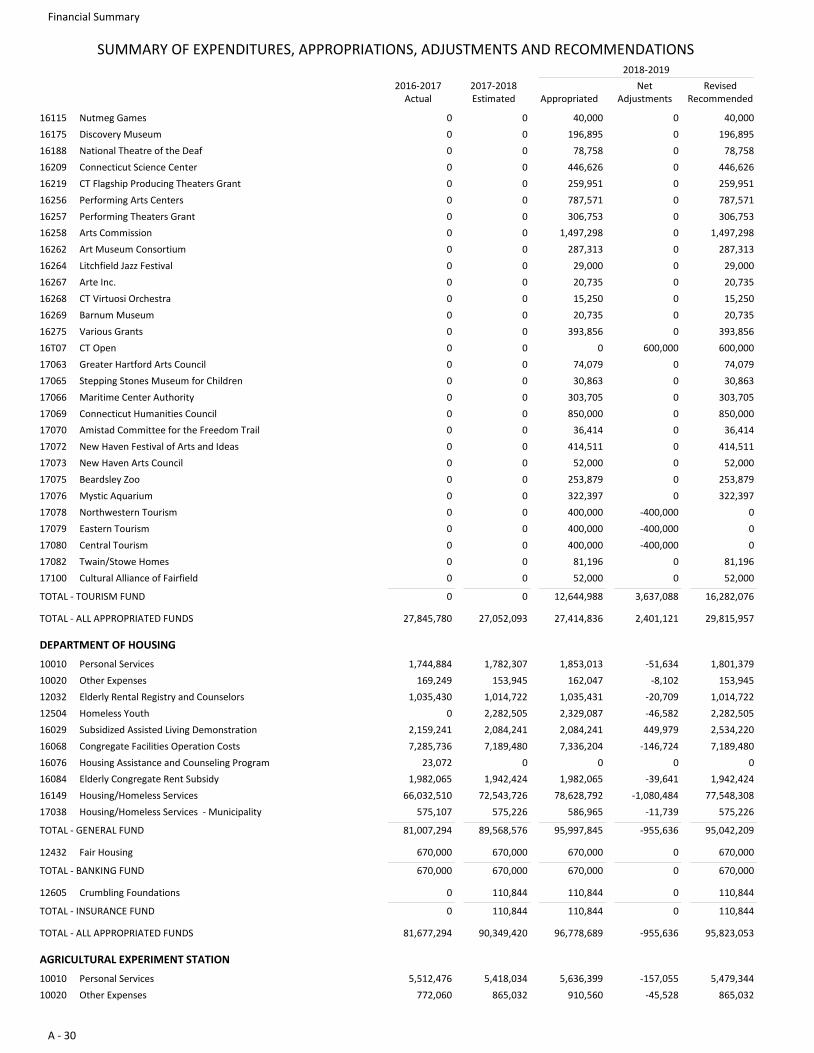
16115 Nutmeg Games 0 40,0000 40,0000
16175 Discovery Museum 0 196,8950 196,8950
16188 National Theatre of the Deaf 0 78,7580 78,7580
16209 Connecticut Science Center 0 446,6260 446,6260
16219 CT Flagship Producing Theaters Grant 0 259,9510 259,9510
16256 Performing Arts Centers 0 787,5710 787,5710
16257 Performing Theaters Grant 0 306,7530 306,7530
16258 Arts Commission 0 1,497,2980 1,497,2980
16262 Art Museum Consortium 0 287,3130 287,3130
16264 Litchfield Jazz Festival 0 29,0000 29,0000
16267 Arte Inc. 0 20,7350 20,7350
16268 CT Virtuosi Orchestra 0 15,2500 15,2500
16269 Barnum Museum 0 20,7350 20,7350
16275 Various Grants 0 393,8560 393,8560
16T07 CT Open 0 00 600,000600,000
17063 Greater Hartford Arts Council 0 74,0790 74,0790
17065 Stepping Stones Museum for Children 0 30,8630 30,8630
17066 Maritime Center Authority 0 303,7050 303,7050
17069 Connecticut Humanities Council 0 850,0000 850,0000
17070 Amistad Committee for the Freedom Trail 0 36,4140 36,4140
17072 New Haven Festival of Arts and Ideas 0 414,5110 414,5110
17073 New Haven Arts Council 0 52,0000 52,0000
17075 Beardsley Zoo 0 253,8790 253,8790
17076 Mystic Aquarium 0 322,3970 322,3970
17078 Northwestern Tourism 0 400,0000 0-400,000
17079 Eastern Tourism 0 400,0000 0-400,000
17080 Central Tourism 0 400,0000 0-400,000
17082 Twain/Stowe Homes 0 81,1960 81,1960
17100 Cultural Alliance of Fairfield 0 52,0000 52,0000
TOTAL - TOURISM FUND 0 0 3,637,08812,644,988 16,282,076
27,845,780 27,052,093 2,401,12127,414,836 29,815,957TOTAL - ALL APPROPRIATED FUNDS
DEPARTMENT OF HOUSING
10010 Personal Services 1,744,884 1,853,0131,782,307 1,801,379-51,634
10020 Other Expenses 169,249 162,047153,945 153,945-8,102
12032 Elderly Rental Registry and Counselors 1,035,430 1,035,4311,014,722 1,014,722-20,709
12504 Homeless Youth 0 2,329,0872,282,505 2,282,505-46,582
16029 Subsidized Assisted Living Demonstration 2,159,241 2,084,2412,084,241 2,534,220449,979
16068 Congregate Facilities Operation Costs 7,285,736 7,336,2047,189,480 7,189,480-146,724
16076 Housing Assistance and Counseling Program 23,072 00 00
16084 Elderly Congregate Rent Subsidy 1,982,065 1,982,0651,942,424 1,942,424-39,641
16149 Housing/Homeless Services 66,032,510 78,628,79272,543,726 77,548,308-1,080,484
17038 Housing/Homeless Services - Municipality 575,107 586,965575,226 575,226-11,739
TOTAL - GENERAL FUND 81,007,294 89,568,576 -955,63695,997,845 95,042,209
12432 Fair Housing 670,000 670,000670,000 670,0000
TOTAL - BANKING FUND 670,000 670,000 0670,000 670,000
12605 Crumbling Foundations 0 110,844110,844 110,8440
TOTAL - INSURANCE FUND 0 110,844 0110,844 110,844
81,677,294 90,349,420 -955,63696,778,689 95,823,053TOTAL - ALL APPROPRIATED FUNDS
AGRICULTURAL EXPERIMENT STATION
10010 Personal Services 5,512,476 5,636,3995,418,034 5,479,344-157,055
10020 Other Expenses 772,060 910,560865,032 865,032-45,528
Financial Summary
A - 30
SUMMARY OF EXPENDITURES, APPROPRIATIONS, ADJUSTMENTS AND RECOMMENDATIONS
2016-2017Actual
2017-2018Estimated
RevisedRecommendedAppropriated
NetAdjustments
2018-2019
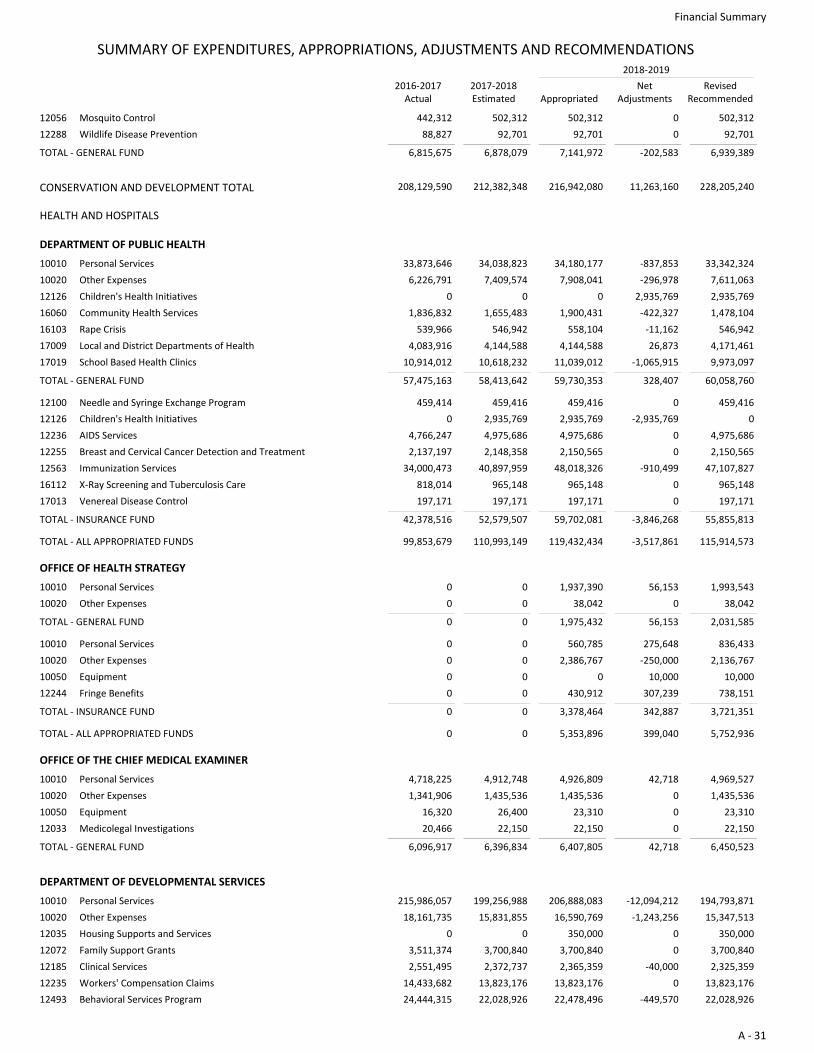
12056 Mosquito Control 442,312 502,312502,312 502,3120
12288 Wildlife Disease Prevention 88,827 92,70192,701 92,7010
TOTAL - GENERAL FUND 6,815,675 6,878,079 -202,5837,141,972 6,939,389
CONSERVATION AND DEVELOPMENT TOTAL 208,129,590 212,382,348 11,263,160216,942,080 228,205,240
HEALTH AND HOSPITALS
DEPARTMENT OF PUBLIC HEALTH
10010 Personal Services 33,873,646 34,180,17734,038,823 33,342,324-837,853
10020 Other Expenses 6,226,791 7,908,0417,409,574 7,611,063-296,978
12126 Children's Health Initiatives 0 00 2,935,7692,935,769
16060 Community Health Services 1,836,832 1,900,4311,655,483 1,478,104-422,327
16103 Rape Crisis 539,966 558,104546,942 546,942-11,162
17009 Local and District Departments of Health 4,083,916 4,144,5884,144,588 4,171,46126,873
17019 School Based Health Clinics 10,914,012 11,039,01210,618,232 9,973,097-1,065,915
TOTAL - GENERAL FUND 57,475,163 58,413,642 328,40759,730,353 60,058,760
12100 Needle and Syringe Exchange Program 459,414 459,416459,416 459,4160
12126 Children's Health Initiatives 0 2,935,7692,935,769 0-2,935,769
12236 AIDS Services 4,766,247 4,975,6864,975,686 4,975,6860
12255 Breast and Cervical Cancer Detection and Treatment 2,137,197 2,150,5652,148,358 2,150,5650
12563 Immunization Services 34,000,473 48,018,32640,897,959 47,107,827-910,499
16112 X-Ray Screening and Tuberculosis Care 818,014 965,148965,148 965,1480
17013 Venereal Disease Control 197,171 197,171197,171 197,1710
TOTAL - INSURANCE FUND 42,378,516 52,579,507 -3,846,26859,702,081 55,855,813
99,853,679 110,993,149 -3,517,861119,432,434 115,914,573TOTAL - ALL APPROPRIATED FUNDS
OFFICE OF HEALTH STRATEGY
10010 Personal Services 0 1,937,3900 1,993,54356,153
10020 Other Expenses 0 38,0420 38,0420
TOTAL - GENERAL FUND 0 0 56,1531,975,432 2,031,585
10010 Personal Services 0 560,7850 836,433275,648
10020 Other Expenses 0 2,386,7670 2,136,767-250,000
10050 Equipment 0 00 10,00010,000
12244 Fringe Benefits 0 430,9120 738,151307,239
TOTAL - INSURANCE FUND 0 0 342,8873,378,464 3,721,351
0 0 399,0405,353,896 5,752,936TOTAL - ALL APPROPRIATED FUNDS
OFFICE OF THE CHIEF MEDICAL EXAMINER
10010 Personal Services 4,718,225 4,926,8094,912,748 4,969,52742,718
10020 Other Expenses 1,341,906 1,435,5361,435,536 1,435,5360
10050 Equipment 16,320 23,31026,400 23,3100
12033 Medicolegal Investigations 20,466 22,15022,150 22,1500
TOTAL - GENERAL FUND 6,096,917 6,396,834 42,7186,407,805 6,450,523
DEPARTMENT OF DEVELOPMENTAL SERVICES
10010 Personal Services 215,986,057 206,888,083199,256,988 194,793,871-12,094,212
10020 Other Expenses 18,161,735 16,590,76915,831,855 15,347,513-1,243,256
12035 Housing Supports and Services 0 350,0000 350,0000
12072 Family Support Grants 3,511,374 3,700,8403,700,840 3,700,8400
12185 Clinical Services 2,551,495 2,365,3592,372,737 2,325,359-40,000
12235 Workers' Compensation Claims 14,433,682 13,823,17613,823,176 13,823,1760
12493 Behavioral Services Program 24,444,315 22,478,49622,028,926 22,028,926-449,570
Financial Summary
A - 31
SUMMARY OF EXPENDITURES, APPROPRIATIONS, ADJUSTMENTS AND RECOMMENDATIONS
2016-2017Actual
2017-2018Estimated
RevisedRecommendedAppropriated
NetAdjustments
2018-2019
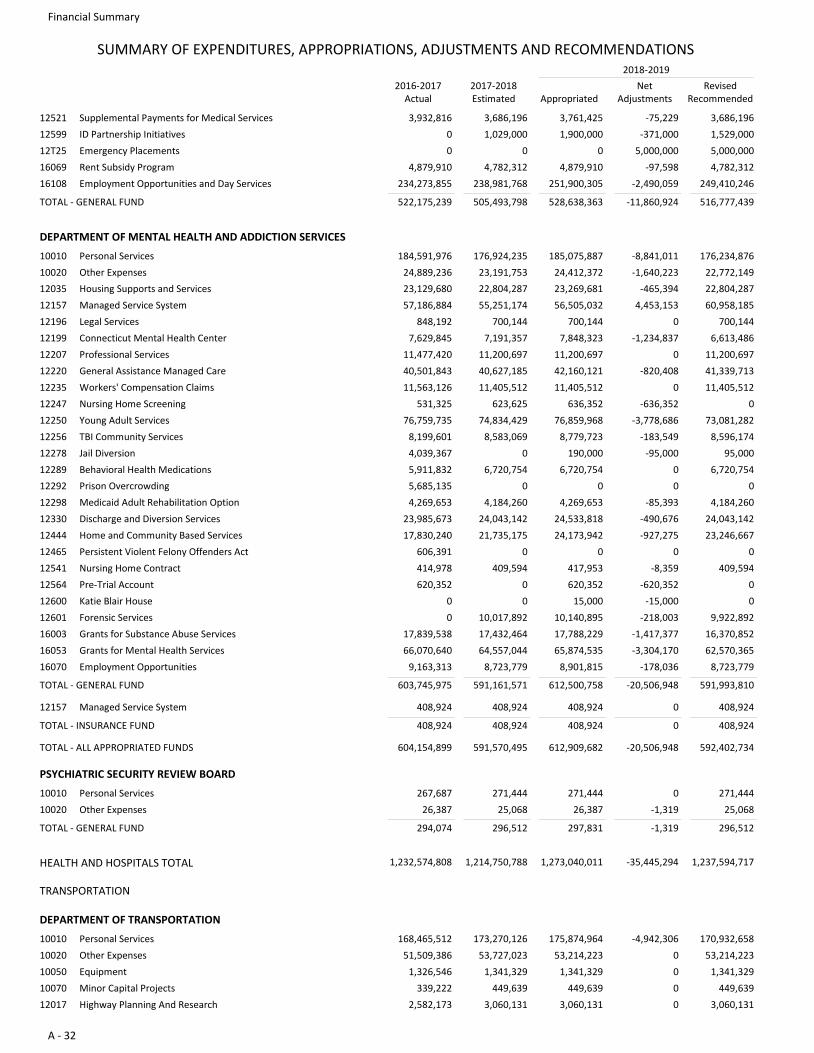
12521 Supplemental Payments for Medical Services 3,932,816 3,761,4253,686,196 3,686,196-75,229
12599 ID Partnership Initiatives 0 1,900,0001,029,000 1,529,000-371,000
12T25 Emergency Placements 0 00 5,000,0005,000,000
16069 Rent Subsidy Program 4,879,910 4,879,9104,782,312 4,782,312-97,598
16108 Employment Opportunities and Day Services 234,273,855 251,900,305238,981,768 249,410,246-2,490,059
TOTAL - GENERAL FUND 522,175,239 505,493,798 -11,860,924528,638,363 516,777,439
DEPARTMENT OF MENTAL HEALTH AND ADDICTION SERVICES
10010 Personal Services 184,591,976 185,075,887176,924,235 176,234,876-8,841,011
10020 Other Expenses 24,889,236 24,412,37223,191,753 22,772,149-1,640,223
12035 Housing Supports and Services 23,129,680 23,269,68122,804,287 22,804,287-465,394
12157 Managed Service System 57,186,884 56,505,03255,251,174 60,958,1854,453,153
12196 Legal Services 848,192 700,144700,144 700,1440
12199 Connecticut Mental Health Center 7,629,845 7,848,3237,191,357 6,613,486-1,234,837
12207 Professional Services 11,477,420 11,200,69711,200,697 11,200,6970
12220 General Assistance Managed Care 40,501,843 42,160,12140,627,185 41,339,713-820,408
12235 Workers' Compensation Claims 11,563,126 11,405,51211,405,512 11,405,5120
12247 Nursing Home Screening 531,325 636,352623,625 0-636,352
12250 Young Adult Services 76,759,735 76,859,96874,834,429 73,081,282-3,778,686
12256 TBI Community Services 8,199,601 8,779,7238,583,069 8,596,174-183,549
12278 Jail Diversion 4,039,367 190,0000 95,000-95,000
12289 Behavioral Health Medications 5,911,832 6,720,7546,720,754 6,720,7540
12292 Prison Overcrowding 5,685,135 00 00
12298 Medicaid Adult Rehabilitation Option 4,269,653 4,269,6534,184,260 4,184,260-85,393
12330 Discharge and Diversion Services 23,985,673 24,533,81824,043,142 24,043,142-490,676
12444 Home and Community Based Services 17,830,240 24,173,94221,735,175 23,246,667-927,275
12465 Persistent Violent Felony Offenders Act 606,391 00 00
12541 Nursing Home Contract 414,978 417,953409,594 409,594-8,359
12564 Pre-Trial Account 620,352 620,3520 0-620,352
12600 Katie Blair House 0 15,0000 0-15,000
12601 Forensic Services 0 10,140,89510,017,892 9,922,892-218,003
16003 Grants for Substance Abuse Services 17,839,538 17,788,22917,432,464 16,370,852-1,417,377
16053 Grants for Mental Health Services 66,070,640 65,874,53564,557,044 62,570,365-3,304,170
16070 Employment Opportunities 9,163,313 8,901,8158,723,779 8,723,779-178,036
TOTAL - GENERAL FUND 603,745,975 591,161,571 -20,506,948612,500,758 591,993,810
12157 Managed Service System 408,924 408,924408,924 408,9240
TOTAL - INSURANCE FUND 408,924 408,924 0408,924 408,924
604,154,899 591,570,495 -20,506,948612,909,682 592,402,734TOTAL - ALL APPROPRIATED FUNDS
PSYCHIATRIC SECURITY REVIEW BOARD
10010 Personal Services 267,687 271,444271,444 271,4440
10020 Other Expenses 26,387 26,38725,068 25,068-1,319
TOTAL - GENERAL FUND 294,074 296,512 -1,319297,831 296,512
HEALTH AND HOSPITALS TOTAL 1,232,574,808 1,214,750,788 -35,445,2941,273,040,011 1,237,594,717
TRANSPORTATION
DEPARTMENT OF TRANSPORTATION
10010 Personal Services 168,465,512 175,874,964173,270,126 170,932,658-4,942,306
10020 Other Expenses 51,509,386 53,214,22353,727,023 53,214,2230
10050 Equipment 1,326,546 1,341,3291,341,329 1,341,3290
10070 Minor Capital Projects 339,222 449,639449,639 449,6390
12017 Highway Planning And Research 2,582,173 3,060,1313,060,131 3,060,1310
Financial Summary
A - 32
SUMMARY OF EXPENDITURES, APPROPRIATIONS, ADJUSTMENTS AND RECOMMENDATIONS
2016-2017Actual
2017-2018Estimated
RevisedRecommendedAppropriated
NetAdjustments
2018-2019
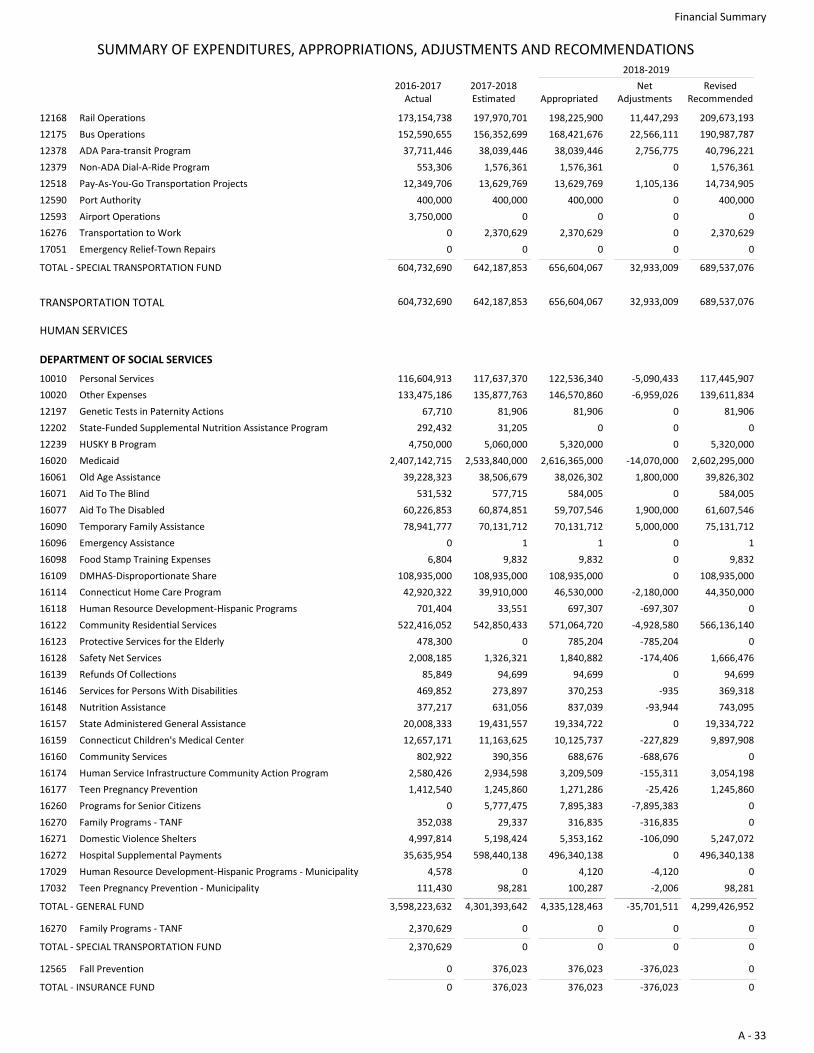
12168 Rail Operations 173,154,738 198,225,900197,970,701 209,673,19311,447,293
12175 Bus Operations 152,590,655 168,421,676156,352,699 190,987,78722,566,111
12378 ADA Para-transit Program 37,711,446 38,039,44638,039,446 40,796,2212,756,775
12379 Non-ADA Dial-A-Ride Program 553,306 1,576,3611,576,361 1,576,3610
12518 Pay-As-You-Go Transportation Projects 12,349,706 13,629,76913,629,769 14,734,9051,105,136
12590 Port Authority 400,000 400,000400,000 400,0000
12593 Airport Operations 3,750,000 00 00
16276 Transportation to Work 0 2,370,6292,370,629 2,370,6290
17051 Emergency Relief-Town Repairs 0 00 00
TOTAL - SPECIAL TRANSPORTATION FUND 604,732,690 642,187,853 32,933,009656,604,067 689,537,076
TRANSPORTATION TOTAL 604,732,690 642,187,853 32,933,009656,604,067 689,537,076
HUMAN SERVICES
DEPARTMENT OF SOCIAL SERVICES
10010 Personal Services 116,604,913 122,536,340117,637,370 117,445,907-5,090,433
10020 Other Expenses 133,475,186 146,570,860135,877,763 139,611,834-6,959,026
12197 Genetic Tests in Paternity Actions 67,710 81,90681,906 81,9060
12202 State-Funded Supplemental Nutrition Assistance Program 292,432 031,205 00
12239 HUSKY B Program 4,750,000 5,320,0005,060,000 5,320,0000
16020 Medicaid 2,407,142,715 2,616,365,0002,533,840,000 2,602,295,000-14,070,000
16061 Old Age Assistance 39,228,323 38,026,30238,506,679 39,826,3021,800,000
16071 Aid To The Blind 531,532 584,005577,715 584,0050
16077 Aid To The Disabled 60,226,853 59,707,54660,874,851 61,607,5461,900,000
16090 Temporary Family Assistance 78,941,777 70,131,71270,131,712 75,131,7125,000,000
16096 Emergency Assistance 0 11 10
16098 Food Stamp Training Expenses 6,804 9,8329,832 9,8320
16109 DMHAS-Disproportionate Share 108,935,000 108,935,000108,935,000 108,935,0000
16114 Connecticut Home Care Program 42,920,322 46,530,00039,910,000 44,350,000-2,180,000
16118 Human Resource Development-Hispanic Programs 701,404 697,30733,551 0-697,307
16122 Community Residential Services 522,416,052 571,064,720542,850,433 566,136,140-4,928,580
16123 Protective Services for the Elderly 478,300 785,2040 0-785,204
16128 Safety Net Services 2,008,185 1,840,8821,326,321 1,666,476-174,406
16139 Refunds Of Collections 85,849 94,69994,699 94,6990
16146 Services for Persons With Disabilities 469,852 370,253273,897 369,318-935
16148 Nutrition Assistance 377,217 837,039631,056 743,095-93,944
16157 State Administered General Assistance 20,008,333 19,334,72219,431,557 19,334,7220
16159 Connecticut Children's Medical Center 12,657,171 10,125,73711,163,625 9,897,908-227,829
16160 Community Services 802,922 688,676390,356 0-688,676
16174 Human Service Infrastructure Community Action Program 2,580,426 3,209,5092,934,598 3,054,198-155,311
16177 Teen Pregnancy Prevention 1,412,540 1,271,2861,245,860 1,245,860-25,426
16260 Programs for Senior Citizens 0 7,895,3835,777,475 0-7,895,383
16270 Family Programs - TANF 352,038 316,83529,337 0-316,835
16271 Domestic Violence Shelters 4,997,814 5,353,1625,198,424 5,247,072-106,090
16272 Hospital Supplemental Payments 35,635,954 496,340,138598,440,138 496,340,1380
17029 Human Resource Development-Hispanic Programs - Municipality 4,578 4,1200 0-4,120
17032 Teen Pregnancy Prevention - Municipality 111,430 100,28798,281 98,281-2,006
TOTAL - GENERAL FUND 3,598,223,632 4,301,393,642 -35,701,5114,335,128,463 4,299,426,952
16270 Family Programs - TANF 2,370,629 00 00
TOTAL - SPECIAL TRANSPORTATION FUND 2,370,629 0 00 0
12565 Fall Prevention 0 376,023376,023 0-376,023
TOTAL - INSURANCE FUND 0 376,023 -376,023376,023 0
Financial Summary
A - 33
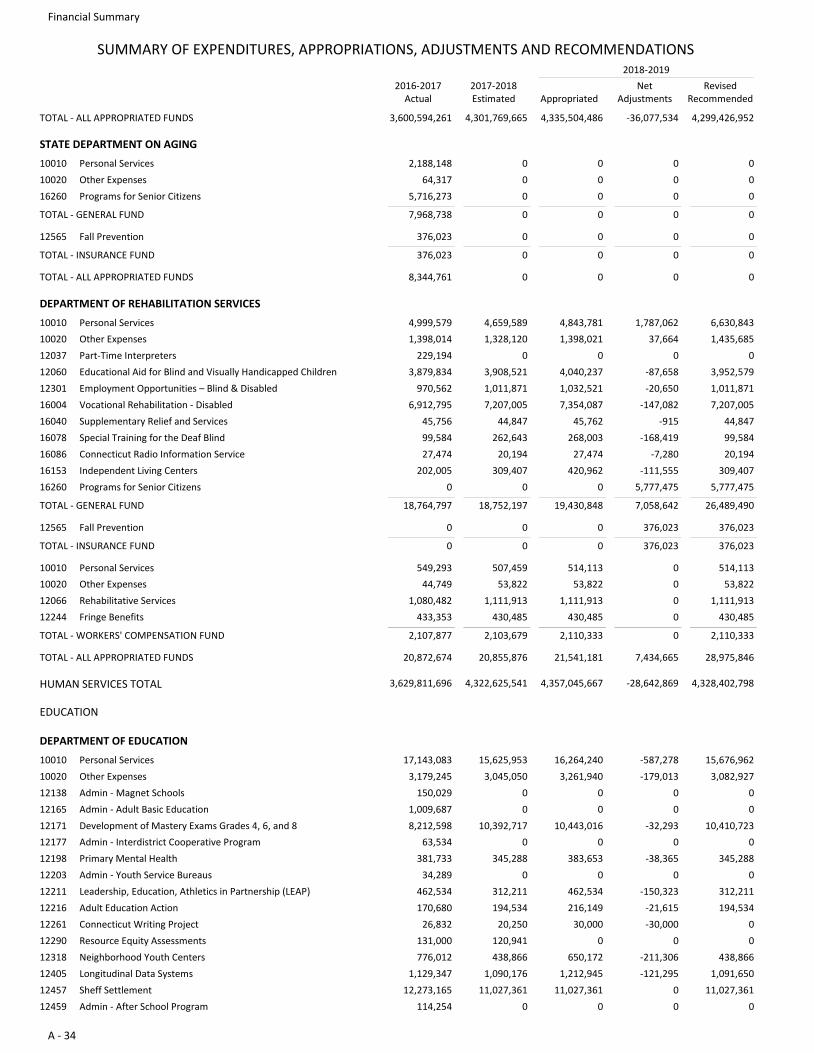
SUMMARY OF EXPENDITURES, APPROPRIATIONS, ADJUSTMENTS AND RECOMMENDATIONS
2016-2017Actual
2017-2018Estimated
RevisedRecommendedAppropriated
NetAdjustments
2018-2019
3,600,594,261 4,301,769,665 -36,077,5344,335,504,486 4,299,426,952TOTAL - ALL APPROPRIATED FUNDS
STATE DEPARTMENT ON AGING
10010 Personal Services 2,188,148 00 00
10020 Other Expenses 64,317 00 00
16260 Programs for Senior Citizens 5,716,273 00 00
TOTAL - GENERAL FUND 7,968,738 0 00 0
12565 Fall Prevention 376,023 00 00
TOTAL - INSURANCE FUND 376,023 0 00 0
8,344,761 0 00 0TOTAL - ALL APPROPRIATED FUNDS
DEPARTMENT OF REHABILITATION SERVICES
10010 Personal Services 4,999,579 4,843,7814,659,589 6,630,8431,787,062
10020 Other Expenses 1,398,014 1,398,0211,328,120 1,435,68537,664
12037 Part-Time Interpreters 229,194 00 00
12060 Educational Aid for Blind and Visually Handicapped Children 3,879,834 4,040,2373,908,521 3,952,579-87,658
12301 Employment Opportunities – Blind & Disabled 970,562 1,032,5211,011,871 1,011,871-20,650
16004 Vocational Rehabilitation - Disabled 6,912,795 7,354,0877,207,005 7,207,005-147,082
16040 Supplementary Relief and Services 45,756 45,76244,847 44,847-915
16078 Special Training for the Deaf Blind 99,584 268,003262,643 99,584-168,419
16086 Connecticut Radio Information Service 27,474 27,47420,194 20,194-7,280
16153 Independent Living Centers 202,005 420,962309,407 309,407-111,555
16260 Programs for Senior Citizens 0 00 5,777,4755,777,475
TOTAL - GENERAL FUND 18,764,797 18,752,197 7,058,64219,430,848 26,489,490
12565 Fall Prevention 0 00 376,023376,023
TOTAL - INSURANCE FUND 0 0 376,0230 376,023
10010 Personal Services 549,293 514,113507,459 514,1130
10020 Other Expenses 44,749 53,82253,822 53,8220
12066 Rehabilitative Services 1,080,482 1,111,9131,111,913 1,111,9130
12244 Fringe Benefits 433,353 430,485430,485 430,4850
TOTAL - WORKERS' COMPENSATION FUND 2,107,877 2,103,679 02,110,333 2,110,333
20,872,674 20,855,876 7,434,66521,541,181 28,975,846TOTAL - ALL APPROPRIATED FUNDS
HUMAN SERVICES TOTAL 3,629,811,696 4,322,625,541 -28,642,8694,357,045,667 4,328,402,798
EDUCATION
DEPARTMENT OF EDUCATION
10010 Personal Services 17,143,083 16,264,24015,625,953 15,676,962-587,278
10020 Other Expenses 3,179,245 3,261,9403,045,050 3,082,927-179,013
12138 Admin - Magnet Schools 150,029 00 00
12165 Admin - Adult Basic Education 1,009,687 00 00
12171 Development of Mastery Exams Grades 4, 6, and 8 8,212,598 10,443,01610,392,717 10,410,723-32,293
12177 Admin - Interdistrict Cooperative Program 63,534 00 00
12198 Primary Mental Health 381,733 383,653345,288 345,288-38,365
12203 Admin - Youth Service Bureaus 34,289 00 00
12211 Leadership, Education, Athletics in Partnership (LEAP) 462,534 462,534312,211 312,211-150,323
12216 Adult Education Action 170,680 216,149194,534 194,534-21,615
12261 Connecticut Writing Project 26,832 30,00020,250 0-30,000
12290 Resource Equity Assessments 131,000 0120,941 00
12318 Neighborhood Youth Centers 776,012 650,172438,866 438,866-211,306
12405 Longitudinal Data Systems 1,129,347 1,212,9451,090,176 1,091,650-121,295
12457 Sheff Settlement 12,273,165 11,027,36111,027,361 11,027,3610
12459 Admin - After School Program 114,254 00 00
Financial Summary
A - 34
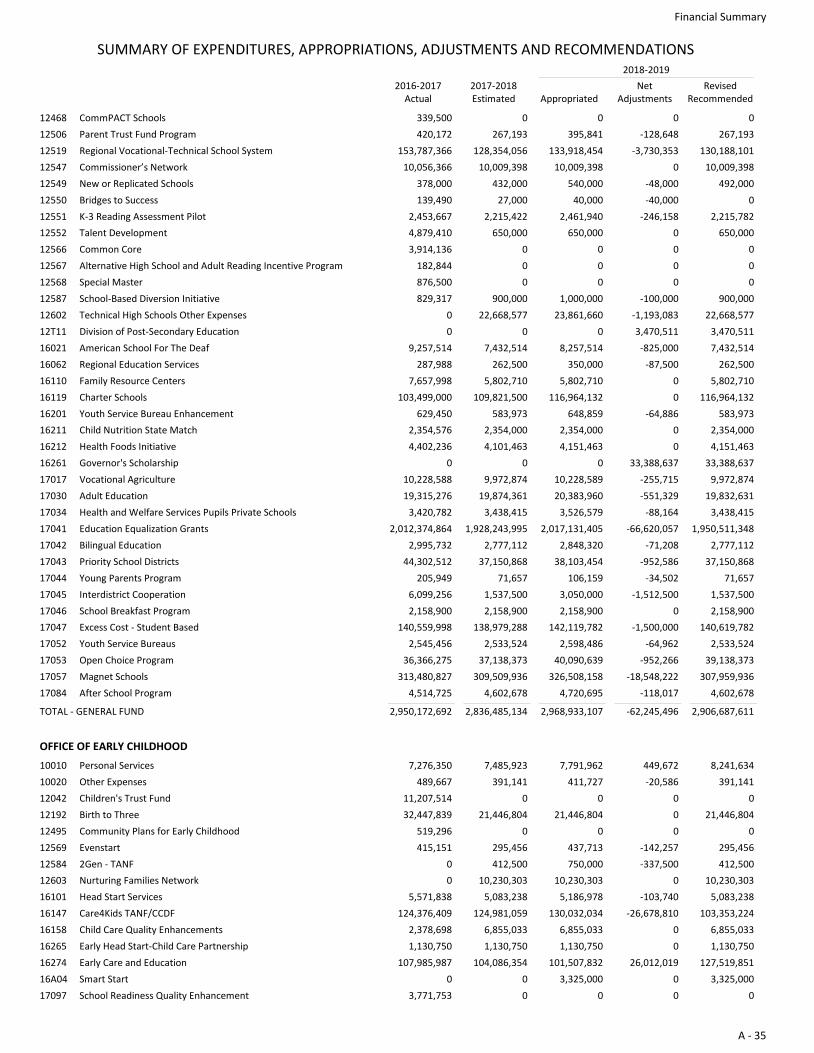
SUMMARY OF EXPENDITURES, APPROPRIATIONS, ADJUSTMENTS AND RECOMMENDATIONS
2016-2017Actual
2017-2018Estimated
RevisedRecommendedAppropriated
NetAdjustments
2018-2019
12468 CommPACT Schools 339,500 00 00
12506 Parent Trust Fund Program 420,172 395,841267,193 267,193-128,648
12519 Regional Vocational-Technical School System 153,787,366 133,918,454128,354,056 130,188,101-3,730,353
12547 Commissioner’s Network 10,056,366 10,009,39810,009,398 10,009,3980
12549 New or Replicated Schools 378,000 540,000432,000 492,000-48,000
12550 Bridges to Success 139,490 40,00027,000 0-40,000
12551 K-3 Reading Assessment Pilot 2,453,667 2,461,9402,215,422 2,215,782-246,158
12552 Talent Development 4,879,410 650,000650,000 650,0000
12566 Common Core 3,914,136 00 00
12567 Alternative High School and Adult Reading Incentive Program 182,844 00 00
12568 Special Master 876,500 00 00
12587 School-Based Diversion Initiative 829,317 1,000,000900,000 900,000-100,000
12602 Technical High Schools Other Expenses 0 23,861,66022,668,577 22,668,577-1,193,083
12T11 Division of Post-Secondary Education 0 00 3,470,5113,470,511
16021 American School For The Deaf 9,257,514 8,257,5147,432,514 7,432,514-825,000
16062 Regional Education Services 287,988 350,000262,500 262,500-87,500
16110 Family Resource Centers 7,657,998 5,802,7105,802,710 5,802,7100
16119 Charter Schools 103,499,000 116,964,132109,821,500 116,964,1320
16201 Youth Service Bureau Enhancement 629,450 648,859583,973 583,973-64,886
16211 Child Nutrition State Match 2,354,576 2,354,0002,354,000 2,354,0000
16212 Health Foods Initiative 4,402,236 4,151,4634,101,463 4,151,4630
16261 Governor's Scholarship 0 00 33,388,63733,388,637
17017 Vocational Agriculture 10,228,588 10,228,5899,972,874 9,972,874-255,715
17030 Adult Education 19,315,276 20,383,96019,874,361 19,832,631-551,329
17034 Health and Welfare Services Pupils Private Schools 3,420,782 3,526,5793,438,415 3,438,415-88,164
17041 Education Equalization Grants 2,012,374,864 2,017,131,4051,928,243,995 1,950,511,348-66,620,057
17042 Bilingual Education 2,995,732 2,848,3202,777,112 2,777,112-71,208
17043 Priority School Districts 44,302,512 38,103,45437,150,868 37,150,868-952,586
17044 Young Parents Program 205,949 106,15971,657 71,657-34,502
17045 Interdistrict Cooperation 6,099,256 3,050,0001,537,500 1,537,500-1,512,500
17046 School Breakfast Program 2,158,900 2,158,9002,158,900 2,158,9000
17047 Excess Cost - Student Based 140,559,998 142,119,782138,979,288 140,619,782-1,500,000
17052 Youth Service Bureaus 2,545,456 2,598,4862,533,524 2,533,524-64,962
17053 Open Choice Program 36,366,275 40,090,63937,138,373 39,138,373-952,266
17057 Magnet Schools 313,480,827 326,508,158309,509,936 307,959,936-18,548,222
17084 After School Program 4,514,725 4,720,6954,602,678 4,602,678-118,017
TOTAL - GENERAL FUND 2,950,172,692 2,836,485,134 -62,245,4962,968,933,107 2,906,687,611
OFFICE OF EARLY CHILDHOOD
10010 Personal Services 7,276,350 7,791,9627,485,923 8,241,634449,672
10020 Other Expenses 489,667 411,727391,141 391,141-20,586
12042 Children's Trust Fund 11,207,514 00 00
12192 Birth to Three 32,447,839 21,446,80421,446,804 21,446,8040
12495 Community Plans for Early Childhood 519,296 00 00
12569 Evenstart 415,151 437,713295,456 295,456-142,257
12584 2Gen - TANF 0 750,000412,500 412,500-337,500
12603 Nurturing Families Network 0 10,230,30310,230,303 10,230,3030
16101 Head Start Services 5,571,838 5,186,9785,083,238 5,083,238-103,740
16147 Care4Kids TANF/CCDF 124,376,409 130,032,034124,981,059 103,353,224-26,678,810
16158 Child Care Quality Enhancements 2,378,698 6,855,0336,855,033 6,855,0330
16265 Early Head Start-Child Care Partnership 1,130,750 1,130,7501,130,750 1,130,7500
16274 Early Care and Education 107,985,987 101,507,832104,086,354 127,519,85126,012,019
16A04 Smart Start 0 3,325,0000 3,325,0000
17097 School Readiness Quality Enhancement 3,771,753 00 00
Financial Summary
A - 35
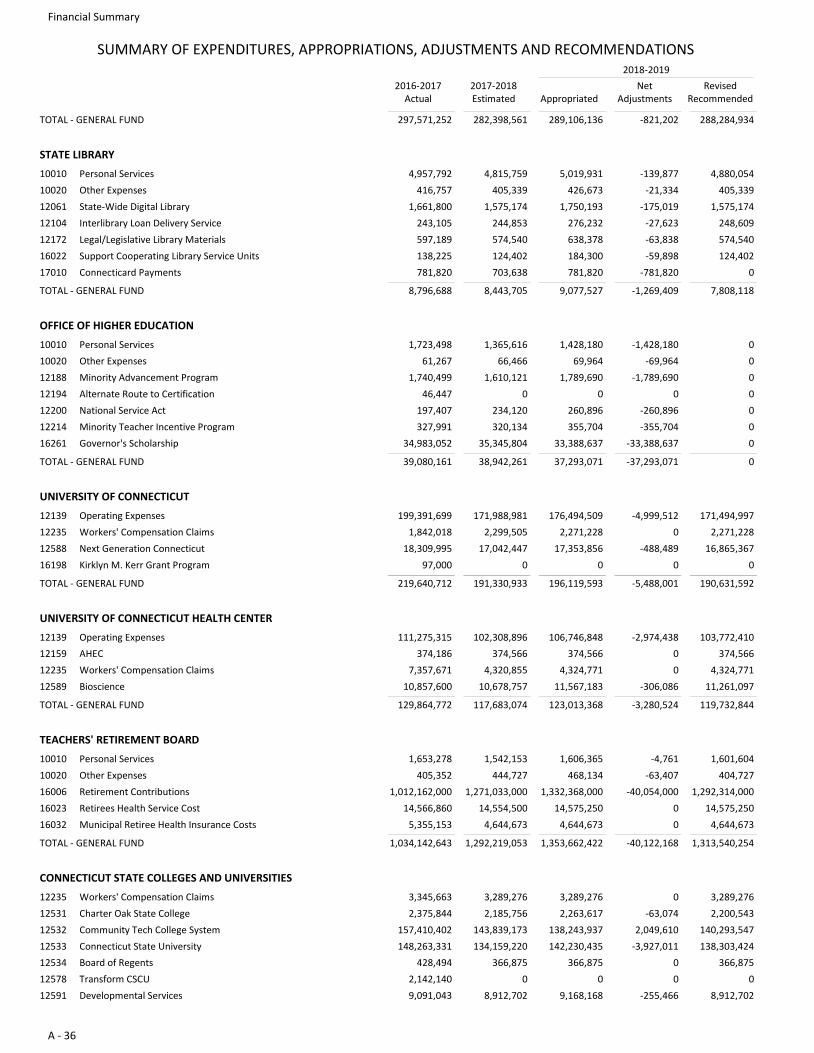
SUMMARY OF EXPENDITURES, APPROPRIATIONS, ADJUSTMENTS AND RECOMMENDATIONS
2016-2017Actual
2017-2018Estimated
RevisedRecommendedAppropriated
NetAdjustments
2018-2019
TOTAL - GENERAL FUND 297,571,252 282,398,561 -821,202289,106,136 288,284,934
STATE LIBRARY
10010 Personal Services 4,957,792 5,019,9314,815,759 4,880,054-139,877
10020 Other Expenses 416,757 426,673405,339 405,339-21,334
12061 State-Wide Digital Library 1,661,800 1,750,1931,575,174 1,575,174-175,019
12104 Interlibrary Loan Delivery Service 243,105 276,232244,853 248,609-27,623
12172 Legal/Legislative Library Materials 597,189 638,378574,540 574,540-63,838
16022 Support Cooperating Library Service Units 138,225 184,300124,402 124,402-59,898
17010 Connecticard Payments 781,820 781,820703,638 0-781,820
TOTAL - GENERAL FUND 8,796,688 8,443,705 -1,269,4099,077,527 7,808,118
OFFICE OF HIGHER EDUCATION
10010 Personal Services 1,723,498 1,428,1801,365,616 0-1,428,180
10020 Other Expenses 61,267 69,96466,466 0-69,964
12188 Minority Advancement Program 1,740,499 1,789,6901,610,121 0-1,789,690
12194 Alternate Route to Certification 46,447 00 00
12200 National Service Act 197,407 260,896234,120 0-260,896
12214 Minority Teacher Incentive Program 327,991 355,704320,134 0-355,704
16261 Governor's Scholarship 34,983,052 33,388,63735,345,804 0-33,388,637
TOTAL - GENERAL FUND 39,080,161 38,942,261 -37,293,07137,293,071 0
UNIVERSITY OF CONNECTICUT
12139 Operating Expenses 199,391,699 176,494,509171,988,981 171,494,997-4,999,512
12235 Workers' Compensation Claims 1,842,018 2,271,2282,299,505 2,271,2280
12588 Next Generation Connecticut 18,309,995 17,353,85617,042,447 16,865,367-488,489
16198 Kirklyn M. Kerr Grant Program 97,000 00 00
TOTAL - GENERAL FUND 219,640,712 191,330,933 -5,488,001196,119,593 190,631,592
UNIVERSITY OF CONNECTICUT HEALTH CENTER
12139 Operating Expenses 111,275,315 106,746,848102,308,896 103,772,410-2,974,438
12159 AHEC 374,186 374,566374,566 374,5660
12235 Workers' Compensation Claims 7,357,671 4,324,7714,320,855 4,324,7710
12589 Bioscience 10,857,600 11,567,18310,678,757 11,261,097-306,086
TOTAL - GENERAL FUND 129,864,772 117,683,074 -3,280,524123,013,368 119,732,844
TEACHERS' RETIREMENT BOARD
10010 Personal Services 1,653,278 1,606,3651,542,153 1,601,604-4,761
10020 Other Expenses 405,352 468,134444,727 404,727-63,407
16006 Retirement Contributions 1,012,162,000 1,332,368,0001,271,033,000 1,292,314,000-40,054,000
16023 Retirees Health Service Cost 14,566,860 14,575,25014,554,500 14,575,2500
16032 Municipal Retiree Health Insurance Costs 5,355,153 4,644,6734,644,673 4,644,6730
TOTAL - GENERAL FUND 1,034,142,643 1,292,219,053 -40,122,1681,353,662,422 1,313,540,254
CONNECTICUT STATE COLLEGES AND UNIVERSITIES
12235 Workers' Compensation Claims 3,345,663 3,289,2763,289,276 3,289,2760
12531 Charter Oak State College 2,375,844 2,263,6172,185,756 2,200,543-63,074
12532 Community Tech College System 157,410,402 138,243,937143,839,173 140,293,5472,049,610
12533 Connecticut State University 148,263,331 142,230,435134,159,220 138,303,424-3,927,011
12534 Board of Regents 428,494 366,875366,875 366,8750
12578 Transform CSCU 2,142,140 00 00
12591 Developmental Services 9,091,043 9,168,1688,912,702 8,912,702-255,466
Financial Summary
A - 36
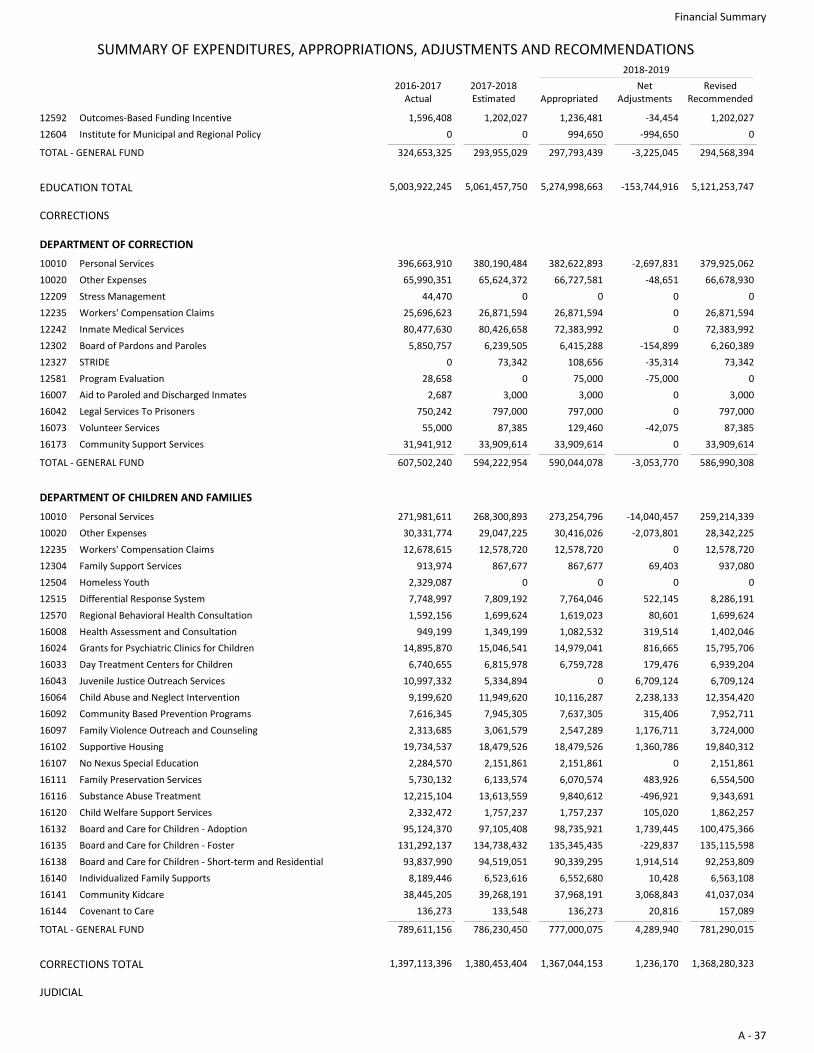
SUMMARY OF EXPENDITURES, APPROPRIATIONS, ADJUSTMENTS AND RECOMMENDATIONS
2016-2017Actual
2017-2018Estimated
RevisedRecommendedAppropriated
NetAdjustments
2018-2019
12592 Outcomes-Based Funding Incentive 1,596,408 1,236,4811,202,027 1,202,027-34,454
12604 Institute for Municipal and Regional Policy 0 994,6500 0-994,650
TOTAL - GENERAL FUND 324,653,325 293,955,029 -3,225,045297,793,439 294,568,394
EDUCATION TOTAL 5,003,922,245 5,061,457,750 -153,744,9165,274,998,663 5,121,253,747
CORRECTIONS
DEPARTMENT OF CORRECTION
10010 Personal Services 396,663,910 382,622,893380,190,484 379,925,062-2,697,831
10020 Other Expenses 65,990,351 66,727,58165,624,372 66,678,930-48,651
12209 Stress Management 44,470 00 00
12235 Workers' Compensation Claims 25,696,623 26,871,59426,871,594 26,871,5940
12242 Inmate Medical Services 80,477,630 72,383,99280,426,658 72,383,9920
12302 Board of Pardons and Paroles 5,850,757 6,415,2886,239,505 6,260,389-154,899
12327 STRIDE 0 108,65673,342 73,342-35,314
12581 Program Evaluation 28,658 75,0000 0-75,000
16007 Aid to Paroled and Discharged Inmates 2,687 3,0003,000 3,0000
16042 Legal Services To Prisoners 750,242 797,000797,000 797,0000
16073 Volunteer Services 55,000 129,46087,385 87,385-42,075
16173 Community Support Services 31,941,912 33,909,61433,909,614 33,909,6140
TOTAL - GENERAL FUND 607,502,240 594,222,954 -3,053,770590,044,078 586,990,308
DEPARTMENT OF CHILDREN AND FAMILIES
10010 Personal Services 271,981,611 273,254,796268,300,893 259,214,339-14,040,457
10020 Other Expenses 30,331,774 30,416,02629,047,225 28,342,225-2,073,801
12235 Workers' Compensation Claims 12,678,615 12,578,72012,578,720 12,578,7200
12304 Family Support Services 913,974 867,677867,677 937,08069,403
12504 Homeless Youth 2,329,087 00 00
12515 Differential Response System 7,748,997 7,764,0467,809,192 8,286,191522,145
12570 Regional Behavioral Health Consultation 1,592,156 1,619,0231,699,624 1,699,62480,601
16008 Health Assessment and Consultation 949,199 1,082,5321,349,199 1,402,046319,514
16024 Grants for Psychiatric Clinics for Children 14,895,870 14,979,04115,046,541 15,795,706816,665
16033 Day Treatment Centers for Children 6,740,655 6,759,7286,815,978 6,939,204179,476
16043 Juvenile Justice Outreach Services 10,997,332 05,334,894 6,709,1246,709,124
16064 Child Abuse and Neglect Intervention 9,199,620 10,116,28711,949,620 12,354,4202,238,133
16092 Community Based Prevention Programs 7,616,345 7,637,3057,945,305 7,952,711315,406
16097 Family Violence Outreach and Counseling 2,313,685 2,547,2893,061,579 3,724,0001,176,711
16102 Supportive Housing 19,734,537 18,479,52618,479,526 19,840,3121,360,786
16107 No Nexus Special Education 2,284,570 2,151,8612,151,861 2,151,8610
16111 Family Preservation Services 5,730,132 6,070,5746,133,574 6,554,500483,926
16116 Substance Abuse Treatment 12,215,104 9,840,61213,613,559 9,343,691-496,921
16120 Child Welfare Support Services 2,332,472 1,757,2371,757,237 1,862,257105,020
16132 Board and Care for Children - Adoption 95,124,370 98,735,92197,105,408 100,475,3661,739,445
16135 Board and Care for Children - Foster 131,292,137 135,345,435134,738,432 135,115,598-229,837
16138 Board and Care for Children - Short-term and Residential 93,837,990 90,339,29594,519,051 92,253,8091,914,514
16140 Individualized Family Supports 8,189,446 6,552,6806,523,616 6,563,10810,428
16141 Community Kidcare 38,445,205 37,968,19139,268,191 41,037,0343,068,843
16144 Covenant to Care 136,273 136,273133,548 157,08920,816
TOTAL - GENERAL FUND 789,611,156 786,230,450 4,289,940777,000,075 781,290,015
CORRECTIONS TOTAL 1,397,113,396 1,380,453,404 1,236,1701,367,044,153 1,368,280,323
JUDICIAL
Financial Summary
A - 37
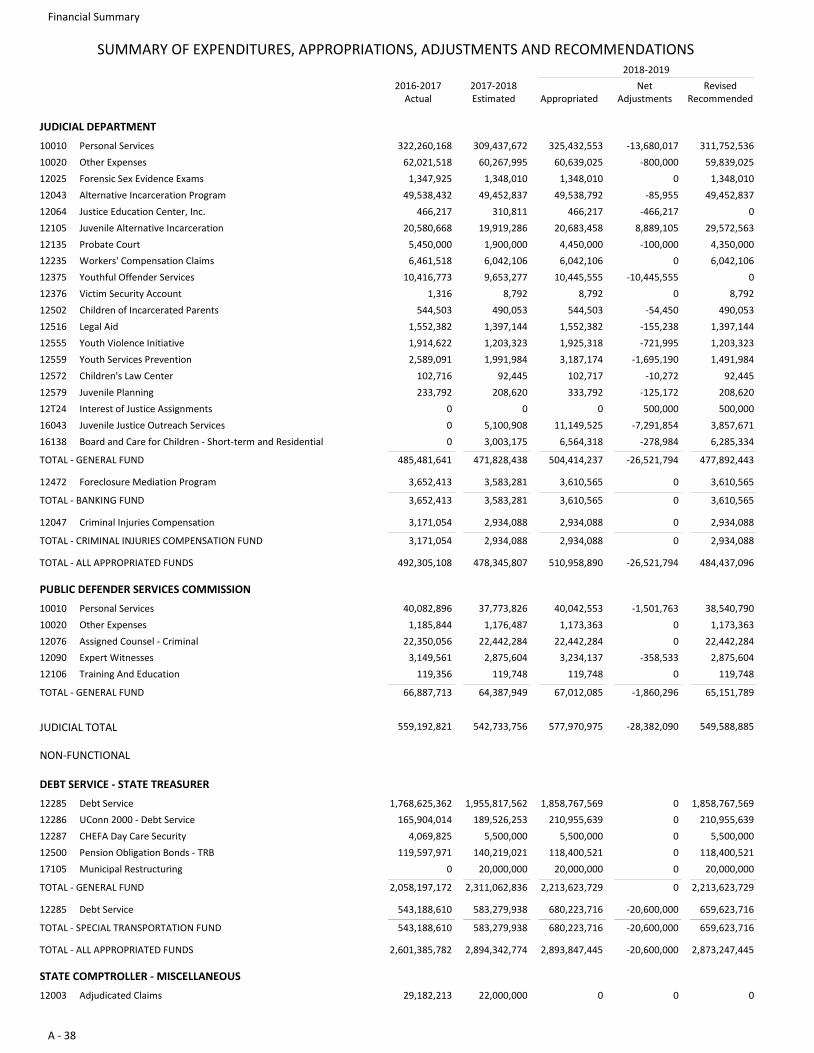
SUMMARY OF EXPENDITURES, APPROPRIATIONS, ADJUSTMENTS AND RECOMMENDATIONS
2016-2017Actual
2017-2018Estimated
RevisedRecommendedAppropriated
NetAdjustments
2018-2019
JUDICIAL DEPARTMENT
10010 Personal Services 322,260,168 325,432,553309,437,672 311,752,536-13,680,017
10020 Other Expenses 62,021,518 60,639,02560,267,995 59,839,025-800,000
12025 Forensic Sex Evidence Exams 1,347,925 1,348,0101,348,010 1,348,0100
12043 Alternative Incarceration Program 49,538,432 49,538,79249,452,837 49,452,837-85,955
12064 Justice Education Center, Inc. 466,217 466,217310,811 0-466,217
12105 Juvenile Alternative Incarceration 20,580,668 20,683,45819,919,286 29,572,5638,889,105
12135 Probate Court 5,450,000 4,450,0001,900,000 4,350,000-100,000
12235 Workers' Compensation Claims 6,461,518 6,042,1066,042,106 6,042,1060
12375 Youthful Offender Services 10,416,773 10,445,5559,653,277 0-10,445,555
12376 Victim Security Account 1,316 8,7928,792 8,7920
12502 Children of Incarcerated Parents 544,503 544,503490,053 490,053-54,450
12516 Legal Aid 1,552,382 1,552,3821,397,144 1,397,144-155,238
12555 Youth Violence Initiative 1,914,622 1,925,3181,203,323 1,203,323-721,995
12559 Youth Services Prevention 2,589,091 3,187,1741,991,984 1,491,984-1,695,190
12572 Children's Law Center 102,716 102,71792,445 92,445-10,272
12579 Juvenile Planning 233,792 333,792208,620 208,620-125,172
12T24 Interest of Justice Assignments 0 00 500,000500,000
16043 Juvenile Justice Outreach Services 0 11,149,5255,100,908 3,857,671-7,291,854
16138 Board and Care for Children - Short-term and Residential 0 6,564,3183,003,175 6,285,334-278,984
TOTAL - GENERAL FUND 485,481,641 471,828,438 -26,521,794504,414,237 477,892,443
12472 Foreclosure Mediation Program 3,652,413 3,610,5653,583,281 3,610,5650
TOTAL - BANKING FUND 3,652,413 3,583,281 03,610,565 3,610,565
12047 Criminal Injuries Compensation 3,171,054 2,934,0882,934,088 2,934,0880
TOTAL - CRIMINAL INJURIES COMPENSATION FUND 3,171,054 2,934,088 02,934,088 2,934,088
492,305,108 478,345,807 -26,521,794510,958,890 484,437,096TOTAL - ALL APPROPRIATED FUNDS
PUBLIC DEFENDER SERVICES COMMISSION
10010 Personal Services 40,082,896 40,042,55337,773,826 38,540,790-1,501,763
10020 Other Expenses 1,185,844 1,173,3631,176,487 1,173,3630
12076 Assigned Counsel - Criminal 22,350,056 22,442,28422,442,284 22,442,2840
12090 Expert Witnesses 3,149,561 3,234,1372,875,604 2,875,604-358,533
12106 Training And Education 119,356 119,748119,748 119,7480
TOTAL - GENERAL FUND 66,887,713 64,387,949 -1,860,29667,012,085 65,151,789
JUDICIAL TOTAL 559,192,821 542,733,756 -28,382,090577,970,975 549,588,885
NON-FUNCTIONAL
DEBT SERVICE - STATE TREASURER
12285 Debt Service 1,768,625,362 1,858,767,5691,955,817,562 1,858,767,5690
12286 UConn 2000 - Debt Service 165,904,014 210,955,639189,526,253 210,955,6390
12287 CHEFA Day Care Security 4,069,825 5,500,0005,500,000 5,500,0000
12500 Pension Obligation Bonds - TRB 119,597,971 118,400,521140,219,021 118,400,5210
17105 Municipal Restructuring 0 20,000,00020,000,000 20,000,0000
TOTAL - GENERAL FUND 2,058,197,172 2,311,062,836 02,213,623,729 2,213,623,729
12285 Debt Service 543,188,610 680,223,716583,279,938 659,623,716-20,600,000
TOTAL - SPECIAL TRANSPORTATION FUND 543,188,610 583,279,938 -20,600,000680,223,716 659,623,716
2,601,385,782 2,894,342,774 -20,600,0002,893,847,445 2,873,247,445TOTAL - ALL APPROPRIATED FUNDS
STATE COMPTROLLER - MISCELLANEOUS
12003 Adjudicated Claims 29,182,213 022,000,000 00
Financial Summary
A - 38
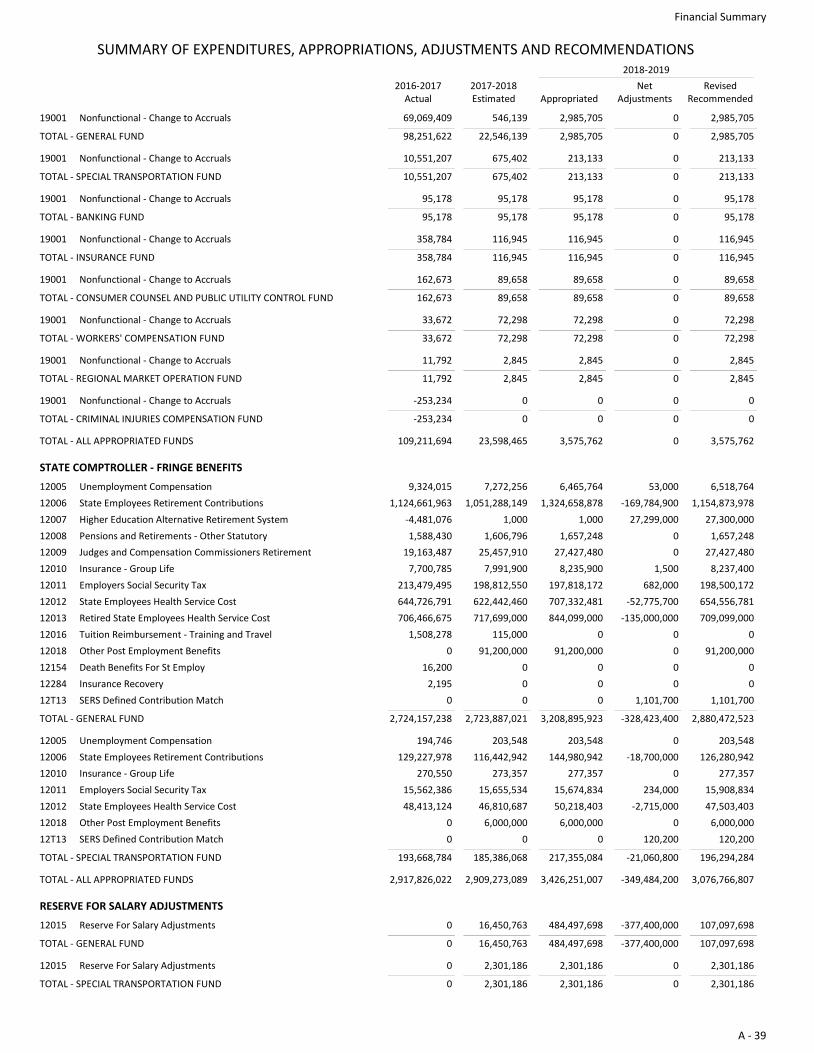
SUMMARY OF EXPENDITURES, APPROPRIATIONS, ADJUSTMENTS AND RECOMMENDATIONS
2016-2017Actual
2017-2018Estimated
RevisedRecommendedAppropriated
NetAdjustments
2018-2019
19001 Nonfunctional - Change to Accruals 69,069,409 2,985,705546,139 2,985,7050
TOTAL - GENERAL FUND 98,251,622 22,546,139 02,985,705 2,985,705
19001 Nonfunctional - Change to Accruals 10,551,207 213,133675,402 213,1330
TOTAL - SPECIAL TRANSPORTATION FUND 10,551,207 675,402 0213,133 213,133
19001 Nonfunctional - Change to Accruals 95,178 95,17895,178 95,1780
TOTAL - BANKING FUND 95,178 95,178 095,178 95,178
19001 Nonfunctional - Change to Accruals 358,784 116,945116,945 116,9450
TOTAL - INSURANCE FUND 358,784 116,945 0116,945 116,945
19001 Nonfunctional - Change to Accruals 162,673 89,65889,658 89,6580
TOTAL - CONSUMER COUNSEL AND PUBLIC UTILITY CONTROL FUND 162,673 89,658 089,658 89,658
19001 Nonfunctional - Change to Accruals 33,672 72,29872,298 72,2980
TOTAL - WORKERS' COMPENSATION FUND 33,672 72,298 072,298 72,298
19001 Nonfunctional - Change to Accruals 11,792 2,8452,845 2,8450
TOTAL - REGIONAL MARKET OPERATION FUND 11,792 2,845 02,845 2,845
19001 Nonfunctional - Change to Accruals -253,234 00 00
TOTAL - CRIMINAL INJURIES COMPENSATION FUND -253,234 0 00 0
109,211,694 23,598,465 03,575,762 3,575,762TOTAL - ALL APPROPRIATED FUNDS
STATE COMPTROLLER - FRINGE BENEFITS
12005 Unemployment Compensation 9,324,015 6,465,7647,272,256 6,518,76453,000
12006 State Employees Retirement Contributions 1,124,661,963 1,324,658,8781,051,288,149 1,154,873,978-169,784,900
12007 Higher Education Alternative Retirement System -4,481,076 1,0001,000 27,300,00027,299,000
12008 Pensions and Retirements - Other Statutory 1,588,430 1,657,2481,606,796 1,657,2480
12009 Judges and Compensation Commissioners Retirement 19,163,487 27,427,48025,457,910 27,427,4800
12010 Insurance - Group Life 7,700,785 8,235,9007,991,900 8,237,4001,500
12011 Employers Social Security Tax 213,479,495 197,818,172198,812,550 198,500,172682,000
12012 State Employees Health Service Cost 644,726,791 707,332,481622,442,460 654,556,781-52,775,700
12013 Retired State Employees Health Service Cost 706,466,675 844,099,000717,699,000 709,099,000-135,000,000
12016 Tuition Reimbursement - Training and Travel 1,508,278 0115,000 00
12018 Other Post Employment Benefits 0 91,200,00091,200,000 91,200,0000
12154 Death Benefits For St Employ 16,200 00 00
12284 Insurance Recovery 2,195 00 00
12T13 SERS Defined Contribution Match 0 00 1,101,7001,101,700
TOTAL - GENERAL FUND 2,724,157,238 2,723,887,021 -328,423,4003,208,895,923 2,880,472,523
12005 Unemployment Compensation 194,746 203,548203,548 203,5480
12006 State Employees Retirement Contributions 129,227,978 144,980,942116,442,942 126,280,942-18,700,000
12010 Insurance - Group Life 270,550 277,357273,357 277,3570
12011 Employers Social Security Tax 15,562,386 15,674,83415,655,534 15,908,834234,000
12012 State Employees Health Service Cost 48,413,124 50,218,40346,810,687 47,503,403-2,715,000
12018 Other Post Employment Benefits 0 6,000,0006,000,000 6,000,0000
12T13 SERS Defined Contribution Match 0 00 120,200120,200
TOTAL - SPECIAL TRANSPORTATION FUND 193,668,784 185,386,068 -21,060,800217,355,084 196,294,284
2,917,826,022 2,909,273,089 -349,484,2003,426,251,007 3,076,766,807TOTAL - ALL APPROPRIATED FUNDS
RESERVE FOR SALARY ADJUSTMENTS
12015 Reserve For Salary Adjustments 0 484,497,69816,450,763 107,097,698-377,400,000
TOTAL - GENERAL FUND 0 16,450,763 -377,400,000484,497,698 107,097,698
12015 Reserve For Salary Adjustments 0 2,301,1862,301,186 2,301,1860
TOTAL - SPECIAL TRANSPORTATION FUND 0 2,301,186 02,301,186 2,301,186
Financial Summary
A - 39
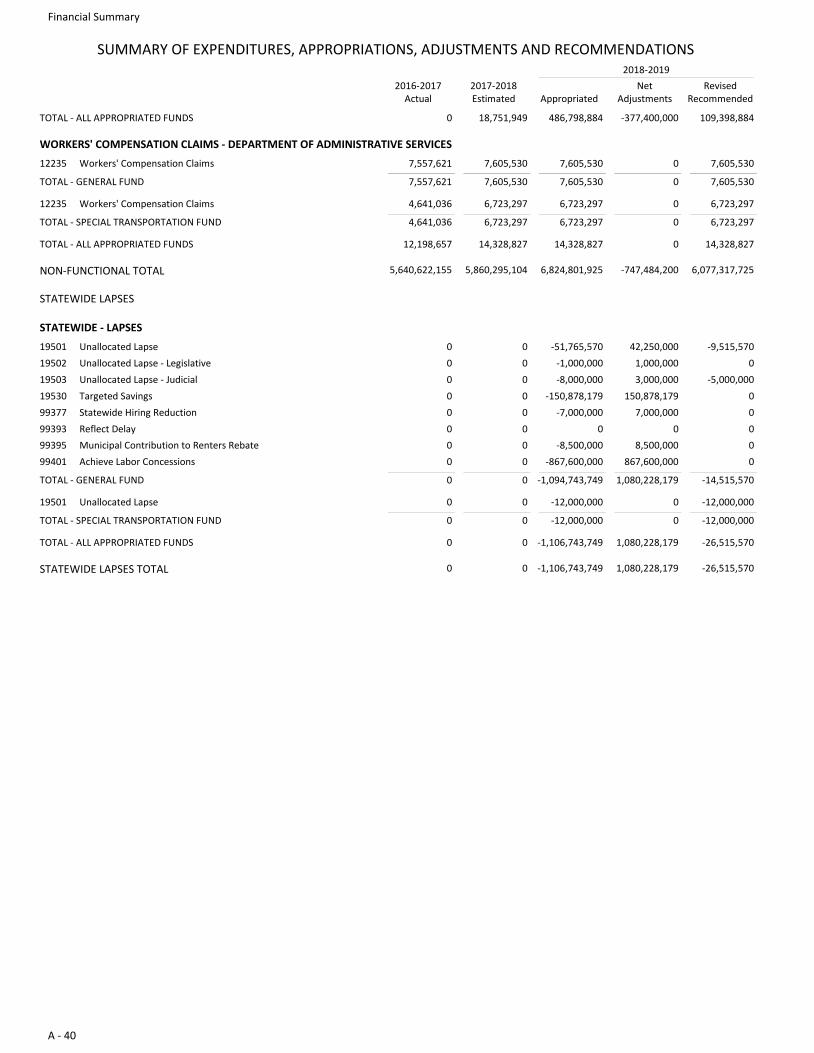
SUMMARY OF EXPENDITURES, APPROPRIATIONS, ADJUSTMENTS AND RECOMMENDATIONS
2016-2017Actual
2017-2018Estimated
RevisedRecommendedAppropriated
NetAdjustments
2018-2019
0 18,751,949 -377,400,000486,798,884 109,398,884TOTAL - ALL APPROPRIATED FUNDS
WORKERS' COMPENSATION CLAIMS - DEPARTMENT OF ADMINISTRATIVE SERVICES
12235 Workers' Compensation Claims 7,557,621 7,605,5307,605,530 7,605,5300
TOTAL - GENERAL FUND 7,557,621 7,605,530 07,605,530 7,605,530
12235 Workers' Compensation Claims 4,641,036 6,723,2976,723,297 6,723,2970
TOTAL - SPECIAL TRANSPORTATION FUND 4,641,036 6,723,297 06,723,297 6,723,297
12,198,657 14,328,827 014,328,827 14,328,827TOTAL - ALL APPROPRIATED FUNDS
NON-FUNCTIONAL TOTAL 5,640,622,155 5,860,295,104 -747,484,2006,824,801,925 6,077,317,725
STATEWIDE LAPSES
STATEWIDE - LAPSES
19501 Unallocated Lapse 0 -51,765,5700 -9,515,57042,250,000
19502 Unallocated Lapse - Legislative 0 -1,000,0000 01,000,000
19503 Unallocated Lapse - Judicial 0 -8,000,0000 -5,000,0003,000,000
19530 Targeted Savings 0 -150,878,1790 0150,878,179
99377 Statewide Hiring Reduction 0 -7,000,0000 07,000,000
99393 Reflect Delay 0 00 00
99395 Municipal Contribution to Renters Rebate 0 -8,500,0000 08,500,000
99401 Achieve Labor Concessions 0 -867,600,0000 0867,600,000
TOTAL - GENERAL FUND 0 0 1,080,228,179-1,094,743,749 -14,515,570
19501 Unallocated Lapse 0 -12,000,0000 -12,000,0000
TOTAL - SPECIAL TRANSPORTATION FUND 0 0 0-12,000,000 -12,000,000
0 0 1,080,228,179-1,106,743,749 -26,515,570TOTAL - ALL APPROPRIATED FUNDS
STATEWIDE LAPSES TOTAL 0 0 1,080,228,179-1,106,743,749 -26,515,570
Financial Summary
A - 40
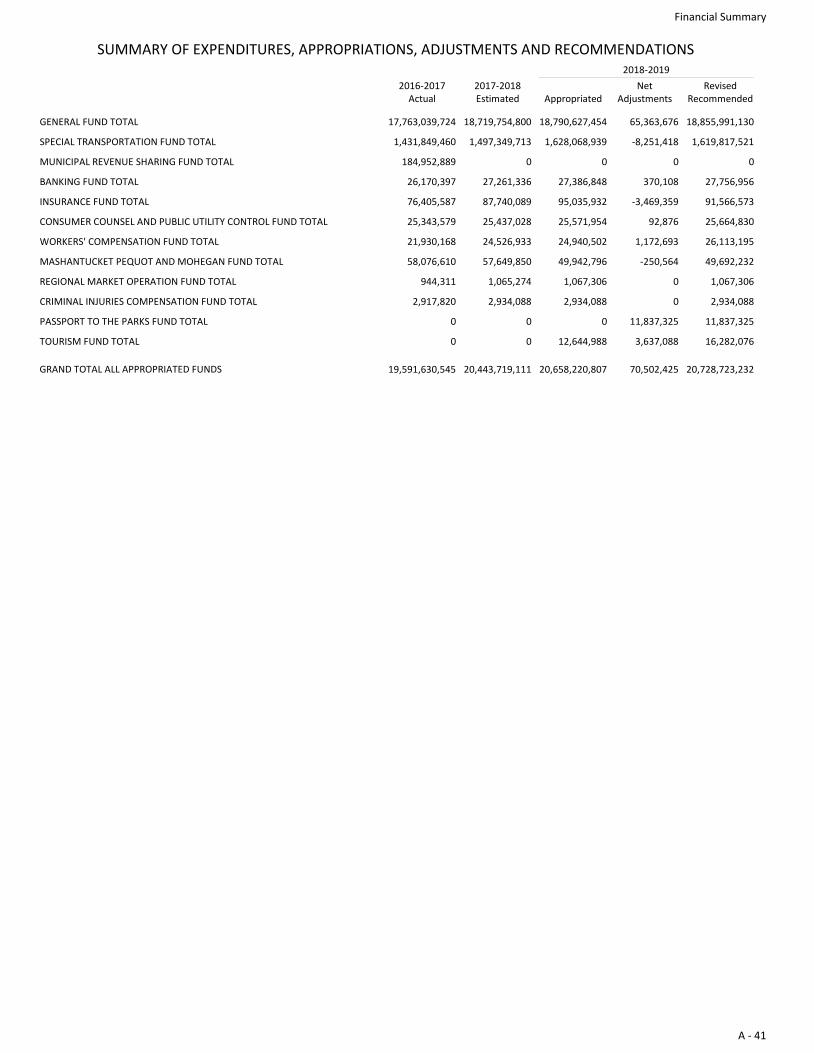
SUMMARY OF EXPENDITURES, APPROPRIATIONS, ADJUSTMENTS AND RECOMMENDATIONS
2016-2017Actual
2017-2018Estimated
RevisedRecommendedAppropriated
NetAdjustments
2018-2019
GENERAL FUND TOTAL 17,763,039,724 18,719,754,800 65,363,67618,790,627,454 18,855,991,130
SPECIAL TRANSPORTATION FUND TOTAL 1,431,849,460 1,497,349,713 -8,251,4181,628,068,939 1,619,817,521
MUNICIPAL REVENUE SHARING FUND TOTAL 184,952,889 0 00 0
BANKING FUND TOTAL 26,170,397 27,261,336 370,10827,386,848 27,756,956
INSURANCE FUND TOTAL 76,405,587 87,740,089 -3,469,35995,035,932 91,566,573
CONSUMER COUNSEL AND PUBLIC UTILITY CONTROL FUND TOTAL 25,343,579 25,437,028 92,87625,571,954 25,664,830
WORKERS' COMPENSATION FUND TOTAL 21,930,168 24,526,933 1,172,69324,940,502 26,113,195
MASHANTUCKET PEQUOT AND MOHEGAN FUND TOTAL 58,076,610 57,649,850 -250,56449,942,796 49,692,232
REGIONAL MARKET OPERATION FUND TOTAL 944,311 1,065,274 01,067,306 1,067,306
CRIMINAL INJURIES COMPENSATION FUND TOTAL 2,917,820 2,934,088 02,934,088 2,934,088
PASSPORT TO THE PARKS FUND TOTAL 0 0 11,837,3250 11,837,325
TOURISM FUND TOTAL 0 0 3,637,08812,644,988 16,282,076
GRAND TOTAL ALL APPROPRIATED FUNDS 19,591,630,545 20,443,719,111 70,502,42520,658,220,807 20,728,723,232
Financial Summary
A - 41
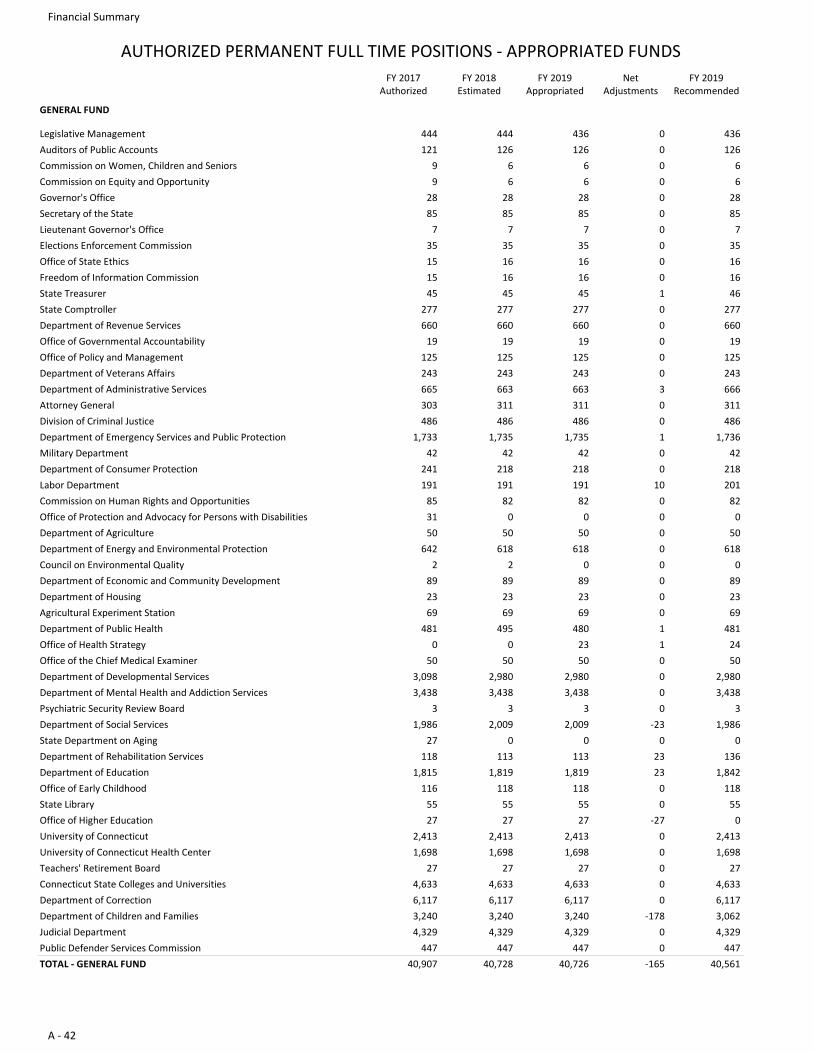
AUTHORIZED PERMANENT FULL TIME POSITIONS - APPROPRIATED FUNDS
FY 2017Authorized
FY 2018Estimated
FY 2019Appropriated
NetAdjustments
FY 2019Recommended
GENERAL FUND
444 444 436 0 436Legislative Management
121 126 126 0 126Auditors of Public Accounts
9 6 6 0 6Commission on Women, Children and Seniors
9 6 6 0 6Commission on Equity and Opportunity
28 28 28 0 28Governor's Office
85 85 85 0 85Secretary of the State
7 7 7 0 7Lieutenant Governor's Office
35 35 35 0 35Elections Enforcement Commission
15 16 16 0 16Office of State Ethics
15 16 16 0 16Freedom of Information Commission
45 45 45 1 46State Treasurer
277 277 277 0 277State Comptroller
660 660 660 0 660Department of Revenue Services
19 19 19 0 19Office of Governmental Accountability
125 125 125 0 125Office of Policy and Management
243 243 243 0 243Department of Veterans Affairs
665 663 663 3 666Department of Administrative Services
303 311 311 0 311Attorney General
486 486 486 0 486Division of Criminal Justice
1,733 1,735 1,735 1 1,736Department of Emergency Services and Public Protection
42 42 42 0 42Military Department
241 218 218 0 218Department of Consumer Protection
191 191 191 10 201Labor Department
85 82 82 0 82Commission on Human Rights and Opportunities
31 0 0 0 0Office of Protection and Advocacy for Persons with Disabilities
50 50 50 0 50Department of Agriculture
642 618 618 0 618Department of Energy and Environmental Protection
2 2 0 0 0Council on Environmental Quality
89 89 89 0 89Department of Economic and Community Development
23 23 23 0 23Department of Housing
69 69 69 0 69Agricultural Experiment Station
481 495 480 1 481Department of Public Health
0 0 23 1 24Office of Health Strategy
50 50 50 0 50Office of the Chief Medical Examiner
3,098 2,980 2,980 0 2,980Department of Developmental Services
3,438 3,438 3,438 0 3,438Department of Mental Health and Addiction Services
3 3 3 0 3Psychiatric Security Review Board
1,986 2,009 2,009 -23 1,986Department of Social Services
27 0 0 0 0State Department on Aging
118 113 113 23 136Department of Rehabilitation Services
1,815 1,819 1,819 23 1,842Department of Education
116 118 118 0 118Office of Early Childhood
55 55 55 0 55State Library
27 27 27 -27 0Office of Higher Education
2,413 2,413 2,413 0 2,413University of Connecticut
1,698 1,698 1,698 0 1,698University of Connecticut Health Center
27 27 27 0 27Teachers' Retirement Board
4,633 4,633 4,633 0 4,633Connecticut State Colleges and Universities
6,117 6,117 6,117 0 6,117Department of Correction
3,240 3,240 3,240 -178 3,062Department of Children and Families
4,329 4,329 4,329 0 4,329Judicial Department
447 447 447 0 447Public Defender Services Commission
40,907 40,728 40,726 -165 40,561TOTAL - GENERAL FUND
Financial Summary
A - 42
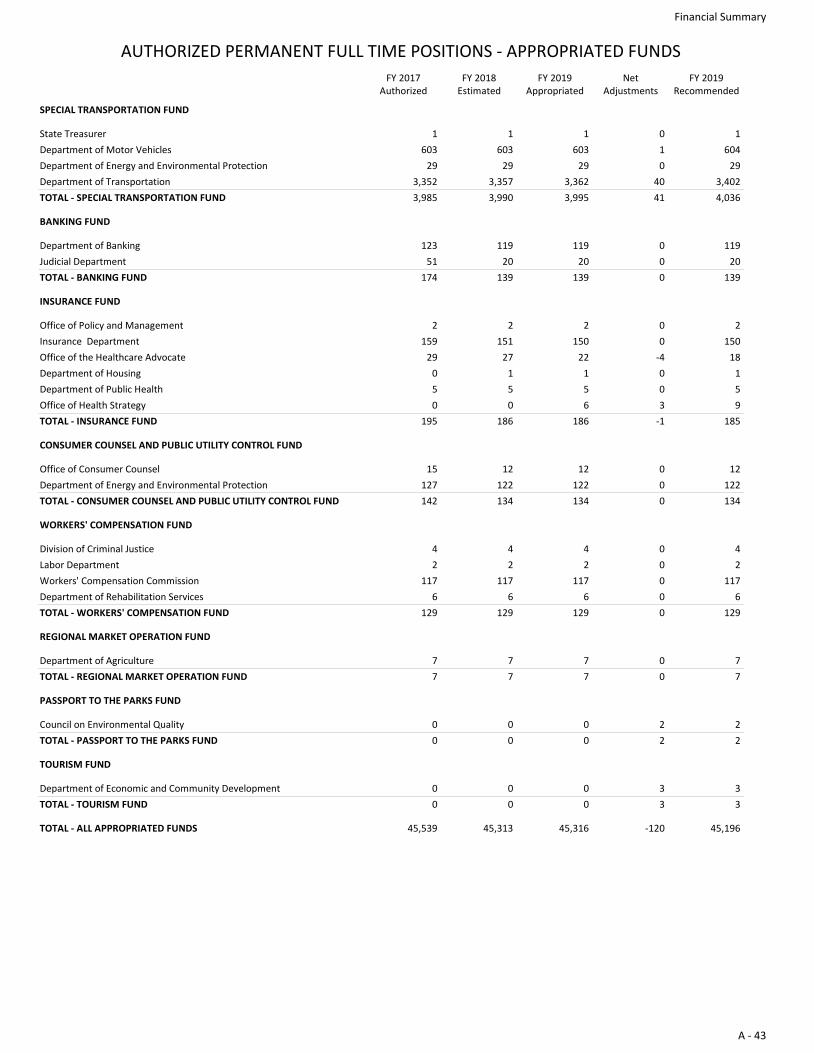
AUTHORIZED PERMANENT FULL TIME POSITIONS - APPROPRIATED FUNDS
FY 2017Authorized
FY 2018Estimated
FY 2019Appropriated
NetAdjustments
FY 2019Recommended
SPECIAL TRANSPORTATION FUND
1 1 1 0 1State Treasurer
603 603 603 1 604Department of Motor Vehicles
29 29 29 0 29Department of Energy and Environmental Protection
3,352 3,357 3,362 40 3,402Department of Transportation
3,985 3,990 3,995 41 4,036TOTAL - SPECIAL TRANSPORTATION FUND
BANKING FUND
123 119 119 0 119Department of Banking
51 20 20 0 20Judicial Department
174 139 139 0 139TOTAL - BANKING FUND
INSURANCE FUND
2 2 2 0 2Office of Policy and Management
159 151 150 0 150Insurance Department
29 27 22 -4 18Office of the Healthcare Advocate
0 1 1 0 1Department of Housing
5 5 5 0 5Department of Public Health
0 0 6 3 9Office of Health Strategy
195 186 186 -1 185TOTAL - INSURANCE FUND
CONSUMER COUNSEL AND PUBLIC UTILITY CONTROL FUND
15 12 12 0 12Office of Consumer Counsel
127 122 122 0 122Department of Energy and Environmental Protection
142 134 134 0 134TOTAL - CONSUMER COUNSEL AND PUBLIC UTILITY CONTROL FUND
WORKERS' COMPENSATION FUND
4 4 4 0 4Division of Criminal Justice
2 2 2 0 2Labor Department
117 117 117 0 117Workers' Compensation Commission
6 6 6 0 6Department of Rehabilitation Services
129 129 129 0 129TOTAL - WORKERS' COMPENSATION FUND
REGIONAL MARKET OPERATION FUND
7 7 7 0 7Department of Agriculture
7 7 7 0 7TOTAL - REGIONAL MARKET OPERATION FUND
PASSPORT TO THE PARKS FUND
0 0 0 2 2Council on Environmental Quality
0 0 0 2 2TOTAL - PASSPORT TO THE PARKS FUND
TOURISM FUND
0 0 0 3 3Department of Economic and Community Development
0 0 0 3 3TOTAL - TOURISM FUND
45,539 45,313 45,316 -120 45,196TOTAL - ALL APPROPRIATED FUNDS
Financial Summary
A - 43
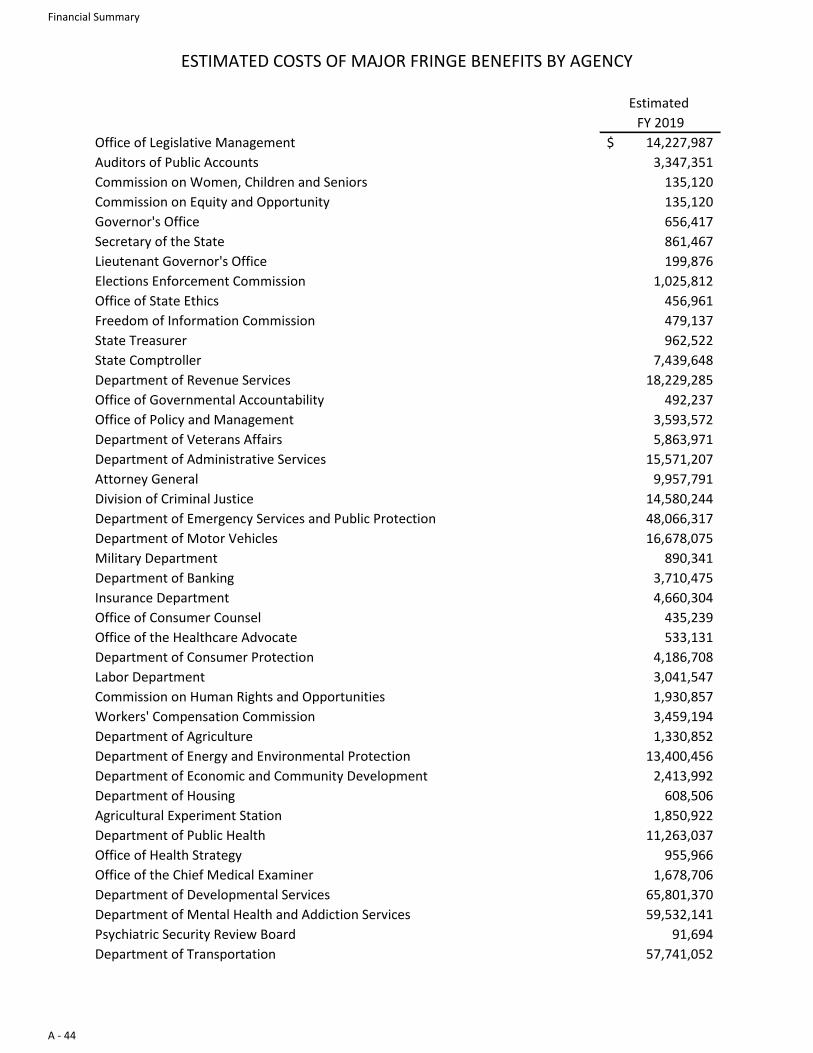
Estimated
FY 2019
Office of Legislative Management 14,227,987$
Auditors of Public Accounts 3,347,351
Commission on Women, Children and Seniors 135,120
Commission on Equity and Opportunity 135,120
Governor's Office 656,417
Secretary of the State 861,467
Lieutenant Governor's Office 199,876
Elections Enforcement Commission 1,025,812
Office of State Ethics 456,961
Freedom of Information Commission 479,137
State Treasurer 962,522
State Comptroller 7,439,648
Department of Revenue Services 18,229,285
Office of Governmental Accountability 492,237
Office of Policy and Management 3,593,572
Department of Veterans Affairs 5,863,971
Department of Administrative Services 15,571,207
Attorney General 9,957,791
Division of Criminal Justice 14,580,244
Department of Emergency Services and Public Protection 48,066,317
Department of Motor Vehicles 16,678,075
Military Department 890,341
Department of Banking 3,710,475
Insurance Department 4,660,304
Office of Consumer Counsel 435,239
Office of the Healthcare Advocate 533,131
Department of Consumer Protection 4,186,708
Labor Department 3,041,547
Commission on Human Rights and Opportunities 1,930,857
Workers' Compensation Commission 3,459,194
Department of Agriculture 1,330,852
Department of Energy and Environmental Protection 13,400,456
Department of Economic and Community Development 2,413,992
Department of Housing 608,506
Agricultural Experiment Station 1,850,922
Department of Public Health 11,263,037
Office of Health Strategy 955,966
Office of the Chief Medical Examiner 1,678,706
Department of Developmental Services 65,801,370
Department of Mental Health and Addiction Services 59,532,141
Psychiatric Security Review Board 91,694
Department of Transportation 57,741,052
ESTIMATED COSTS OF MAJOR FRINGE BENEFITS BY AGENCY
Financial Summary
A - 44
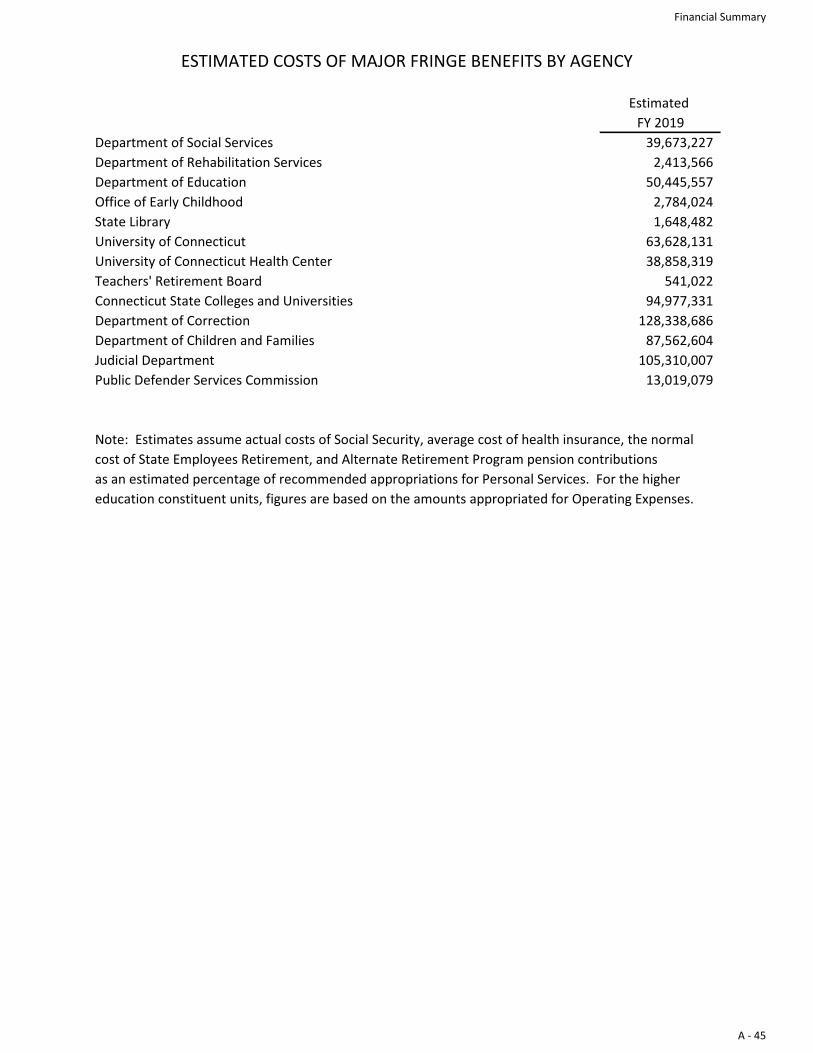
Estimated
FY 2019
ESTIMATED COSTS OF MAJOR FRINGE BENEFITS BY AGENCY
Department of Social Services 39,673,227
Department of Rehabilitation Services 2,413,566
Department of Education 50,445,557
Office of Early Childhood 2,784,024
State Library 1,648,482
University of Connecticut 63,628,131
University of Connecticut Health Center 38,858,319
Teachers' Retirement Board 541,022
Connecticut State Colleges and Universities 94,977,331
Department of Correction 128,338,686
Department of Children and Families 87,562,604
Judicial Department 105,310,007
Public Defender Services Commission 13,019,079
Note: Estimates assume actual costs of Social Security, average cost of health insurance, the normal
cost of State Employees Retirement, and Alternate Retirement Program pension contributions
as an estimated percentage of recommended appropriations for Personal Services. For the higher
education constituent units, figures are based on the amounts appropriated for Operating Expenses.
Financial Summary
A - 45