Embed Size (px)
Citation preview
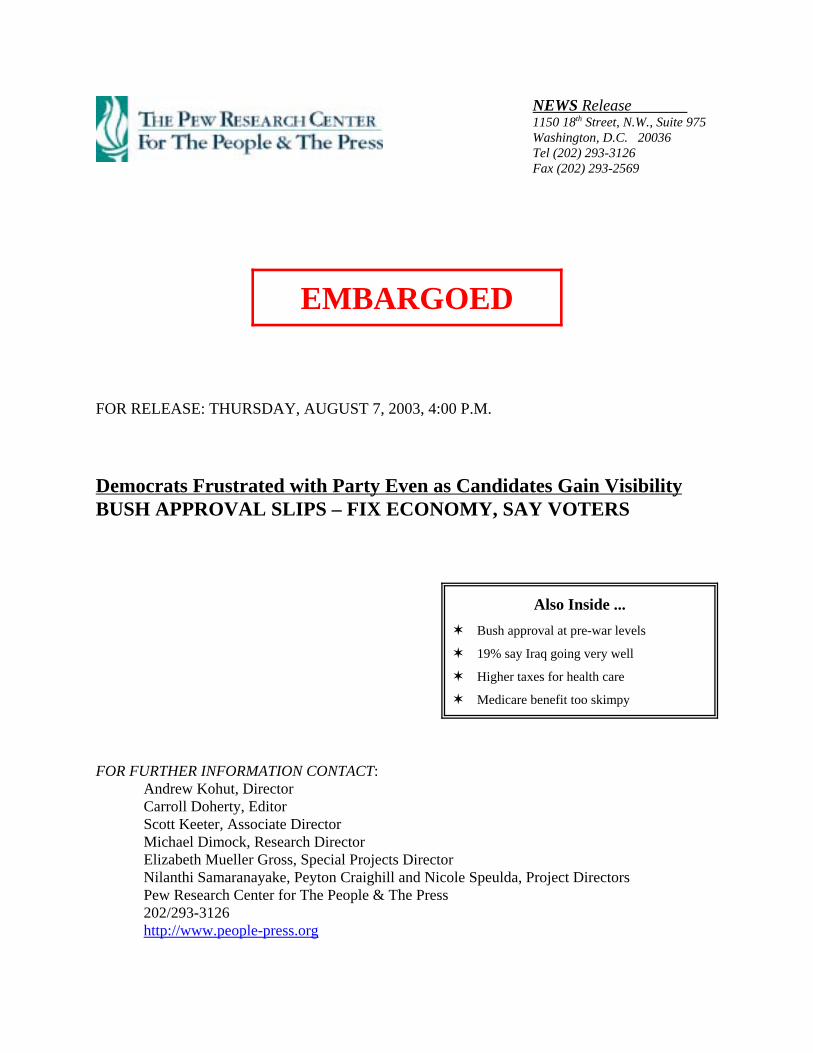
EMBARGOED
Also Inside ...w Bush approval at pre-war levels
w 19% say Iraq going very well
w Higher taxes for health care
w Medicare benefit too skimpy
NEWS Release 1150 18th Street, N.W., Suite 975Washington, D.C. 20036Tel (202) 293-3126Fax (202) 293-2569
FOR RELEASE: THURSDAY, AUGUST 7, 2003, 4:00 P.M.
Democrats Frustrated with Party Even as Candidates Gain VisibilityBUSH APPROVAL SLIPS – FIX ECONOMY, SAY VOTERS
FOR FURTHER INFORMATION CONTACT:Andrew Kohut, DirectorCarroll Doherty, EditorScott Keeter, Associate DirectorMichael Dimock, Research DirectorElizabeth Mueller Gross, Special Projects DirectorNilanthi Samaranayake, Peyton Craighill and Nicole Speulda, Project DirectorsPew Research Center for The People & The Press202/293-3126http://www.people-press.org
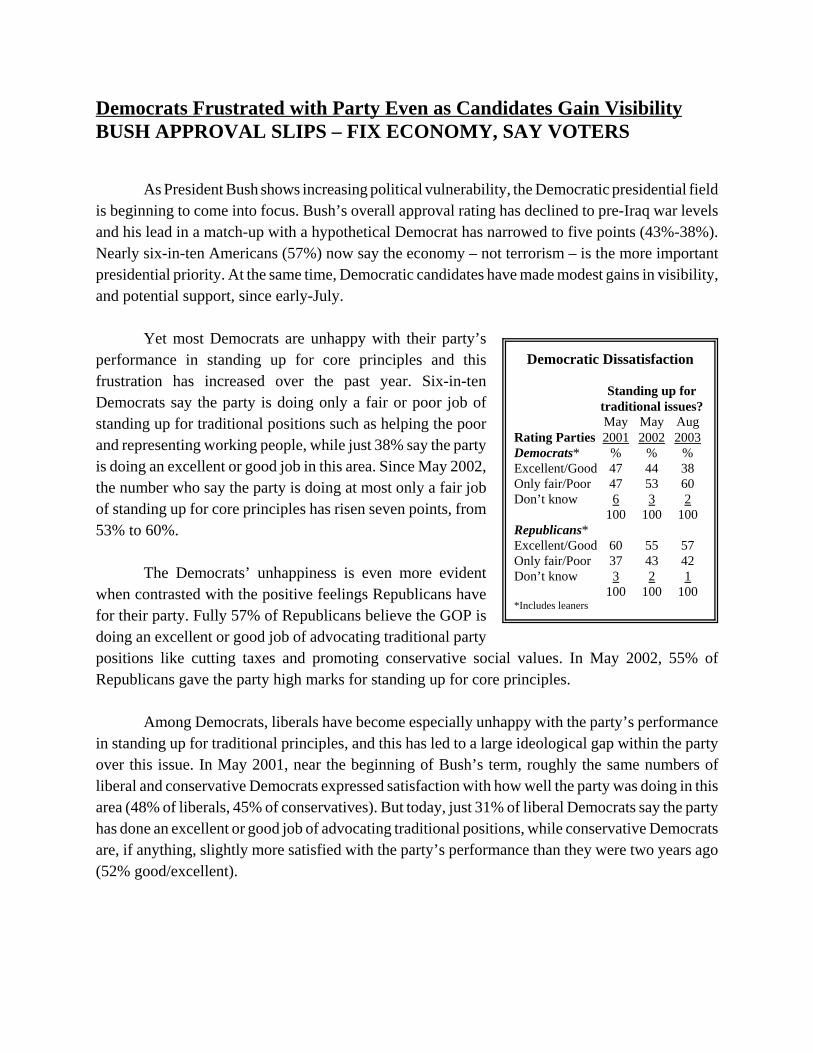
Democratic Dissatisfaction
Standing up fortraditional issues?May May Aug
Rating Parties 2001 2002 2003Democrats* % % %Excellent/Good 47 44 38Only fair/Poor 47 53 60Don’t know 6 3 2
100 100 100Republicans*Excellent/Good 60 55 57Only fair/Poor 37 43 42Don’t know 3 2 1
100 100 100*Includes leaners
Democrats Frustrated with Party Even as Candidates Gain VisibilityBUSH APPROVAL SLIPS – FIX ECONOMY, SAY VOTERS
As President Bush shows increasing political vulnerability, the Democratic presidential fieldis beginning to come into focus. Bush’s overall approval rating has declined to pre-Iraq war levelsand his lead in a match-up with a hypothetical Democrat has narrowed to five points (43%-38%).Nearly six-in-ten Americans (57%) now say the economy – not terrorism – is the more importantpresidential priority. At the same time, Democratic candidates have made modest gains in visibility,and potential support, since early-July.
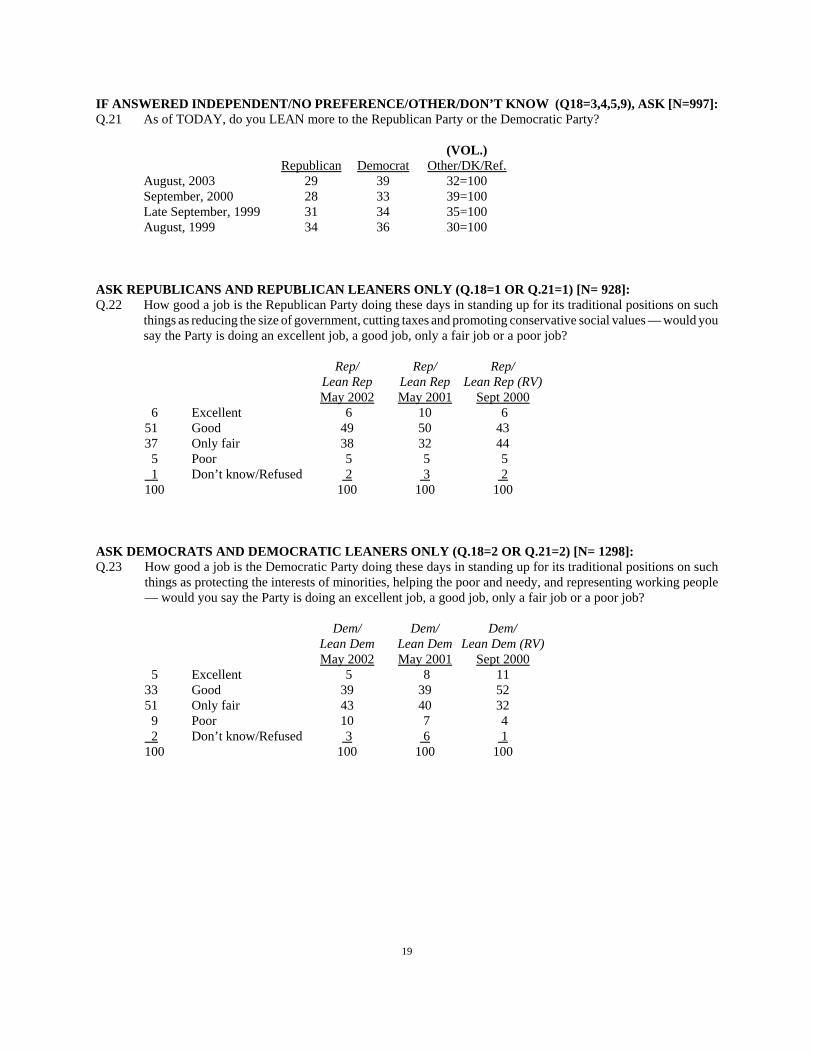
Yet most Democrats are unhappy with their party’sperformance in standing up for core principles and thisfrustration has increased over the past year. Six-in-tenDemocrats say the party is doing only a fair or poor job ofstanding up for traditional positions such as helping the poorand representing working people, while just 38% say the partyis doing an excellent or good job in this area. Since May 2002,the number who say the party is doing at most only a fair jobof standing up for core principles has risen seven points, from53% to 60%.
The Democrats’ unhappiness is even more evidentwhen contrasted with the positive feelings Republicans havefor their party. Fully 57% of Republicans believe the GOP isdoing an excellent or good job of advocating traditional partypositions like cutting taxes and promoting conservative social values. In May 2002, 55% ofRepublicans gave the party high marks for standing up for core principles.
Among Democrats, liberals have become especially unhappy with the party’s performancein standing up for traditional principles, and this has led to a large ideological gap within the partyover this issue. In May 2001, near the beginning of Bush’s term, roughly the same numbers ofliberal and conservative Democrats expressed satisfaction with how well the party was doing in thisarea (48% of liberals, 45% of conservatives). But today, just 31% of liberal Democrats say the partyhas done an excellent or good job of advocating traditional positions, while conservative Democratsare, if anything, slightly more satisfied with the party’s performance than they were two years ago(52% good/excellent).
2
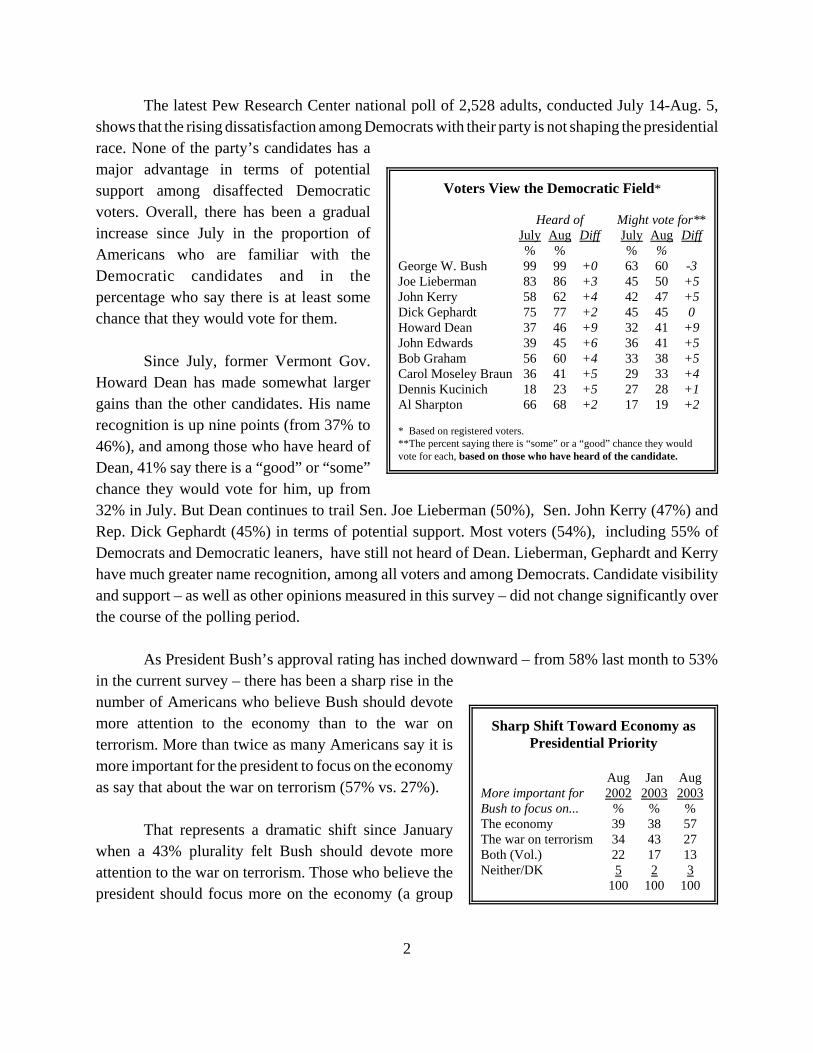
Voters View the Democratic Field*
Heard of Might vote for**July Aug Diff July Aug Diff% % % %
George W. Bush 99 99 +0 63 60 -3Joe Lieberman 83 86 +3 45 50 +5John Kerry 58 62 +4 42 47 +5Dick Gephardt 75 77 +2 45 45 0Howard Dean 37 46 +9 32 41 +9John Edwards 39 45 +6 36 41 +5Bob Graham 56 60 +4 33 38 +5Carol Moseley Braun 36 41 +5 29 33 +4Dennis Kucinich 18 23 +5 27 28 +1Al Sharpton 66 68 +2 17 19 +2
* Based on registered voters.**The percent saying there is “some” or a “good” chance they wouldvote for each, based on those who have heard of the candidate.
Sharp Shift Toward Economy asPresidential Priority
Aug Jan AugMore important for 2002 2003 2003Bush to focus on... % % %The economy 39 38 57The war on terrorism 34 43 27Both (Vol.) 22 17 13Neither/DK 5 2 3
100 100 100
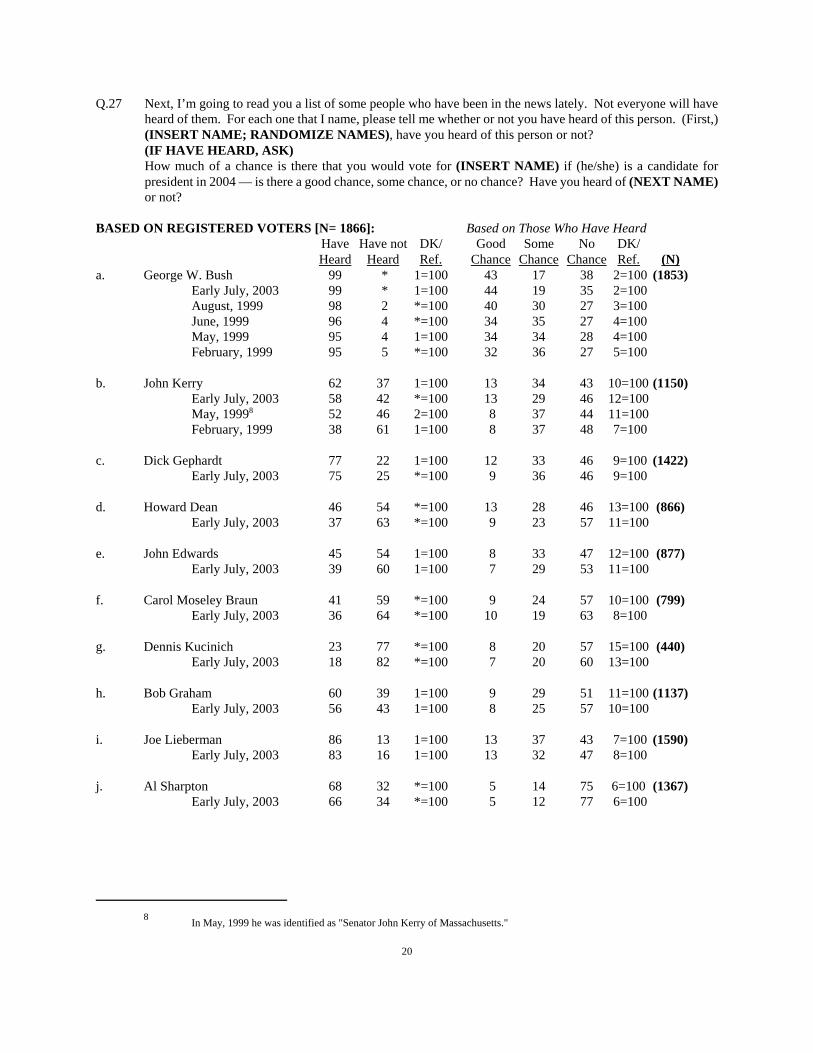
The latest Pew Research Center national poll of 2,528 adults, conducted July 14-Aug. 5,shows that the rising dissatisfaction among Democrats with their party is not shaping the presidentialrace. None of the party’s candidates has amajor advantage in terms of potentialsupport among disaffected Democraticvoters. Overall, there has been a gradualincrease since July in the proportion ofAmericans who are familiar with theDemocratic candidates and in thepercentage who say there is at least somechance that they would vote for them.
Since July, former Vermont Gov.Howard Dean has made somewhat largergains than the other candidates. His namerecognition is up nine points (from 37% to46%), and among those who have heard ofDean, 41% say there is a “good” or “some”chance they would vote for him, up from32% in July. But Dean continues to trail Sen. Joe Lieberman (50%), Sen. John Kerry (47%) andRep. Dick Gephardt (45%) in terms of potential support. Most voters (54%), including 55% ofDemocrats and Democratic leaners, have still not heard of Dean. Lieberman, Gephardt and Kerryhave much greater name recognition, among all voters and among Democrats. Candidate visibilityand support – as well as other opinions measured in this survey – did not change significantly overthe course of the polling period.
As President Bush’s approval rating has inched downward – from 58% last month to 53%in the current survey – there has been a sharp rise in thenumber of Americans who believe Bush should devotemore attention to the economy than to the war onterrorism. More than twice as many Americans say it ismore important for the president to focus on the economyas say that about the war on terrorism (57% vs. 27%).
That represents a dramatic shift since Januarywhen a 43% plurality felt Bush should devote moreattention to the war on terrorism. Those who believe thepresident should focus more on the economy (a group
3
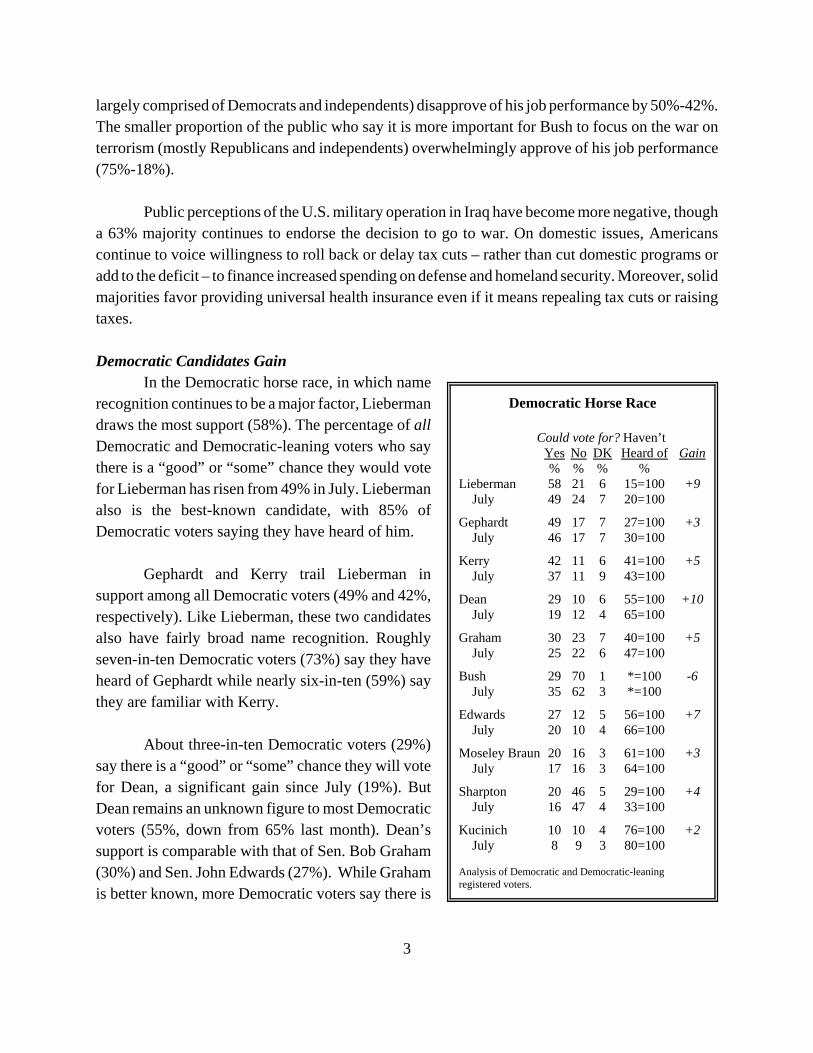
Democratic Horse Race
Could vote for? Haven’tYes No DK Heard of Gain% % % %
Lieberman 58 21 6 15=100 +9 July 49 24 7 20=100
Gephardt 49 17 7 27=100 +3 July 46 17 7 30=100
Kerry 42 11 6 41=100 +5 July 37 11 9 43=100
Dean 29 10 6 55=100 +10 July 19 12 4 65=100
Graham 30 23 7 40=100 +5 July 25 22 6 47=100
Bush 29 70 1 *=100 -6 July 35 62 3 *=100
Edwards 27 12 5 56=100 +7 July 20 10 4 66=100
Moseley Braun 20 16 3 61=100 +3 July 17 16 3 64=100
Sharpton 20 46 5 29=100 +4 July 16 47 4 33=100
Kucinich 10 10 4 76=100 +2 July 8 9 3 80=100
Analysis of Democratic and Democratic-leaningregistered voters.
largely comprised of Democrats and independents) disapprove of his job performance by 50%-42%.The smaller proportion of the public who say it is more important for Bush to focus on the war onterrorism (mostly Republicans and independents) overwhelmingly approve of his job performance(75%-18%).
Public perceptions of the U.S. military operation in Iraq have become more negative, thougha 63% majority continues to endorse the decision to go to war. On domestic issues, Americanscontinue to voice willingness to roll back or delay tax cuts – rather than cut domestic programs oradd to the deficit – to finance increased spending on defense and homeland security. Moreover, solidmajorities favor providing universal health insurance even if it means repealing tax cuts or raisingtaxes.
Democratic Candidates Gain In the Democratic horse race, in which name
recognition continues to be a major factor, Liebermandraws the most support (58%). The percentage of allDemocratic and Democratic-leaning voters who saythere is a “good” or “some” chance they would votefor Lieberman has risen from 49% in July. Liebermanalso is the best-known candidate, with 85% ofDemocratic voters saying they have heard of him.
Gephardt and Kerry trail Lieberman insupport among all Democratic voters (49% and 42%,respectively). Like Lieberman, these two candidatesalso have fairly broad name recognition. Roughlyseven-in-ten Democratic voters (73%) say they haveheard of Gephardt while nearly six-in-ten (59%) saythey are familiar with Kerry.
About three-in-ten Democratic voters (29%)say there is a “good” or “some” chance they will votefor Dean, a significant gain since July (19%). ButDean remains an unknown figure to most Democraticvoters (55%, down from 65% last month). Dean’ssupport is comparable with that of Sen. Bob Graham(30%) and Sen. John Edwards (27%). While Grahamis better known, more Democratic voters say there is
4
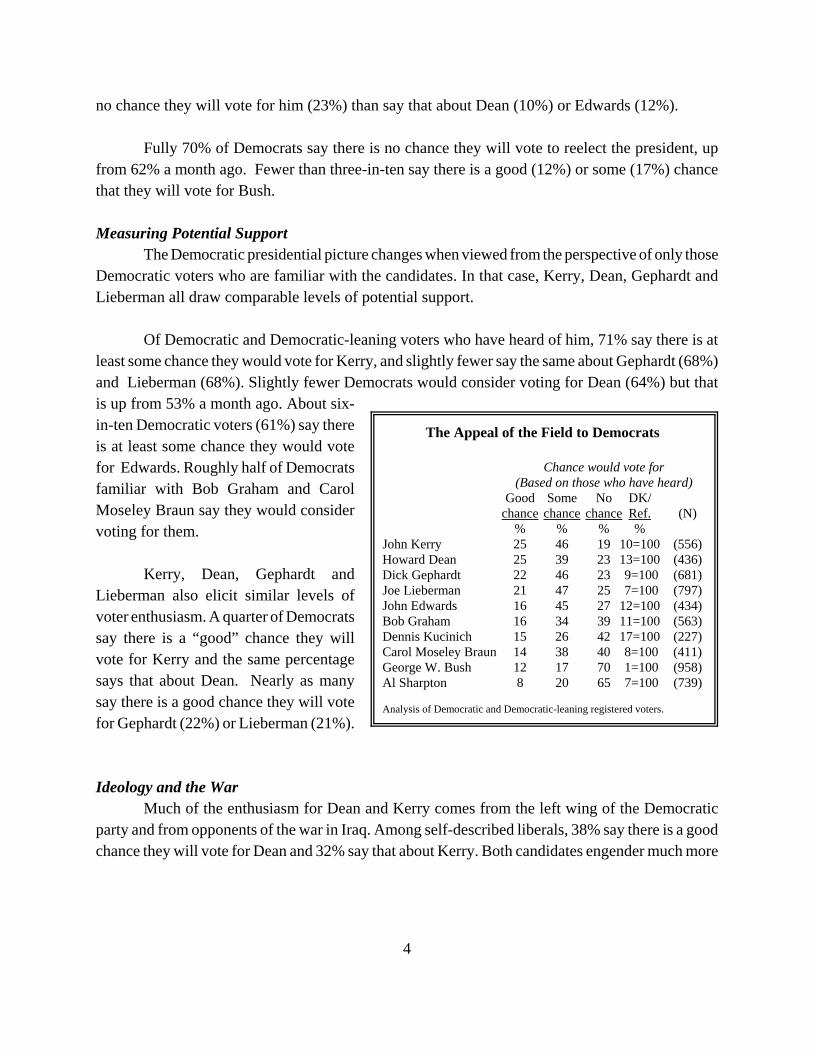
The Appeal of the Field to Democrats
Chance would vote for(Based on those who have heard)
Good Some No DK/chance chance chance Ref. (N)
% % % %John Kerry 25 46 19 10=100 (556)Howard Dean 25 39 23 13=100 (436)Dick Gephardt 22 46 23 9=100 (681)Joe Lieberman 21 47 25 7=100 (797)John Edwards 16 45 27 12=100 (434)Bob Graham 16 34 39 11=100 (563)Dennis Kucinich 15 26 42 17=100 (227)Carol Moseley Braun 14 38 40 8=100 (411)George W. Bush 12 17 70 1=100 (958)Al Sharpton 8 20 65 7=100 (739)
Analysis of Democratic and Democratic-leaning registered voters.
no chance they will vote for him (23%) than say that about Dean (10%) or Edwards (12%).
Fully 70% of Democrats say there is no chance they will vote to reelect the president, upfrom 62% a month ago. Fewer than three-in-ten say there is a good (12%) or some (17%) chancethat they will vote for Bush.
Measuring Potential Support The Democratic presidential picture changes when viewed from the perspective of only those
Democratic voters who are familiar with the candidates. In that case, Kerry, Dean, Gephardt andLieberman all draw comparable levels of potential support.
Of Democratic and Democratic-leaning voters who have heard of him, 71% say there is atleast some chance they would vote for Kerry, and slightly fewer say the same about Gephardt (68%)and Lieberman (68%). Slightly fewer Democrats would consider voting for Dean (64%) but thatis up from 53% a month ago. About six-in-ten Democratic voters (61%) say thereis at least some chance they would votefor Edwards. Roughly half of Democratsfamiliar with Bob Graham and CarolMoseley Braun say they would considervoting for them.
Kerry, Dean, Gephardt andLieberman also elicit similar levels ofvoter enthusiasm. A quarter of Democratssay there is a “good” chance they willvote for Kerry and the same percentagesays that about Dean. Nearly as manysay there is a good chance they will votefor Gephardt (22%) or Lieberman (21%).
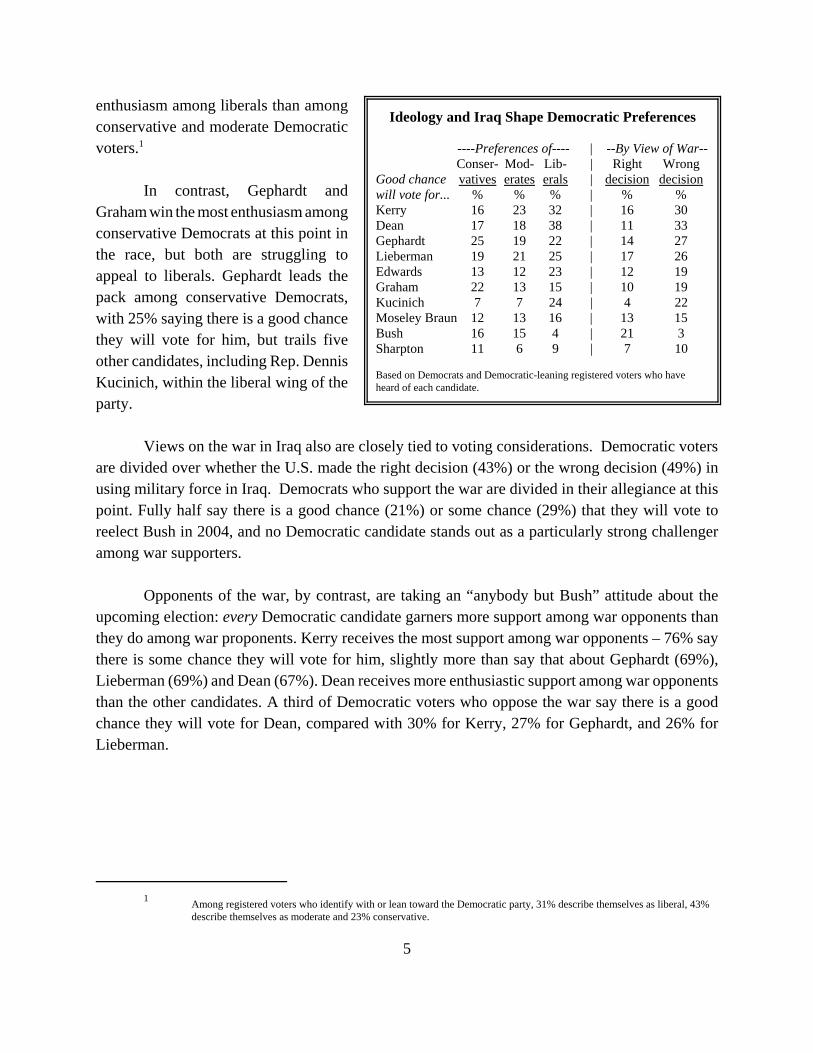
Ideology and the WarMuch of the enthusiasm for Dean and Kerry comes from the left wing of the Democratic
party and from opponents of the war in Iraq. Among self-described liberals, 38% say there is a goodchance they will vote for Dean and 32% say that about Kerry. Both candidates engender much more
1 Among registered voters who identify with or lean toward the Democratic party, 31% describe themselves as liberal, 43%describe themselves as moderate and 23% conservative.
5
Ideology and Iraq Shape Democratic Preferences
----Preferences of---- | --By View of War--Conser- Mod- Lib- | Right Wrong
Good chance vatives erates erals | decision decisionwill vote for... % % % | % %Kerry 16 23 32 | 16 30Dean 17 18 38 | 11 33Gephardt 25 19 22 | 14 27Lieberman 19 21 25 | 17 26Edwards 13 12 23 | 12 19Graham 22 13 15 | 10 19Kucinich 7 7 24 | 4 22Moseley Braun 12 13 16 | 13 15Bush 16 15 4 | 21 3Sharpton 11 6 9 | 7 10
Based on Democrats and Democratic-leaning registered voters who haveheard of each candidate.
enthusiasm among liberals than amongconservative and moderate Democraticvoters.1
In contrast, Gephardt andGraham win the most enthusiasm amongconservative Democrats at this point inthe race, but both are struggling toappeal to liberals. Gephardt leads thepack among conservative Democrats,with 25% saying there is a good chancethey will vote for him, but trails fiveother candidates, including Rep. DennisKucinich, within the liberal wing of theparty.
Views on the war in Iraq also are closely tied to voting considerations. Democratic votersare divided over whether the U.S. made the right decision (43%) or the wrong decision (49%) inusing military force in Iraq. Democrats who support the war are divided in their allegiance at thispoint. Fully half say there is a good chance (21%) or some chance (29%) that they will vote toreelect Bush in 2004, and no Democratic candidate stands out as a particularly strong challengeramong war supporters.
Opponents of the war, by contrast, are taking an “anybody but Bush” attitude about theupcoming election: every Democratic candidate garners more support among war opponents thanthey do among war proponents. Kerry receives the most support among war opponents – 76% saythere is some chance they will vote for him, slightly more than say that about Gephardt (69%),Lieberman (69%) and Dean (67%). Dean receives more enthusiastic support among war opponentsthan the other candidates. A third of Democratic voters who oppose the war say there is a goodchance they will vote for Dean, compared with 30% for Kerry, 27% for Gephardt, and 26% forLieberman.
6
African-AmericanDemocrats Divided
Preferences ofGood chance Whites Blackswill vote for... % %Kerry 25 17Dean 27 14Gephardt 23 15Lieberman 23 20Edwards 17 16Graham 15 19Kucinich 15 6Moseley Braun 10 25Bush 12 9Sharpton 4 18
Based on Democrats and Democratic-leaning registered voters who haveheard of each candidate.
No Clear Favorite AmongParty Critics
Rating the Party:Excellent/ Fair/
Good chance Good Poorwill vote for... % %Kerry 24 26Dean 22 26Gephardt 28 18Lieberman 28 18Edwards 20 14Graham 16 16Kucinich 15 15Moseley Braun 18 12Bush 14 10Sharpton 11 7
Based on Democrats and Democratic-leaning registered voters who have heardof each candidate.
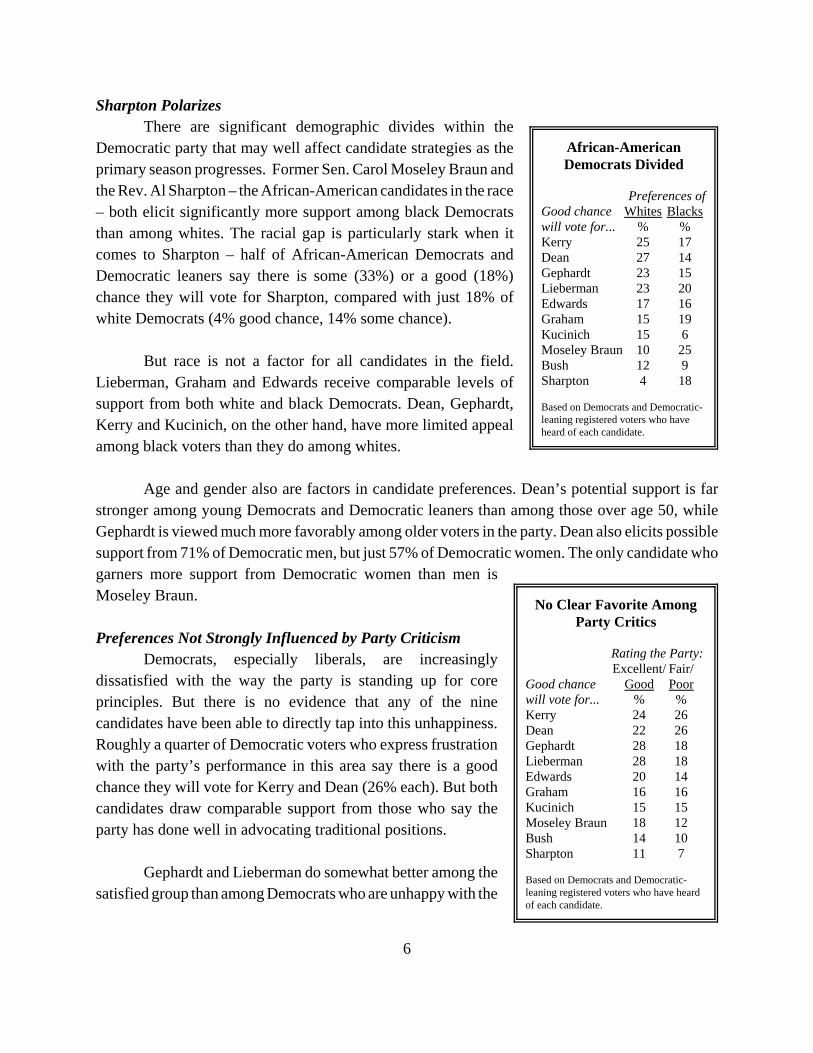
Sharpton PolarizesThere are significant demographic divides within the
Democratic party that may well affect candidate strategies as theprimary season progresses. Former Sen. Carol Moseley Braun andthe Rev. Al Sharpton – the African-American candidates in the race– both elicit significantly more support among black Democratsthan among whites. The racial gap is particularly stark when itcomes to Sharpton – half of African-American Democrats andDemocratic leaners say there is some (33%) or a good (18%)chance they will vote for Sharpton, compared with just 18% ofwhite Democrats (4% good chance, 14% some chance).
But race is not a factor for all candidates in the field.Lieberman, Graham and Edwards receive comparable levels ofsupport from both white and black Democrats. Dean, Gephardt,Kerry and Kucinich, on the other hand, have more limited appealamong black voters than they do among whites.
Age and gender also are factors in candidate preferences. Dean’s potential support is farstronger among young Democrats and Democratic leaners than among those over age 50, whileGephardt is viewed much more favorably among older voters in the party. Dean also elicits possiblesupport from 71% of Democratic men, but just 57% of Democratic women. The only candidate whogarners more support from Democratic women than men isMoseley Braun.
Preferences Not Strongly Influenced by Party CriticismDemocrats, especially liberals, are increasingly
dissatisfied with the way the party is standing up for coreprinciples. But there is no evidence that any of the ninecandidates have been able to directly tap into this unhappiness.Roughly a quarter of Democratic voters who express frustrationwith the party’s performance in this area say there is a goodchance they will vote for Kerry and Dean (26% each). But bothcandidates draw comparable support from those who say theparty has done well in advocating traditional positions.
Gephardt and Lieberman do somewhat better among thesatisfied group than among Democrats who are unhappy with the
7
40%
50%
60%
70%
80%
90%
July Sept Nov Jan Mar May July Sept Nov Jan
Presidential Job Approval
Bush Sr.Start ofGulf war
GW BushStart ofIraq war
Bush Rally Smaller, Shorter than Father’s
Source: 1990-1992 Gallup, 2002-2003 Pew Research Center
party’s advocacy of traditional positions. Roughly three-in-ten (28%) say there is a good chance theywill vote for each of the candidates compared with 18% of those who are dissatisfied with theparty’s performance in standing up for traditional positions.
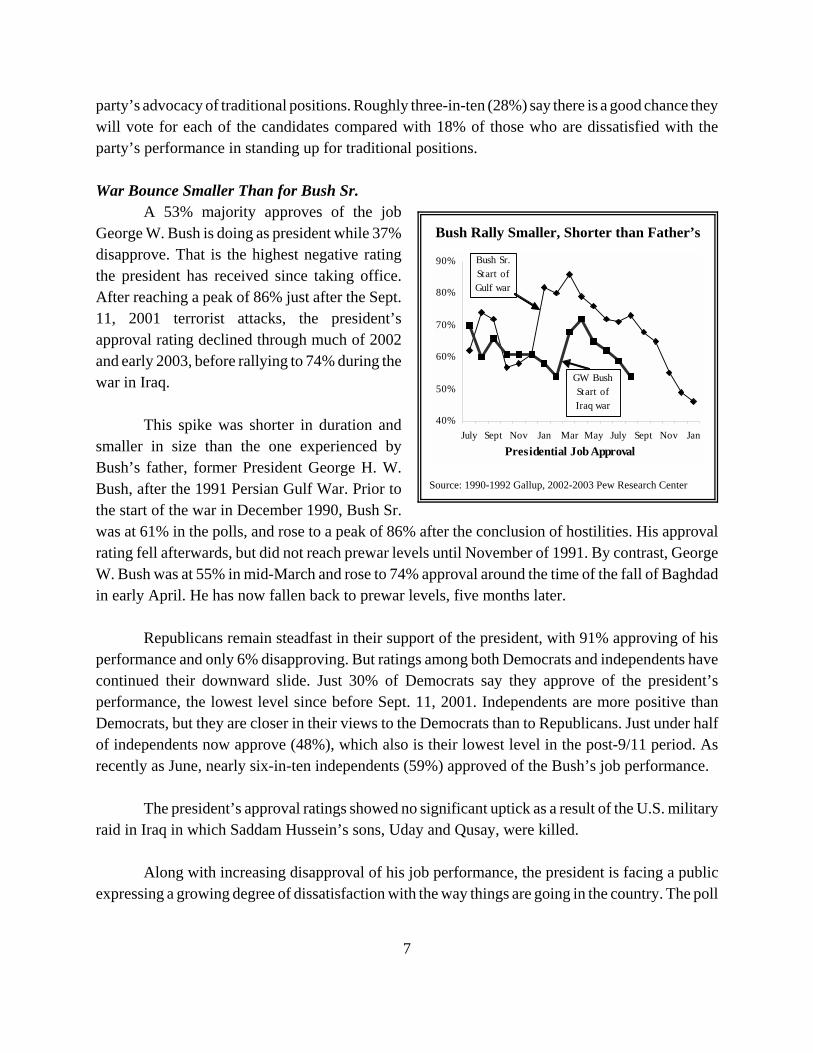
War Bounce Smaller Than for Bush Sr.A 53% majority approves of the job
George W. Bush is doing as president while 37%disapprove. That is the highest negative ratingthe president has received since taking office.After reaching a peak of 86% just after the Sept.11, 2001 terrorist attacks, the president’sapproval rating declined through much of 2002and early 2003, before rallying to 74% during thewar in Iraq.
This spike was shorter in duration andsmaller in size than the one experienced byBush’s father, former President George H. W.Bush, after the 1991 Persian Gulf War. Prior tothe start of the war in December 1990, Bush Sr.was at 61% in the polls, and rose to a peak of 86% after the conclusion of hostilities. His approvalrating fell afterwards, but did not reach prewar levels until November of 1991. By contrast, GeorgeW. Bush was at 55% in mid-March and rose to 74% approval around the time of the fall of Baghdadin early April. He has now fallen back to prewar levels, five months later.
Republicans remain steadfast in their support of the president, with 91% approving of hisperformance and only 6% disapproving. But ratings among both Democrats and independents havecontinued their downward slide. Just 30% of Democrats say they approve of the president’sperformance, the lowest level since before Sept. 11, 2001. Independents are more positive thanDemocrats, but they are closer in their views to the Democrats than to Republicans. Just under halfof independents now approve (48%), which also is their lowest level in the post-9/11 period. Asrecently as June, nearly six-in-ten independents (59%) approved of the Bush’s job performance.
The president’s approval ratings showed no significant uptick as a result of the U.S. militaryraid in Iraq in which Saddam Hussein’s sons, Uday and Qusay, were killed.
Along with increasing disapproval of his job performance, the president is facing a publicexpressing a growing degree of dissatisfaction with the way things are going in the country. The poll
8
finds 53% dissatisfied with the state of the nation, while 40% are satisfied. The 40% satisfactionessentially matches the low points in the national mood experienced just prior to Sept. 11, 2001 andagain in September 2002. There is a strong partisan tilt to these results; 64% of Republicans aresatisfied with the way things are going, compared with only 25% of Democrats.
More Want Greater Focus on EconomyThe survey also finds a dramatic increase in the percentage of the public who say that it is
more important for Bush to focus on the economy rather than on the war on terrorism. Growth inthe importance of the economy in the public’s mind has occurred across the political and economicspectrum.
More than two-thirds of blacks (69%) rate the economy a more important presidentialpriority than terrorism compared with 55% of whites. But concern among both groups grew bynearly 20 points since January. Similarly, more Republicans and Democrats say Bush should focusmore attention on the economy than did so in January, but large partisan differences persist.Republicans are divided on the question (43% say it is more important for the president to focus onthe economy, 40% say war on terrorism) while Democrats overwhelmingly say the economy shouldbe the focus (70% economy/ 18% war on terrorism). Opinion that the president should focus on theeconomy grew 28 points among young people (age 18-29); they are now the age group with thegreatest concern about the economy.
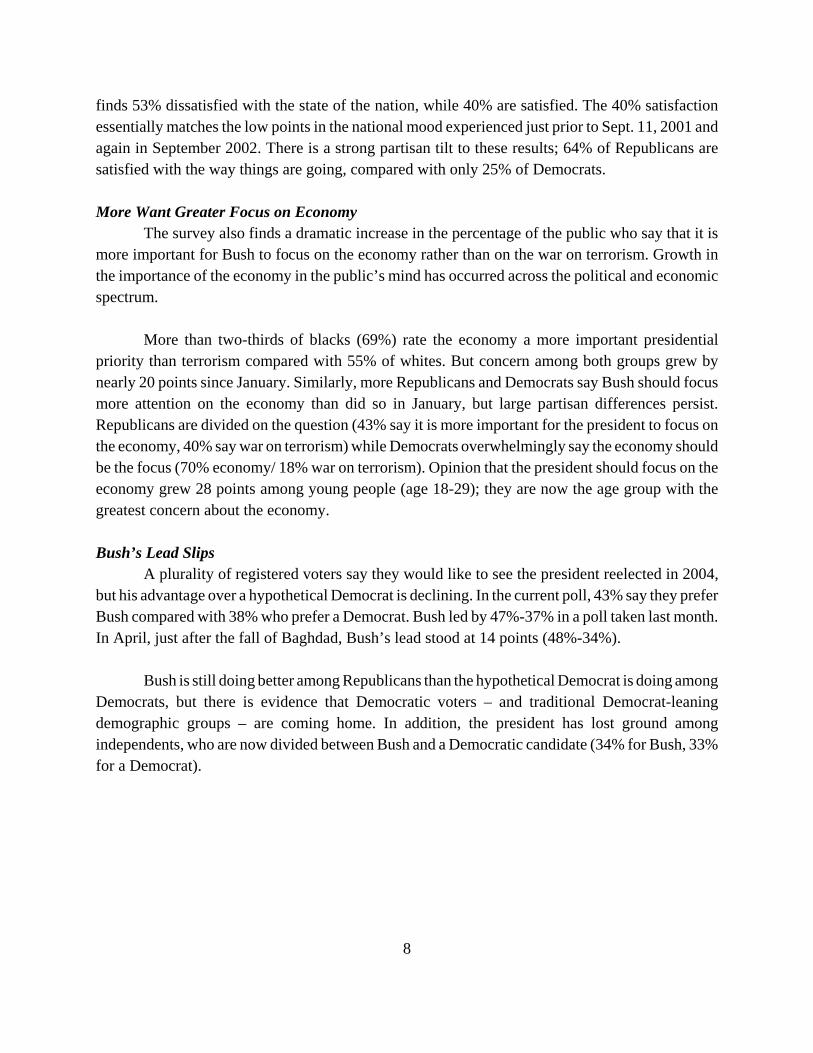
Bush’s Lead SlipsA plurality of registered voters say they would like to see the president reelected in 2004,
but his advantage over a hypothetical Democrat is declining. In the current poll, 43% say they preferBush compared with 38% who prefer a Democrat. Bush led by 47%-37% in a poll taken last month.In April, just after the fall of Baghdad, Bush’s lead stood at 14 points (48%-34%).
Bush is still doing better among Republicans than the hypothetical Democrat is doing amongDemocrats, but there is evidence that Democratic voters – and traditional Democrat-leaningdemographic groups – are coming home. In addition, the president has lost ground amongindependents, who are now divided between Bush and a Democratic candidate (34% for Bush, 33%for a Democrat).
9
Democratic GroupsReturning to Fold
----April---- ----August---- ChangeReelect Prefer Reelect Prefer in BushBush Dem. Bush Dem. Support
% % % %Total 48 34 43 38 -5
Men 48 35 49 32 +1 Under 50 46 39 50 32 +4 50 and older 49 31 48 32 -1Women 48 34 37 44 -11 Under 50 46 36 38 43 -8 50 and older 52 31 35 45 -17
18-29 39 50 37 48 -230-49 48 34 46 34 -250-64 54 27 43 40 -1165+ 46 37 38 39 -8
Republican 90 1 88 4 -2Democrat 13 71 9 78 -4Independent 42 33 34 33 -8
Conservative 67 18 66 22 -1Moderate 40 40 35 40 -5Liberal 22 65 10 73 -12
White 55 28 48 33 -7Nonwhite 11 67 17 65 +6
College grad 47 36 47 36 0Some college 47 36 44 37 -3H.S. or less 49 33 39 40 -10
$75k + 47 34 55 31 +8$50-75k 59 28 55 29 -4$30-50k 53 34 39 41 -14<$30k 40 40 28 49 -12
Large city 45 44 36 45 -9Suburb 48 32 43 37 -5Small town 49 32 42 37 -7Rural area 47 34 50 32 +3
Red states 48 35 50 31 +2Swing 50 33 42 38 -8Blue states 44 37 36 44 -8Based on registered voters.
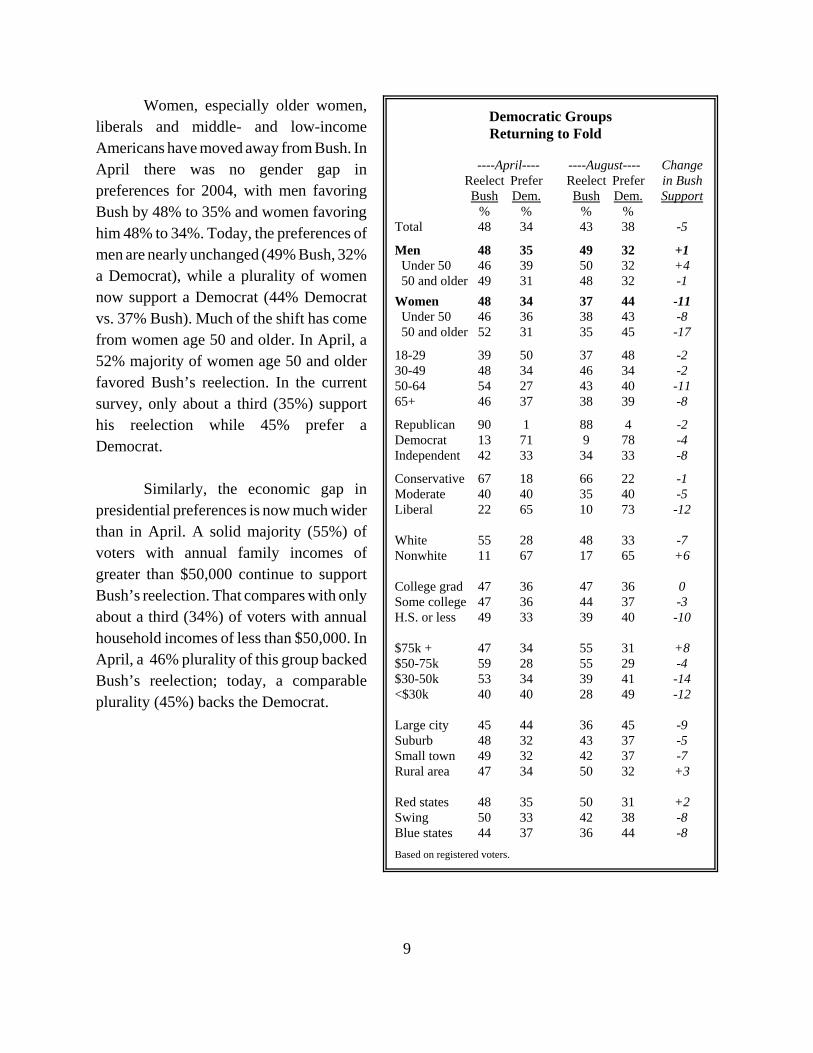
Women, especially older women,liberals and middle- and low-incomeAmericans have moved away from Bush. InApril there was no gender gap inpreferences for 2004, with men favoringBush by 48% to 35% and women favoringhim 48% to 34%. Today, the preferences ofmen are nearly unchanged (49% Bush, 32%a Democrat), while a plurality of womennow support a Democrat (44% Democratvs. 37% Bush). Much of the shift has comefrom women age 50 and older. In April, a52% majority of women age 50 and olderfavored Bush’s reelection. In the currentsurvey, only about a third (35%) supporthis reelection while 45% prefer aDemocrat.
Similarly, the economic gap inpresidential preferences is now much widerthan in April. A solid majority (55%) ofvoters with annual family incomes ofgreater than $50,000 continue to supportBush’s reelection. That compares with onlyabout a third (34%) of voters with annualhousehold incomes of less than $50,000. InApril, a 46% plurality of this group backedBush’s reelection; today, a comparableplurality (45%) backs the Democrat.
10
Concerns about Military Effort Grow
---War period— July AugustHow well is the Early Mid Late 2003 2003military effort going? % % % % %Very well 65 39 61 23 19Fairly well 25 46 32 52 43Not well 3 10 4 21 35Don’t know 7 5 3 4 3
100 100 100 100 100Was Iraq war theright decision?Yes 71 69 74 67 63No 22 25 19 24 30Don’t know 7 6 7 9 7
100 100 100 100 100
War in Iraq
Total Rep Dem IndLate April % % % %Right decision 74 93 59 73Wrong decision 19 4 31 22Don’t know 7 3 10 5
100 100 100 100
AugustRight decision 63 90 46 61Wrong decision 30 8 45 33Don’t know 7 2 9 6
100 100 100 100
Change -11 -3 -13 -12
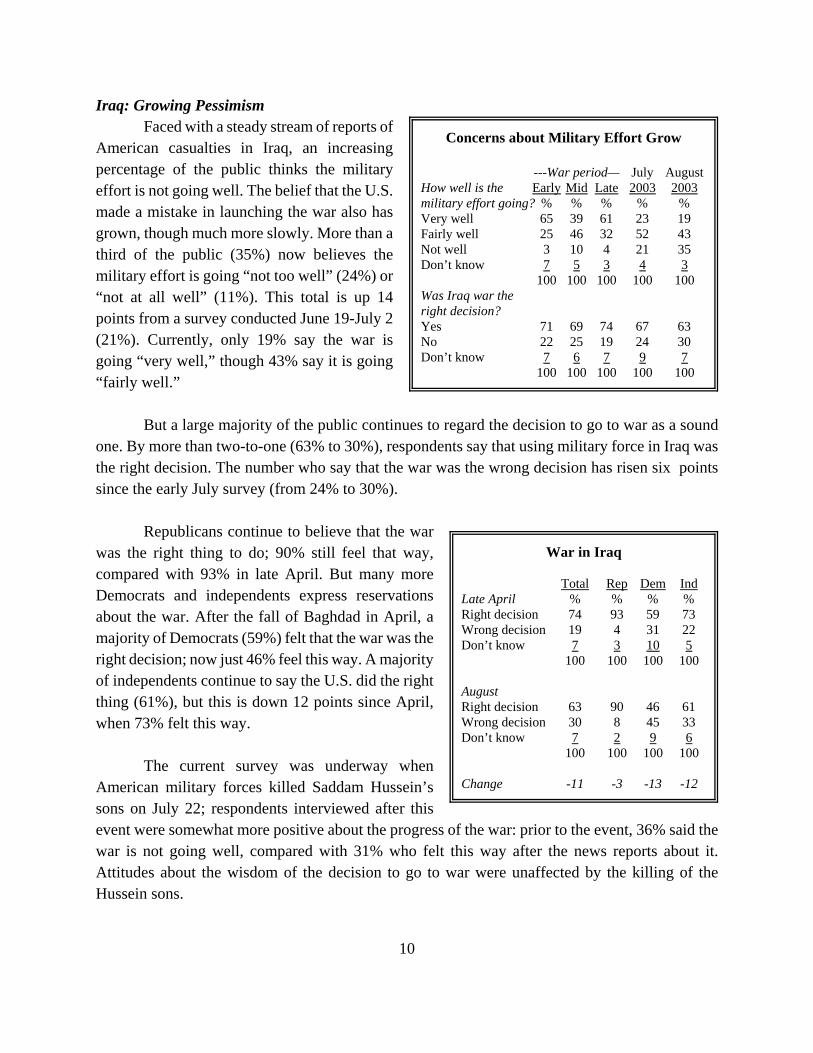
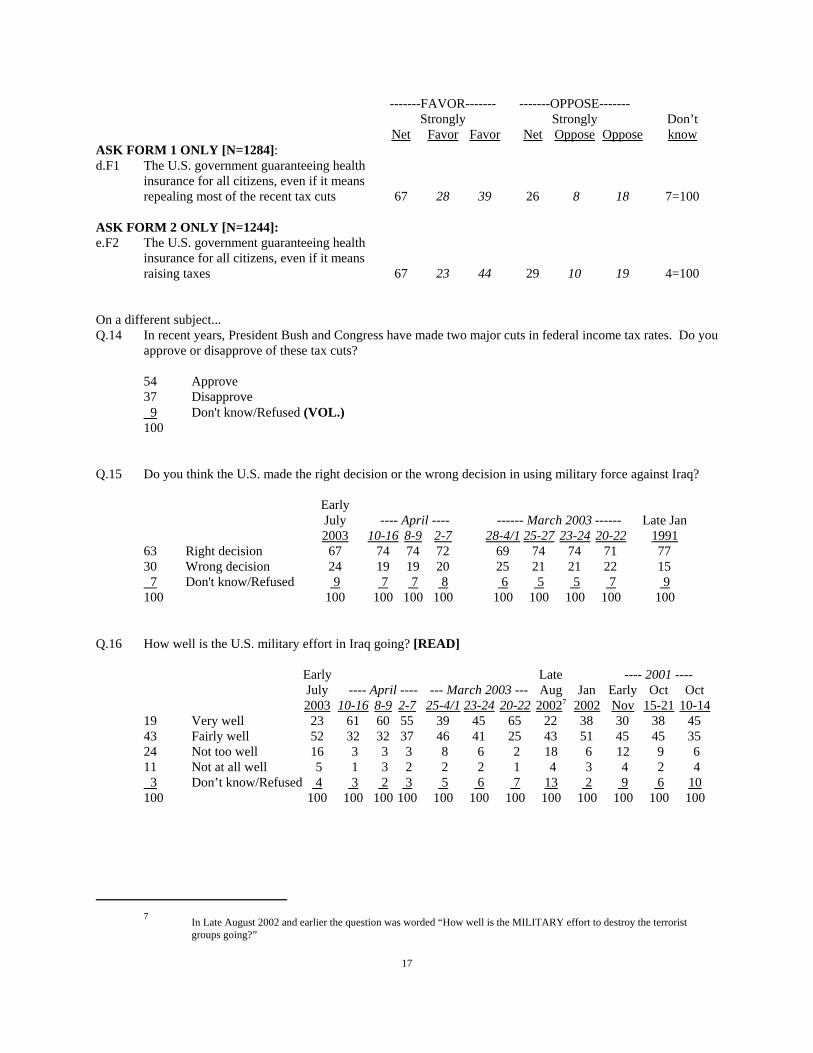
Iraq: Growing PessimismFaced with a steady stream of reports of
American casualties in Iraq, an increasingpercentage of the public thinks the militaryeffort is not going well. The belief that the U.S.made a mistake in launching the war also hasgrown, though much more slowly. More than athird of the public (35%) now believes themilitary effort is going “not too well” (24%) or“not at all well” (11%). This total is up 14points from a survey conducted June 19-July 2(21%). Currently, only 19% say the war isgoing “very well,” though 43% say it is going“fairly well.”
But a large majority of the public continues to regard the decision to go to war as a soundone. By more than two-to-one (63% to 30%), respondents say that using military force in Iraq wasthe right decision. The number who say that the war was the wrong decision has risen six pointssince the early July survey (from 24% to 30%).
Republicans continue to believe that the warwas the right thing to do; 90% still feel that way,compared with 93% in late April. But many moreDemocrats and independents express reservationsabout the war. After the fall of Baghdad in April, amajority of Democrats (59%) felt that the war was theright decision; now just 46% feel this way. A majorityof independents continue to say the U.S. did the rightthing (61%), but this is down 12 points since April,when 73% felt this way.
The current survey was underway whenAmerican military forces killed Saddam Hussein’ssons on July 22; respondents interviewed after thisevent were somewhat more positive about the progress of the war: prior to the event, 36% said thewar is not going well, compared with 31% who felt this way after the news reports about it.Attitudes about the wisdom of the decision to go to war were unaffected by the killing of theHussein sons.
11
How to Pay for Defense and Security Costs
Mod/ Cons/Cons Lib Mod Lib
Total Rep Rep Indep Dem Dem% % % % % %
Postpone tax cuts 41 28 39 43 44 63Cut domestic 23 42 27 21 18 12Add to deficit 15 13 19 14 22 13None 4 3 3 5 2 2Other/multiple 5 5 5 5 3 5Don’t know 12 9 7 12 11 5
100 100 100 100 100 100
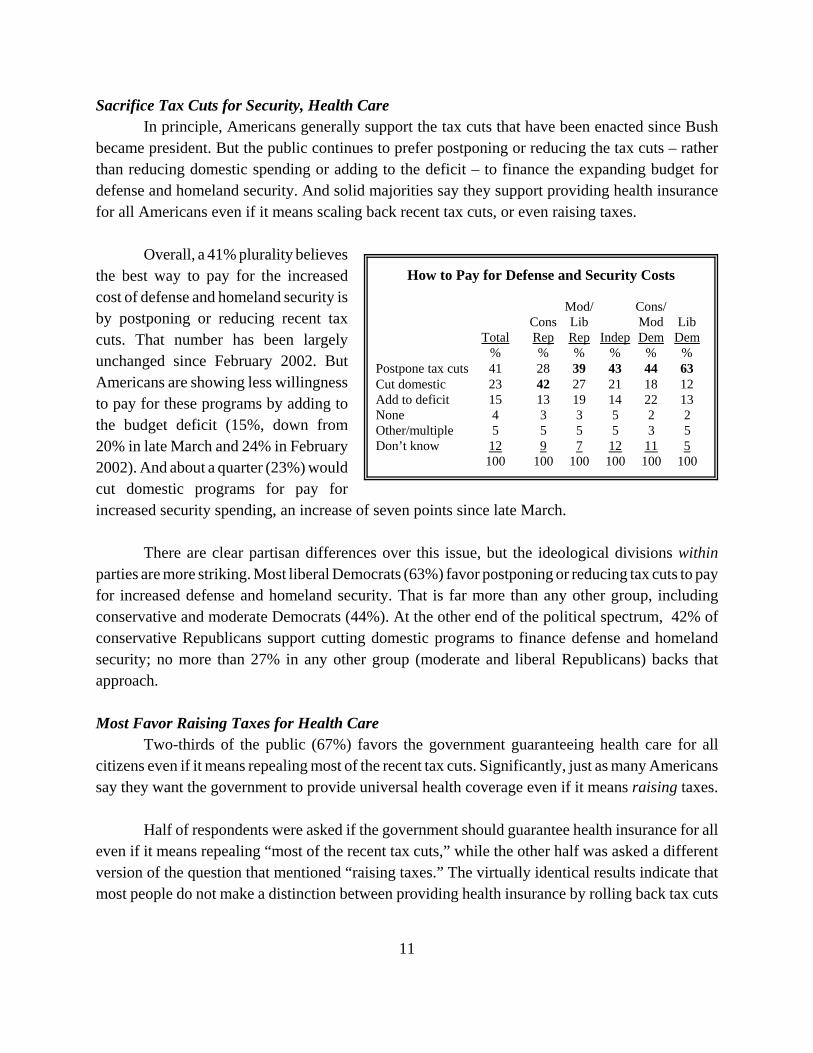
Sacrifice Tax Cuts for Security, Health Care In principle, Americans generally support the tax cuts that have been enacted since Bush
became president. But the public continues to prefer postponing or reducing the tax cuts – ratherthan reducing domestic spending or adding to the deficit – to finance the expanding budget fordefense and homeland security. And solid majorities say they support providing health insurancefor all Americans even if it means scaling back recent tax cuts, or even raising taxes.
Overall, a 41% plurality believesthe best way to pay for the increasedcost of defense and homeland security isby postponing or reducing recent taxcuts. That number has been largelyunchanged since February 2002. ButAmericans are showing less willingnessto pay for these programs by adding tothe budget deficit (15%, down from20% in late March and 24% in February2002). And about a quarter (23%) wouldcut domestic programs for pay forincreased security spending, an increase of seven points since late March.
There are clear partisan differences over this issue, but the ideological divisions withinparties are more striking. Most liberal Democrats (63%) favor postponing or reducing tax cuts to payfor increased defense and homeland security. That is far more than any other group, includingconservative and moderate Democrats (44%). At the other end of the political spectrum, 42% ofconservative Republicans support cutting domestic programs to finance defense and homelandsecurity; no more than 27% in any other group (moderate and liberal Republicans) backs thatapproach.
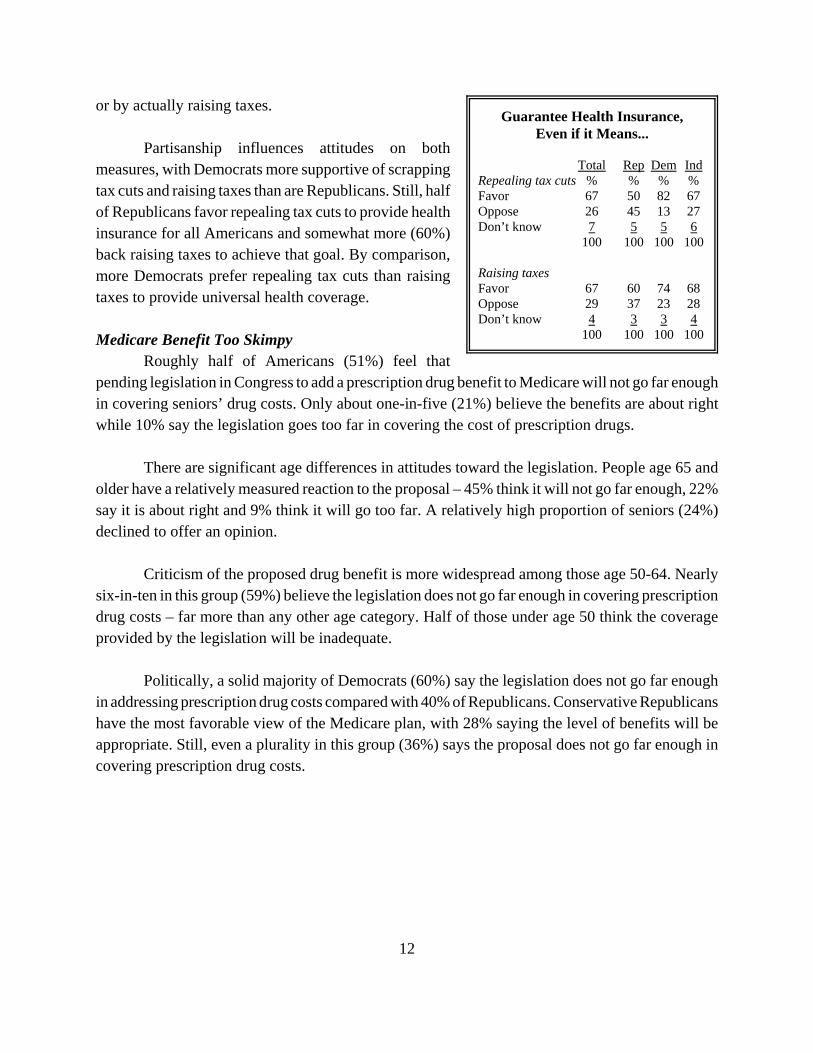
Most Favor Raising Taxes for Health CareTwo-thirds of the public (67%) favors the government guaranteeing health care for all
citizens even if it means repealing most of the recent tax cuts. Significantly, just as many Americanssay they want the government to provide universal health coverage even if it means raising taxes.
Half of respondents were asked if the government should guarantee health insurance for alleven if it means repealing “most of the recent tax cuts,” while the other half was asked a differentversion of the question that mentioned “raising taxes.” The virtually identical results indicate thatmost people do not make a distinction between providing health insurance by rolling back tax cuts
12
Guarantee Health Insurance,Even if it Means...
Total Rep Dem IndRepealing tax cuts % % % %Favor 67 50 82 67Oppose 26 45 13 27Don’t know 7 5 5 6
100 100 100 100
Raising taxesFavor 67 60 74 68Oppose 29 37 23 28Don’t know 4 3 3 4
100 100 100 100
or by actually raising taxes.
Partisanship influences attitudes on bothmeasures, with Democrats more supportive of scrappingtax cuts and raising taxes than are Republicans. Still, halfof Republicans favor repealing tax cuts to provide healthinsurance for all Americans and somewhat more (60%)back raising taxes to achieve that goal. By comparison,more Democrats prefer repealing tax cuts than raisingtaxes to provide universal health coverage.
Medicare Benefit Too SkimpyRoughly half of Americans (51%) feel that
pending legislation in Congress to add a prescription drug benefit to Medicare will not go far enoughin covering seniors’ drug costs. Only about one-in-five (21%) believe the benefits are about rightwhile 10% say the legislation goes too far in covering the cost of prescription drugs.
There are significant age differences in attitudes toward the legislation. People age 65 andolder have a relatively measured reaction to the proposal – 45% think it will not go far enough, 22%say it is about right and 9% think it will go too far. A relatively high proportion of seniors (24%)declined to offer an opinion.
Criticism of the proposed drug benefit is more widespread among those age 50-64. Nearlysix-in-ten in this group (59%) believe the legislation does not go far enough in covering prescriptiondrug costs – far more than any other age category. Half of those under age 50 think the coverageprovided by the legislation will be inadequate.
Politically, a solid majority of Democrats (60%) say the legislation does not go far enoughin addressing prescription drug costs compared with 40% of Republicans. Conservative Republicanshave the most favorable view of the Medicare plan, with 28% saying the level of benefits will beappropriate. Still, even a plurality in this group (36%) says the proposal does not go far enough incovering prescription drug costs.
13
ABOUT THIS SURVEY
Results for the survey are based on telephone interviews conducted under the direction of Princeton Survey ResearchAssociates among a nationwide sample of 2,528 adults, 18 years of age or older, during the period July 14 - August 5, 2003.Based on the total sample, one can say with 95% confidence that the error attributable to sampling and other random effectsis plus or minus 2 percentage points. For results based on either Form 1 (N=1,284) or Form 2 (N=1,244), the sampling erroris plus or minus 3.5 percentage points. For results based on registered voters (N=1,866) the sampling error is plus or minus2.5 percentage points.
Respondents who indicated they would prefer to complete the interview in Spanish, plus Spanish-speakinghouseholds in which no eligible English-speaking adult was available, were contacted by a Spanish-speaking interviewer.A total of 56 interviews were conducted in Spanish.
In addition to sampling error, one should bear in mind that question wording and practical difficulties in conductingsurveys can introduce error or bias into the findings of opinion polls.
SURVEY METHODOLOGY IN DETAIL
The sample for this survey is a random digit sample of telephone numbers selected from telephone exchanges in thecontinental United States. The random digit aspect of the sample is used to avoid "listing" bias and provides representationof both listed and unlisted numbers (including not-yet-listed). The design of the sample ensures this representation by randomgeneration of the last two digits of telephone numbers selected on the basis of their area code, telephone exchange, and banknumber.
The telephone exchanges were selected with probabilities proportional to their size. The first eight digits of thesampled telephone numbers (area code, telephone exchange, bank number) were selected to be proportionally stratified bycounty and by telephone exchange within county. That is, the number of telephone numbers randomly sampled from withina given county is proportional to that county's share of telephone numbers in the U.S. Only working banks of telephonenumbers are selected. A working bank is defined as 100 contiguous telephone numbers containing one or more residentiallistings.
The sample was released for interviewing in replicates. Using replicates to control the release of sample to the fieldensures that the complete call procedures are followed for the entire sample. The use of replicates also insures that theregional distribution of numbers called is appropriate. Again, this works to increase the representativeness of the sample.
At least 10 attempts were made to complete an interview at every sampled telephone number. The calls werestaggered over times of day and days of the week to maximize the chances of making a contact with a potential respondent.All interview breakoffs and refusals were re-contacted at least once in order to attempt to convert them to completedinterviews. In each contacted household, interviewers asked to speak with the "youngest male 18 or older who is at home."If there is no eligible man at home, interviewers asked to speak with "the oldest woman 18 or older who is at home." Thissystematic respondent selection technique has been shown empirically to produce samples that closely mirror the populationin terms of age and gender.
Non-response in telephone interview surveys produces some known biases in survey-derived estimates becauseparticipation tends to vary for different subgroups of the population, and these subgroups are likely to vary also on questionsof substantive interest. In order to compensate for these known biases, the sample data are weighted in analysis.
The demographic weighting parameters are derived from a special analysis of the most recently available CensusBureau's Current Population Survey (March 2002). This analysis produced population parameters for the demographiccharacteristics of households with adults 18 or older, which are then compared with the sample characteristics to constructsample weights. The analysis only included households in the continental United States that contain a telephone. The weightsare derived using an iterative technique that simultaneously balances the distributions of all weighting parameters.
PEW RESEARCH CENTER FOR THE PEOPLE & THE PRESS
14
2003 VALUES UPDATE SURVEY— FINAL TOPLINE —July 14 - August 5, 2003
N=2,528
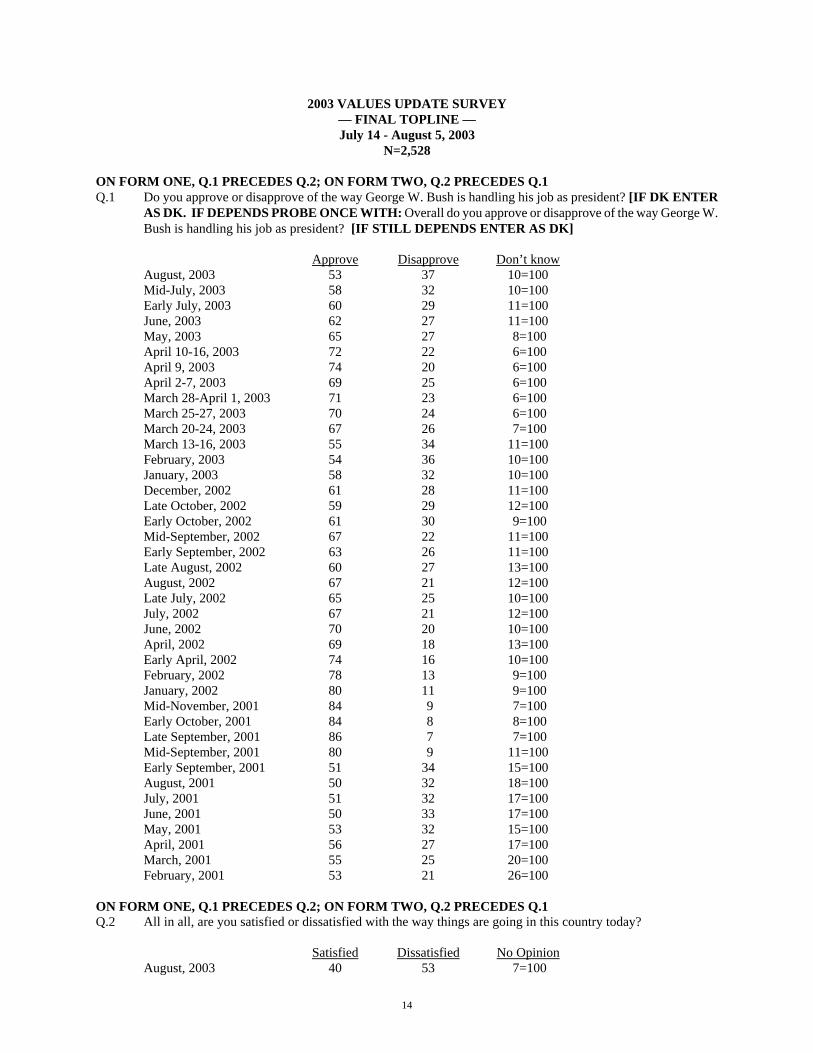
ON FORM ONE, Q.1 PRECEDES Q.2; ON FORM TWO, Q.2 PRECEDES Q.1Q.1 Do you approve or disapprove of the way George W. Bush is handling his job as president? [IF DK ENTER
AS DK. IF DEPENDS PROBE ONCE WITH: Overall do you approve or disapprove of the way George W.Bush is handling his job as president? [IF STILL DEPENDS ENTER AS DK]
Approve Disapprove Don’t knowAugust, 2003 53 37 10=100Mid-July, 2003 58 32 10=100Early July, 2003 60 29 11=100June, 2003 62 27 11=100May, 2003 65 27 8=100April 10-16, 2003 72 22 6=100April 9, 2003 74 20 6=100April 2-7, 2003 69 25 6=100March 28-April 1, 2003 71 23 6=100March 25-27, 2003 70 24 6=100March 20-24, 2003 67 26 7=100March 13-16, 2003 55 34 11=100February, 2003 54 36 10=100January, 2003 58 32 10=100December, 2002 61 28 11=100Late October, 2002 59 29 12=100Early October, 2002 61 30 9=100Mid-September, 2002 67 22 11=100Early September, 2002 63 26 11=100Late August, 2002 60 27 13=100August, 2002 67 21 12=100Late July, 2002 65 25 10=100July, 2002 67 21 12=100June, 2002 70 20 10=100April, 2002 69 18 13=100Early April, 2002 74 16 10=100February, 2002 78 13 9=100January, 2002 80 11 9=100Mid-November, 2001 84 9 7=100Early October, 2001 84 8 8=100Late September, 2001 86 7 7=100Mid-September, 2001 80 9 11=100Early September, 2001 51 34 15=100August, 2001 50 32 18=100July, 2001 51 32 17=100June, 2001 50 33 17=100May, 2001 53 32 15=100April, 2001 56 27 17=100March, 2001 55 25 20=100February, 2001 53 21 26=100
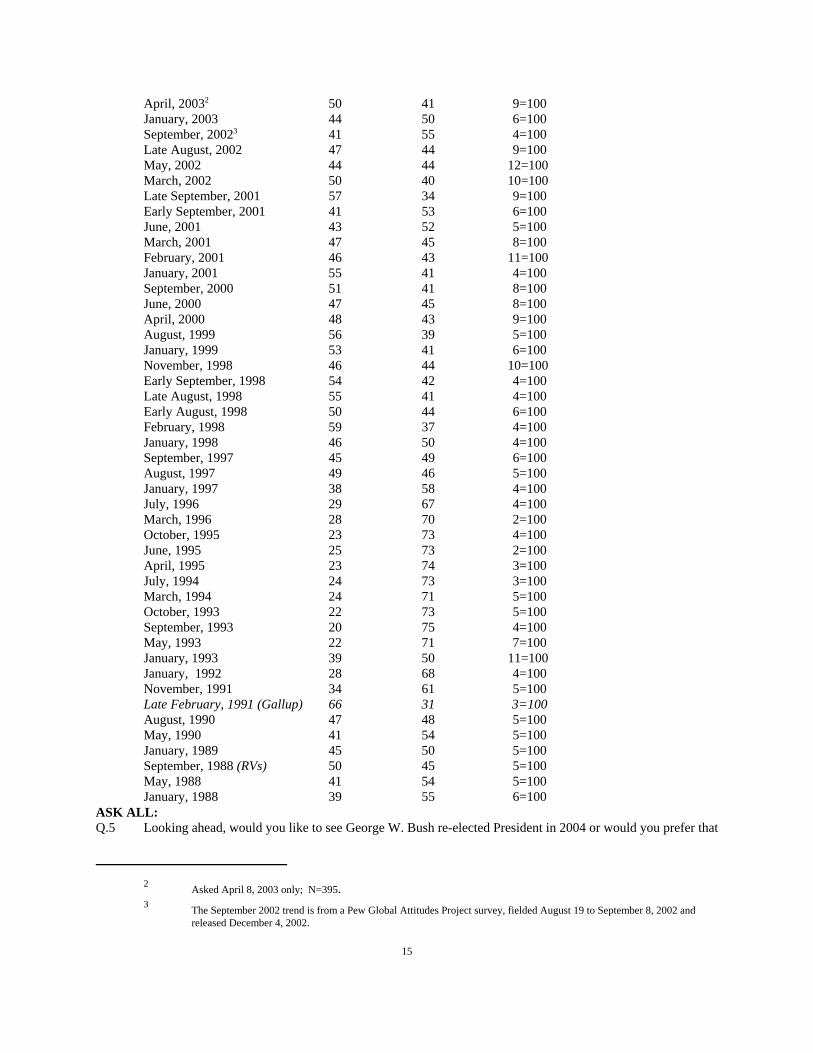
ON FORM ONE, Q.1 PRECEDES Q.2; ON FORM TWO, Q.2 PRECEDES Q.1Q.2 All in all, are you satisfied or dissatisfied with the way things are going in this country today?
Satisfied Dissatisfied No OpinionAugust, 2003 40 53 7=100
2 Asked April 8, 2003 only; N=395.3 The September 2002 trend is from a Pew Global Attitudes Project survey, fielded August 19 to September 8, 2002 and
released December 4, 2002.
15
April, 20032 50 41 9=100January, 2003 44 50 6=100September, 20023 41 55 4=100Late August, 2002 47 44 9=100May, 2002 44 44 12=100March, 2002 50 40 10=100Late September, 2001 57 34 9=100Early September, 2001 41 53 6=100June, 2001 43 52 5=100March, 2001 47 45 8=100February, 2001 46 43 11=100January, 2001 55 41 4=100September, 2000 51 41 8=100June, 2000 47 45 8=100April, 2000 48 43 9=100August, 1999 56 39 5=100January, 1999 53 41 6=100November, 1998 46 44 10=100Early September, 1998 54 42 4=100Late August, 1998 55 41 4=100Early August, 1998 50 44 6=100February, 1998 59 37 4=100January, 1998 46 50 4=100September, 1997 45 49 6=100August, 1997 49 46 5=100January, 1997 38 58 4=100July, 1996 29 67 4=100March, 1996 28 70 2=100October, 1995 23 73 4=100June, 1995 25 73 2=100April, 1995 23 74 3=100July, 1994 24 73 3=100March, 1994 24 71 5=100October, 1993 22 73 5=100September, 1993 20 75 4=100May, 1993 22 71 7=100January, 1993 39 50 11=100January, 1992 28 68 4=100November, 1991 34 61 5=100Late February, 1991 (Gallup) 66 31 3=100August, 1990 47 48 5=100May, 1990 41 54 5=100January, 1989 45 50 5=100September, 1988 (RVs) 50 45 5=100May, 1988 41 54 5=100January, 1988 39 55 6=100
ASK ALL:Q.5 Looking ahead, would you like to see George W. Bush re-elected President in 2004 or would you prefer that
4 The March 2003 trends are from Gallup and were worded: “If George W. Bush runs for re-election in 2004, in general areyou more likely to vote for Bush or for the Democratic Party’s candidate for president?”
5 In Late March 2003 the question was worded: “Which one of the following do you think is the BEST way to pay for thecost of the war in Iraq?”
6 In February 2003 and 2002 the question was worded: “As you may know, President Bush has proposed large increases inthe budget for military defense and homeland security. Which one of the following do you think is the BEST way to payfor these increases, if they are to happen?”
16
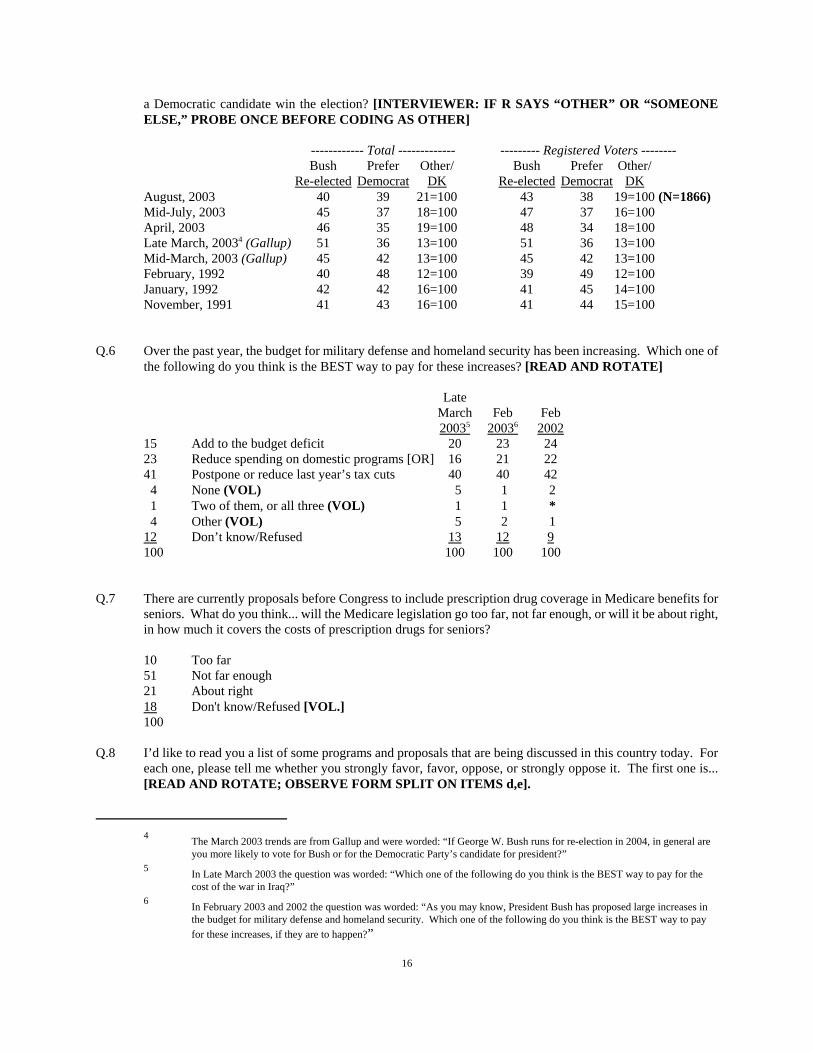
a Democratic candidate win the election? [INTERVIEWER: IF R SAYS “OTHER” OR “SOMEONEELSE,” PROBE ONCE BEFORE CODING AS OTHER]
------------ Total ------------- --------- Registered Voters --------Bush Prefer Other/ Bush Prefer Other/
Re-elected Democrat DK Re-elected Democrat DKAugust, 2003 40 39 21=100 43 38 19=100 (N=1866)Mid-July, 2003 45 37 18=100 47 37 16=100April, 2003 46 35 19=100 48 34 18=100Late March, 20034 (Gallup) 51 36 13=100 51 36 13=100Mid-March, 2003 (Gallup) 45 42 13=100 45 42 13=100February, 1992 40 48 12=100 39 49 12=100January, 1992 42 42 16=100 41 45 14=100November, 1991 41 43 16=100 41 44 15=100
Q.6 Over the past year, the budget for military defense and homeland security has been increasing. Which one ofthe following do you think is the BEST way to pay for these increases? [READ AND ROTATE]
LateMarch Feb Feb20035 20036 2002
15 Add to the budget deficit 20 23 2423 Reduce spending on domestic programs [OR] 16 21 2241 Postpone or reduce last year’s tax cuts 40 40 42 4 None (VOL) 5 1 2 1 Two of them, or all three (VOL) 1 1 * 4 Other (VOL) 5 2 112 Don’t know/Refused 13 12 9100 100 100 100
Q.7 There are currently proposals before Congress to include prescription drug coverage in Medicare benefits forseniors. What do you think... will the Medicare legislation go too far, not far enough, or will it be about right,in how much it covers the costs of prescription drugs for seniors?
10 Too far51 Not far enough21 About right18 Don't know/Refused [VOL.]100
Q.8 I’d like to read you a list of some programs and proposals that are being discussed in this country today. Foreach one, please tell me whether you strongly favor, favor, oppose, or strongly oppose it. The first one is...[READ AND ROTATE; OBSERVE FORM SPLIT ON ITEMS d,e].
7 In Late August 2002 and earlier the question was worded “How well is the MILITARY effort to destroy the terroristgroups going?”
17
-------FAVOR------- -------OPPOSE-------Strongly Strongly Don’t
Net Favor Favor Net Oppose Oppose knowASK FORM 1 ONLY [N=1284]:d.F1 The U.S. government guaranteeing health
insurance for all citizens, even if it meansrepealing most of the recent tax cuts 67 28 39 26 8 18 7=100
ASK FORM 2 ONLY [N=1244]:e.F2 The U.S. government guaranteeing health
insurance for all citizens, even if it meansraising taxes 67 23 44 29 10 19 4=100
On a different subject...Q.14 In recent years, President Bush and Congress have made two major cuts in federal income tax rates. Do you
approve or disapprove of these tax cuts?
54 Approve37 Disapprove 9 Don't know/Refused (VOL.)100
Q.15 Do you think the U.S. made the right decision or the wrong decision in using military force against Iraq?
EarlyJuly ---- April ---- ------ March 2003 ------ Late Jan2003 10-16 8-9 2-7 28-4/1 25-27 23-24 20-22 1991
63 Right decision 67 74 74 72 69 74 74 71 7730 Wrong decision 24 19 19 20 25 21 21 22 15 7 Don't know/Refused 9 7 7 8 6 5 5 7 9100 100 100 100 100 100 100 100 100 100
Q.16 How well is the U.S. military effort in Iraq going? [READ]
Early Late ---- 2001 ----July ---- April ---- --- March 2003 --- Aug Jan Early Oct Oct2003 10-16 8-9 2-7 25-4/1 23-24 20-22 20027 2002 Nov 15-21 10-14
19 Very well 23 61 60 55 39 45 65 22 38 30 38 4543 Fairly well 52 32 32 37 46 41 25 43 51 45 45 3524 Not too well 16 3 3 3 8 6 2 18 6 12 9 611 Not at all well 5 1 3 2 2 2 1 4 3 4 2 4 3 Don’t know/Refused 4 3 2 3 5 6 7 13 2 9 6 10100 100 100 100 100 100 100 100 100 100 100 100 100
18
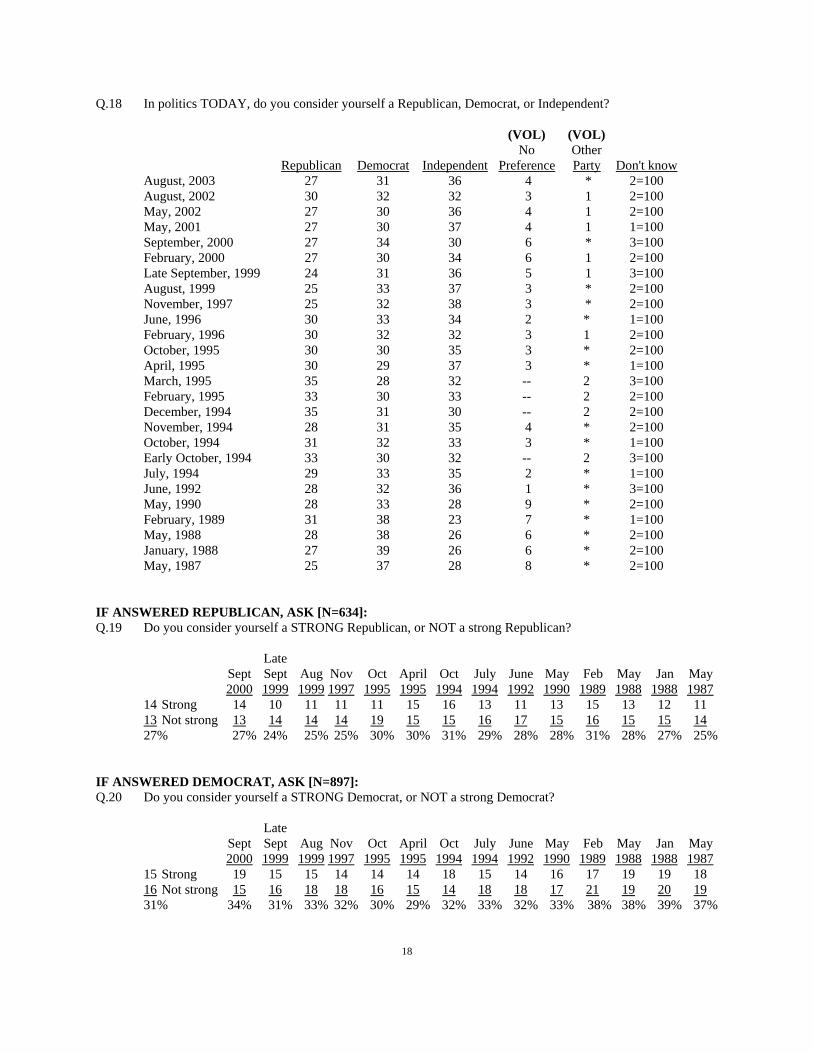
Q.18 In politics TODAY, do you consider yourself a Republican, Democrat, or Independent?
(VOL) (VOL)No Other
Republican Democrat Independent Preference Party Don't knowAugust, 2003 27 31 36 4 * 2=100August, 2002 30 32 32 3 1 2=100May, 2002 27 30 36 4 1 2=100May, 2001 27 30 37 4 1 1=100September, 2000 27 34 30 6 * 3=100February, 2000 27 30 34 6 1 2=100Late September, 1999 24 31 36 5 1 3=100August, 1999 25 33 37 3 * 2=100November, 1997 25 32 38 3 * 2=100June, 1996 30 33 34 2 * 1=100February, 1996 30 32 32 3 1 2=100October, 1995 30 30 35 3 * 2=100April, 1995 30 29 37 3 * 1=100March, 1995 35 28 32 -- 2 3=100February, 1995 33 30 33 -- 2 2=100December, 1994 35 31 30 -- 2 2=100November, 1994 28 31 35 4 * 2=100October, 1994 31 32 33 3 * 1=100Early October, 1994 33 30 32 -- 2 3=100July, 1994 29 33 35 2 * 1=100June, 1992 28 32 36 1 * 3=100May, 1990 28 33 28 9 * 2=100February, 1989 31 38 23 7 * 1=100May, 1988 28 38 26 6 * 2=100January, 1988 27 39 26 6 * 2=100May, 1987 25 37 28 8 * 2=100
IF ANSWERED REPUBLICAN, ASK [N=634]:Q.19 Do you consider yourself a STRONG Republican, or NOT a strong Republican?
LateSept Sept Aug Nov Oct April Oct July June May Feb May Jan May2000 1999 1999 1997 1995 1995 1994 1994 1992 1990 1989 1988 1988 1987
14 Strong 14 10 11 11 11 15 16 13 11 13 15 13 12 1113 Not strong 13 14 14 14 19 15 15 16 17 15 16 15 15 1427% 27% 24% 25% 25% 30% 30% 31% 29% 28% 28% 31% 28% 27% 25%
IF ANSWERED DEMOCRAT, ASK [N=897]:Q.20 Do you consider yourself a STRONG Democrat, or NOT a strong Democrat?
LateSept Sept Aug Nov Oct April Oct July June May Feb May Jan May2000 1999 1999 1997 1995 1995 1994 1994 1992 1990 1989 1988 1988 1987
15 Strong 19 15 15 14 14 14 18 15 14 16 17 19 19 1816 Not strong 15 16 18 18 16 15 14 18 18 17 21 19 20 1931% 34% 31% 33% 32% 30% 29% 32% 33% 32% 33% 38% 38% 39% 37%
19
IF ANSWERED INDEPENDENT/NO PREFERENCE/OTHER/DON’T KNOW (Q18=3,4,5,9), ASK [N=997]:Q.21 As of TODAY, do you LEAN more to the Republican Party or the Democratic Party?
(VOL.)Republican Democrat Other/DK/Ref.
August, 2003 29 39 32=100September, 2000 28 33 39=100Late September, 1999 31 34 35=100August, 1999 34 36 30=100
ASK REPUBLICANS AND REPUBLICAN LEANERS ONLY (Q.18=1 OR Q.21=1) [N= 928]:Q.22 How good a job is the Republican Party doing these days in standing up for its traditional positions on such
things as reducing the size of government, cutting taxes and promoting conservative social values — would yousay the Party is doing an excellent job, a good job, only a fair job or a poor job?
Rep/ Rep/ Rep/Lean Rep Lean Rep Lean Rep (RV)May 2002 May 2001 Sept 2000
6 Excellent 6 10 651 Good 49 50 4337 Only fair 38 32 44 5 Poor 5 5 5 1 Don’t know/Refused 2 3 2100 100 100 100
ASK DEMOCRATS AND DEMOCRATIC LEANERS ONLY (Q.18=2 OR Q.21=2) [N= 1298]:Q.23 How good a job is the Democratic Party doing these days in standing up for its traditional positions on such
things as protecting the interests of minorities, helping the poor and needy, and representing working people— would you say the Party is doing an excellent job, a good job, only a fair job or a poor job?
Dem/ Dem/ Dem/Lean Dem Lean Dem Lean Dem (RV)May 2002 May 2001 Sept 2000
5 Excellent 5 8 1133 Good 39 39 5251 Only fair 43 40 32 9 Poor 10 7 4 2 Don’t know/Refused 3 6 1100 100 100 100
8 In May, 1999 he was identified as "Senator John Kerry of Massachusetts."
20
Q.27 Next, I’m going to read you a list of some people who have been in the news lately. Not everyone will haveheard of them. For each one that I name, please tell me whether or not you have heard of this person. (First,)(INSERT NAME; RANDOMIZE NAMES), have you heard of this person or not?(IF HAVE HEARD, ASK)How much of a chance is there that you would vote for (INSERT NAME) if (he/she) is a candidate forpresident in 2004 — is there a good chance, some chance, or no chance? Have you heard of (NEXT NAME)or not?
BASED ON REGISTERED VOTERS [N= 1866]: Based on Those Who Have HeardHave Have not DK/ Good Some No DK/Heard Heard Ref. Chance Chance Chance Ref. (N)
a. George W. Bush 99 * 1=100 43 17 38 2=100 (1853)Early July, 2003 99 * 1=100 44 19 35 2=100August, 1999 98 2 *=100 40 30 27 3=100June, 1999 96 4 *=100 34 35 27 4=100May, 1999 95 4 1=100 34 34 28 4=100February, 1999 95 5 *=100 32 36 27 5=100
b. John Kerry 62 37 1=100 13 34 43 10=100 (1150)Early July, 2003 58 42 *=100 13 29 46 12=100May, 19998 52 46 2=100 8 37 44 11=100February, 1999 38 61 1=100 8 37 48 7=100
c. Dick Gephardt 77 22 1=100 12 33 46 9=100 (1422)Early July, 2003 75 25 *=100 9 36 46 9=100
d. Howard Dean 46 54 *=100 13 28 46 13=100 (866)Early July, 2003 37 63 *=100 9 23 57 11=100
e. John Edwards 45 54 1=100 8 33 47 12=100 (877)Early July, 2003 39 60 1=100 7 29 53 11=100
f. Carol Moseley Braun 41 59 *=100 9 24 57 10=100 (799)Early July, 2003 36 64 *=100 10 19 63 8=100
g. Dennis Kucinich 23 77 *=100 8 20 57 15=100 (440)Early July, 2003 18 82 *=100 7 20 60 13=100
h. Bob Graham 60 39 1=100 9 29 51 11=100 (1137)Early July, 2003 56 43 1=100 8 25 57 10=100
i. Joe Lieberman 86 13 1=100 13 37 43 7=100 (1590)Early July, 2003 83 16 1=100 13 32 47 8=100
j. Al Sharpton 68 32 *=100 5 14 75 6=100 (1367)Early July, 2003 66 34 *=100 5 12 77 6=100
9 In April 2003, the question was worded “... the economy or the situation in Iraq?”
21
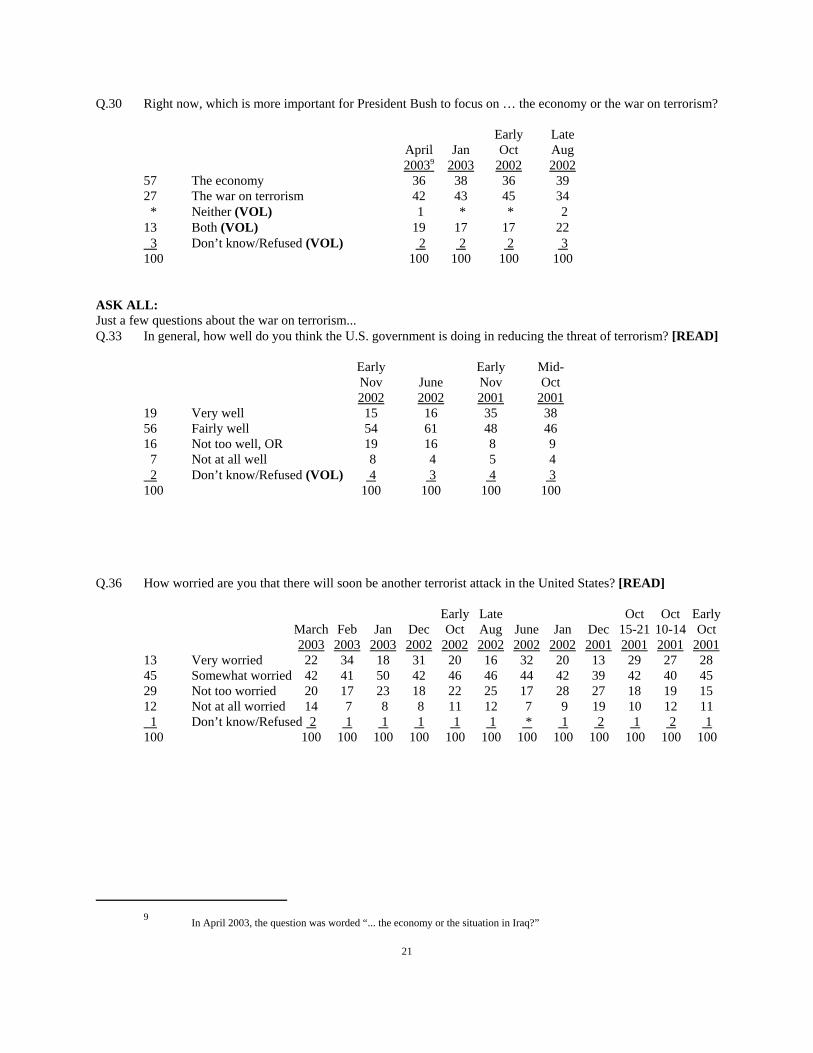
Q.30 Right now, which is more important for President Bush to focus on … the economy or the war on terrorism?
Early LateApril Jan Oct Aug20039 2003 2002 2002
57 The economy 36 38 36 3927 The war on terrorism 42 43 45 34 * Neither (VOL) 1 * * 213 Both (VOL) 19 17 17 22 3 Don’t know/Refused (VOL) 2 2 2 3100 100 100 100 100
ASK ALL:Just a few questions about the war on terrorism...Q.33 In general, how well do you think the U.S. government is doing in reducing the threat of terrorism? [READ]
Early Early Mid-Nov June Nov Oct2002 2002 2001 2001
19 Very well 15 16 35 3856 Fairly well 54 61 48 4616 Not too well, OR 19 16 8 9 7 Not at all well 8 4 5 4 2 Don’t know/Refused (VOL) 4 3 4 3100 100 100 100 100
Q.36 How worried are you that there will soon be another terrorist attack in the United States? [READ]
Early Late Oct Oct EarlyMarch Feb Jan Dec Oct Aug June Jan Dec 15-21 10-14 Oct2003 2003 2003 2002 2002 2002 2002 2002 2001 2001 2001 2001
13 Very worried 22 34 18 31 20 16 32 20 13 29 27 2845 Somewhat worried 42 41 50 42 46 46 44 42 39 42 40 4529 Not too worried 20 17 23 18 22 25 17 28 27 18 19 1512 Not at all worried 14 7 8 8 11 12 7 9 19 10 12 11 1 Don’t know/Refused 2 1 1 1 1 1 * 1 2 1 2 1100 100 100 100 100 100 100 100 100 100 100 100 100