Embed Size (px)
Citation preview

DESCRIBING FORAGE FISH AVAILABILITY IN COASTAL WATERS OF THE
KODIAK ARCHIPELAGO, ALASKA
Signature Page
By
Lei Guo
RECOMMENDED: _________________________________________ Dr. Kenneth Coyle
__________________________________________ Dr. Nicola Hillgruber
__________________________________________ Dr. Lawrence Schaufler
__________________________________________ Dr. Robert Foy, Advisory Committee Co-Chair
__________________________________________ Kate Wynne, Advisory Committee Co-Chair
__________________________________________ Dr. Katrin Iken Head, Program in Marine Science and Limnology
APPROVED: _________________________________________ Dr. Michael Castellini Dean, School of Fisheries and Ocean Sciences __________________________________________ Dr. Lawrence Duffy, Dean of the Graduate School __________________________________________ Date
DESCRIBING FORAGE FISH AVAILABILITY IN COASTAL WATERS OF THE
KODIAK ARCHIPELAGO, ALASKA
Title Page
A
DISSERTATION
Presented to the Faculty
of the University of Alaska Fairbanks
in Partial Fulfillment of the Requirements
for the Degree of
DOCTOR OF PHILOSOPHY
By
Lei Guo, B.S.
Fairbanks, Alaska
December 2010

iii
Abstract
Assessing the availability of forage fishes is key to understanding fluctuations in populations of
apex predators that prey upon them, including pinnipeds and seabirds in the Gulf of Alaska. In
this study, multiple aspects of forage fish availability were measured in coastal waters of the
Kodiak Archipelago, Alaska, in May (2004 & 2005), August (2004 & 2005), November (2006),
and April (2007). Efforts were focused on four pelagic species that consistently dominated
midwater trawl catches and have been described as important prey for upper trophic level
predators around the Archipelago: walleye pollock (Theragra chalcogramma), Pacific herring
(Clupea pallasii), capelin (Mallotus villosus), and eulachon (Thaleichthys pacificus). Fatty acid
and stomach content analyses were combined to estimate the diet composition of these forage
fishes as a means of identifying the immediate source of energy they transfer to upper trophic
level taxa. Values of copepod-originated fatty acids indicated underestimation of dietary
copepods by stomach content analysis, which suggests that fatty acid analysis should be used to
supplement conventional methodologies in forage fish field studies. Lipid content and fatty acid
composition were highly variable within species, suggesting that the use of average values at the
species level should be avoided in fine-scale ecological investigations. Mesoscale horizontal
distribution and energy density of forage fishes were measured in May and August (2005) to
assess the prey fields available to local apex predators over critical periods of their life history.
Dense post-spawning aggregations formed seasonal energetic “hotspots”, exemplified by herring
schools on the northwest side of the Archipelago in May and capelin schools on the northeast side
in August. Results presented in this dissertation offer key information needed to identify energetic
pathways of significance to upper trophic level consumers in the Kodiak Archipelago.
Understanding local trophic interactions and their role in regional apex predator population
fluctuations will improve efforts to develop trophodynamic models and ecosystem-based fishery
management plans in the North Pacific Ocean.
iv
Table of Contents
Page
Signature Page .................................................................................................................... i
Title Page ........................................................................................................................... ii
Abstract ............................................................................................................................. iii
Table of Contents ............................................................................................................. iv
List of Figures .................................................................................................................. vii
List of Tables ..................................................................................................................... x
List of Appendices .......................................................................................................... xiii
Acknowledgements ........................................................................................................ xiv
Chapter 1: General Introduction .................................................................................... 1
BACKGROUND ........................................................................................................................ 1
FORAGE FISHES AS ENERGY CONVEYERS ...................................................................... 2
FORAGE FISH AVAILABILITY ............................................................................................. 2
DISSERTATION OBJECTIVES AND ORGANIZATION ...................................................... 4
LITERATURE CITED ............................................................................................................... 5
Chapter 2: Underestimation of Dietary Copepods by Stomach Content Analysis:
Using Fatty Acid Analysis to Refine Estimation of Forage Fish Diet Composition .. 12
ABSTRACT ............................................................................................................................. 12
INTRODUCTION .................................................................................................................... 13
MATERIALS AND METHODS ............................................................................................. 16
RESULTS ................................................................................................................................. 19
v
DISCUSSION ........................................................................................................................... 22
LITERATURE CITED ............................................................................................................. 30
TABLES AND FIGURES ........................................................................................................ 38
Chapter 3: Intra-Species Variation in Lipid Content and Fatty Acid Composition of
Forage Fishes in Embayments of the Kodiak Archipelago, Alaska ........................... 48
ABSTRACT ............................................................................................................................. 48
INTRODUCTION .................................................................................................................... 49
MATERIALS AND METHODS ............................................................................................. 51
RESULTS ................................................................................................................................. 53
DISCUSSION ........................................................................................................................... 56
LITERATURE CITED ............................................................................................................. 61
TABLES AND FIGURES ........................................................................................................ 69
Chapter 4: Measuring Mesoscale Horizontal Distribution Characteristics and
Energy Density of Pelagic Forage Fishes in Coastal Waters of the Kodiak
Archipelago, Alaska ........................................................................................................ 84
ABSTRACT ............................................................................................................................. 84
INTRODUCTION .................................................................................................................... 85
MATERIALS AND METHODS ............................................................................................. 86
Sampling ......................................................................................................................... 86
Acoustics analyses .......................................................................................................... 87
Biochemical analyses ..................................................................................................... 88
Statistical analyses .......................................................................................................... 89
RESULTS ................................................................................................................................. 91
vi
DISCUSSION ........................................................................................................................... 93
Distribution characteristics ............................................................................................. 93
Biomass as a proxy for energy density ........................................................................... 95
Potential errors ............................................................................................................... 96
Implications for local apex predators ............................................................................. 97
Summary ........................................................................................................................ 99
LITERATURE CITED ............................................................................................................. 99
TABLES AND FIGURES ...................................................................................................... 106
Chapter 5: General Conclusion ................................................................................... 119
LITERATURE CITED ........................................................................................................... 122
Appendices ..................................................................................................................... 125
vii
List of Figures
Page
Figure 2.1 Locations of Uganik, Tonki, Perenosa, and Paramanof Bays around the Kodiak
Archipelago, Alaska. ...................................................................................................................... 46
Figure 2.2 Stomach fullness (% of whole-body wet weight) plotted against total length of walleye
pollock (A, n = 389), Pacific herring, (B, n = 250), capelin (C, n = 242), and eulachon (D, n = 147)
collected from embayments around the Kodiak Archipelago, Alaska. .......................................... 47
Figure 3.1 Locations of Uganik, Tonki, Perenosa, and Paramanof Bays around the Kodiak
Archipelago, Alaska. ...................................................................................................................... 74
Figure 3.2 Scatterplots of lipid content vs. total length of walleye pollock from embayments of
the Kodiak Archipelago, Alaska, by sampling month and year. .................................................... 75
Figure 3.3 MDS ordination of walleye pollock fatty acid composition (n = 120) sampled from
embayments of the Kodiak Archipelago, Alaska. .......................................................................... 76
Figure 3.4 Scatterplots of lipid content vs. total length of Pacific herring from embayments of the
Kodiak Archipelago, Alaska, by sampling month and year. ......................................................... 77
Figure 3.5 MDS ordination of Pacific herring fatty acid composition (n = 57, of which one
sample considered as outlier) sampled from embayments of the Kodiak Archipelago, Alaska. ... 78
Figure 3.6 Contents (% of the total quantified fatty acids by weight) of four fatty acids plotted
against total length of Pacific herring (n = 36) sampled from Uganik Bay, Alaska, in November
2006. ............................................................................................................................................... 79
viii
Figure 3.7 Scatterplots of lipid content vs. total length of capelin from embayments of the Kodiak
Archipelago, Alaska, by sampling month and year. ...................................................................... 80
Figure 3.8 Content (% of the total quantified fatty acids by weight) of fatty acid 22:1n-11 plotted
against total length of capelin sampled from embayments of the Kodiak Archipelago, Alaska, in
May (2005, n = 20) and August (2004 and 2005 combined, n = 36). ............................................ 81
Figure 3.9 MDS ordination of capelin fatty acid composition (n = 56) sampled from embayments
of the Kodiak Archipelago, Alaska.. .............................................................................................. 82
Figure 3.10 Scatterplots of lipid content vs. total length of eulachon sampled from embayments of
the Kodiak Archipelago, Alaska. ................................................................................................... 83
Figure 4.1 The five survey regions in waters off the northern part of the Kodiak Archipelago,
Alaska. ......................................................................................................................................... 113
Figure 4.2 Acoustic transects (black line) in survey regions (A) on the northeastern side of the
Kodiak Archipelago and (B) in Uganik Bay, with the 100-m depth isobath (gray line). ............ 114
Figure 4.3 Area units (black dot) where species-combined energy density was ≥ 10% of the
maximum values in (A & B) May and (C & D) August, when area units from all regions were
compared within each month. ...................................................................................................... 115
Figure 4.4 Areal mean (A) fish density (×104 km-2), (B) biomass (×103 kg km-2), (C) lipid density
(×102 kg km-2), and (D) energy density (×107 kJ km-2) of the four fish species in the five regions
in May 2005. ................................................................................................................................ 116
Figure 4.5 Areal mean (A) fish density (×106 km-2), (B) biomass (×103 kg km-2), (C) lipid density
(×103 kg km-2), and (D) energy density (×108 kJ km-2) of the four fish species in the five regions
in August 2005.. ........................................................................................................................... 117
ix
Figure 4.6 Frequency distributions (one percent interval) of proportional differential (PD)
between standardized values of species-combined (Pacific herring, eulachon, capelin, and walleye
pollock) biomass (SB) and energy density (SED) in waters off the northern part of the Kodiak
Archipelago, Alaska, in (A) May and (B) August 2005. ............................................................. 118
x
List of Tables
Page
Table 2.1 20:1n-11/9 and 22:1n-11 fatty acid contents (% of total quantified fatty acids) in four
fish species collected from embayments around the Kodiak Archipelago, Alaska. ...................... 38
Table 2.2 20:1n-11/9 and 22:1n-11 fatty acid contents (% of total quantified fatty acids) in four
zooplankton groups collected from embayments around the Kodiak Archipelago, Alaska. ......... 40
Table 2.3 Overall stomach content composition in four fish species collected from embayments
around the Kodiak Archipelago, Alaska, in mean numerical percentage (No., %), percentage
frequency of occurrence (FO, %), and mean prey-specific numerical percentage (SNo., %). ...... 41
Table 2.4 Mean numerical percentage (No., %) and percent frequency of occurrence (FO, %) of
copepods and euphausiids (adults and juveniles) in stomach contents of four fish species collected
from embayments around the Kodiak Archipelago, Alaska. ......................................................... 42
Table 3.1 Lipid content (% of whole-body wet mass, means ± SD) of four forage fish species
from embayments of the Kodiak Archipelago, Alaska, by sampling month and year. ................. 69
Table 3.2 Content (% of the total quantified fatty acids by weight, means ± SD) of the 11 most
abundant fatty acids in walleye pollock from embayments of the Kodiak Archipelago, Alaska, by
sampling month and year. .............................................................................................................. 70
Table 3.3 Lipid content (% of whole-body wet mess, means) and three fatty acid contents (% of
the total quantified fatty acids by weight, means) of seven walleye pollock sample groups (based
on year, embayment, and total length range) collected from embayments of the Kodiak
Archipelago, Alaska, in August 2004 and 2005. ........................................................................... 71
xi
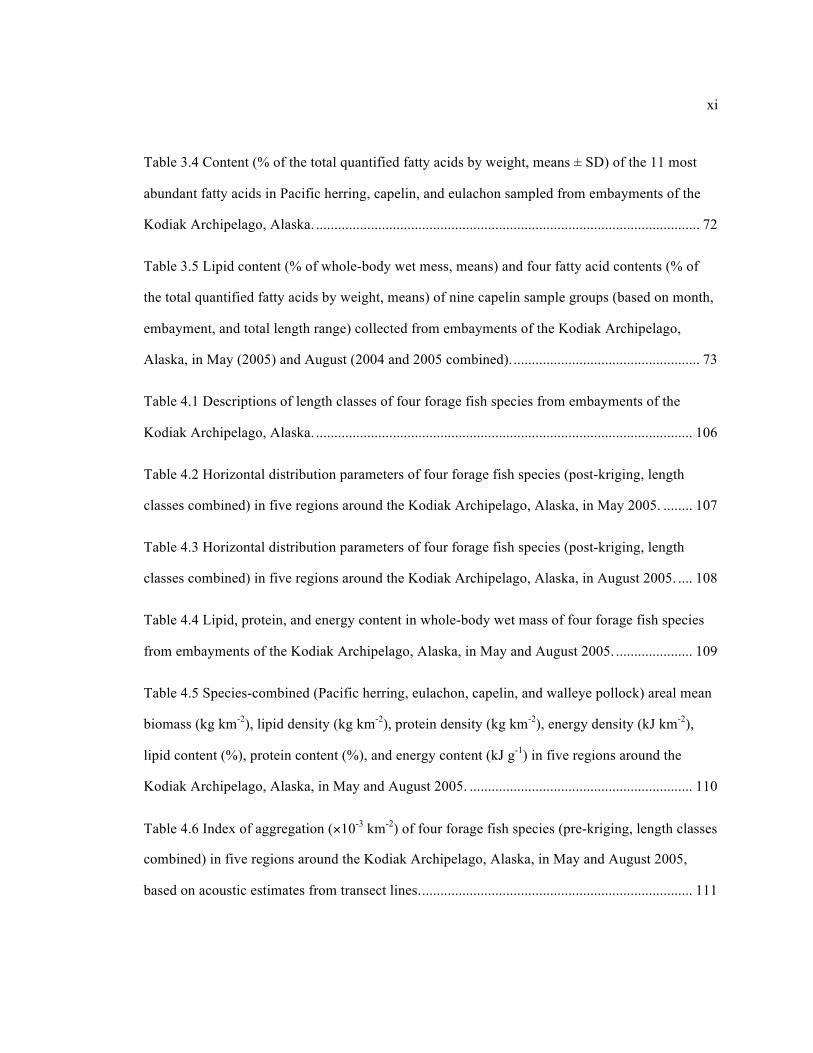
Table 3.4 Content (% of the total quantified fatty acids by weight, means ± SD) of the 11 most
abundant fatty acids in Pacific herring, capelin, and eulachon sampled from embayments of the
Kodiak Archipelago, Alaska. ......................................................................................................... 72
Table 3.5 Lipid content (% of whole-body wet mess, means) and four fatty acid contents (% of
the total quantified fatty acids by weight, means) of nine capelin sample groups (based on month,
embayment, and total length range) collected from embayments of the Kodiak Archipelago,
Alaska, in May (2005) and August (2004 and 2005 combined). ................................................... 73
Table 4.1 Descriptions of length classes of four forage fish species from embayments of the
Kodiak Archipelago, Alaska. ....................................................................................................... 106
Table 4.2 Horizontal distribution parameters of four forage fish species (post-kriging, length
classes combined) in five regions around the Kodiak Archipelago, Alaska, in May 2005. ........ 107
Table 4.3 Horizontal distribution parameters of four forage fish species (post-kriging, length
classes combined) in five regions around the Kodiak Archipelago, Alaska, in August 2005. .... 108
Table 4.4 Lipid, protein, and energy content in whole-body wet mass of four forage fish species
from embayments of the Kodiak Archipelago, Alaska, in May and August 2005. ..................... 109
Table 4.5 Species-combined (Pacific herring, eulachon, capelin, and walleye pollock) areal mean
biomass (kg km-2), lipid density (kg km-2), protein density (kg km-2), energy density (kJ km-2),
lipid content (%), protein content (%), and energy content (kJ g-1) in five regions around the
Kodiak Archipelago, Alaska, in May and August 2005. ............................................................. 110
Table 4.6 Index of aggregation (×10-3 km-2) of four forage fish species (pre-kriging, length classes
combined) in five regions around the Kodiak Archipelago, Alaska, in May and August 2005,
based on acoustic estimates from transect lines. .......................................................................... 111
xii
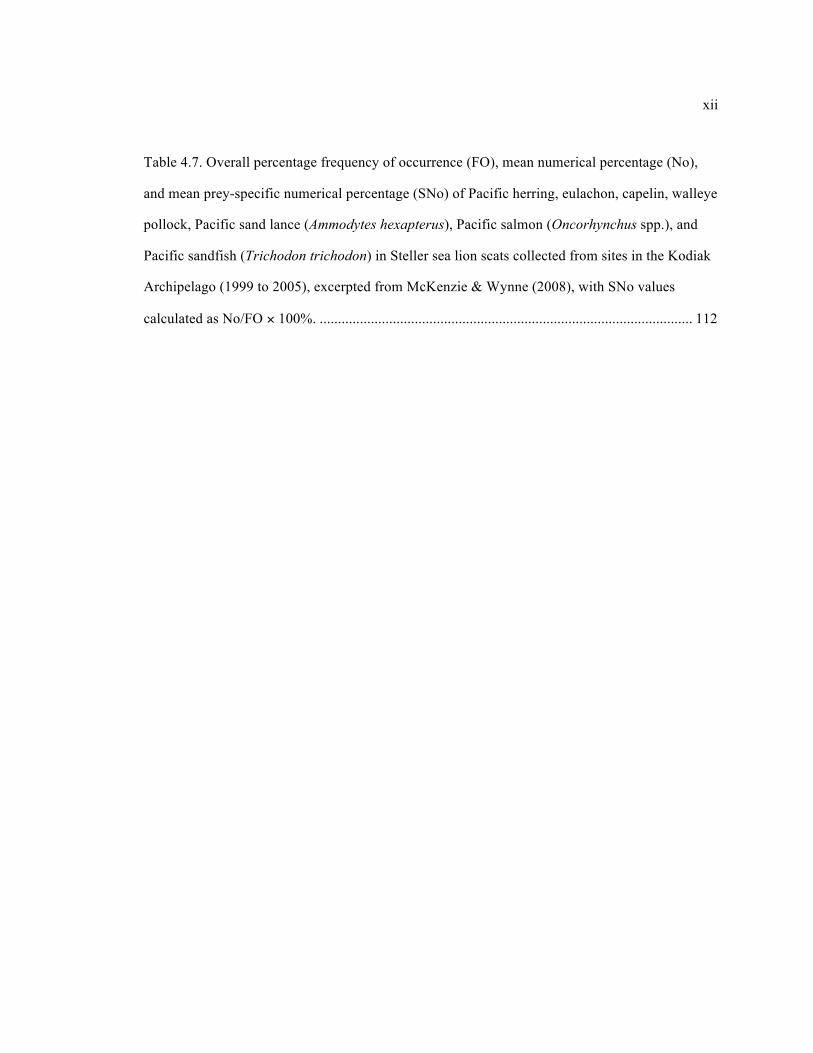
Table 4.7. Overall percentage frequency of occurrence (FO), mean numerical percentage (No),
and mean prey-specific numerical percentage (SNo) of Pacific herring, eulachon, capelin, walleye
pollock, Pacific sand lance (Ammodytes hexapterus), Pacific salmon (Oncorhynchus spp.), and
Pacific sandfish (Trichodon trichodon) in Steller sea lion scats collected from sites in the Kodiak
Archipelago (1999 to 2005), excerpted from McKenzie & Wynne (2008), with SNo values
calculated as No/FO × 100%. ...................................................................................................... 112
xiii
List of Appendices
Page
Appendix A Fishing Permits ........................................................................................................ 126
Appendix B IACUC Certificate ................................................................................................... 134

xiv
Acknowledgements
In fall 2003, I was a newly weaned bachelor-degree holder when I enrolled as a PhD student
in School of Fisheries and Ocean Sciences. It has been a steep learning curve throughout the last
seven years. Fortunately, thanks to a long list of people who have helped me with various aspects
of this dissertation project, I am able to approach the finishing line.
The dissertation project would have not been possible without my committee chairs and
members. My co-advisors, Dr. Robert Foy and Kate Wynne, have made tremendous efforts to
guide me through numerous obstacles in the project, in addition to keeping me in the program at
times when I intended to give up. My committee member Dr. Lawrence Schaufler patiently
helped me with all the fatty acid work; Dr. Kenneth Coyle and Dr. Nicola Hillgruber offered
valuable critiques on the project and my writings.
I would like to acknowledge a number of individuals who made important contributions to
this project. Captain Jay Stinson and the crew of Fishing Vessel Alaskan helped us conduct
sampling surveys in a safe and timely manner. Iluhi Schimetka, Mary Beth Loewen, Mike
Trussell, and Shannon Hanna assisted with various aspects of the project, from sample collection
to lab analyses. Dr. Alexandra Oliveira graciously shared her expertise in lipids and lab
procedures. Chris Stark taught me zooplankton identification. Steve Coen and Bob Pfutzenreuter
were my lab equipment tutors.
The main funding for this project comes from Gulf Apex Predator-Prey Program. Other
funding sources include Dissertation Completion Fellowship and USDA.
I received endless logistical support from administrative staff on Kodiak, Fairbank, and
Juneau campuses, and staff in UAF international office. Alaska Fisheries Science Center Auke
Bay Lab in Juneau and Kodiak Lab accommodated me to use their facility. Librarians at the
Rasmuson and BioSciences Library have sent me hundreds of papers, books, and reports.

xv
I extend my deep appreciation to all fellow students and friends for their mental support and
enriching my graduate-school life.
My girlfriend Trina Lapis accompanied me through all the dissertation writing stages; this
journey would have not been possible without her.
I thank my mom for everything she has given to me.

1
Chapter 1:
General Introduction
BACKGROUND
Since the 1970s, major population declines in pinnipeds and seabirds have been observed in
the Gulf of Alaska and Bering Sea. Regional decreases by up to 85% were reported in Steller sea
lions Eumetopias jubatus (Merrick et al. 1987, Trites & Larkin 1996), northern fur seals
Callorhinus ursinus (York 1990, Towell et al. 2006), harbor seals Phoca vitulina richardsi
(Pitcher 1990, Womble et al. 2010), and several species of murres and kittiwakes (Byrd et al.
2008, Slater & Byrd 2009). A variety of hypotheses have been brought forward to explain the
declines, several of which are concerned with prey availability and quality (Merrick et al. 1997,
Trites & Donnelly 2003): for example, the lack of high-quality prey was proposed to have
negative effects on Steller sea lion reproductive success of adult females and the survival of their
young (Calkins et al. 1998, Rosen & Trites 2005). Coincident with the declines in pinniped and
seabird populations, significant decreases in forage fishes have occurred in the North Pacific
Ocean since the 1970s (Alverson 1992, Anderson & Piatt 1999), along with abrupt climatic
changes (Mantua et al. 1997, Hare & Mantua 2000). Because forage fishes constitute a major
prey source for piscivorous pinnipeds and seabirds (Piatt et al. 2006, McKenzie & Wynne 2008),
the declines in apex predators are considered to be partially attributed to the decreases in forage
fishes and further to climate changes (Trites et al. 2007), although specific mechanisms of trophic
interactions between forage fishes and their predators are still unclear. Therefore, refining our
knowledge about forage fishes is one critical step toward explaining historical and current
fluctuations in apex predators, and predicting future trends in relation to climate change (Springer
& Speckman 1997, Trites et al. 2007).
2
FORAGE FISHES AS ENERGY CONVEYERS
Forage fishes form the main energy passageways between zooplankton and piscivorous
fishes, marine mammals and seabirds (Springer & Speckman 1997). Forage fishes consume a
wide range of holo- and mero-zooplankton taxa, including copepods, euphausiids, and crab larvae
(Grover 1990, Merati & Brodeur 1996, Wilson et al. 2006). They are also consumed by a variety
of piscivorous predators, including groundfishes (Yang & Nelson 2000, Yang et al. 2006), marine
mammals (Sinclair & Zeppelin 2002, McKenzie & Wynne 2008), and seabirds (Hatch & Sanger
1992, Golet et al. 2000). It has been noticed that a small number of forage fish species, typically
less than ten, transfer most of the energy that is conveyed from zooplankton to piscivorous
predators in a given marine ecosystem (Springer & Speckman 1997, Ayon et al. 2008). These
forage fish species are characterized by extremely high abundances and serve as the energetic
intermediates between numerous species of zooplankton prey and piscivorous predators (Cury et
al. 2000, Freon et al. 2009). As a result, each forage fish species is linked with a high number of
prey and predator taxa through direct trophic interactions and can be an important driving factor
for ecosystem dynamics (Hunt & McKinnell 2006, Bakun et al. 2009).
FORAGE FISH AVAILABILITY
Information on the availability of forage fishes as prey is a key to understanding distribution
and population changes in piscivorous predators (Springer & Speckman 1997). For example,
variations in capelin (Mallotus villosus) availability led to population fluctuations of Atlantic cod
(Gadus morhua) off eastern Newfoundland, Canada, in the 1980s (Methven & Piatt 1989); the
low availability of capelin and Atlantic herring (Clupea harengus) was a major factor
contributing to the acute adult mortality and subsequent population decline of common murre
(Uria aalge) in Norwegian waters in mid-1980s (Anker-Nilssen et al. 1997). Thus, understanding
forage fish availability is an effective approach in our efforts towards a more thorough
3
understanding of marine ecosystems and ecosystem-based fisheries management of upper trophic
levels (Pikitch et al. 2004, Bogetveit et al. 2008).
Availability of forage fishes is defined by several aspects, including size range, horizontal
and vertical distribution patterns, biomass, and energy content. Size range and distribution
patterns affect the accessibility of a prey field, because different predators have different
thresholds for prey size (Sinclair et al. 2008, Young et al. 2010), horizontal foraging distance
(Milette & Trites 2003, Davis et al., 2006, Fauchald 2009), and diving depth (Mitani et al. 2004,
Bearhop et al. 2006, Cornick et al. 2006). Biomass and energy content measure the quantity and
quality of available prey fields (Adams et al. 2008, Winter et al. 2009).
Various aspects of forage fish availability, such as horizontal and vertical distribution
patterns, are often correlated to attributes of their zooplankton prey (Schabetsberger et al. 2000,
Swartzman et al. 2002). These associations allow us to use zooplankton prey as a link to connect
variations in forage fish availability with climate changes, because zooplankton are typically
more quickly and directly affected by environmental parameters than forage fishes (Verheye &
Richardson 1998, Ayon et al. 2008). However, these efforts first require the correct identification
of important zooplankton prey, which demands an accurate description of forage fish diet
composition. Therefore, deriving a reliable method to estimate forage fish diets is integral to
better understanding forage fish availability.
In the western Gulf of Alaska, refining our knowledge of forage fish availability is in urgent
need for investigating ecological questions of immediate biological and economic concerns. As a
result of a severe decline, the western stock of Steller sea lions (in areas west of 144°W longitude)
was listed as “endangered” under the US Endangered Species Act in 1997. Groundfish
management in Alaska since the 1990s has been largely influenced by the listing. In order to
address this issue, the Gulf Apex Predator-Prey Program was established to study trophic
relationships between Steller sea lions, their prey, competitors, and predators in the regions

4
around the Kodiak Archipelago, Alaska. My dissertation project is part of the program and
focuses on forage fishes in the coastal waters of the Archipelago. The results of this project are
not only valuable to the Steller sea lion issue, but also applicable to investigations of other apex
predators in the western Gulf of Alaska.
DISSERTATION OBJECTIVES AND ORGANIZATION
The overall goal of this project was to define forage fish availability in coastal waters of the
Kodiak Archipelago, Alaska. These coastal waters are essential feeding and spawning habitats for
forage fishes (Pahlke 1985, Loewen 2007), which constitute critical food sources for local apex
predators (McKenzie & Wynne 2008, Witteveen et al. 2008). I focused on the northeastern and
western sides of the Archipelago; both areas are primarily influenced by the near-shore
buoyancy-driven Alaska Coastal Current (Stabeno et al. 1995). Hydrographic features in these
waters are highly variable at relatively small spatial and temporal scales, resulted from the
interactions among the prevalent Alaska Coastal Current, a large number of freshwater runoffs
into embayments, and complex topography (Stabeno et al. 2004). Sampling in these waters
provided an opportunity to examine fine-scale variations in forage fish availability in a highly
dynamic setting.
In this dissertation, different aspects of forage fish availability were addressed in three
studies, which are described in the following three chapters:
In Chapter Two, results on forage fish diet composition are presented. The objective was to
combine fatty acid and stomach content analyses in order to refine the estimation of forage fish
diet composition. The hypothesis was that dietary copepods are underestimated by stomach
content analysis. The hypothesis was conceived based the following: 1) copepods and
euphausiids are evacuated from forage fish stomachs at different rates due to differences in body
size and exoskeleton fragility, and 2) copepods and euphausiids are often found in the same
5
individual stomachs in stomach content analysis. Copepod-originated fatty acids were used to
estimate the proportions of dietary copepods, which were compared with the proportions derived
from stomach content results. Discrepancies between the two datasets were discussed. The use of
fatty acid analysis as a supplementary tool to stomach content analysis in studying forage fish
feeding ecology was evaluated.
Chapter Three describes intra-species variations in forage fish lipid dynamics. Lipid content
and fatty acid composition offer insights into forage fish life history and plankton production, and
are important aspects in defining forage fish availability to upper trophic level predators. The
objective was to improve the resolution of intra-species lipid dynamics in local forage fishes.
Variations in lipid content and fatty acid composition related to month, fish length, and location
were examined. Potential reasons for and implication of these variations were discussed.
In Chapter Four, horizontal distribution and energy density of forage fishes were measured
to assess mesoscale variations in forage fish availability. The hypotheses were that 1) patchiness
of forage fishes is species specific and these patchy distributions form seasonal “hotspots” of
feeding grounds for apex predators, and that 2) biomass of forage fish assemblages is an
inadequate proxy for the amount of energy available to predators. Distribution parameters of four
forage fish species, computed based on acoustic-trawl survey data and geostatistics, were
compared among five study regions and between two months in the Kodiak Archipelago. Spatial
variations in species-specific and species-combined energy density were described. The use of
biomass as a proxy for energy density was evaluated at two spatial scales. Implications of the
results on local apex predators were discussed.
LITERATURE CITED
Adams CF, Foy RJ, Johnson DS, Coyle KO (2008) Seasonal changes in pelagic fish biomass
around the Chiswell Island Steller sea lion rookery in 2003. Fish Res 93:179-185
6
Alverson DL (1992) A review of commercial fisheries and the Steller sea lion (Eumetopias
jubatus): the conflict arena. Rev Aquat Sci 6:203-256
Anderson PJ, Piatt JF (1999) Community reorganization in the Gulf of Alaska following ocean
climate regime shift. Mar Ecol Prog Ser 189:117-123
Anker-Nilssen T, Barrett RT, Krasnov JV (1997) Long- and short-term responses of seabirds in
the Norwegian and Barents Seas to changes in stocks of prey fish. Lowell Wakefield Fish
Symp Ser 14:683-698
Ayon P, Swartzman G, Bertrand A, Gutierrez M, Bertrand S (2008) Zooplankton and forage fish
species off Peru: Large-scale bottom-up forcing and local-scale depletion. Prog Oceanogr
79:208-214
Bakun A, Babcock EA, Santora C (2009) Regulating a complex adaptive system via its
wasp-waist: grappling with ecosystem-based management of the New England herring
fishery. ICES J Mar Sci 66:1768-1775
Bearhop S, Phillips RA, McGill R, Cherel Y, Dawson DA, Croxall JP (2006) Stable isotopes
indicate sex-specific and long-term individual foraging specialisation in diving seabirds.
Mar Ecol Prog Ser 311:157-164
Bogetveit FR, Slotte A, Johannessen A (2008) The ability of gadoids to take advantage of a
short-term high availability of forage fish: the example of spawning aggregations in
Barents Sea capelin. J Fish Biol 72:1427-1449
Byrd GV, Schmutz JA, Renner HM (2008) Contrasting population trends of piscivorous seabirds
in the Pribilof Islands: a 30-year perspective. Deep Sea Res II 55:1846-1855
Calkins DG, Becker EF, Pitcher KW (1998) Reduced body size of female Steller sea lions from a
declining population in the Gulf of Alaska. Mar Mamm Sci 14:232-244

7
Cornick LA, Inglis SD, Willis K, Horning M (2006) Effects of increased swimming costs on
foraging behavior and efficiency of captive Steller sea lions: evidence for behavioral
plasticity in the recovery phase of dives. J Exp Mar Biol Ecol 333:306-314
Cury P, Bakun A, Crawford RJM, Jarre A, Quinones RA, Shannon LJ, Verheye HM (2000)
Small pelagics in upwelling systems: patterns of interaction and structural changes in
"wasp-waist" ecosystems. ICES J Mar Sci 57:603-618
Davis RW, Brandon EAA, Calkins DG, Loughlin TR (2006). Female attendance and neonatal
pup growth in Steller sea lions (Eumetopias jubatus). In: Trites AW, Atkinson SK,
DeMaster DP, Fritz LW, Gelatt TS, Rea LD, Wynne KM (eds) Sea lions of the world. Proc
22nd Lowell Wakefield Fish Symp. University of Alaska Sea Grant College Program,
Fairbanks, AK
Fauchald P (2009) Spatial interaction between seabirds and prey: review and synthesis. Mar Ecol
Prog Ser 391:139-151
Freon P, Aristegui J, Bertrand A, Crawford RJM, Field JC, Gibbons MJ, Tam J, Hutchings L,
Masski H, Mullon C, Ramdani M, Seret B, Simieri M (2009) Functional group biodiversity
in Eastern Boundary Upwelling Ecosystems questions the wasp-waist trophic structure.
Prog Oceanogr 83:97-106
Golet GH, Kuletz KJ, Roby DD, Irons DB (2000) Adult prey choice affects chick growth and
reproductive success in pigeon guillemots. Auk 117:82-91
Grover JJ (1990) Feeding ecology of late-larval and early-juvenile walleye pollock Theragra
chalcogramma from the Gulf of Alaska in 1987. Fish Bull 88:463-470
Hare SR, Mantua NJ (2000) Empirical evidence for North Pacific regime shifts in 1977 and 1989.
Prog Oceanogr 47:103-145
Hatch SA, Sanger GA (1992) Puffins as samplers of juvenile pollock and other forage fish in the
Gulf of Alaska. Mar Ecol Prog Ser 80:1-14

8
Hunt GL, McKinnell S (2006) Interplay between top-down, bottom-up, and wasp-waist control in
marine ecosystems. Prog Oceanogr 68:115-124
Loewen ME (2007) Seasonal oceanographic influences on Pacific herring and walleye pollock
distribution and abundance in nearshore embayments of Kodiak Island, Alaska. MS Thesis,
University of Alaska, Fairbanks, AK
Mantua NJ, Hare SR, Zhang Y, Wallace JM, Francis RC (1997) A Pacific interdecadal climate
oscillation with impacts on salmon production. Bull Am Meteorol Soc 78:1069-1079
McKenzie J, Wynne KM (2008) Spatial and temporal variation in the diet of Steller sea lions in
the Kodiak Archipelago, 1999 to 2005. Mar Ecol Prog Ser 360:265-283
Merati N, Brodeur RD (1996) Feeding habits and daily ration of juvenile walleye pollock in the
western Gulf of Alaska. NOAA Tech Rep NMFS-AFSC-126
Merrick RL, Loughlin TR, Calkins DG (1987) Decline in abundance of the Northern Sea Lion,
Eumetopias jubatus, in Alaska, 1956-86. Fish Bull 85:351-365
Merrick RL, Chumbley MK, Byrd GV (1997) Diet diversity of Steller sea lions (Eumetopias
jubatus) and their population decline in Alaska: a potential relationship. Can J Fish Aquat
Sci 54:1342-1348
Methven DA, Piatt JF (1989) Seasonal and annual variation in the diet of Atlantic cod (Gadus
morhua) in relation to the abundance of capelin (Mallotus villosus) off eastern
Newfoundland, Canada. J Du Conseil 45:223-225
Milette LL, Trites AW (2003) Maternal attendance patterns of Steller sea lions (Eumetopias
jubatus) from stable and declining populations in Alaska. Can J Zool 81:340-348
Mitani Y, Watanabe Y, Sato K, Cameron MF, Naito Y (2004) 3D diving behavior of Weddell
seals with respect to prey accessibility and abundance. Mar Ecol Prog Ser 281:275-281
Pahlke KA (1985) Preliminary studies of capelin (Mallotus villosus) in Alaskan waters. MS
Thesis, University of Alaska, Fairbanks, AK

9
Piatt JF, Wetzel J, Bell K, DeGange AR, Balogh GR, Drew GS, Geernaert T, Ladd C, Byrd GV
(2006) Predictable hotspots and foraging habitat of the endangered short-tailed albatross
(Phoebastria albatrus) in the North Pacific: implications for conservation. Deep Sea Res II
53:387-398
Pikitch EK, Santora C, Babcock EA, Bakun A, Bonfil R, Conover DO, Dayton P, Doukakis P,
Fluharty D, Heneman B, Houde ED, Link J, Livingston PA, Mangel M, McAllister MK,
Pope J, Sainsbury KJ (2004) Ecosystem-based fishery management. Science 305:346-347
Pitcher KW (1990) Major decline in number of harbor seals, Phoca vitulina richardsi, on
Tugidak Island, Gulf of Alaska. Mar Mamm Sci 6:121-134
Rosen DAS, Trites AW (2005) Examining the potential for nutritional stress in young Steller sea
lions: physiological effects of prey composition. J Comp Physiol B 175:265-273
Schabetsberger R, Brodeur R, Ciannelli L, Napp JM, Swartzman GL (2000) Diel vertical
migration and interaction of zooplankton and juvenile walleye pollock (Theragra
chalcogramma) at a frontal region near the Pribilof Islands, Bering Sea. ICES J Mar Sci
57:1283-1295
Sinclair EH, Zeppelin TK (2002) Seasonal and spatial differences in diet in the western stock of
Steller sea lions (Eumetopias jubatus). J Mamm 83:973-990
Sinclair EH, Vlietstra LS, Johnson DS, Zeppelin TK, Byrd GV, Springer AM, Ream RR, Hunt
GL (2008) Patterns in prey use among fur seals and seabirds in the Pribilof Islands. Deep
Sea Res II 55:1897-1918
Slater L, Byrd GV (2009) Status, trends, and patterns of covariation of breeding seabirds at St
Lazaria Island, Southeast Alaska, 1994-2006. J Biogeogr 36:465-475
Springer AM, Speckman SG (1997) A forage fish is what? Summary of the symposium. In:
Mecklenburg W (ed) Forage fishes in marine ecosystems. Proc 14th Lowell Wakefield
Fish Symp. University of Alaska Sea Grant College Program, Fairbanks, AK
10
Stabeno PJ, Reed RK, Schumacher JD (1995) The Alaska Coastal Current: continuity of transport
and forcing. J Geophys Res 100:2477-2485
Stabeno PJ, Bond NA, Hermann AJ, Kachel NB, Mordy CW, Overland JE (2004) Meteorology
and oceanography of the Northern Gulf of Alaska. Cont Shelf Res 24:859-897
Swartzman G, Napp J, Brodeur R, Winter A, Ciannelli L (2002) Spatial patterns of pollock and
zooplankton distribution in the Pribilof Islands, Alaska nursery area and their relationship
to pollock recruitment. ICES J Mar Sci 59:1167-1186
Towell RG, Ream RR, York AE (2006) Decline in northern fur seal (Callorhinus ursinus) pup
production on the Pribilof Islands. Mar Mamm Sci 22:486-491
Trites AW, Larkin PA (1996) Changes in the abundance of Steller sea lions (Eumetopias jubatus)
in Alaska from 1956 to 1992: how many were there? Aquat Mamm 22:153-166
Trites AW, Donnelly CP (2003) The decline of Steller sea lions Eumetopias jubatus in Alaska: a
review of the nutritional stress hypothesis. Mamm Rev 33:3-28
Trites AW, Miller AJ, Maschner HDG, Alexander MA, Bograd SJ, Calder JA, Capotondi A,
Coyle KO, Lorenzo EDI, Finney BP, Gregr EJ, Grosch CE, Hare SR, Hunt GL, Jahncke J,
Kachel NB, Kim H-J, Ladd C, Mantua NJ, Marzban C, Maslowski W, Mendelssohn R,
Neilson DJ, Okkonen SR, Overland JE, Reedy-Maschner KL, Royer TC, Schwing FB,
Wang JXL, Winship AJ (2007) Bottom-up forcing and the decline of Steller sea lions
(Eumetopias jubatas) in Alaska: assessing the ocean climate hypothesis. Fish Oceanogr
16:46-67
Verheye HM, Richardson AJ (1998) Long-term increase in crustacean zooplankton abundance in
the southern Benguela upwelling region (1951-1996): bottom-up or top-down control?
ICES J Mar Sci 55:803-807
11
Wilson MT, Jump CM, Duffy-Anderson JT (2006) Comparative analysis of the feeding ecology
of two pelagic forage fishes: capelin (Mallotus villosus) and walleye pollock (Theragra
chalcogramma). Mar Ecol Prog Ser 317:245-258
Winter A, Foy RJ, Wynne K (2009) Seasonal differences in prey availability around a Steller sea
lion haulout and rookery in the Gulf of Alaska. Aquat Mamm 35:145-162
Witteveen BH, Foy RJ, Wynne KM, Tremblay Y (2008) Investigation of foraging habits and prey
selection by humpback whales (Megaptera novaeangliae) using acoustic tags and
concurrent fish surveys. Mar Mamm Sci 24:516-534
Womble JN, Pendleton GW, Mathews EA, Blundell GM, Bool NM, Gende SM (2010) Harbor
seal (Phoca vitulina richardii) decline continues in the rapidly changing landscape of
Glacier Bay National Park, Alaska 1992-2008 . Mar Mamm Sci 26:686-697
Yang MS, Nelson MW (2000) Food habits of the commercially important groundfishes in the
Gulf of Alaska in 1990, 1993, 1996. NOAA Tech Memo NMFS-AFSC-112
Yang MS, Dodd K, Hibpshman R, Whitehouse A (2006) Food Habits of Groundfishes in the Gulf
of Alaska in 1999 and 2001. NOAA Tech Memo NMFS-AFSC-164
York AE (1990) Trends in numbers of pups born on St. Paul and St. George Islands, 1973-1988.
NOAA Tech Memo NMFS-F/NWC-180
Young HS, Shaffer SA, McCauley DJ, Foley DG, Dirzo R, Block BA (2010) Resource
partitioning by species but not sex in sympatric boobies in the central Pacific Ocean. Mar
Ecol Prog Ser 403:291-301
12
Chapter 2:
Underestimation of Dietary Copepods by Stomach Content Analysis: Using
Fatty Acid Analysis to Refine Estimation of Forage Fish Diet Composition1
ABSTRACT
Understanding of forage fish feeding ecology requires an accurate description of diet composition.
Fatty acid and stomach content analyses were combined to estimate diet composition in walleye
pollock (Theragra chalcogramma), Pacific herring (Clupea pallasii), capelin (Mallotus villosus),
and eulachon (Thaleichthys pacificus) collected in embayments around the Kodiak Archipelago,
Alaska. Comparisons between copepod-originated fatty acids and stomach contents in the four
forage fish species indicated the underestimation of dietary copepods by stomach content analysis.
The magnitudes of copepod underestimation could have profound effects on estimation of forage
fish prey consumption. A “copepod-snacking” hypothesis was developed to account for the sharp
contrast between fatty acid and stomach content results. As a valuable supplement to
conventional stomach content analysis, fatty acid analysis should be included in field studies to
better our understanding of forage fish feeding ecology.
1 Prepared for submission to Marine Ecology Progress Series. Guo L, Foy RJ, Schaufler L,
Wynne KM. Underestimation of dietary copepods by stomach content analysis: using fatty acid
analysis to refine estimation of forage fish diet composition.

13
INTRODUCTION
Effectiveness of ecosystem-based fishery management relies on our knowledge of the key
processes in a given ecosystem (Pikitch et al. 2004). In the Gulf of Alaska (GOA), such a key
process is the energy transfer from zooplankton to small fishes of high abundance (Mundy &
Hollowed 2005, Spies 2007). These small fishes, often referred to as forage fishes, play a critical
role in sustaining productive fisheries as adults or as prey of commercially exploited species
(Springer & Speckman 1997). In addition, forage fishes are the main energy conveyor between
zooplankton and piscivorous fishes, marine mammals, and seabirds (Mundy & Hollowed 2005,
Spies 2007). Therefore, understanding the feeding ecology of forage fishes in the GOA is an
essential step to relate population fluctuations of upper trophic level taxa to variability of
plankton production and further to changing climatic forces (Springer & Speckman 1997).
An accurate description of diet composition is required for many aspects of fish feeding
ecology, such as prey selectivity, seasonal or ontogenetic patterns, and inter-species competition
(Gerking 1994). When describing diet composition, stomach content analysis has long been
employed as the standard practice, which quantifies ingested food items temporarily stored in
stomachs prior to their evacuation into intestines. Each type of food item remains in a stomach for
a certain duration, typically measured in gastric evacuation time or rate (Elliott 1972). Food items
with shorter gastric evacuation time tend to be underestimated compared to those with longer
gastric evacuation time, which is a potential error source of stomach content analysis (Hyslop
1980).
The potential bias induced by differential gastric evacuation rates can be problematic in
analyzing forage fish stomachs containing taxa of such diverse sizes as copepods and euphausiids.
In subarctic waters, copepods and euphausiids are usually the two most abundant constituents of
forage fish stomach contents (Astthorsson & Gislason 1997, Brodeur et al. 2000). Forage fishes
start ingesting euphausiids when they attain adequate gape width and swimming speed to capture
14
these relatively large and evasive prey taxa (Huse & Toresen 1996, Brodeur 1998). As fish grow
larger while remaining zooplanktivorous, the relative importance of copepods as prey generally
decreases, whereas the importance of euphausiids increases; over this stage, copepods and
euphausiids commonly co-occur in the same individual stomach (O'Driscoll et al. 2001, Wilson et
al. 2006). Co-occurring prey of differential volumes and exoskeletal chitinization are digested and
passed through fish alimentary tracts at different rates (Hopkins & Larson 1990, Salvanes et al.
1995, Andersen 1999, 2001), potentially leading to the underestimation of small- and soft-bodied
prey (Gannon 1976, Sutela & Huusko 1994). Copepods are considered to be evacuated from
stomachs more rapidly than euphausiids (LeBrasseur & Stephens 1965), which is in agreement
with results from laboratory studies. Brodeur & Pearcy (1987) reported that 90% (by weight) of
ingested euphausiids were evacuated in 28.4 h from stomachs of sub-yearling coho salmon
(Oncorhynchus kisutch) fed to satiation at 11.4°C. The same amount of evacuation took 20.9 h in
adult Arctic charr (Salvelinus alpinus) fed ad libitum at 10.0°C (Amundsen & Klemetsen 1988).
In both experiments, euphausiids were frozen and defrosted in advance, which can cause
exoskeleton degradation and accelerate euphausiid evacuation by various degrees (Temming &
Herrmann 2003). In contrast, the estimated time to evacuate 90% of copepod from stomachs of
juvenile Atlantic herring (Clupea harengus) is 4 – 5 h at 14.9°C (Szypuia & Zalachowski 1984),
which is equivalent to 6 – 8 h at 10.0°C if calculated with temperature-dependent functions
obtained from two experiments in which euphausiids were fed to adult Arctic charr (Amundsen &
Klemetsen 1988) and whiting (Merlangius merlangus, Andersen 1999). Thus, the gastric
evacuation time of euphausiids is expected to be distinctly longer than that of copepods, although
a direct comparison of gastric evacuation rates between the two groups fed to the same fish
species under the same laboratory settings has not been reported. Consequently, the proportions
of ingested copepods can be underestimated in copepod-and-euphausiid mixed stomach contents
in forage fishes. Due to the inherent nature of this bias, alternative methodologies are needed to
15
supplement stomach content analysis in order to achieve a more reliable estimate of forage fish
diet composition.
An alternative methodology is to measure copepod-originated fatty acids in forage fishes as a
semi-quantitative means to evaluate the underestimation of copepods by stomach content analysis.
Fatty acids are structural moieties in most lipid molecules (Christie 2003): fatty acids are
typically esterified to alcohol groups (e.g., in glycerides) or amino groups (e.g., in sphingolipids).
In marine plankton and fishes, fatty acids are commonly composed of 14 to 24 carbon atoms and
up to six double bonds (see previous reviews for details of fatty acid structures, functions, and
metabolism, e.g., Ackman & McLachlan 1968, Sargent & Henderson 1986, Tocher 2003). To
date, calanoid copepods are the only known marine organisms capable of de novo biosynthesis of
considerable amounts of 20:1 (20 carbon atoms and one double bond) and 22:1 fatty acids and
fatty alcohols (Sargent & Henderson 1986; also as a reference for structures, functions, and
biosynthesis of fatty alcohols in copepods). Several high latitude species of calanoid copepods
deposit lipids predominately as wax esters, where 20:1 and 22:1 fatty acids and fatty alcohols
account for up to half of the total lipid weight (Sargent & Henderson 1986, Saito & Kotani 2000).
In zooplanktivorous fishes, dietary fatty alcohols are efficiently oxidized into fatty acids while
dietary fatty acids are directly absorbed with little alteration (Patton & Benson 1975, Sargent et al.
1979). As a result, both 20:1 and 22:1 fatty alcohols and fatty acids from copepods are deposited
as 20:1 and 22:1 fatty acids in fishes (Tocher 2003). Furthermore, 22:1 fatty acids are catabolized
faster than 20:1 fatty acids and both are catabolized faster than other fatty acids in fishes (Pascall
& Ackman 1976, Sargent 1976). For example, in capelin, selective oxidation of 20:1 and 22:1
fatty acids during sexual maturation resulted in only trace amounts of these fatty acids in roe
lipids in contrast to the high concentrations in the lipids of parental fish (Henderson et al.
1984a,b). Preferential utilization of 20:1 and 22:1 fatty acids reduces the relative abundance of
these fatty acids in predator lipids compared to in prey lipids; in other words, the relative
16
abundance of 20:1 and 22:1 fatty acids and fatty alcohols in consumed zooplankton should be
greater than that of 20:1 and 22:1 fatty acids in zooplanktivorous fish. Thus, the presence and
relative abundance of 20:1 and 22:1 fatty acids in forage fishes serve as indirect evidence for the
importance of calanoid copepods as prey items for these fish species (Sargent & Henderson 1986,
Dalsgaard et al. 2003).
In this study, we compared results of fatty acids and stomach contents in four forage fish
species, walleye pollock (Theragra chalcogramma), Pacific herring (Clupea pallasii), capelin
(Mallotus villosus), and eulachon (Thaleichthys pacificus), collected from embayments around
the Kodiak Archipelago, Alaska. Specifically, copepod-originated fatty acids in forage fishes
were measured to deduce the proportions of dietary copepods, which were then used to evaluate
the underestimation of copepods through stomach content analysis. We hypothesized that
copepod proportions in copepod-and-euphausiid mixed stomach contents would be lower than
those derived from fatty acid analysis, because of differential gastric evacuation rates between
copepods and euphausiids. By combining the two methodologies, our goal was to refine the
understanding of forage fish feeding ecology in order to better discriminate trophic connections
and therefore elucidate ecosystem functioning.
MATERIALS AND METHODS
Forage fishes were collected during acoustic-trawl surveys in four embayments of the
Kodiak Archipelago, Alaska: Uganik, Tonki, Perenosa, and Paramanof Bay (Fig. 2.1). A total of
81 midwater trawls were conducted in May and August of 2004 and 2005, November 2006, and
April 2007 (Fish Resource Permits authorized by Alaska Department of Fish and Game were held
for all sample collections and are documented in Appendix A). The trawl net was equipped with a
modified codend of 10 cm mesh and 2.5 cm mesh liner. Sample length ranges were targeted to
include stages in which fishes are expected to feed on both copepods and euphausiids, which
17
would allow us to test the hypothesis that copepods are underestimated in the presence of
co-existing euphausiids by conventional stomach content analysis. Trawls were deployed during
daylight hours to groundtruth acoustic data collected to estimate fish biomass. For this study, we
focused on four species that consistently dominated net catches: walleye pollock, Pacific herring,
capelin, and eulachon. For fatty acid analysis, specimens of whole fish were placed in air-tight
containers and stored at -20°C on board; after each survey, samples were vacuum-packed and
stored at -30°C until analysis. For stomach content analysis, samples were preserved in 10%
seawater-buffered formalin solution. Stomachs of fish larger than 30 cm in total length (TL) were
excised between esophagus and pylorus and preserved individually in nylon bags; fish of
15 – 30 cm TL were immersed in formalin solution with abdominal incisions to expose stomachs;
and whole bodies of fish smaller than 15 cm were directly immersed into formalin solution.
Zooplankton samples were collected concurrently for fatty acid analysis to ensure that
copepod-originated fatty acids were not present in large amounts in other zooplankton taxa,
particularly in euphausiids. Sampling gears included a triple-net Tucker Trawl (1 m2 opening,
300 µm mesh), a bongo trawl (both 0.75 m diameter opening, 500 and 1000 µm mesh), and a ring
net (0.75 m diameter opening, 130 µm mesh). The Tucker and bongo trawls were employed
opportunistically and towed obliquely while the ring net was employed systematically at
predesignated stations and towed vertically. On board, net contents were sorted into four groups:
copepods, euphausiids including adults and juveniles, chaetognaths, and pteropods, which are
known important prey taxa of forage fishes in the GOA (Brodeur 1998, Wilson et al. 2006).
Samples were preserved the same way as fish samples for fatty acid analysis.
Copepod-originated fatty acids were quantified for both fish and zooplankton samples.
Lipids were extracted from individually homogenized whole fish, following the modified Folch
method (Folch et al. 1957, Ways & Hanahan 1964). In brief, lipids in aliquots of 1.5 g
homogenates were extracted with the solvent mixture of 20 mL chloroform and 10 mL methanol.

18
Lipid content was calculated gravimetrically as percentage of whole-body wet weight. Lipids in
zooplankton samples of the four groups were extracted the same way as in fish samples. After
lipid extraction, a total of 252 fish and 80 zooplankton samples were further analyzed for fatty
acid composition. Hilditch reagent was used to catalyze the transesterification of extracted lipids
in aliquots of ~ 0.3 mg at 55 – 60 °C for 18 h and the resulting fatty acid methyl esters were
washed with 5% NaCl and extracted with hexane (Christie 2003). Using a Varian Saturn 2200
GC/MS, a total of 37 fatty acids were quantified to the nearest nanogram against calibration
curves established for each batch of transesterified lipid samples (8 – 20 samples for one batch).
Three copepod-originated fatty acid isomers, 20:1n-11, 20:1n-9, and 22:1n-11 (Dalsgaard et al.
2003; n-11: double bond is between 11th and 12th carbon atoms, counting from terminal methyl
group of the molecule) were reported in weight percentage of the 37 quantified fatty acids,
referred to as content hereafter. The two isomers 20:1n-11 and 20:1n-9 were summed as
20:1n-11/9. Fatty alcohols, especially 20:1 and 22:1 isomers, were expected to occur in large
amounts in copepod samples, while to be absent or negligible in samples of fish and the three
other zooplankton groups collected (Sargent & Henderson 1986). Therefore, fatty alcohols were
only qualitatively assessed for both fish and zooplankton samples to confirm that copepods were
the sole group with 20:1 and 22:1 fatty alcohols.
Fish stomach content analysis was focused on the occurrence of copepods and euphausiids in
order to compare with our fatty acid results. In the lab, fish were measured for TL to the nearest
0.1 cm and whole-body wet weight to the nearest 0.01 g. Excised stomach contents were weighed
to the nearest 0.001 g, identified to the lowest taxonomic or developmental level possible and
counted. Prey items that were unidentifiable due to digestion were not quantified. To facilitate
comparison between stomach content and fatty acid results, prey were combined into broad
taxonomic and developmental categories. Euphausiids of different developmental stages were
reported in two groups: 1) adults and juveniles, and 2) furcilia stages, calyptopis stages, and eggs.
19
Copepods of various species and developmental stages were merged into a single copepod
category. This taxonomic compromise conformed to the coarse level adopted in fatty acid
analysis of concurrently collected zooplankton, which enabled direct comparisons of the two
datasets.
For each fish species, month, and embayment, samples were grouped into length categories,
which were based on length modes derived from length frequency histograms in respective
months. The same length categories were applied to samples for both fatty acid and stomach
content analyses. Each fish group, which is specific to species, month, embayment, and length
category, was used as a unit for calculation. Statistical comparisons of copepod-originated fatty
acid contents among groups were subjected to Mann-Whitney U or Kruskal Wallis test. Stomach
content composition in each group was reported in terms of mean numerical percentage,
percentage frequency of occurrence, and mean prey-specific numerical percentage. Calculation of
mean prey-specific numerical percentage only involves stomachs containing the prey in question,
instead of all stomachs (Amundsen et al. 1996). Stomach fullness (%) was calculated as the
weight of stomach contents divided by fish whole-body wet weight. Correlations between
stomach fullness and TL were measured by Spearman Rho values.
RESULTS
Fatty acid contents (% of total quantified fatty acids) of 20:1n-11/9 and 22:1n-11 varied in
fish samples among species, months, embayments, and length categories (Table 2.1). For
example, values in walleye pollock collected in August 2004 were higher in Uganik Bay than in
those of similar TL in Tonki Bay (p < 0.01). In all fish samples, 20:1 or 22:1 fatty alcohols were
negligible.
In zooplankton samples, fatty acid contents of 20:1n-11/9 and 22:1n-11 varied among
taxonomic groups and months (Table 2.2). In particular, values in euphausiids were relatively low,

20
with a maximum of 3.15% for 20:1n-11/9 and 3.38% for 22:1n-11. In addition, 20:1 or 22:1 fatty
alcohols were found in large amounts in copepods, while they were negligible in euphausiids,
chaetognaths, or pteropods.
Both copepods and euphausiids were encountered in fish stomach contents (Table 2.3),
which satisfied the premise of our hypothesis. Stomachs were empty in 2.5%, 3.4%, 2.8%, and
4.4% of sampled walleye pollock, Pacific herring, capelin, and eulachon, respectively. In 1,043
non-empty stomachs, adult and juvenile euphausiids (hereafter euphausiids) had the highest mean
numeric percentage in all fish species, followed by copepods (Table 2.3). All adult herring,
capelin, and eulachon were entirely zooplanktivorous.
Comparison between fatty acid and stomach content results displayed a re-occurring
discrepancy: high contents of copepod-originated fatty acids were coupled with low numerical
percentage of copepods in stomach contents. The scope and extent of the discrepancy varied
among fish species. In walleye pollock, for example, fatty acid and stomach content results of
most sample groups were in agreement. Exceptions were observed in samples of TL range
32.5 – 43.5 cm from Uganik Bay in August 2004 and of TL range 10.0 – 12.4 cm, 19.7 – 24.8 cm,
and 26.0 – 41.0 cm from Uganik Bay in November 2006; in each of these cases, 20:1n-11/9 and
22:1n-11 fatty acid contents were higher than in other pollock groups (p < 0.01) and about three
times higher than those in concurrent euphausiid samples (Tables 2.1 & 2.2). In contrast, stomach
contents of corresponding groups were mostly composed of euphausiids and not of copepods
(Table 2.4). In Pacific herring, the discrepancy was more widespread and profound than in
pollock. In November, relatively large herring (25.7 – 29.3 cm TL) had significantly higher
20:1n-11/9 and 22:1n-11 fatty acid contents (p < 0.01) but fewer copepods in their stomachs
compared to relatively small herring (13.6 – 22.3 cm TL). In April, 20:1n-11/9 and 22:1n-11 fatty
acids combined accounted for 35.64% of herring lipids by weight; at the same time, copepods
were not found in herring stomachs. In capelin, the discrepancy between fatty acid and stomach
21
content results was shown consistently in relatively large individuals (> 10.0 cm TL), which had
high contents of copepod-originated fatty acids but few or no copepods in their stomachs. In
eulachon, there was no disagreement between fatty acid and stomach content results.
The consistent discrepancy between fatty acid and stomach content results in large capelin
(> 10.0 cm TL) was coupled with unique patterns in capelin stomach contents and fullness. As in
pollock and herring, larger capelin contained fewer copepods and more euphausiids in stomachs
than smaller capelin (≤ 10.0 cm TL); but unlike pollock or herring in which the change of prey
composition was gradual, capelin abruptly shifted their stomach contents from a combination of
Cirripedia (barnacle nauplii and cyprids) and copepods to stomach contents containing primarily
euphausiids (Table 2.4). The ontogenetic pattern of stomach fullness in capelin was the opposite
of other species (Fig. 2.2): stomach fullness was positively correlated with TL in capelin
(Rho = 0.41), while the correlation was negative in other species (Rho = -0.52, -0.30, and -0.63
for pollock, herring, and eulachon, respectively, all p < 0.05). Samples collected in different
months were combined.
Differences in diet composition among certain groups were indicated by fatty acid results but
not displayed in stomach contents results. Significant differences in copepod-originated fatty acid
content were found between groups of similar stomach contents. For example, in relatively large
capelin (> 10.0 cm TL) collected in May 2005, 20:1n-11/9 and 22:1n-11 fatty acid contents were
lower in Uganik Bay than in Tonki Bay (p < 0.01, Table 2.1), while stomach contents of both
groups were identical (Table 2.4). In herring collected in April 2007, 20:1n-11/9 and 22:1n-11
fatty acid contents were lower in Uganik Bay than in Tonki Bay (p ≤ 0.02), while stomach
contents of both groups were not different (100% euphausiids in both groups). In both of the
capelin and herring examples, the same spatial patterns were observed: 1) samples in Uganik Bay
showed lower contents of copepod-originated fatty acids than in Tonki Bay; 2) lipid content was
not different between comparing groups (p ≥ 0.36). Different spatial patterns were found in

22
relatively large pollock (32.5 – 37.0 cm TL) collected in August 2004: 20:1n-11/9 and 22:1n-11
fatty acid contents, as well as lipid content, were higher in Uganik Bay than in Tonki Bay
(p < 0.01).
DISCUSSION
It has been concluded that 20:1 and 22:1 fatty acids in planktivorous fishes, originated from
20:1 and 22:1 fatty acids and fatty alcohols in copepods, are catabolized at higher rates than other
fatty acids (Pascall and Ackman 1976, Sargent 1976, Tocher 2003). In this study, we made an
assumption that the four study species (walleye pollock, Pacific herring, capelin, and eulachon)
are not exceptions to this conclusion. The rate differentials mean that the contents (% of total
fatty acids) of 20:1 and 22:1 fatty acids in forage fishes cannot be higher than those in their diets;
in other words, relatively high contents of 20:1 and 22:1 fatty acids in forage fishes cannot be
obtained from diets of relatively low 20:1 and 22:1 contents (either fatty acids or fatty alcohols).
The recurring discrepancy between high contents of copepod-originated fatty acids and low
numerical percentages of copepods in stomach contents of the four forage fish species suggests
that dietary copepods were underestimated by stomach content analysis. An alternative
explanation for the discrepancy would be that 20:1 and 22:1 fatty acids in fish were obtained from
consuming euphausiids that had fed on copepods, because the discrepancy typically co-occurred
with a dominance of euphausiids in stomach contents. In other words, euphausiids could have
served as an intermediate between copepods and fish. However, concurrent euphausiid samples
showed fairly low contents of 20:1 and 22:1 fatty acids and no 20:1 and 22:1 fatty alcohols. It is
possible that we may have under-sampled the portion of euphausiids that may have specialized on
consuming copepods, because our euphausiid samples included adults and juveniles of various
species. Nevertheless, it is still unlikely that copepod-eating euphausiids would have such high
20:1 and 22:1 fatty acid contents. Due to size restriction, euphausiids typically consume copepod
23
eggs, nauplii, and early stages of copepodites (Bamstedt & Karlson 1998, Nakagawa et al. 2003),
which have negligible to low contents of 20:1 and 22:1 fatty acids and fatty alcohols compared to
later stages of copepodites and adults (Sargent & Henderson 1986, Saito & Kotani 2000). Local
copepod species rich in 20:1 and 22:1 fatty acids and fatty alcohols are of the genus Neocalanus
and Calanus (Sargent & Henderson 1986, Saito & Kotani 2000), of which the late stages of
copepodites and adults are considerably larger than copepods found in euphausiid stomachs
(Bamstedt & Karlson 1998, Nakagawa et al. 2003). Because 20:1 and 22:1 fatty acid content
cannot be enriched from the low levels observed in euphausiids, it is unlikely that euphausiids as
an intermediate could account for the large amounts of copepod-originated fatty acids in fish
samples. Therefore, the discrepancy between fatty acid and stomach content results must be
viewed as indirect evidence that copepods were underestimated by stomach content analysis.
The magnitudes of copepod underestimation by stomach content analysis displayed large
ranges and varied by sample groups that were formed based on different fish species, months, and
embayments. In sample groups in which 20:1 and 22:1 fatty acid contents were similar to those in
concurrent euphausiid samples, the underestimation was negligible. In contrast, in sample groups
where 20:1 and 22:1 fatty acid contents were much higher than those in concurrent euphausiid
samples, the magnitude of copepod underestimation could be enormous. For example, in herring
of 15.9 – 16.8 cm TL in Uganik Bay in April 2007, the weight ratio between ingested copepods
(WC) and euphausiids (WE) was estimated through the formula
(WC × LC × FAC + WE × LE × FAE) / (WC × LC + WE × LE) = 31.29%,
where L is lipid content (%), FA is the sum of 20:1n-11/9 and 22:1n-11 fatty acid and fatty
alcohol content (%), subscript letters C and E represent copepods and euphausiids, respectively,
and 31.3% is the sum of mean 20:1n-11/9 and 22:1n-11 fatty acid content of the herring group.
We assumed that 20:1 and 22:1 fatty acids in herring were exclusively from copepods and
euphausiids. Values for LC and FAC are 5.3% and 54.5% (calculation based on Neocalanus
24
cristatus of the 4th copepodite stage in Saito & Kotani 2000, assuming 90% as moisture content);
values of LE and FAE are 2.9% and 4.1%. The ratio of WC to WE was calculated to be 0.63:1. If
the weight of juvenile Thysanoessa inermis was used to represent euphausiids, which are on
average 9.1 times heavier than an individual Neocalanus cristatus of the 4th copepodite stage (K.
Coyle, unpubl. data), the weight ratio was 5.7:1. This calculation suggests that 5.7 times more
copepods than euphausiids were consumed by herring; this estimation is in sharp contrast to our
observation of no copepods in herring stomach contents. Unfortunately, similar calculations in
other months were impossible due to the lack of copepod fatty acid data. However, we did
observe a sharp contrast between the fatty acid contents and stomach contents in several sample
groups of herring and capelin; these results clearly indicate a large magnitude of copepod
underestimation by standard stomach content analysis.
The underestimation of dietary copepods by stomach content analysis can have profound
effects on estimating prey consumption of forage fishes. Two different sets of models, one based
on bioenergetics and the other based on gastric evacuation rates, have been widely applied to
estimate prey consumption (Hansen et al. 1993, Bromley 1994). Models based on bioenergetics
require at least ten different physiological parameters (Ney 1993), which are only available for a
limited number of fish species. Models based on gastric evacuation rates rely on the accuracy of
these estimated rates. After sampling fish stomachs at different time intervals, weight changes in
stomach contents over a certain period, mostly 24 h, are fit into four primary models and their
derivatives (Richter et al. 2002). However, if the proportions of ingested copepods are
underestimated by stomach content analysis, these underestimates will propagate through
subsequent calculations of gastric evacuation rates, daily ration, and prey consumption. Our
calculation showed that the magnitude of copepod underestimation can be substantial. Therefore,
stomach content analysis for forage fishes should be used with caution before we know more
about in-situ feeding behavior, especially when this method is used to estimate prey consumption.

25
Different temporal scales associated with fatty acid and stomach content analysis may
partially explain copepod underestimation by stomach content analysis, but cannot fully account
for the large magnitudes of underestimation in certain groups. Fatty acid composition of fish
tissues is an integrated result of dietary lipids consumed over the past one to several weeks
(Anderson & Arthington 1989, Kirsch et al. 1998, Jobling 2004), depending on fatty acid
turnover rates in tissues, which can be affected by multiple factors, such as fish size and
temperature (Sargent et al. 1999, Jobling & Bendiksen 2003). In contrast, stomach contents of
zooplanktivorous fishes represent a snap-shot of prey items ingested over the previous several
hours to several days (Szypuia & Zalachowski 1984, Brodeur & Pearcy 1987). The difference in
the temporal scales between these two methodologies leads to the possibility that potential
copepod-eating phases were missed during stomach sampling but captured with fatty acid
analysis. Because we only sampled in daylight hours and for periods of two to three days in each
embayment, the discrepancy could have resulted from nocturnal ingestion of copepods or from a
sudden prey switch from copepods to euphausiids during our sampling periods by local forage
fishes. However, neither of these scenarios were reported in previous studies; to the contrary,
euphausiids were more important prey than copepods at night and in all sampling periods for
fishes of similar lengths (Brodeur & Pearcy 1987, Merati & Brodeur 1996, Brodeur 1998,
Brodeur et al. 2000, Wilson et al. 2006, Adams et al. 2007). In addition, the high levels of 20:1
and 22:1 fatty acids in several sample groups of herring and capelin would have required these
fish to ingest substantial amounts of copepods, outnumbering euphausiids by multiple factors. It
is unlikely that such large quantities of copepods could have been ingested at night but would
have not been detectable at all during the day or in any of the previous studies. Therefore, time of
day or length of sampling alone cannot account for the large magnitudes of copepod
underestimation by stomach content analysis.
26
To explain the sharp contrast between fatty acid and stomach content results, we developed a
hypothesis based on observed prey-specific numerical percentages and reported internal dynamics
of fish stomachs. Prey-specific numerical percentages of euphausiids ranged on average from
70.78% to 97.37% for the four forage fish species (Table 2.3), which are similar to those
presented by Wilson et al. (2006). These values indicate that in stomachs containing euphausiids,
euphausiids on average outnumbered the sum of all other prey taxa. The number of euphausiids in
a single stomach was typically less than ten; therefore, the number of copepods in a single
stomach would have averaged less than ten whenever euphausiids were present. Because the
gastric evacuation rate of a single prey type will not be affected by the presence of other prey
types in the same stomach (Macdonald et al. 1982, Sutela & Huusko 1994, Singh-Renton &
Bromley 1996), an individual adult copepod is expected to be evacuated faster than an individual
adult euphausiid from the same fish stomach (LeBrasseur & Stephens 1965, Szypuia &
Zalachowski 1984, Brodeur & Pearcy 1987). Since a higher number of individual prey take
longer to be evacuated (Persson 1981, Bromley 1994, Andersen 1998), the coexistence of
copepods in small quantities and euphausiids in large quantities in fish stomachs should amplify
the differences in gastric evacuation rates between these two prey groups. In addition, internal
dynamics of stomachs may further widen the differences. Specifically, Bernreuther et al. (2008)
reported that when a copepod was ingested by a juvenile Atlantic herring (Clupea harengus) with
a relatively full stomach, the newly-ingested copepod was pushed directly toward the intestine
instead of being pushed to the back of the stomach where previously ingested prey items were
stored. Thus, if a small number of copepods are ingested into a stomach mostly occupied by
euphausiids, it is possible that these copepods are directly pushed toward the intestine and
preferentially evacuated from the stomachs.
The small quantities and fast gastric evacuation rates of copepods led us to develop a
“copepod-snacking” hypothesis. Specifically, we suggest that local forage fishes may capture
27
copepods on multiple occasions within 24 h, but in relatively small quantities on each occasion.
These ingested copepods would then be quickly evacuated from fish stomachs, while euphausiids
are broken down more slowly in the same stomachs. Because the numbers of copepods do not
accumulate over time, the ratio of copepods to euphausiids present in the stomachs at any given
moment will lead to an underestimation of the ratio of total copepods to total euphausiids
ingested over a 24-h period. This could explain the sharp contrast we observed between fatty acid
and stomach content results.
If such a “copepod-snacking” behavior occurred, it is more likely to happen during daylight
hours. Although feeding activities of many forage fishes peak at night or during twilight hours
(Vesin et al. 1981, Wilson et al. 2006), numerical percentages of copepods in stomach contents
are often the highest during daylight hours (Merati & Brodeur 1996, Brodeur et al. 2000). If both
are consumed at night, copepods are unlikely to outlast euphausiids throughout the duration of
digestion; hence, increased numerical percentages of copepods during daylight hours indicate
copepod consumption beyond peak feeding time. In addition, because copepods are less
pigmented than euphausiids, capturing copepods during daylight hours is more feasible for visual
predators and more energetically efficient than during nighttime. For Atlantic herring, for
example, prey capture by biting individual copepods requires better light condition but costs less
energy per captured prey than by filter feeding (Gibson & Ezzi 1992).
Such a “copepod-snacking” behavior would have multiple advantages. When reaching
adequate size, local forage fishes typically ingest euphausiids at night or twilight hours until
stomachs become relatively full (Merati & Brodeur 1996, Wilson et al. 2006), exemplified by
capelin in this study. We noticed that capelin stomachs that contained euphausiids were more
stretched when compared visually to those that contained no euphausiids. This was also the
reason why larger capelin showed higher stomach fullness (Fig. 2.2), an ontogenetic pattern
different from most fish species (Brett 1971, Hyslop 1980). Gill & Hart (1998) reported that

28
relatively large prey were consumed by three-spined stickleback (Gasterosteus aculeatus) until
their stomachs were full; afterwards, prey of similar sizes were rejected while smaller prey were
still consumed. It is probable that fishes in our study, after consuming euphausiids, switched to
copepods due to the constraint imposed by remaining stomach storage space (Hart & Ison 1991).
In addition, copepods are more abundant and richer in lipids than euphausiids. In local waters and
adjacent areas, copepods are considered more available to forage fishes than euphausiids (Incze et
al. 1997, Brodeur 1998, Coyle & Pinchuk 2003). In late copepodite stages, which dominated our
copepod samples, lipids generally comprise more than half of whole-body dry mass (Hakanson
1984, Sargent & Henderson 1986, Miller et al. 2000, Irigoien 2004); in contrast, the maximum
lipid content of whole-body dry mass in local euphausiids is 20% (L. Guo & R. Foy, unpubl.
data). Therefore, when euphausiids can no longer be accommodated due to stomach storage
constraints, it is energetically beneficial for fishes to switch to more readily-available and
lipid-richer copepods, which are also smaller and accordingly less evasive than euphausiids
(Okubo 1987, Vogel 1996). Compared to the conventional dichotomy of feeding vs. non-feeding
periods within 24 h, intermittent ingestion of copepods after intensive ingestion of euphausiids
enables zooplanktivorous fishes to maximize their energetic gain in a much larger time frame.
The extent of “copepod-snacking” is specific to fish species and area. In this study, capelin
displayed the most consistent discrepancy between stomach content and fatty acid results,
followed by herring. These two species are expected to frequently “snack” on copepods. In
contrast, pollock and eulachon appear less likely to engage in such a behavior, based on their
generally low 20:1 and 22:1 fatty acid content. A key aspect of this behavior is large quantities of
euphausiids present in stomachs, which requires relatively high euphausiid availability. Merati &
Brodeur (1996) reported that age-0 pollock near the Kodiak Archipelago consumed more
euphausiids than those from other nearshore areas of the western GOA, with the latter mainly
consuming larvaceans. It is possible that such a “copepod-snacking” behavior is not significant in
29
areas of low euphausiid availability, where other prey such as copepods have to be consumed in
large amounts during peak feeding periods.
In forage fish field studies, fatty acid analysis is a valuable supplement to conventional
stomach content analysis, especially when survey frequency or length is restricted. Compared to
stomach contents, fatty acid composition infers dietary information on a larger temporal scale and
therefore is less affected by temporal oceanographic events. An event common in embayments is
the pulsed elevation of meroplankton abundance, with each of these pulses typically lasting one
to several days (Shanks 1986, Shanks & Wright 1987, Farrell et al. 1991, Alexander &
Rougharden 1996). In this study, stomach contents showed that barnacle nauplii were the major
prey of small capelin from Tonki Bay in August 2004, while fatty acid compositions indicated a
major consumption of copepods. These conflicting results suggest that, since barnacle nauplii are
generally not positively selected by forage fishes (Brodeur 1998, Wilson et al. 2006), our two-day
sampling effort in Tonki Bay may have overlapped with temporally high abundance of barnacle
nauplii, which was, however, not representative of the previous weeks. In addition, since stomach
content analysis is only a snap-shot of the consumed prey items, it is impossible to capture dietary
differences beyond the immediate sampling periods. In this study, differences in diet composition
were suggested in several cases by significant inter-embayment differences in 20:1 and 22:1 fatty
acid contents, while stomach contents were identical between the compared embayments. On the
other hand, it has to be noted that the costs of fatty acid analysis are considerably higher than
stomach content analysis. However, the gain of using this method is apparent from the results of
this study. In addition, we were able to make statistical comparisons and detect significant
differences with relatively small sample sizes, because individual variation in fatty acid
composition within sample groups was relatively small.
30
In conclusion, the results of this study demonstrate the need to use fatty acid analysis, in
concert with stomach content analysis, to provide more diversified and reliable results on diet
composition in order to refine our understanding of forage fish feeding ecology.
LITERATURE CITED
Ackman RG, McLachlan J (1968) Marine phytoplankter fatty acids. J Fish Res Board Can
25:1603-1620
Adams CF, Pinchuk AI, Coyle KO (2007) Seasonal changes in the diet composition and prey
selection of walleye pollock (Theragra chalcogramma) in the northern Gulf of Alaska.
Fish Res 84:378-389
Alexander SE, Roughgarden J (1996) Larval transport and population dynamics of intertidal
barnacles: a coupled benthic/oceanic model. Ecol Monogr 66:259-275
Amundsen PA, Klemetsen A (1988) Diet, gastric evacuation rates and food consumption in a
stunted population of Arctic charr, Salvelinus alpinus L, in Takvatn, northern Norway. J
Fish Biol 33:697-709
Amundsen PA, Gabler HM, Staldvik FJ (1996) A new approach to graphical analysis of feeding
strategy from stomach contents data - modification of the Costello (1990) method. J Fish
Biol 48:607-614
Andersen NG (1998) The effect of meal size on gastric evacuation in whiting. J Fish Biol
52:743-755
Andersen NG (1999) The effects of predator size, temperature, and prey characteristics on gastric
evacuation in whiting. J Fish Biol 54:287-301
Andersen NG (2001) A gastric evacuation model for three predatory gadoids and implications of
using pooled field data of stomach contents to estimate food rations. J Fish Biol
59:1198-1217
31
Anderson AJ, Arthington AH (1989) Effect of dietary lipid on the fatty acid composition of silver
perch (Leiopotherapon bidyanus) lipids. Comp Biochem Physiol, B 93:715-720
Astthorsson OS, Gislason A (1997) On the food of capelin in the subarctic waters north of
Iceland. Sarsia 82:81-86
Bamstedt U, Karlson K (1998) Euphausiid predation on copepods in coastal waters of the
Northeast Atlantic. Mar Ecol Prog Ser 172:149-168
Bernreuther M, Herrmann JP, Temming A (2008) Laboratory experiments on the gastric
evacuation of juvenile herring (Clupea harengus L.). J Exp Mar Biol Ecol 363:1-11
Brett JR (1971) Satiation time, appetite, and maximum food intake of sockeye salmon
(Oncorhynchus nerka). J Fish Res Board Can 28:409-415
Brodeur RD (1998) Prey selection by age-0 walleye pollock, Theragra chalcogramma, in
nearshore waters of the Gulf of Alaska. Environ Biol Fishes 51:175-186
Brodeur RD, Pearcy WG (1987) Diel feeding chronology, gastric evacuation and estimated daily
ration of juvenile coho salmon, Oncorhynchus kisutch (Walbaum), in the coastal marine
environment. J Fish Biol 31:465-477
Brodeur RD, Wilson MT, Ciannelli L (2000) Spatial and temporal variability in feeding and
condition of age-0 walleye pollock (Theragra chalcogramma) in frontal regions of the
Bering Sea. ICES J Mar Sci 57:256-264
Bromley PJ (1994) The role of gastric evacuation experiments in quantifying the feeding rates of
predatory fish. Rev Fish Biol Fish 4:36-66
Christie WW (2003) Lipid Analysis. The Oily Press, Bridgewater, UK
Coyle KO, Pinchuk AI (2003) Annual cycle of zooplankton abundance, biomass and production
on the northern Gulf of Alaska shelf, October 1997 through October 2000. Fish Oceanogr
12:327-338
32
Dalsgaard J, St John M, Kattner G, Hagen W (2003) Fatty acid trophic markers in the pelagic
marine environment. Adv Mar Biol 46:225-340
Elliott JM (1972) Rates of gastric evacuation in brown trout, Salmo trutta L. Freshwat Biol
2:1-18
Farrell TM, Bracher D, Roughgarden J (1991) Cross-shelf transport causes recruitment to
intertidal populations in central California. Limnol Oceanogr 36:279-288
Folch J, Lees M, Sloane-Stanley GH (1957) A simple method for the isolation and purification of
total lipids from animal tissues. J Biol Chem 226:497-509
Gannon JE (1976) The effects of different digestion rates of zooplankton by alewife, Alosa
pseudoharengus, on determinations of selective feeding. Trans Am Fish Soc 105:89-95
Gerking SD (1994) Feeding ecology of fish. Academic Press, New York
Gibson RN, Ezzi IA (1992) The relative profitability of particulate- and filter-feeding in the
herring, Clupea harengus L. J Fish Biol 40:577-590
Gill AB, Hart PJB (1998) Stomach capacity as a directing factor in prey size selection of
three-spined stickleback. J Fish Biol 53:897-900
Hakanson JL (1984) The long and short term feeding condition in field-caught Calanus pacificus,
as determined from the lipid content. Limnol Oceanogr 29:794-804
Hansen MJ, Boisclair D, Brandt SB, Hewett SW, Kitchell JF, Lucas MC, Ney JJ (1993)
Applications of bioenergetics models to fish ecology and management: Where do we go
from here? Trans Am Fish Soc 122:1019-1030
Hart PJB, Ison S (1991) The influence of prey size and abundance, and individual phenotype on
prey choice by the three-spined stickleback, Gasterosteus aculeatus L. J Fish Biol
38:359-372

33
Henderson RJ, Sargent JR, Hopkins CCE (1984a) Changes in the content and fatty acid
composition of lipid in an isolated population of the capelin Mallotus villosus during
sexual maturation and spawning. Mar Biol 78:255-263
Henderson RJ, Sargent JR, Pirie BJS (1984b) Fatty acid catabolism in the capelin, Mallotus
villosus (Müller), during sexual maturation. Mar Biol Lett 5:115-126
Hopkins TE, Larson RJ (1990) Gastric evacuation of three food types in the black and yellow
rockfish Sebastes chrysomelas (Jordan and Gilbert). J Fish Biol 36:673-681
Huse G, Toresen R (1996) A comparative study of the feeding habits of herring (Clupea harengus,
Clupeidae, L) and capelin (Mallotus villosus, Osmeridae, Muller) in the Barents Sea. Sarsia
81:143-153
Hyslop EJ (1980) Stomach contents analysis - a review of methods and their application. J Fish
Biol 17:411-429
Incze LS, Siefert DW, Napp JM (1997) Mesozooplankton of Shelikof Strait, Alaska: abundance
and community composition. Cont Shelf Res 17:287-305
Irigoien X (2004) Some ideas about the role of lipids in the life cycle of Calanus finmarchicus. J
Plankton Res 26:259-263
Jobling M (2004) 'Finishing' feeds for carnivorous fish and the fatty acid dilution model.
Aquacult Res 35:706-709
Jobling M, Bendiksen EA (2003) Dietary lipids and temperature interact to influence tissue fatty
acid compositions of Atlantic salmon, Salmo salar L., parr. Aquacult Res 34:1423-1441
Kirsch PE, Iverson SJ, Bowen WD, Kerr SR, Ackman RG (1998) Dietary effects on the fatty acid
signature of whole Atlantic cod (Gadus morhua). Can J Fish Aquat Sci 55:1378-1386
LeBrasseur RJ, Stephens K (1965) Relative rates of degradation of some organisms consumed by
marine salmon. J Fish Res Board Can 22:1563-1564
34
Macdonald JS, Waiwood KG, Green RH (1982) Rates of digestion of different prey in Atlantic
cod (Gadus morhua), ocean pout (Macrozoarces americanus), winter flounder
(Pseudopleuronectes americanus), and American plaice (Hippoglossoides platessoides).
Can J Fish Aquat Sci 39:651-659
Merati N, Brodeur RD (1996) Feeding habits and daily ration of juvenile walleye pollock in the
western Gulf of Alaska. NOAA Tech Rep NMFS-AFSC-126
Miller CB, Crain JA, Morgan CA (2000) Oil storage variability in Calanus finmarchicus. ICES J
Mar Sci 57:1786-1799
Mundy PR, Hollowed A (2005) Fish and shellfish. In: Mundy PR (ed) The Gulf of Alaska:
Biology and Oceanography. University of Alaska Sea Grant, Fairbanks, AK
Nakagawa Y, Endo Y, Sugisaki H (2003) Feeding rhythm and vertical migration of the
euphausiid Euphausia pacifica in coastal waters of north-eastern Japan during fall. J
Plankton Res 25:633-644
Ney JJ (1993) Bioenergetics modeling today: Growing pains on the cutting edge. Trans Am Fish
Soc 122:736-748
O'Driscoll RL, Parsons MJD, Rose GA (2001) Feeding of capelin (Mallotus villosus) in
Newfoundland waters. Sarsia 86:165-176
Okubo A (1987) Fantastic voyage into the deep: marine biofluid mechanics. In: Teromoto E,
Yamaguti M (eds) Mathematical Topics in Population Biology, Morphogenesis and
Neurosciences. Springer-Verlag, New York, p 32-47
Pascall JC, Ackman RG (1976) Long chain monoethylenic alcohol and acid isomers in lipids of
copepods and capelin. Chem Phys Lipids 16:219-223
Patton JS, Benson AA (1975) A comparative study of wax ester digestion in fish. Comp.
Biochem. Physiol., B 52:111-116
35
Persson L (1981) The effects of temperature and meal size on the rate of gastric evacuation in
perch (Perca fluviatilis) fed on fish larvae. Freshwat Biol 11:131-138
Pikitch EK, Santora C, Babcock EA, Bakun A, Bonfil R, Conover DO, Dayton P, Doukakis P,
Fluharty D, Heneman B, Houde ED, Link J, Livingston PA, Mangel M, McAllister MK,
Pope J, Sainsbury KJ (2004) Ecosystem-based fishery management. Science 305:346-347
Richter H, Luckstadt C, Schlechtriem C, Focken U, Becker K (2002) Evidence of violation of a
basic assumption in models currently used for food consumption estimation in fish. Arch
Fish Mar Res 49:171-188
Saito H, Kotani Y (2000) Lipids of four boreal species of calanoid copepods: origin of monoene
fats of marine animals at higher trophic levels in the grazing food chain in the subarctic
ocean ecosystem. Mar Chem 71:69-82
Salvanes AGV, Aksnes DL, Giske J (1995) A surface-dependent gastric evacuation model for
fish. J Fish Biol 47:679-695
Sargent JR (1976) The structure, metabolism and function of lipids in marine organisms. In:
Malins DC, Sargent JR (eds) Biochemical and Biophysical Perspectives in Marine Biology.
Academic Press, London, p 149-212
Sargent JR, Henderson RJ (1986) Lipids. In: Corner EDS, O'Hara SCM (eds) The Biological
Chemistry of Marine Copepods. Clarendon Press, Oxford, p 59-108
Sargent JR, McIntosh R, Bauermeister A, Blaxter JHS (1979) Assimilation of the wax esters of
marine zooplankton by herring (Clupea harengus) and rainbow trout (Salmo gairdnerii).
Mar Biol 51:203-207
Sargent J, Bell G, McEvoy L, Tocher D, Estevez A (1999) Recent developments in the essential
fatty acid nutrition of fish. Aquaculture 177:191-199
Shanks AL (1986) Tidal periodicity in the daily settlement of intertidal barnacle larvae and a
hypothesized mechanism for the cross-shelf transport of cyprids. Biol Bull 170:429-440
36
Shanks AL, Wright WG (1987) Internal-wave-mediated shoreward transport of cyprids,
megalopae, and gammarids and correlated longshore differences in the settling rate of
intertidal barnacles. J Exp Mar Biol Ecol 114:1-13
Singh-Renton S, Bromley PJ (1996) Effects of temperature, prey type and prey size on gastric
evacuation in small cod and whiting. J Fish Biol 49:702-713
Spies RB (2007) Long-term Ecological Change in the Northern Gulf of Alaska. Elsevier Science,
Amsterdam
Springer AM, Speckman SG (1997) A forage fish is what? Summary of the symposium. In:
Mecklenburg W (ed) Forage fishes in marine ecosystems. Proc 14th Lowell Wakefield
Fish Symp. University of Alaska Sea Grant College Program, Fairbanks, AK
Sutela T, Huusko A (1994) Digestion of zooplankton in the alimentary tract of vendace
(Coregonus albula) larvae. J Fish Biol 44:591-596
Szypuia J, Zalachowski W (1984) Duration of food evacuation in herring, Clupea harengus L.,
and sprat, Sprattus sprattus (L.). Acta Ichthyol Pisc 14:93-104
Temming A, Herrmann JP (2003) Gastric evacuation in cod: Prey-specific evacuation rates for
use in North Sea, Baltic Sea and Barents Sea multi-species models. Fish Res 63:21-41
Tocher DR (2003) Metabolism and functions of lipids and fatty acids in teleost fish. Rev Fish Sci
11:107-184
Vesin JP, Leggett WC, Able KW (1981) Feeding ecology of capelin (Mallotus villosus) in the
estuary and western Gulf of St Lawrence and its multispecies implications. Can J Fish
Aquat Sci 38:257-267
Vogel S (1996) Life in Moving Fluids: the Physical Biology of Flow (2nd edn). Princeton
University Press, Princeton, NJ
Ways P, Hanahan DJ (1964) Characterization and quantification of red cell lipids in normal man.
J Lipid Res 5:318-328

37
Wilson MT, Jump CM, Duffy-Anderson JT (2006) Comparative analysis of the feeding ecology
of two pelagic forage fishes: capelin (Mallotus villosus) and walleye pollock (Theragra
chalcogramma). Mar Ecol Prog Ser 317:245-258
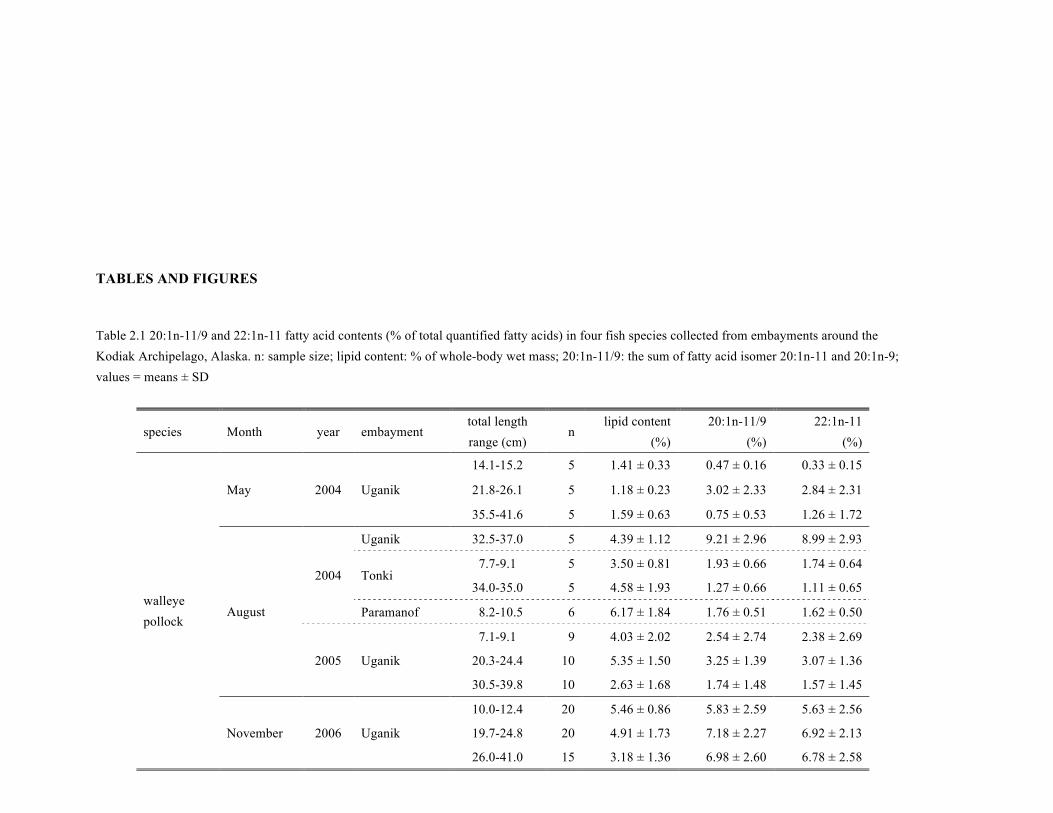
38
TABLES AND FIGURES
Table 2.1 20:1n-11/9 and 22:1n-11 fatty acid contents (% of total quantified fatty acids) in four fish species collected from embayments around the Kodiak Archipelago, Alaska. n: sample size; lipid content: % of whole-body wet mass; 20:1n-11/9: the sum of fatty acid isomer 20:1n-11 and 20:1n-9; values = means ± SD
species Month year embayment total length range (cm)
n lipid content
(%) 20:1n-11/9
(%) 22:1n-11
(%)
walleye pollock
May 2004 Uganik
14.1-15.2 5 1.41 ± 0.33 0.47 ± 0.16 0.33 ± 0.15
21.8-26.1 5 1.18 ± 0.23 3.02 ± 2.33 2.84 ± 2.31
35.5-41.6 5 1.59 ± 0.63 0.75 ± 0.53 1.26 ± 1.72
August
2004
Uganik 32.5-37.0 5 4.39 ± 1.12 9.21 ± 2.96 8.99 ± 2.93
Tonki 7.7-9.1 5 3.50 ± 0.81 1.93 ± 0.66 1.74 ± 0.64
34.0-35.0 5 4.58 ± 1.93 1.27 ± 0.66 1.11 ± 0.65
Paramanof 8.2-10.5 6 6.17 ± 1.84 1.76 ± 0.51 1.62 ± 0.50
2005 Uganik
7.1-9.1 9 4.03 ± 2.02 2.54 ± 2.74 2.38 ± 2.69
20.3-24.4 10 5.35 ± 1.50 3.25 ± 1.39 3.07 ± 1.36
30.5-39.8 10 2.63 ± 1.68 1.74 ± 1.48 1.57 ± 1.45
November 2006 Uganik
10.0-12.4 20 5.46 ± 0.86 5.83 ± 2.59 5.63 ± 2.56
19.7-24.8 20 4.91 ± 1.73 7.18 ± 2.27 6.92 ± 2.13
26.0-41.0 15 3.18 ± 1.36 6.98 ± 2.60 6.78 ± 2.58

39
Table 2.1 (continued)
species month year embayment total length range (cm)
n lipid content
(%) 20:1n-11/9
(%) 22:1n-11
(%)
Pacific herring
May 2005 Uganik 19.1-23.8 5 3.97 ± 1.10 2.51 ± 0.50 3.20 ± 0.75
August 2004 Uganik 17.5-21.0 5 4.32 ± 5.15 3.84 ± 1.64 5.50 ± 2.84
November 2006 Uganik 13.6-22.3 23 10.32 ± 2.57 6.05 ± 2.29 11.57 ± 5.93
25.7-29.3 14 18.28 ± 3.24 8.74 ± 2.83 26.55 ± 6.84
April 2007 Uganik 15.9-16.8 5 14.44 ± 1.39 13.35 ± 1.76 17.94 ± 1.18
Tonki 17.0-18.2 5 13.22 ± 2.85 15.21 ± 0.33 24.12 ± 1.51
capelin
May 2005 Uganik
8.2-8.7 5 15.85 ± 1.48 1.93 ± 0.18 2.06 ± 0.61
11.9-13.3 5 7.06 ± 2.32 1.57 ± 0.53 2.67 ± 1.93
Tonki 11.2-13.2 10 5.96 ± 1.01 3.21 ± 0.53 11.94 ± 3.60
August
2004 Tonki 8.4-9.8 5 6.47 ± 1.17 6.06 ± 0.96 14.13 ± 5.62
10.7-12.8 5 10.18 ± 0.87 6.72 ± 0.85 26.55 ± 2.05
2005
Uganik 7.9-9.2 5 6.08 ± 1.71 1.95 ± 0.29 3.16 ± 1.23
Perenosa 7.9-9.5 12 7.07 ± 2.32 4.91 ± 1.76 7.67 ± 4.98
10.1-12.9 8 14.24 ± 6.53 4.23 ± 1.95 11.92 ± 4.66
eulachon November 2006 Uganik 13.9-17.7 10 21.02 ± 1.94 1.69 ± 0.17 3.83 ± 1.29
20.4-23.3 10 20.56 ± 0.87 1.80 ± 0.32 5.51 ± 1.80
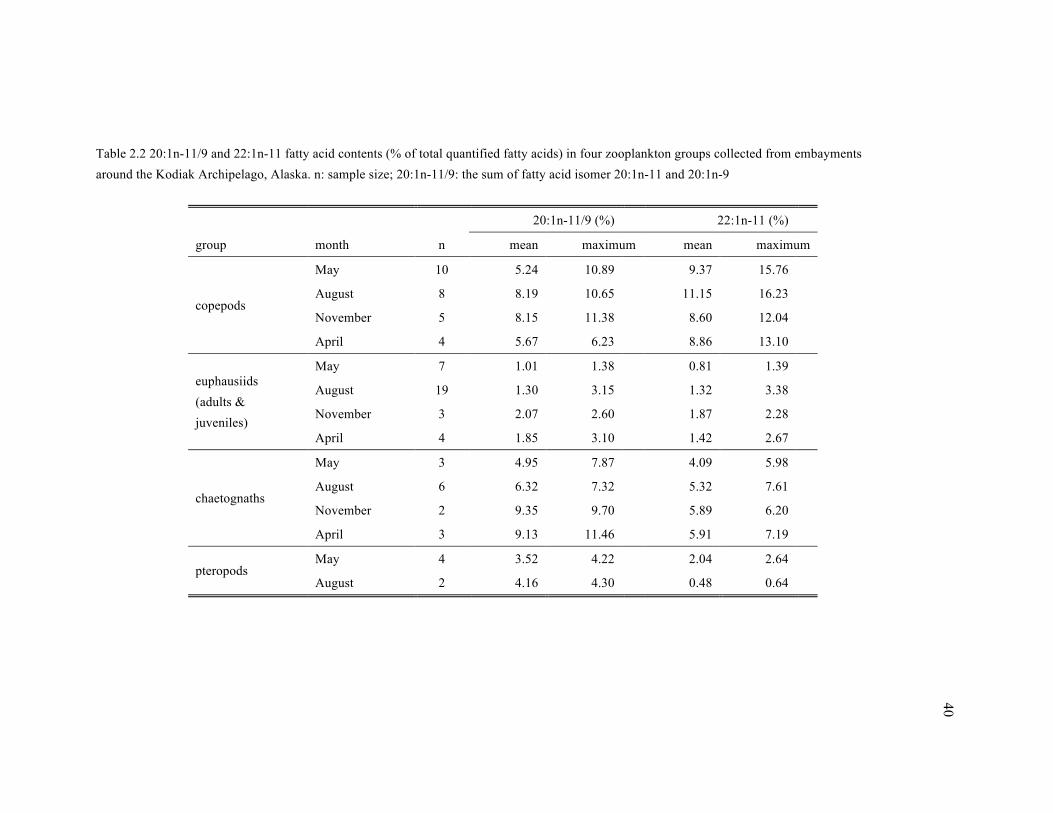
40
Table 2.2 20:1n-11/9 and 22:1n-11 fatty acid contents (% of total quantified fatty acids) in four zooplankton groups collected from embayments around the Kodiak Archipelago, Alaska. n: sample size; 20:1n-11/9: the sum of fatty acid isomer 20:1n-11 and 20:1n-9
20:1n-11/9 (%) 22:1n-11 (%)
group month n mean maximum mean maximum
copepods
May 10 5.24 10.89 9.37 15.76
August 8 8.19 10.65 11.15 16.23
November 5 8.15 11.38 8.60 12.04
April 4 5.67 6.23 8.86 13.10
euphausiids (adults & juveniles)
May 7 1.01 1.38 0.81 1.39
August 19 1.30 3.15 1.32 3.38
November 3 2.07 2.60 1.87 2.28
April 4 1.85 3.10 1.42 2.67
chaetognaths
May 3 4.95 7.87 4.09 5.98
August 6 6.32 7.32 5.32 7.61
November 2 9.35 9.70 5.89 6.20
April 3 9.13 11.46 5.91 7.19
pteropods May 4 3.52 4.22 2.04 2.64
August 2 4.16 4.30 0.48 0.64

41
Table 2.3 Overall stomach content composition in four fish species collected from embayments around the Kodiak Archipelago, Alaska, in mean numerical percentage (No., %), percentage frequency of occurrence (FO, %), and mean prey-specific numerical percentage (SNo., %). n: number of non-empty stomachs analyzed; a + j: adult + juvenile; f + c + e: furcilia + calyptopis + egg
walleye pollock Pacific herring capelin eulachon
n 404 250 242 147
taxonomic group No. FO SNo. No. FO SNo. No. FO SNo. No. FO SNo.
Amphipoda 1.77 7.67 23.05 4.38 10.80 40.59 0.10 0.41 25.00 2.66 4.76 55.78
Chaetognatha 0 0 0 0.28 0.40 70.83 0 0 0 0 0 0
Cirripedia 0.08 0.25 33.33 2.38 5.00 47.60 21.58 33.47 64.48 0 0 0
Copepoda 14.93 23.02 64.84 26.49 34.00 77.92 32.37 47.52 68.13 5.79 8.16 70.95
Euphausiacea, a + j 73.07 87.13 83.87 59.04 82.00 70.78 44.66 45.87 97.37 89.83 100 89.83
Euphausiacea, f + c + e 0.54 4.21 12.90 0 0 0 0.86 4.55 19.01 0 0 0
Larvacea 3.18 11.63 27.34 0 0 0 0 0 0 1.72 2.72 63.10
Decapoda 0.75 2.48 30.20 7.67 13.60 56.42 0 0 0 0 0 0
Pteropoda 1.45 3.47 41.91 0.04 0.40 10.00 0 0 0 0 0 0
others 4.23 7.43 56.92 0 0 0 0.41 0.41 100 0 0 0
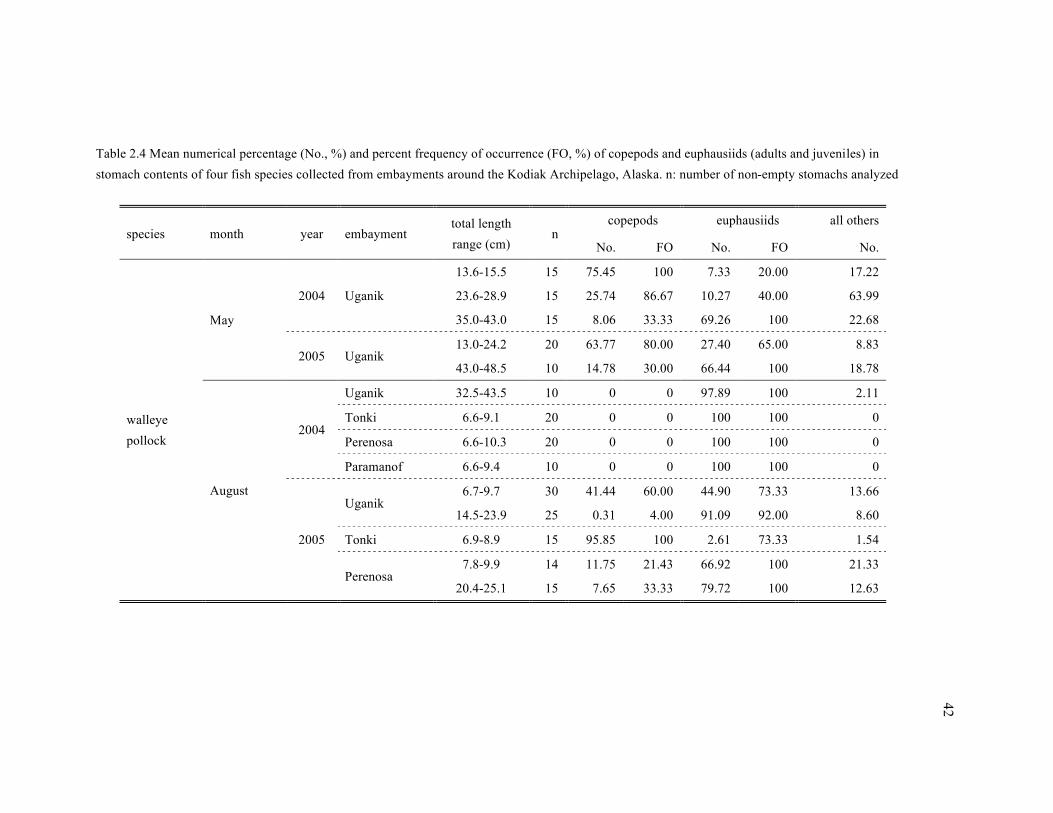
42
Table 2.4 Mean numerical percentage (No., %) and percent frequency of occurrence (FO, %) of copepods and euphausiids (adults and juveniles) in stomach contents of four fish species collected from embayments around the Kodiak Archipelago, Alaska. n: number of non-empty stomachs analyzed
species month year embayment total length range (cm)
n copepods euphausiids all others
No. FO No. FO No.
walleye pollock
May
2004 Uganik
13.6-15.5 15 75.45 100 7.33 20.00 17.22
23.6-28.9 15 25.74 86.67 10.27 40.00 63.99
35.0-43.0 15 8.06 33.33 69.26 100 22.68
2005 Uganik 13.0-24.2 20 63.77 80.00 27.40 65.00 8.83
43.0-48.5 10 14.78 30.00 66.44 100 18.78
August
2004
Uganik 32.5-43.5 10 0 0 97.89 100 2.11
Tonki 6.6-9.1 20 0 0 100 100 0
Perenosa 6.6-10.3 20 0 0 100 100 0
Paramanof 6.6-9.4 10 0 0 100 100 0
2005
Uganik 6.7-9.7 30 41.44 60.00 44.90 73.33 13.66
14.5-23.9 25 0.31 4.00 91.09 92.00 8.60
Tonki 6.9-8.9 15 95.85 100 2.61 73.33 1.54
Perenosa 7.8-9.9 14 11.75 21.43 66.92 100 21.33
20.4-25.1 15 7.65 33.33 79.72 100 12.63
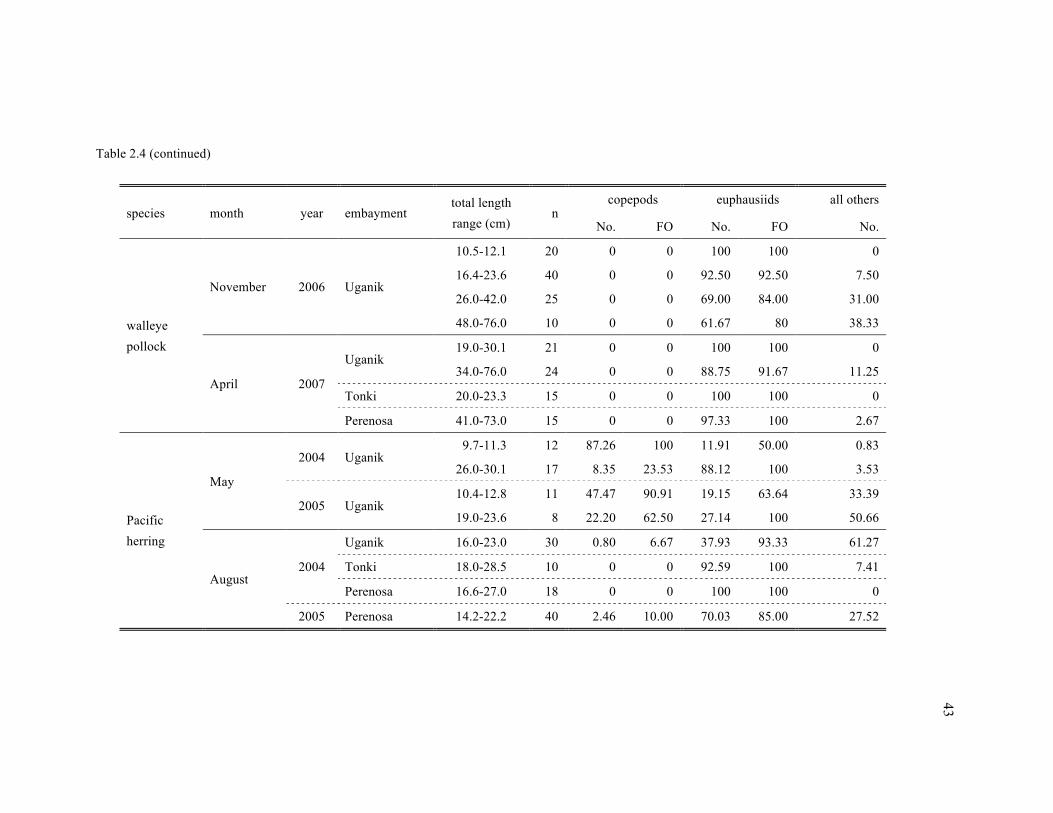
43
Table 2.4 (continued)
species month year embayment total length range (cm)
n copepods euphausiids all others
No. FO No. FO No.
walleye pollock
November 2006 Uganik
10.5-12.1 20 0 0 100 100 0
16.4-23.6 40 0 0 92.50 92.50 7.50
26.0-42.0 25 0 0 69.00 84.00 31.00
48.0-76.0 10 0 0 61.67 80 38.33
April 2007
Uganik 19.0-30.1 21 0 0 100 100 0
34.0-76.0 24 0 0 88.75 91.67 11.25
Tonki 20.0-23.3 15 0 0 100 100 0
Perenosa 41.0-73.0 15 0 0 97.33 100 2.67
Pacific herring
May
2004 Uganik 9.7-11.3 12 87.26 100 11.91 50.00 0.83
26.0-30.1 17 8.35 23.53 88.12 100 3.53
2005 Uganik 10.4-12.8 11 47.47 90.91 19.15 63.64 33.39
19.0-23.6 8 22.20 62.50 27.14 100 50.66
August 2004
Uganik 16.0-23.0 30 0.80 6.67 37.93 93.33 61.27
Tonki 18.0-28.5 10 0 0 92.59 100 7.41
Perenosa 16.6-27.0 18 0 0 100 100 0
2005 Perenosa 14.2-22.2 40 2.46 10.00 70.03 85.00 27.52
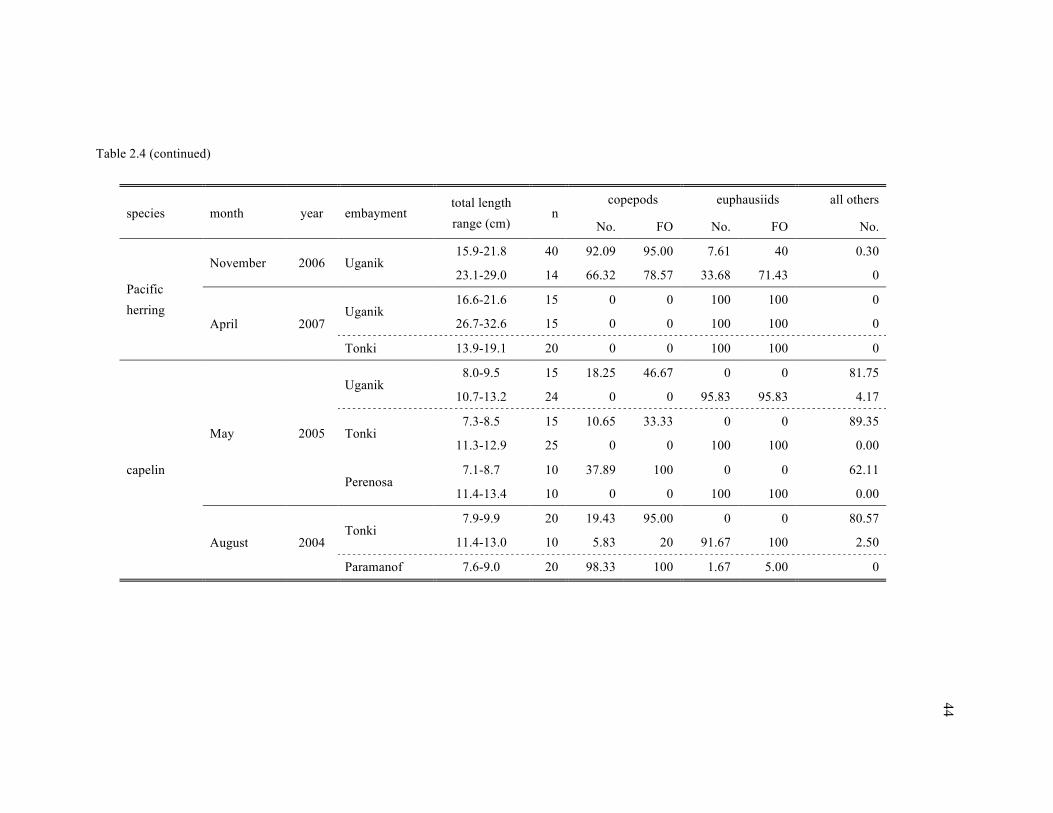
44
Table 2.4 (continued)
species month year embayment total length range (cm)
n copepods euphausiids all others
No. FO No. FO No.
Pacific herring
November 2006 Uganik 15.9-21.8 40 92.09 95.00 7.61 40 0.30
23.1-29.0 14 66.32 78.57 33.68 71.43 0
April 2007 Uganik
16.6-21.6 15 0 0 100 100 0
26.7-32.6 15 0 0 100 100 0
Tonki 13.9-19.1 20 0 0 100 100 0
capelin
May 2005
Uganik 8.0-9.5 15 18.25 46.67 0 0 81.75
10.7-13.2 24 0 0 95.83 95.83 4.17
Tonki 7.3-8.5 15 10.65 33.33 0 0 89.35
11.3-12.9 25 0 0 100 100 0.00
Perenosa 7.1-8.7 10 37.89 100 0 0 62.11
11.4-13.4 10 0 0 100 100 0.00
August 2004 Tonki
7.9-9.9 20 19.43 95.00 0 0 80.57
11.4-13.0 10 5.83 20 91.67 100 2.50
Paramanof 7.6-9.0 20 98.33 100 1.67 5.00 0
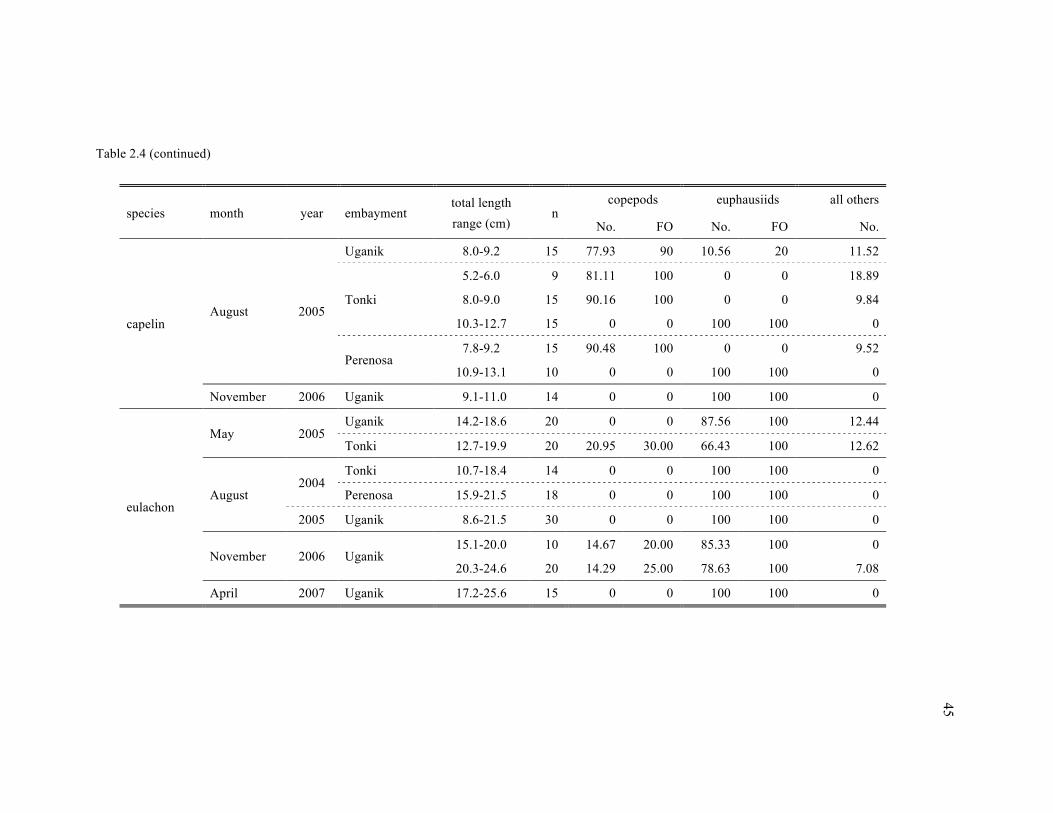
45
Table 2.4 (continued)
species month year embayment total length range (cm)
n copepods euphausiids all others
No. FO No. FO No.
capelin August 2005
Uganik 8.0-9.2 15 77.93 90 10.56 20 11.52
Tonki
5.2-6.0 9 81.11 100 0 0 18.89
8.0-9.0 15 90.16 100 0 0 9.84
10.3-12.7 15 0 0 100 100 0
Perenosa 7.8-9.2 15 90.48 100 0 0 9.52
10.9-13.1 10 0 0 100 100 0
November 2006 Uganik 9.1-11.0 14 0 0 100 100 0
eulachon
May 2005 Uganik 14.2-18.6 20 0 0 87.56 100 12.44
Tonki 12.7-19.9 20 20.95 30.00 66.43 100 12.62
August 2004
Tonki 10.7-18.4 14 0 0 100 100 0
Perenosa 15.9-21.5 18 0 0 100 100 0
2005 Uganik 8.6-21.5 30 0 0 100 100 0
November 2006 Uganik 15.1-20.0 10 14.67 20.00 85.33 100 0
20.3-24.6 20 14.29 25.00 78.63 100 7.08
April 2007 Uganik 17.2-25.6 15 0 0 100 100 0
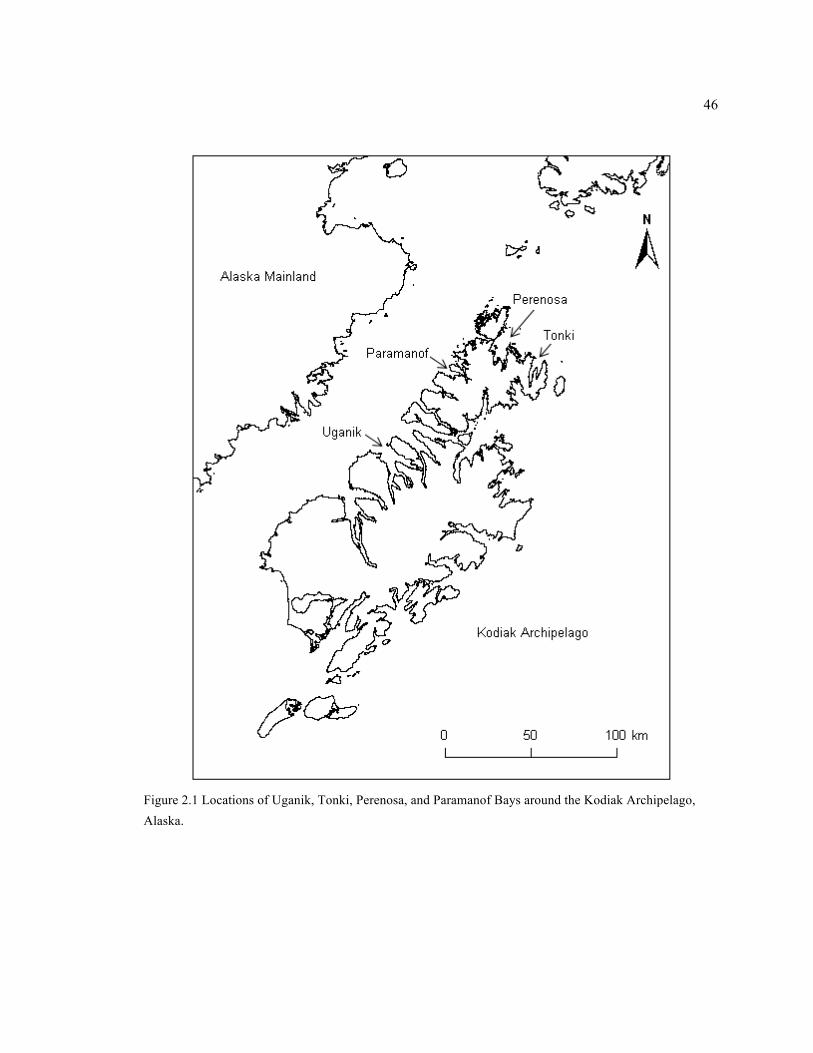
46
46
Figure 2.1 Locations of Uganik, Tonki, Perenosa, and Paramanof Bays around the Kodiak Archipelago, Alaska.
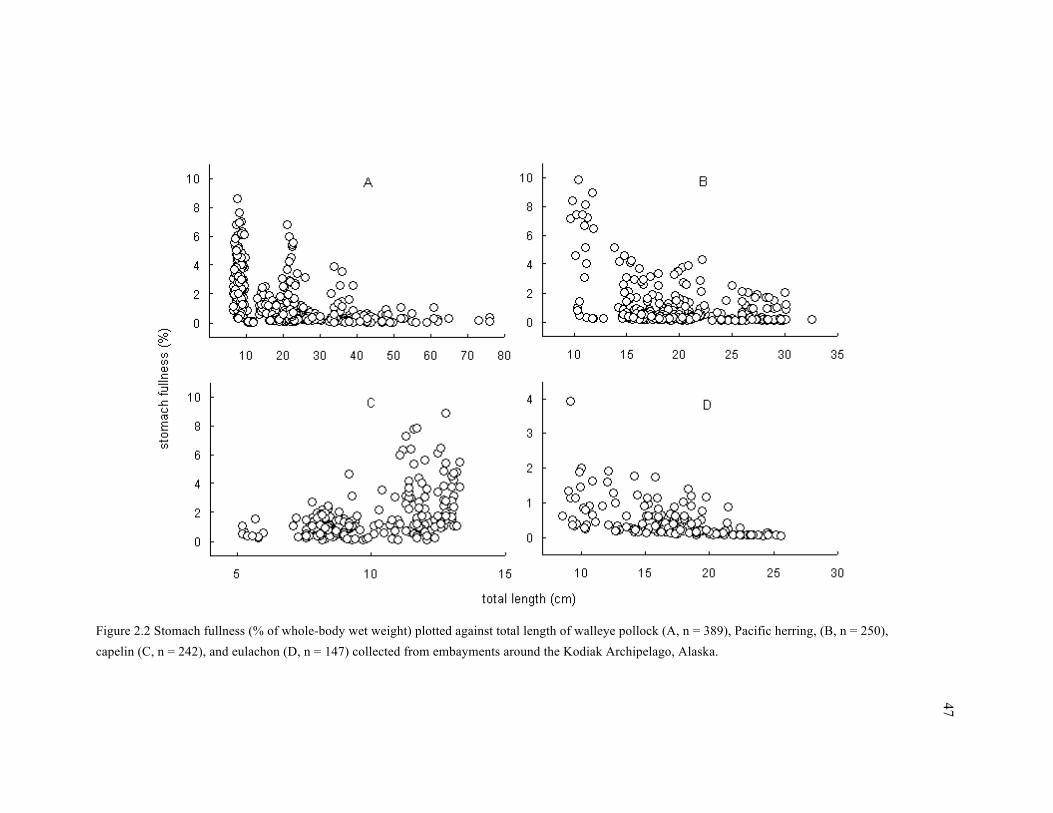
47
Figure 2.2 Stomach fullness (% of whole-body wet weight) plotted against total length of walleye pollock (A, n = 389), Pacific herring, (B, n = 250), capelin (C, n = 242), and eulachon (D, n = 147) collected from embayments around the Kodiak Archipelago, Alaska.

48
Chapter 3:
Intra-Species Variation in Lipid Content and Fatty Acid Composition
of Forage Fishes in Embayments of the Kodiak Archipelago, Alaska1
ABSTRACT
Forage fish lipid content and fatty acid composition can offer insights into forage fish life history
and local plankton production, and largely define the nutritional values of prey for upper trophic
level predators. In this study, we analyzed lipid content and fatty acid composition of four forage
fish species, walleye pollock (Theragra chalcogramma), Pacific herring (Clupea pallasii),
capelin (Mallotus villosus), and eulachon (Thaleichthys pacificus), that were systematically
sampled (n = 816) from four embayments of the Kodiak Archipelago, Alaska. Lipid content
varied significantly by month and fish length; inter-month variations did not strictly mirror the
annual cycle of zooplankton production; ontogenetic patterns were specific to fish species and
month. Fatty acid composition varied significantly by month, fish length, and embayment;
contents of certain fatty acids were significantly correlated with lipid content. The large
magnitudes of intra-species variations suggest against the use of average values at a species level
when applying lipid data to ecological studies. Results also demonstrated that fatty acid analysis
can be a valuable approach to refining our knowledge in forage fish feeding ecology.
1 Prepared for submission to Marine Ecology Progress Series. Guo L, Foy RJ, Schaufler L,
Wynne KM. Intra-species variation in lipid content and fatty acid composition of forage fishes in
embayments of the Kodiak Archipelago, Alaska.

49
INTRODUCTION
Refining our knowledge in forage fish lipid dynamics is a necessary and effective step to
improve the understanding of marine ecosystem functioning (Rosa et al. 2010, Spitz et al. 2010).
Forage fishes serve as the main energy passageways between zooplankton and piscivorous fishes,
marine mammals, and seabirds (Springer & Speckman 1997), and a significant portion of the
conveyed energy is in the form of lipids (Van Pelt et al. 1997, Ball et al. 2007). Variations in
forage fish lipid content and fatty acid composition not only offer insights into forage fish life
history and local plankton production (Henderson et al. 1984, Litz et al. 2010), but also have
profound implications on upper trophic level species (Montevecchi & Piatt 1984, Iverson et al.
1997, Rosen & Trites 2000a). For these reasons, information on forage fish lipid dynamics has
been used to investigate a variety of ecological questions, from fish community reorganization to
marine mammal population decline (Rosen & Trites 2000b, Iverson et al. 2004, Litzow et al.
2006).
Lipid content in forage fishes is known to be highly variable (Van Pelt et al. 1997, Ball et al.
2007). Efforts to assess variations in forage fish lipid content have increased in recent years,
propelled primarily by the rising need for better understanding the potential implications of
different prey qualities on marine mammals and seabirds (Schaufler et al. 2006, Spitz et al. 2010).
Earlier studies have focused on inter-species variations (Payne et al. 1999, Bando 2002), since
forage fish remains in stomachs or scats of apex predators were typically identified to the species
level (Lowry et al. 1989, Merrick et al. 1997). More recent work examined intra-species
variations and these variations were attributed to multiple factors, such as sampling month and
fish length (Iverson et al. 2002, Vollenweider 2005). It has been noticed that the magnitudes of
intra-species variations can match those of inter-species variations (Ball et al. 2007, Rosa et al.
2010); these observations indicate that the use of average lipid content values at the species level
for fine-scale ecological studies must be viewed with caution. Currently, forage fish lipid content

50
data are scarce and most existing data are based only on opportunistic sampling. As a result,
applications of published lipid content results are often limited to the compromised use of
species-specific average values, which severely reduces the resolution of calculated results. It has
been strongly recommended that individual variations be incorporated in calculations when
investigating fish bioenergetics (Hartman & Brandt 1993, Ney 1993, Wuenschel et al. 2006);
however, this recommendation requires a systematical examination of intra-species variations.
Fatty acids have long been used as natural biomarkers in marine ecosystems, because most
dietary fatty acids are deposited in predator tissues with little modification (Sargent et al. 1987,
Dalsgaard & St. John 2004). Fatty acid composition, measured by the relative contributions of
various fatty acids to the total (Christie 2003), offers specific diet information that can be difficult
to acquire through stomach content analysis (Iverson et al. 2004, Stevens et al. 2004). Fatty acid
composition of forage fishes provides indirect evidence regarding the importance of calanoid
copepods as prey (Sargent & Henderson 1986, Dalsgaard et al. 2003, Tocher 2003) and can be
quantitatively traced in marine mammals and seabirds (Iverson et al. 1997, Iverson et al. 2004,
Williams & Buck 2010). Unfortunately, baseline data on forage fish fatty acids are currently
lacking in most marine ecosystems. The lack of background information that new data could be
compared with severely limits the scope and certainty of ecological conclusions derived from
isolated fatty acid dataset (Litzow et al. 2006, Litz et al. 2010, Williams & Buck 2010). Therefore,
the construction of a baseline database is key to using fatty acid analysis as a promising
biochemical approach to studying forage fishes and their trophic interactions.
In this study, we assess lipid content and fatty acid composition of four locally important
forage fish species, walleye pollock (Theragra chalcogramma), Pacific herring (Clupea pallasii),
capelin (Mallotus villosus), and eulachon (Thaleichthys pacificus), systematically sampled from
embayments of the Kodiak Archipelago in the Gulf of Alaska (GOA). Forage fishes utilize these
embayments as feeding and spawning habitats, and constitute critical food sources of local

51
piscivorous fishes, marine mammals and seabirds (Pahlke 1985, McKenzie & Wynne 2008).
Historical population fluctuations of forage fishes in the GOA (Anderson & Piatt 1999), along
with their predators (Merrick et al. 1987), and projected climate change prompted our efforts to
better understand local forage fishes through their lipid dynamics. The first step was to establish a
baseline database by describing the intra-species variations in lipid content and fatty acid
composition. We hypothesized that lipid content and fatty acid composition would vary
significantly by month, fish length, and embayment. Results of this study will enable us to better
understand forage fish lipid dynamics and ecosystem functioning in the coastal waters of the
Kodiak Archipelago.
MATERIALS AND METHODS
Forage fishes were collected from Uganik, Tonki, Perenosa, and Paramanof Bays of the
Kodiak Archipelago (Fig. 3.1) in May and August of 2004 and 2005, November 2006, and April
2007 (Fish Resource Permits authorized by Alaska Department of Fish and Game were held for
all sample collections and are documented in Appendix A). Samples were captured using a
midwater trawl (DanTrawl Bering Billionaire) with a codend of 10 cm mesh and 2.5 cm mesh
liner. We focused on four forage fish species that consistently dominated the net catches: walleye
pollock, Pacific herring, capelin, and eulachon. Samples were stored in air-tight containers at
-20°C on board and, after each survey, vacuum-packed and stored in the lab at -30°C until
analysis.
Lipids were extracted from whole-body homogenates of 816 samples following Folch et al.
(1957) with modifications by Ways & Hanahan (1964). Each sample was one individual fish,
except for seven samples that consisted of five or ten fish pooled together. In the lab, total length
was measured to the nearest 0.1 cm and whole-body wet weight to the nearest 0.01 g. Lipids in
aliquots of 1.5 g homogenates were extracted with the solvent mixture of 20 mL chloroform and

52
10 mL methanol. Lipid content (%) was calculated as the weight of extracted lipids divided by
whole-body wet weight. Extraction of the first 140 samples was conducted in duplicates and
averages were reported. Because differences between replicates were negligible (less than 5% of
the averages for 95% of samples), the remaining 676 samples were extracted with one replicate.
Extracted lipids from 252 samples were analyzed for fatty acid composition. Hilditch reagent
was used to catalyze the transesterification of extracted lipids in aliquots of ~ 0.3 mg at 55-60 °C
for 18 h and the resulting fatty acid methyl esters were washed with 5% NaCl and extracted with
hexane (Christie 2003). Using a Varian Saturn 2200 GC/MS, a total of 37 fatty acids were
quantified to the nearest nanogram against calibration curves established for each batch of
transesterified lipid samples (8 – 20 samples for one batch). Weight values of the 37 fatty acids
were standardized into compositional values, which were percentages of the total; these
standardized values are hereafter referred to as fatty acid contents. Fatty acid nomenclature
follows the standard “n” system (Christie 2003): for example, 20:1n-11 means that the fatty acid
molecule has 20 carbon atoms and one double bond that is between carbon atom 11 and 12
counting from the terminal methyl group (CH3).
Differences in lipid content among fish species, months, and embayments were subjected to
Mann-Whitney U or Kruskal Wallis tests. Correlations among lipid content, fatty acid contents,
and total length were measured by Spearman Rho values. Fatty acid composition was represented
by the 37 fatty acid contents and examined with multivariate statistics. Dissimilarity matrices of
fatty acid composition among samples were calculated based on Bray-Curtis coefficient.
Ordination of samples was carried out using non-metric multidimensional scaling (MDS) and
presented in two dimensions; stress values were calculated to measure how well the
two-dimensional plots represent the true ordination, with values < 0.1 considered good
representations (Kruskal & Wish, 1981). Differences in fatty acid composition were tested by
permutation-based analysis of similarity (ANOSIM) using the ANOSIM routine in PRIMER
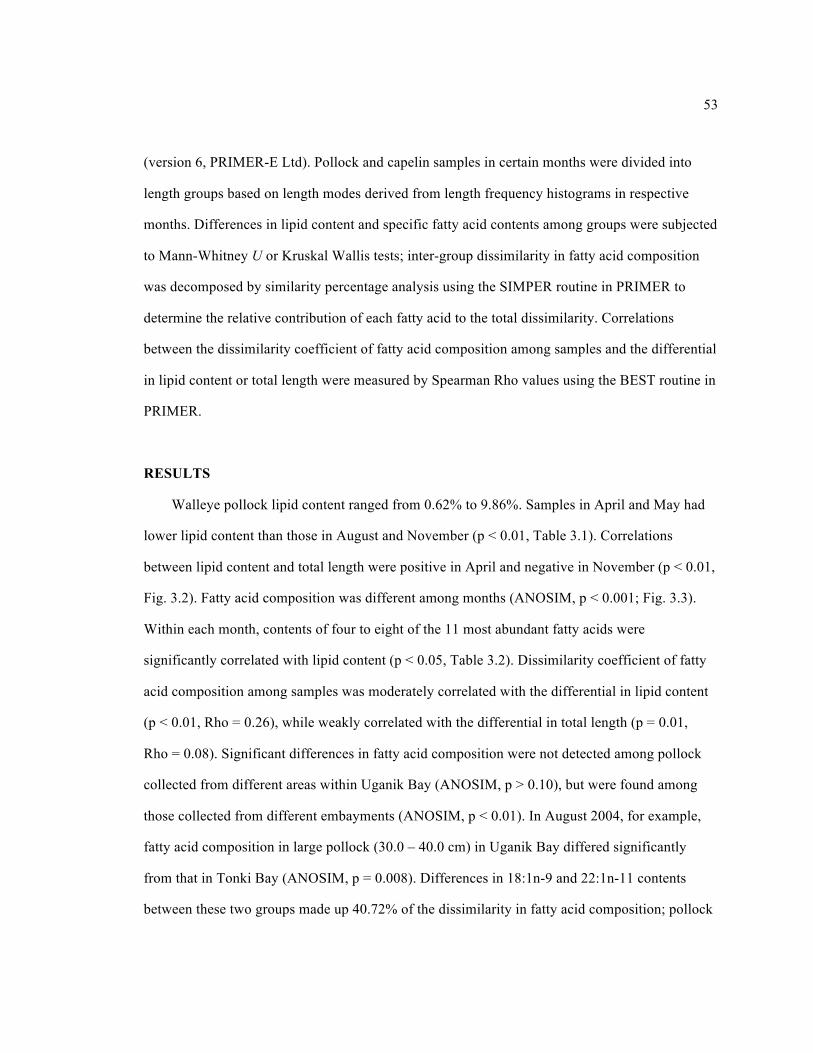
53
(version 6, PRIMER-E Ltd). Pollock and capelin samples in certain months were divided into
length groups based on length modes derived from length frequency histograms in respective
months. Differences in lipid content and specific fatty acid contents among groups were subjected
to Mann-Whitney U or Kruskal Wallis tests; inter-group dissimilarity in fatty acid composition
was decomposed by similarity percentage analysis using the SIMPER routine in PRIMER to
determine the relative contribution of each fatty acid to the total dissimilarity. Correlations
between the dissimilarity coefficient of fatty acid composition among samples and the differential
in lipid content or total length were measured by Spearman Rho values using the BEST routine in
PRIMER.
RESULTS
Walleye pollock lipid content ranged from 0.62% to 9.86%. Samples in April and May had
lower lipid content than those in August and November (p < 0.01, Table 3.1). Correlations
between lipid content and total length were positive in April and negative in November (p < 0.01,
Fig. 3.2). Fatty acid composition was different among months (ANOSIM, p < 0.001; Fig. 3.3).
Within each month, contents of four to eight of the 11 most abundant fatty acids were
significantly correlated with lipid content (p < 0.05, Table 3.2). Dissimilarity coefficient of fatty
acid composition among samples was moderately correlated with the differential in lipid content
(p < 0.01, Rho = 0.26), while weakly correlated with the differential in total length (p = 0.01,
Rho = 0.08). Significant differences in fatty acid composition were not detected among pollock
collected from different areas within Uganik Bay (ANOSIM, p > 0.10), but were found among
those collected from different embayments (ANOSIM, p < 0.01). In August 2004, for example,
fatty acid composition in large pollock (30.0 – 40.0 cm) in Uganik Bay differed significantly
from that in Tonki Bay (ANOSIM, p = 0.008). Differences in 18:1n-9 and 22:1n-11 contents
between these two groups made up 40.72% of the dissimilarity in fatty acid composition; pollock
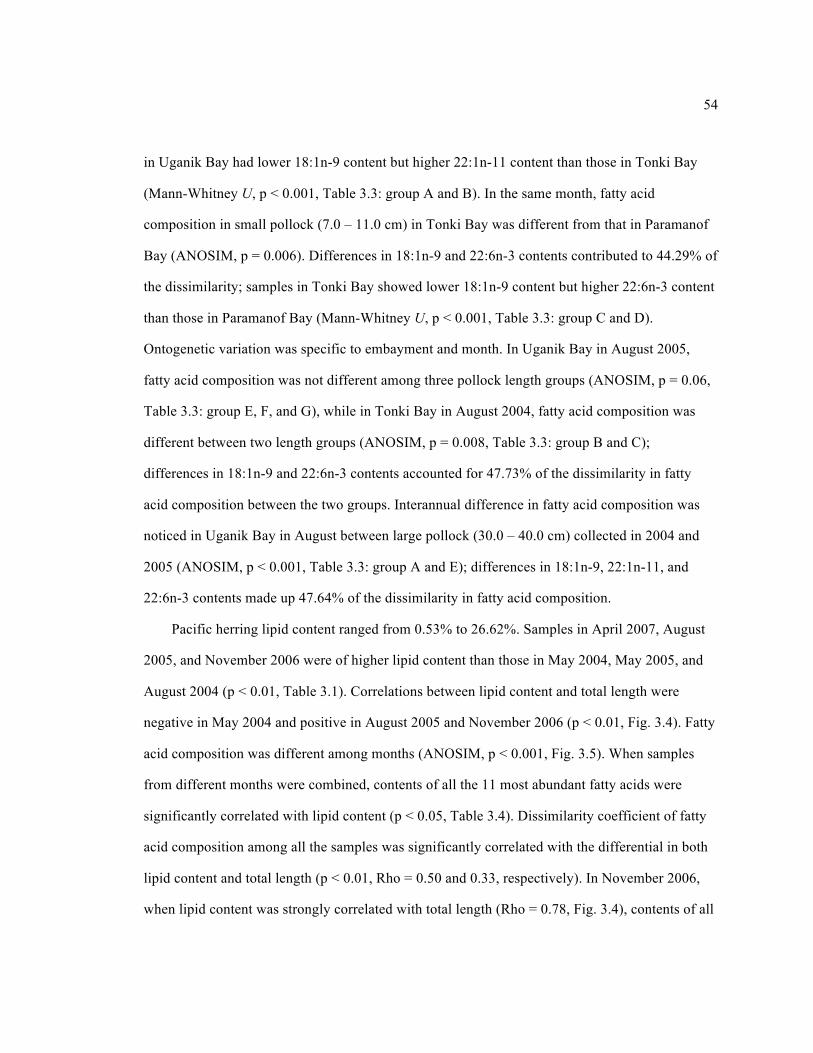
54
in Uganik Bay had lower 18:1n-9 content but higher 22:1n-11 content than those in Tonki Bay
(Mann-Whitney U, p < 0.001, Table 3.3: group A and B). In the same month, fatty acid
composition in small pollock (7.0 – 11.0 cm) in Tonki Bay was different from that in Paramanof
Bay (ANOSIM, p = 0.006). Differences in 18:1n-9 and 22:6n-3 contents contributed to 44.29% of
the dissimilarity; samples in Tonki Bay showed lower 18:1n-9 content but higher 22:6n-3 content
than those in Paramanof Bay (Mann-Whitney U, p < 0.001, Table 3.3: group C and D).
Ontogenetic variation was specific to embayment and month. In Uganik Bay in August 2005,
fatty acid composition was not different among three pollock length groups (ANOSIM, p = 0.06,
Table 3.3: group E, F, and G), while in Tonki Bay in August 2004, fatty acid composition was
different between two length groups (ANOSIM, p = 0.008, Table 3.3: group B and C);
differences in 18:1n-9 and 22:6n-3 contents accounted for 47.73% of the dissimilarity in fatty
acid composition between the two groups. Interannual difference in fatty acid composition was
noticed in Uganik Bay in August between large pollock (30.0 – 40.0 cm) collected in 2004 and
2005 (ANOSIM, p < 0.001, Table 3.3: group A and E); differences in 18:1n-9, 22:1n-11, and
22:6n-3 contents made up 47.64% of the dissimilarity in fatty acid composition.
Pacific herring lipid content ranged from 0.53% to 26.62%. Samples in April 2007, August
2005, and November 2006 were of higher lipid content than those in May 2004, May 2005, and
August 2004 (p < 0.01, Table 3.1). Correlations between lipid content and total length were
negative in May 2004 and positive in August 2005 and November 2006 (p < 0.01, Fig. 3.4). Fatty
acid composition was different among months (ANOSIM, p < 0.001, Fig. 3.5). When samples
from different months were combined, contents of all the 11 most abundant fatty acids were
significantly correlated with lipid content (p < 0.05, Table 3.4). Dissimilarity coefficient of fatty
acid composition among all the samples was significantly correlated with the differential in both
lipid content and total length (p < 0.01, Rho = 0.50 and 0.33, respectively). In November 2006,
when lipid content was strongly correlated with total length (Rho = 0.78, Fig. 3.4), contents of all

55
the 11 most abundant fatty acids were significantly correlated with total length (Spearman Rho,
p < 0.001), among which 14:0, 20:1n-11, 22:1n-11, and 18:4n-3 were positively correlated
(Rho = 0.58, 0.59, 0.67, and 0.67, respectively, Fig. 3.6). Significant differences in fatty acid
composition were not detected among different areas within Uganik Bay (ANOSIM, p > 0.08),
but were found between different embayments. Specifically, in April 2007, herring in Uganik Bay
had different fatty acid composition from those in Tonki Bay (ANOSIM, p = 0.008); the two
sample groups were clustered separately in MDS ordination based on fatty acid composition
(Fig. 3.5). Samples from Uganik Bay had higher 18:1n-9 content but lower 22:1n-11 content than
those from Tonki Bay (Mann-Whitney U, p = 0.01); these two fatty acids accounted for 42.45%
of the dissimilarity in fatty acid composition between the two embayments.
Capelin lipid content ranged from 1.09 to 20.48% and was not significantly different among
months (p = 0.27, Table 3.1). Correlations between lipid content and total length were positive in
August 2004 and 2005 and negative in May 2005 (p < 0.01, Fig. 3.7). Large capelin
(10.0 – 14.0 cm) had lower lipid content in May 2005 than those in August of both 2004 and
2005, while small capelin (7.0 – 9.9 cm) exhibited the opposite pattern (p < 0.001). Fatty acid
composition in May was different (ANOSIM, p < 0.001) from that in August (2004 & 2005
combined). Contents of four and seven fatty acids were significantly correlated with lipid content
in May and August, respectively (p < 0.05, Table 3.4). Content of 22:1n-11 was positively
correlated with total length in both May and August (p ≤ 0.03, Rho = 0.48 and 0.72, respectively,
Fig. 3.8). Dissimilarity coefficient of fatty acid composition among all the samples was
significantly correlated with the differential in both lipid content and total length (p < 0.01,
Rho = 0.36 and 0.15, respectively). Fatty acid composition in large capelin was always different
from that in small ones when samples from the same embayment and month were compared
(ANOSIM, p ≤ 0.008, Table 3.5, Fig. 3.9). Fatty acid composition among embayments was
different for both large and small capelin (ANOSIM, p ≤ 0.008, Table 3.5, Fig. 3.9). In all cases

56
where the difference in fatty acid composition between sample groups was significant,
differences in contents of four fatty acids, 18:1n-9, 22:1n-11, 20:5n-3, and 22:6n-3, accounted for
55.34 to 75.41% of inter-group dissimilarities.
Eulachon lipid content ranged from 5.34% to 27.86%. Samples in April and May had lower
lipid content than those in August and November (p < 0.01, Table 3.1). Lipid content was
positively correlated with total length in both May and August (p < 0.01, Fig. 3.10). Fatty acid
composition was assessed for 20 eulachon collected in Uganik Bay in November 2006; only
20:5n-3 content was significantly correlated with lipid content (p < 0.05, Table 3.4); 18:1n-9 was
the most abundant fatty acid with its content averaging 39.34%.
At the species level, lipid content in pollock was the lowest and in eulachon the highest
among the four species (Mann-Whitney U, p < 0.001); there was no difference in lipid content
between herring and capelin (Mann-Whitney U, p = 1.00). In comparison, fatty acid composition
in the four species, pollock, herring, capelin, and eulachon, was different from each other
(ANOSIM, p < 0.001).
DISCUSSION
Results of this study demonstrated relatively large intra-species variations in forage fish lipid
content and fatty acid composition. The wide ranges of lipid content and fatty acid contents
within each species were similar to or slightly larger than those reported from other areas in the
GOA (Worthy & Miculka 1997, Iverson et al. 2002, Vollenweider 2005, Williams et al. 2009).
Both lipid content and fatty acid composition varied significantly by month and fish length, while
only fatty acid composition differed among embayments.
Seasonal variations in forage fish lipid content did not strictly mirror the annual cycle of prey
availability, since they are expected to reflect changes in species-specific energy budgets that
incorporate life history events (Robards et al. 1999, Kitts et al. 2004, Eder & Lewis 2005). From

57
April to May, lipid content in walleye pollock did not change, while it decreased in Pacific
herring; over the same period, zooplankton biomass is known to increase in the waters of the
GOA (Incze et al. 1997, Coyle & Pinchuk 2003). The different temporal trends between lipid
content and zooplankton biomass are likely attributed to differences in growth rates and maturity
stages of the two forage fishes between the two months. Juvenile pollock and herring have higher
growth rates in May than in April (Salveson 1984, Brodeur & Wilson 1996, Stokesbury et al.
1999), which requires more energy expenditure in May. In addition, spawning of herring peaks in
late April in the Kodiak waters (based on sac roe harvest dates in Spalinger & Gretsch 2007),
while our samples were collected in early April. Thus, lipid depletion during spawning
(Henderson et al. 1984, Robards et al. 1999) may have also contributed to the differences in lipid
content observed between April and May. In November, lipid content in pollock and herring was
higher than in May, despite lower concurrent zooplankton biomass (Incze et al. 1997, Coyle &
Pinchuk 2003). However, growth rates of pollock and herring in November transition from
positive to zero or negative (Salveson 1984, Brodeur & Wilson 1996, Stokesbury et al. 1999);
accordingly most of the energy intake at this time is believed to be stored as lipids for
overwintering (Paul et al. 1998, Foy & Paul 1999, Sogard & Olla 2000), which might explain the
higher lipid content at this time.
Ontogenetic patterns in lipid content were species specific. In November, larger pollock had
lower lipid content than smaller ones, while larger herring showed higher lipid content. These
opposite patterns indicate differences in winter-feeding levels between the two species. Previous
studies have demonstrated that energy content increases or does not change over winter months in
juvenile pollock (Paul et al. 1998), while it continually decreases in juvenile herring (Foy & Paul
1999), suggesting that energy input through winter-feeding is able to meet metabolic demands in
juvenile pollock but not in juvenile herring. In addition, both adult pollock and herring require
considerable amounts of energy during the winter months for the development of their gonads.
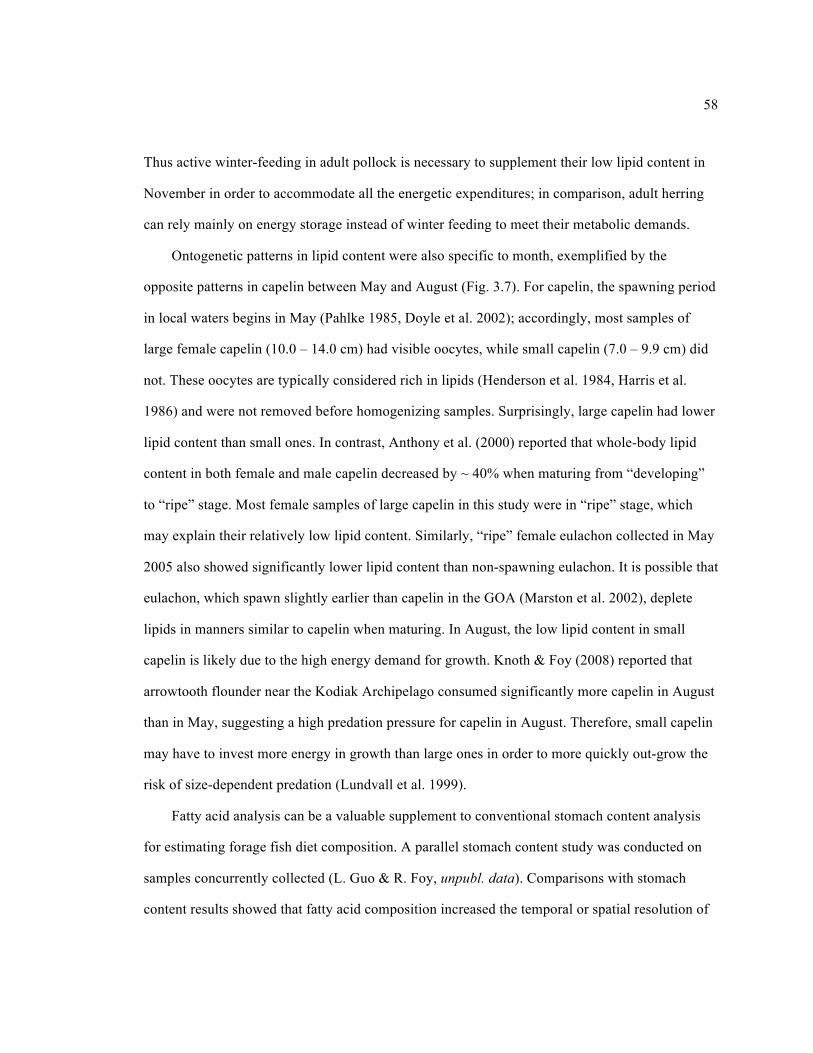
58
Thus active winter-feeding in adult pollock is necessary to supplement their low lipid content in
November in order to accommodate all the energetic expenditures; in comparison, adult herring
can rely mainly on energy storage instead of winter feeding to meet their metabolic demands.
Ontogenetic patterns in lipid content were also specific to month, exemplified by the
opposite patterns in capelin between May and August (Fig. 3.7). For capelin, the spawning period
in local waters begins in May (Pahlke 1985, Doyle et al. 2002); accordingly, most samples of
large female capelin (10.0 – 14.0 cm) had visible oocytes, while small capelin (7.0 – 9.9 cm) did
not. These oocytes are typically considered rich in lipids (Henderson et al. 1984, Harris et al.
1986) and were not removed before homogenizing samples. Surprisingly, large capelin had lower
lipid content than small ones. In contrast, Anthony et al. (2000) reported that whole-body lipid
content in both female and male capelin decreased by ~ 40% when maturing from “developing”
to “ripe” stage. Most female samples of large capelin in this study were in “ripe” stage, which
may explain their relatively low lipid content. Similarly, “ripe” female eulachon collected in May
2005 also showed significantly lower lipid content than non-spawning eulachon. It is possible that
eulachon, which spawn slightly earlier than capelin in the GOA (Marston et al. 2002), deplete
lipids in manners similar to capelin when maturing. In August, the low lipid content in small
capelin is likely due to the high energy demand for growth. Knoth & Foy (2008) reported that
arrowtooth flounder near the Kodiak Archipelago consumed significantly more capelin in August
than in May, suggesting a high predation pressure for capelin in August. Therefore, small capelin
may have to invest more energy in growth than large ones in order to more quickly out-grow the
risk of size-dependent predation (Lundvall et al. 1999).
Fatty acid analysis can be a valuable supplement to conventional stomach content analysis
for estimating forage fish diet composition. A parallel stomach content study was conducted on
samples concurrently collected (L. Guo & R. Foy, unpubl. data). Comparisons with stomach
content results showed that fatty acid composition increased the temporal or spatial resolution of
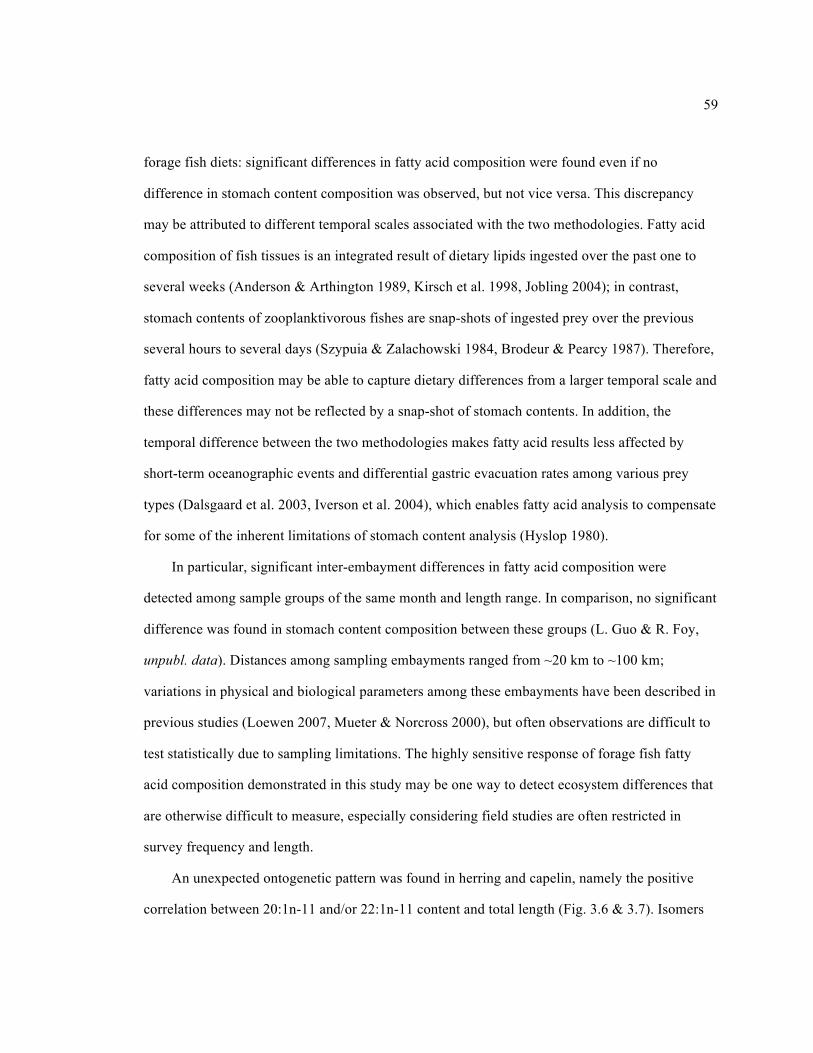
59
forage fish diets: significant differences in fatty acid composition were found even if no
difference in stomach content composition was observed, but not vice versa. This discrepancy
may be attributed to different temporal scales associated with the two methodologies. Fatty acid
composition of fish tissues is an integrated result of dietary lipids ingested over the past one to
several weeks (Anderson & Arthington 1989, Kirsch et al. 1998, Jobling 2004); in contrast,
stomach contents of zooplanktivorous fishes are snap-shots of ingested prey over the previous
several hours to several days (Szypuia & Zalachowski 1984, Brodeur & Pearcy 1987). Therefore,
fatty acid composition may be able to capture dietary differences from a larger temporal scale and
these differences may not be reflected by a snap-shot of stomach contents. In addition, the
temporal difference between the two methodologies makes fatty acid results less affected by
short-term oceanographic events and differential gastric evacuation rates among various prey
types (Dalsgaard et al. 2003, Iverson et al. 2004), which enables fatty acid analysis to compensate
for some of the inherent limitations of stomach content analysis (Hyslop 1980).
In particular, significant inter-embayment differences in fatty acid composition were
detected among sample groups of the same month and length range. In comparison, no significant
difference was found in stomach content composition between these groups (L. Guo & R. Foy,
unpubl. data). Distances among sampling embayments ranged from ~20 km to ~100 km;
variations in physical and biological parameters among these embayments have been described in
previous studies (Loewen 2007, Mueter & Norcross 2000), but often observations are difficult to
test statistically due to sampling limitations. The highly sensitive response of forage fish fatty
acid composition demonstrated in this study may be one way to detect ecosystem differences that
are otherwise difficult to measure, especially considering field studies are often restricted in
survey frequency and length.
An unexpected ontogenetic pattern was found in herring and capelin, namely the positive
correlation between 20:1n-11 and/or 22:1n-11 content and total length (Fig. 3.6 & 3.7). Isomers
60
of 20:1 and 22:1 fatty acids have been extensively used as natural biomarkers to quantify the
importance of calanoid copepods as prey for zooplanktivorous predators: higher 20:1 and 22:1
fatty acid contents indicate higher proportions of calanoid copepods in the diets (Sargent &
Henderson 1986, Dalsgaard et al. 2003, Tocher 2003, Springer et al. 2007). It has been repeatedly
reported that the relative importance of calanoid copepods as prey decrease as forage fishes grow
larger (Huse & Toresen 1996, Brodeur 1998, O'Driscoll et al. 2001, Wilson et al. 2006). The
same trend was observed in the parallel stomach content study (L. Guo & R. Foy, unpubl. data).
Hence we had expected that larger fish herein would have lower 20:1n-11 or 22:1n-11 contents
than smaller ones; however, our results showed the opposite pattern. This discrepancy suggests
that fatty acid analysis may offer insights into forage fish feeding ecology that might be missed
by stomach content analysis. It needs to be noted that our current knowledge of fatty acid
metabolism in fishes is based on a small number of species and on particular life stages (Tocher
2003); therefore, interpretations of fish fatty acid data are largely based on the assumption that
differences in lipid metabolism among species or life stages are not substantial.
This study described intra-species variations in lipid content and fatty acid composition of
four important forage fish species in relation to month, fish length, and embayments; these results
will serve as a baseline database for ecosystem investigations in local waters. Considering the
magnitudes of observed variations, it is apparent that the use of average values at the species level
should be avoided when applying lipid data to ecological studies. The construction of forage fish
lipid content and fatty acid databases, which are currently in great demand, should incorporate
factors including, but not limited to, month, fish length, and location. We also demonstrated that
fatty acid analysis can be used as a sensitive and informative tool, in combination with stomach
content analysis, to refine our knowledge of forage fish feeding ecology.
61
LITERATURE CITED
Anderson AJ, Arthington AH (1989) Effect of dietary lipid on the fatty acid composition of silver
perch (Leiopotherapon bidyanus) lipids. Comp Biochem Physiol, B 93:715-720
Anderson PJ, Piatt JF (1999) Community reorganization in the Gulf of Alaska following ocean
climate regime shift. Mar Ecol Prog Ser 189:117-123
Anthony JA, Roby DD, Turco KR (2000) Lipid content and energy density of forage fishes from
the northern Gulf of Alaska. J Exp Mar Biol Ecol 248:53-78
Ball JR, Esler D, Schmutz JA (2007) Proximate composition, energetic value, and relative
abundance of prey fish from the inshore eastern Bering Sea: implications for piscivorous
predators. Polar Biol 30:699-708
Bando MKH (2002) Comparing the nutritional quality of Steller sea lion (Eumetopias jubatus)
diets. MS Thesis, University of Alaska, Fairbanks, AK
Brodeur RD (1998) Prey selection by age-0 walleye pollock, Theragra chalcogramma, in
nearshore waters of the Gulf of Alaska. Environ Biol Fishes 51:175-186
Brodeur RD, Pearcy WG (1987) Diel feeding chronology, gastric evacuation and estimated daily
ration of juvenile coho salmon, Oncorhynchus kisutch (Walbaum), in the coastal marine
environment. J Fish Biol 31:465-477
Brodeur RD, Wilson MT (1996) A review of the distribution, ecology and population dynamics
of age-0 walleye pollock in the Gulf of Alaska. Fish Oceanogr 5:148-166
Christie WW (2003) Lipid Analysis. The Oily Press, Bridgewater, UK
Coyle KO, Pinchuk AI (2003) Annual cycle of zooplankton abundance, biomass and production
on the northern Gulf of Alaska shelf, October 1997 through October 2000. Fish Oceanogr
12:327-338
62
Dalsgaard J, St. John M (2004) Fatty acid biomarkers: validation of food web and trophic
markers using 13C-labelled fatty acids in juvenile sandeel (Ammodytes tobianus). Can J
Fish Aquat Sci 61:1671-1680
Dalsgaard J, St John M, Kattner G, Hagen W (2003) Fatty acid trophic markers in the pelagic
marine environment. Adv Mar Biol 46:225-340
Doyle MJ, Busby MS, Duffy-Anderson JT, Picquelle SJ, Matarese AC (2002) Aspects of the
early life history of capelin (Mallotus villosus) in the northwest Gulf of Alaska: a historical
perspective based on larval collections October 1977 - March 1979. NOAA Tech Memo
NMFS-AFSC-132
Eder EB, Lewis MN (2005) Proximate composition and energetic value of demersal and pelagic
prey species from the SW Atlantic Ocean. Mar Ecol Prog Ser 291:43-52
Folch J, Lees M, Sloane-Stanley GH (1957) A simple method for the isolation and purification of
total lipids from animal tissues. J Biol Chem 226:497-509
Foy RJ, Paul AJ (1999) Winter feeding and changes in somatic energy content of age-0 Pacific
herring in Prince William Sound, Alaska. Trans Am Fish Soc 128:1193-1200
Harris RK, Nishiyama T, Paul AJ (1986) Carbon, nitrogen and caloric content of eggs, larvae,
and juveniles of the walleye pollock, Theragra chalcogramma. J Fish Biol 29:87-98
Hartman KJ, Brandt SB (1993) Systematic sources of bias in a bioenergetics model: examples for
age-0 striped bass. Trans Am Fish Soc 122:912-926
Henderson RJ, Sargent JR, Hopkins CCE (1984) Changes in the content and fatty acid
composition of lipid in an isolated population of the capelin Mallotus villosus during
sexual maturation and spawning. Mar Biol 78:255-263
Huse G, Toresen R (1996) A comparative study of the feeding habits of herring (Clupea harengus,
Clupeidae, L) and capelin (Mallotus villosus, Osmeridae, Muller) in the Barents Sea. Sarsia
81:143-153

63
Hyslop EJ (1980) Stomach contents analysis - a review of methods and their application. J Fish
Biol 17:411-429
Incze LS, Siefert DW, Napp JM (1997) Mesozooplankton of Shelikof Strait, Alaska: abundance
and community composition. Cont Shelf Res 17:287-305
Iverson SJ, Frost KJ, Lowry LF (1997) Fatty acid signatures reveal fine scale structure of
foraging distribution of harbor seals and their prey in Prince William Sound, Alaska. Mar
Ecol Prog Ser 151:255-271
Iverson SJ, Frost KJ, Lang SLC (2002) Fat content and fatty acid composition of forage fish and
invertebrates in Prince William Sound, Alaska: Factors contributing to among and within
species variability. Mar Ecol Prog Ser 241:161-181
Iverson SJ, Field C, Bowen WD, Blanchard W (2004) Quantitative fatty acid signature analysis: a
new method of estimating predator diets. Ecol Monogr 74:211-235
Jobling M (2004) 'Finishing' feeds for carnivorous fish and the fatty acid dilution model.
Aquacult Res 35:706-709
Kirsch PE, Iverson SJ, Bowen WD, Kerr SR, Ackman RG (1998) Dietary effects on the fatty acid
signature of whole Atlantic cod (Gadus morhua). Can J Fish Aquat Sci 55:1378-1386
Kitts DD, Huynh MD, Hu C, Trites AW (2004) Season variation in nutrient composition of
Alaskan walleye pollock. Can J Zool 82:1408-1415
Knoth BA, Foy RJ (2008) Temporal variability in the food habits of arrowtooth flounder
(Atheresthes stomias) in the western Gulf of Alaska. NOAA Tech Memo
NMFS-AFSC-194
Kruskal JB, Wish M (1981) Multidimensional scaling. Sage Publications, London
Litz MNC, Brodeur RD, Emmett RL, Heppell SS, Rasmussen RS, O'Higgins L, Morris MS (2010)
Effects of variable oceanographic conditions on forage fish lipid content and fatty acid
composition in the northern California Current. Mar Ecol Prog Ser 405:71-85
64
Litzow MA, Bailey KM, Prahl FG, Heintz R (2006) Climate regime shifts and reorganization of
fish communities: the essential fatty acid limitation hypothesis. Mar Ecol Prog Ser
315:1-11
Loewen ME (2007) Seasonal oceanographic influences on Pacific herring and walleye pollock
distribution and abundance in nearshore embayments of Kodiak Island, Alaska. MS Thesis,
University of Alaska, Fairbanks, AK
Lowry LF, Frost KJ, Loughlin TR (1989) Importance of walleye pollock in the diets of marine
mammals in the Gulf of Alaska and Bering Sea, and implications for fishery management.
In: Melteff B (ed) Proceedings of international symposium on the biology and management
of walleye pollock. Proc 7th Lowell Wakefield Fish Symp. University of Alaska Sea Grant
College Program, Fairbanks, AK
Lundvall D, Svanbaeck R, Persson L, Bystroem P (1999) Size-dependent predation in piscivores:
interactions between predator foraging and prey avoidance abilities. Can J Fish Aquat Sci
56:1285-1292
Marston BH, Willson MF, Gende SM (2002) Predator aggregations during eulachon Thaleichthys
pacificus spawning runs. Mar Ecol Prog Ser 231:229-236
McKenzie J, Wynne KM (2008) Spatial and temporal variation in the diet of Steller sea lions in
the Kodiak Archipelago, 1999 to 2005. Mar Ecol Prog Ser 360:265-283
Merrick RL, Loughlin TR, Calkins DG (1987) Decline in abundance of the Northern Sea Lion,
Eumetopias jubatus, in Alaska, 1956-86. Fish Bull 85:351-365
Merrick RL, Chumbley MK, Byrd GV (1997) Diet diversity of Steller sea lions (Eumetopias
jubatus) and their population decline in Alaska: a potential relationship. Can J Fish Aquat
Sci 54:1342-1348
65
Montevecchi WA, Piatt J (1984) Composition and energy contents of mature inshore spawning
capelin (Mallotus villosus): implications for seabird predators. Comp Biochem Physiol, A
78:15-20
Mueter FJ, Norcross BL (2000) Changes in species composition of the demersal fish community
in nearshore waters of Kodiak Island, Alaska. Can J Fish Aquat Sci 57:1169-1180
Ney JJ (1993) Bioenergetics modeling today: growing pains on the cutting edge. Trans Am Fish
Soc 122:736-748
O'Driscoll RL, Parsons MJD, Rose GA (2001) Feeding of capelin (Mallotus villosus) in
Newfoundland waters. Sarsia 86:165-176
Pahlke KA (1985) Preliminary studies of capelin (Mallotus villosus) in Alaskan waters. MS
Thesis, University of Alaska, Juneau, AK
Paul AJ, Paul JM, Smith RL (1998) Seasonal changes in whole-body energy content and
estimated consumption rates of age-0 walleye pollock from Prince William Sound, Alaska.
Estuar Coast Shelf Sci 47:251-259
Payne SA, Johnson BA, Otto RS (1999) Proximate composition of some north-eastern Pacific
forage fish species. Fish Oceanogr 8:159-177
Robards MD, Anthony JA, Rose GA, Piatt JF (1999) Changes in proximate composition and
somatic energy content for Pacific sand lance (Ammodytes hexapterus) from Kachemak
Bay, Alaska relative to maturity and season. J Exp Mar Biol Ecol 242:245-258
Rosa R, Gonzalez L, Broitman BR, Garrido S, Santos AMP, Nunes ML (2010) Bioenergetics of
small pelagic fishes in upwelling systems: relationship between fish condition, coastal
ecosystem dynamics and fisheries. Mar Ecol Prog Ser 410:205-218
Rosen DAS, Trites AW (2000a) Digestive efficiency and dry-matter digestibility in Steller sea
lions fed herring, pollock, squid, and salmon. Can J Zool 78:234-239

66
Rosen DAS, Trites AW (2000b) Pollock and the decline of Steller sea lions: testing the junk-food
hypothesis. Can J Zool 78:1243-1250
Salveson SJ (1984) Growth and distribution of first-year walleye pollock, Theragra
chalcogramma, in North Stephens Passage, Southeastern Alaska. MS Thesis, University of
Alaska, Fairbanks, AK
Sargent JR, Henderson RJ (1986) Lipids. In: Corner EDS, O'Hara SCM (eds) The biological
chemistry of marine copepods. Clarendon Press, Oxford, p 59-108
Sargent JR, Parkes RJ, Mueller-Harvey I, Henderson RJ (1987) Lipid biomarkers in marine
ecology. In: Sleigh MA (ed) Microbes in the sea. Wiley and Sons, New York, p 119-138
Schaufler L, Logerwell E, Vollenweider J (2006) Geographical variation in Steller sea lion prey
quality in Alaska. In: Trites AW, Atkinson SK, DeMaster DP, Fritz LW, Gelatt TS, Rea
LD, Wynne KM (eds) Sea lions of the world. Proc 22nd Lowell Wakefield Fish Symp.
University of Alaska Sea Grant College Program, Fairbanks, AK
Sogard SM, Olla BL (2000) Endurance of simulated winter conditions by age-0 walleye pollock:
effects of body size, water temperature and energy stores. J Fish Biol 56:1-21
Spalinger G, Gretsch D (2007) Kodiak management area annual herring fisheries management
report, 2005. Fish Mgmt Rep 07-08, Alaska Department of Fish and Game, Kodiak, AK
Spitz J, Mourocq E, Schoen V, Ridoux V (2010) Proximate composition and energy content of
forage species from the Bay of Biscay: high- or low-quality food? ICES J Mar Sci
67:909-915
Springer AM, Speckman SG (1997) A forage fish is what? Summary of the symposium. In:
Mecklenburg W (ed) Forage fishes in marine ecosystems. Proc 14th Lowell Wakefield
Fish Symp. University of Alaska Sea Grant College Program, Fairbanks, AK
Springer AM, Byrd GV, Iverson SJ (2007) Hot oceanography: planktivorous seabirds reveal
ecosystem responses to warming of the Bering Sea. Mar Ecol Prog Ser 352:289-297
67
Stevens CJ, Deibel D, Parrish CC (2004) Species-specific differences in lipid composition and
omnivory indices in Arctic copepods collected in deep water during autumn (North Water
Polynya). Mar Biol 144:905-915
Stokesbury KDE, Foy RJ, Norcross BL (1999) Spatial and temporal variability in juvenile Pacific
herring, Clupea pallasi, growth in Prince William Sound Alaska. Environ Biol Fishes
56:409-418
Szypuia J, Zalachowski W (1984) Duration of food evacuation in herring, Clupea harengus L.,
and sprat, Sprattus sprattus (L.). Acta Ichthyol Pisc 14:93-104
Tocher DR (2003) Metabolism and functions of lipids and fatty acids in teleost fish. Rev Fish Sci
11:107-184
Van Pelt TI, Piatt JF, Lance BK, Roby DD (1997) Proximate composition and energy density of
some North Pacific forage fishes. Comp Biochem Physiol, A 118:1393-1398
Vollenweider JJ (2005) Variability in Steller Sea Lion (Eumetopias jubatus) prey quality in
southeastern Alaska. MS Thesis, University of Alaska, Fairbanks, AK
Ways P, Hanahan DJ (1964) Characterization and quantification of red cell lipids in normal man.
J Lipid Res 5:318-328
Williams CT, Buck CL (2010) Using fatty acids as dietary tracers in seabird trophic ecology:
theory, application and limitations. J Ornithol 151:531-543
Williams CT, Iverson SJ, Buck CL (2009) The effects of diet and caloric restriction on adipose
tissue fatty acid signatures of tufted puffin (Fratercula cirrhata) nestlings. J Comp Physiol
B 179:711-720
Wilson MT, Jump CM, Duffy-Anderson JT (2006) Comparative analysis of the feeding ecology
of two pelagic forage fishes: capelin (Mallotus villosus) and walleye pollock (Theragra
chalcogramma). Mar Ecol Prog Ser 317:245-258
68
Worthy GAJ, Miculka TA (1997) Proximate composition and fatty acid signatures of selected
forage fish species in Prince William Sound, Alaska. Exxon Valdez Oil Spill Restoration
Project 95121 Final Report, NOAA, Seattle, WA
Wuenschel MJ, Jugovich AR, Hare JA (2006) Estimating the energy density of fish: the
importance of ontogeny. Trans Am Fish Soc 135:379-385
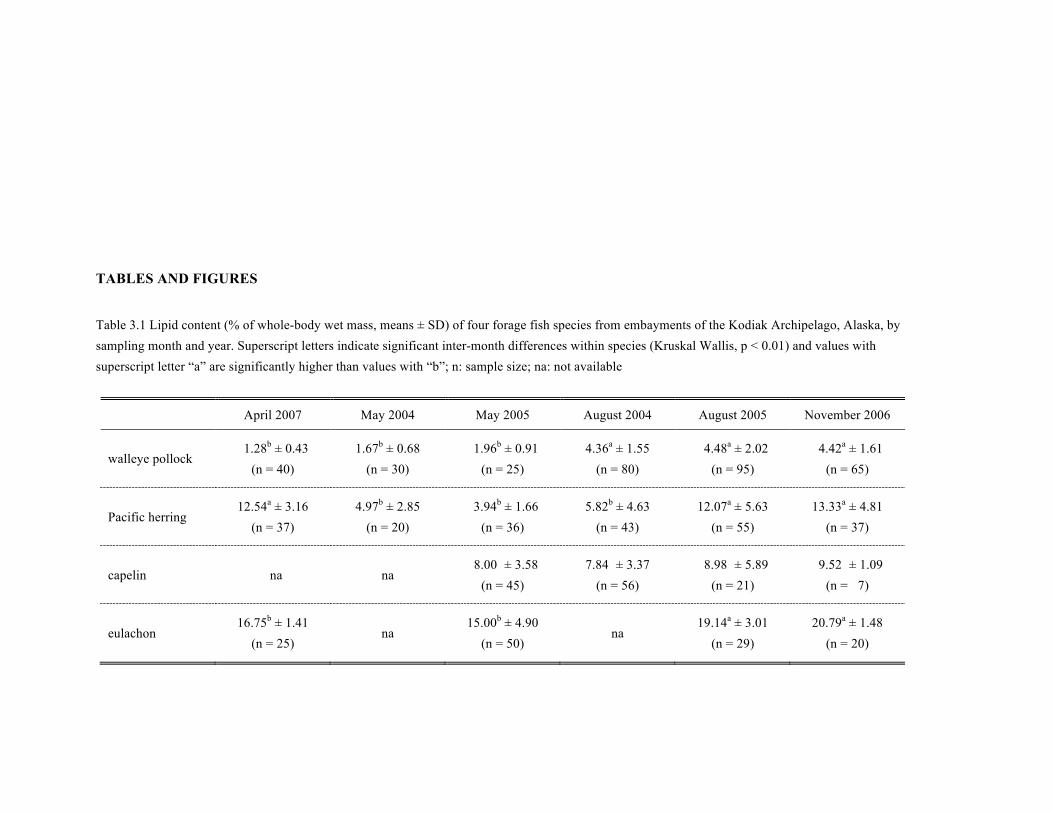
69
TABLES AND FIGURES
Table 3.1 Lipid content (% of whole-body wet mass, means ± SD) of four forage fish species from embayments of the Kodiak Archipelago, Alaska, by sampling month and year. Superscript letters indicate significant inter-month differences within species (Kruskal Wallis, p < 0.01) and values with superscript letter “a” are significantly higher than values with “b”; n: sample size; na: not available
April 2007 May 2004 May 2005 August 2004 August 2005 November 2006
walleye pollock 01.28b ± 0.43
(n = 40) 1.67b ± 0.68
(n = 30) 01.96b ± 0.91
(n = 25) 4.36a ± 1.55
(n = 80) 04.48a ± 2.02
(n = 95) 04.42a ± 1.61
(n = 65)
Pacific herring 12.54a ± 3.16
(n = 37) 4.97b ± 2.85
(n = 20) 03.94b ± 1.66
(n = 36) 5.82b ± 4.63
(n = 43) 12.07a ± 5.63
(n = 55) 13.33a ± 4.81
(n = 37)
capelin 0na na 08.00a ± 3.58
(n = 45) 7.84a ± 3.37
(n = 56) 8.98a ± 5.89
(n = 21) 09.52a ± 1.09
(n = 07)
eulachon 16.75b ± 1.41
(n = 25) na
15.00b ± 4.90 (n = 50)
na 19.14a ± 3.01
(n = 29) 20.79a ± 1.48
(n = 20)
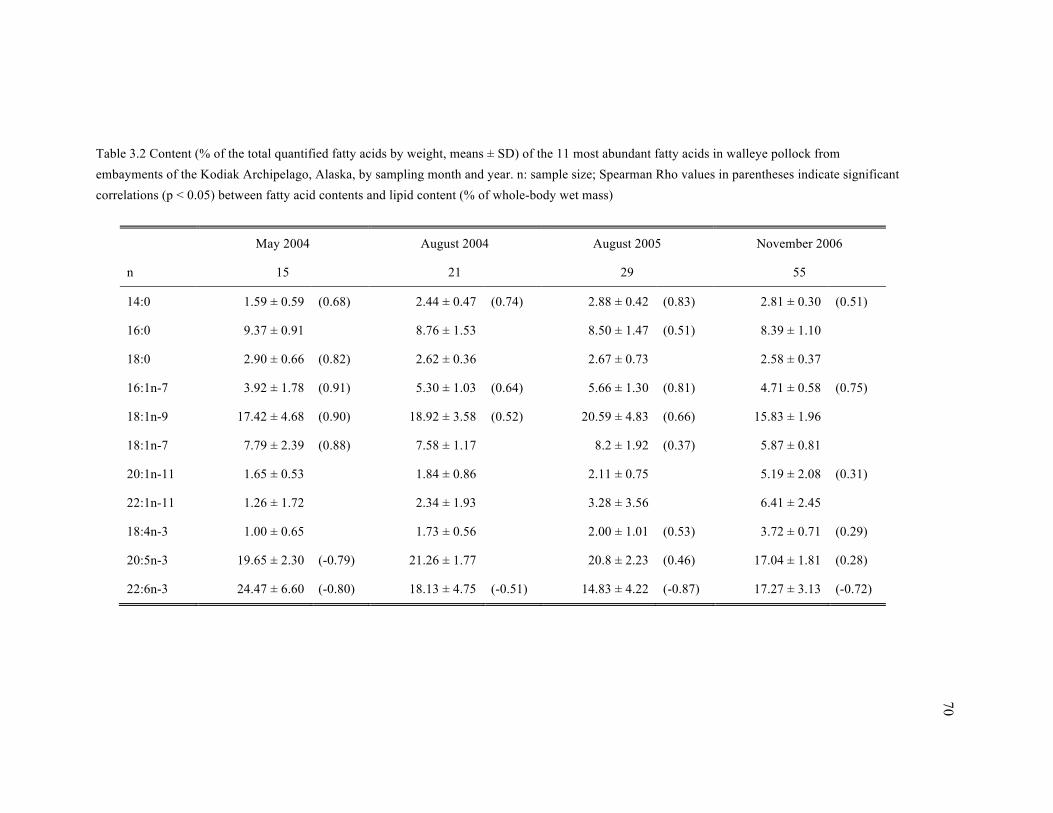
70
Table 3.2 Content (% of the total quantified fatty acids by weight, means ± SD) of the 11 most abundant fatty acids in walleye pollock from embayments of the Kodiak Archipelago, Alaska, by sampling month and year. n: sample size; Spearman Rho values in parentheses indicate significant correlations (p < 0.05) between fatty acid contents and lipid content (% of whole-body wet mass)
May 2004 August 2004 August 2005 November 2006
n 15 21 29 55
14:0 1.59 ± 0.59 (0.68) 2.44 ± 0.47 (0.74) 2.88 ± 0.42 (0.83) 2.81 ± 0.30 (0.51)
16:0 9.37 ± 0.91 8.76 ± 1.53 8.50 ± 1.47 (0.51) 8.39 ± 1.10
18:0 2.90 ± 0.66 (0.82) 2.62 ± 0.36 2.67 ± 0.73 2.58 ± 0.37
16:1n-7 3.92 ± 1.78 (0.91) 5.30 ± 1.03 (0.64) 5.66 ± 1.30 (0.81) 4.71 ± 0.58 (0.75)
18:1n-9 17.42 ± 4.68 (0.90) 18.92 ± 3.58 (0.52) 20.59 ± 4.83 (0.66) 15.83 ± 1.96
18:1n-7 7.79 ± 2.39 (0.88) 7.58 ± 1.17 8.2 ± 1.92 (0.37) 5.87 ± 0.81
20:1n-11 1.65 ± 0.53 1.84 ± 0.86 2.11 ± 0.75 5.19 ± 2.08 (0.31)
22:1n-11 1.26 ± 1.72 2.34 ± 1.93 3.28 ± 3.56 6.41 ± 2.45
18:4n-3 1.00 ± 0.65 1.73 ± 0.56 2.00 ± 1.01 (0.53) 3.72 ± 0.71 (0.29)
20:5n-3 19.65 ± 2.30 (-0.79) 21.26 ± 1.77 20.8 ± 2.23 (0.46) 17.04 ± 1.81 (0.28)
22:6n-3 24.47 ± 6.60 (-0.80) 18.13 ± 4.75 (-0.51) 14.83 ± 4.22 (-0.87) 17.27 ± 3.13 (-0.72)
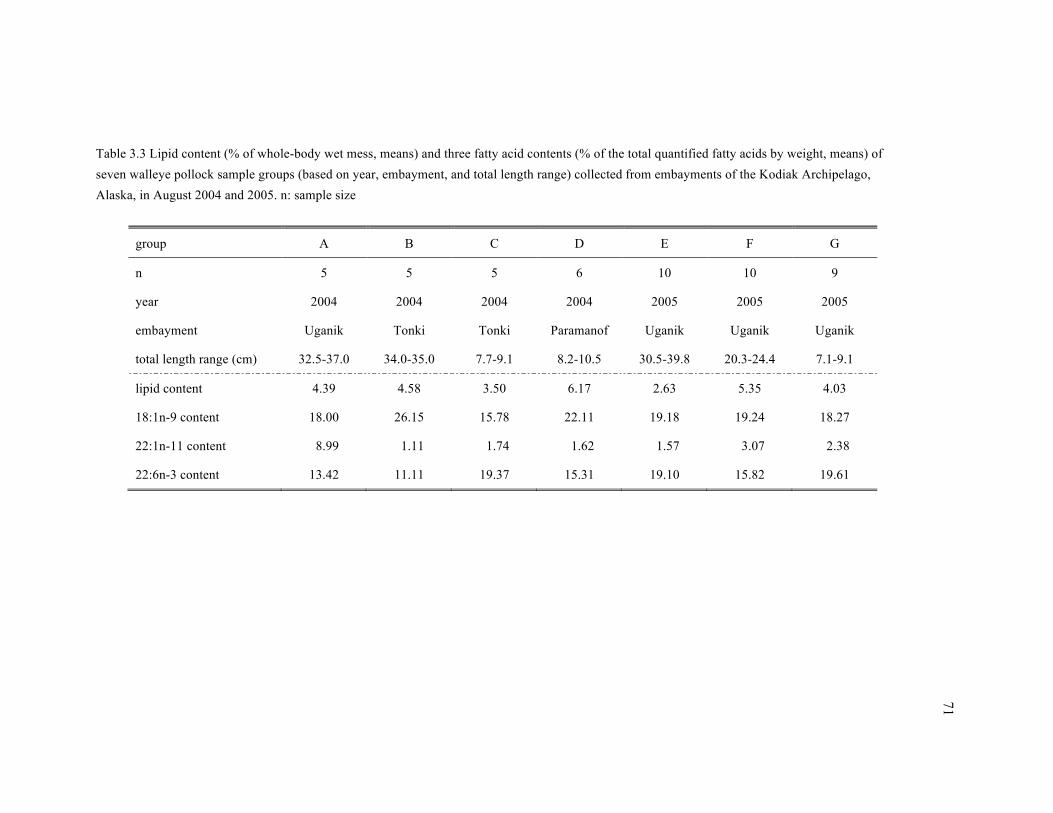
71
Table 3.3 Lipid content (% of whole-body wet mess, means) and three fatty acid contents (% of the total quantified fatty acids by weight, means) of seven walleye pollock sample groups (based on year, embayment, and total length range) collected from embayments of the Kodiak Archipelago, Alaska, in August 2004 and 2005. n: sample size
group A B C D E F G
n 5 5 5 6 10 10 9
year 2004 2004 2004 2004 2005 2005 2005
embayment Uganik Tonki Tonki Paramanof Uganik Uganik Uganik
total length range (cm) 32.5-37.0 34.0-35.0 7.7-9.1 8.2-10.5 30.5-39.8 20.3-24.4 7.1-9.1
lipid content 4.39 4.58 3.50 6.17 2.63 5.35 4.03
18:1n-9 content 18.00 26.15 15.78 22.11 19.18 19.24 18.27
22:1n-11 content 08.99 01.11 01.74 01.62 01.57 03.07 02.38
22:6n-3 content 13.42 11.11 19.37 15.31 19.10 15.82 19.61

72
Table 3.4 Content (% of the total quantified fatty acids by weight, means ± SD) of the 11 most abundant fatty acids in Pacific herring, capelin, and eulachon sampled from embayments of the Kodiak Archipelago, Alaska. n: sample size; Spearman Rho values in parentheses indicate significant correlations (p < 0.05) between fatty acid contents and lipid content (% of whole-body wet mass)
Pacific herring
------------------------- capelin ------------------------- eulachon
May (2005) August (2004 & 2005)
n 56 20 36 20
14:0 4.17 ± 0.90 (0.56) 4.11 ± 0.60 4.06 ± 0.7 4.33 ± 0.41
16:0 8.10 ± 1.92 (-0.60) 7.84 ± 2.00 7.12 ± 1.83 (-0.35) 7.84 ± 1.29
18:0 1.21 ± 0.63 (-0.77) 1.63 ± 0.63 1.53 ± 0.51 (-0.65) 1.59 ± 0.27
16:1n-7 5.35 ± 0.92 (-0.39) 7.26 ± 0.70 6.52 ± 1.16 7.78 ± 0.54
18:1n-9 14.65 ± 4.60 (-0.64) 22.75 ± 15.96 (0.62) 16.2 ± 4.11 39.34 ± 3.53
18:1n-7 3.26 ± 1.95 (-0.80) 5.17 ± 2.36 3.76 ± 1.69 8.64 ± 0.45
20:1n-11 7.34 ± 4.15 (0.66) 2.19 ± 0.87 4.31 ± 2.09 (0.38) 1.50 ± 0.25
22:1n-11 15.73 ± 9.61 (0.79) 7.15 ± 5.58 11.32 ± 8.24 (0.60) 4.67 ± 1.76
18:4n-3 4.10 ± 1.85 (0.63) 3.36 ± 1.90 (-0.49) 3.97 ± 1.22 (0.39) 2.47 ± 0.53
20:5n-3 12.95 ± 3.59 (-0.50) 16.10 ± 4.75 (-0.49) 14.71 ± 2.61 (-0.33) 7.10 ± 1.62 (0.51)
22:6n-3 13.67 ± 4.59 (-0.74) 13.21 ± 4.23 (-0.81) 14.53 ± 4.76 (-0.72) 6.52 ± 1.02
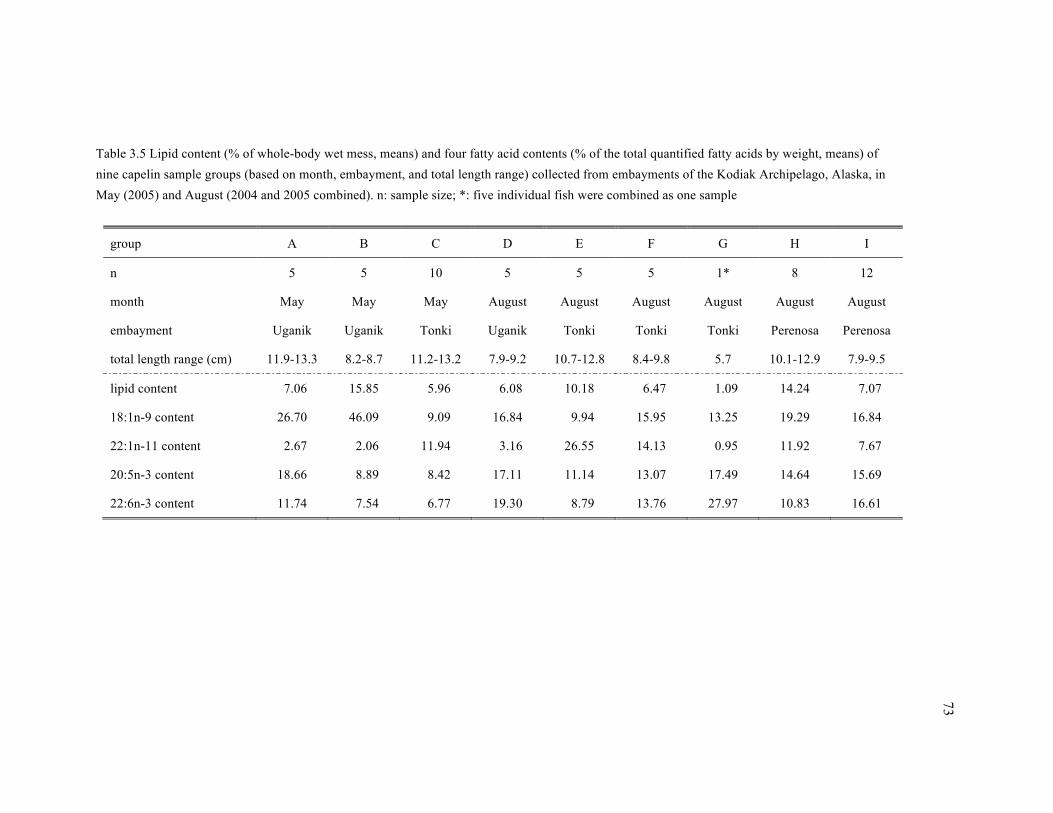
73
Table 3.5 Lipid content (% of whole-body wet mess, means) and four fatty acid contents (% of the total quantified fatty acids by weight, means) of nine capelin sample groups (based on month, embayment, and total length range) collected from embayments of the Kodiak Archipelago, Alaska, in May (2005) and August (2004 and 2005 combined). n: sample size; *: five individual fish were combined as one sample
group A B C D E F G H I
n 5 5 10 5 5 5 1* 8 12
month May May May August August August August August August
embayment Uganik Uganik Tonki Uganik Tonki Tonki Tonki Perenosa Perenosa
total length range (cm) 11.9-13.3 8.2-8.7 11.2-13.2 7.9-9.2 10.7-12.8 8.4-9.8 5.7 10.1-12.9 7.9-9.5
lipid content 07.06 15.85 05.96 06.08 10.18 06.47 01.09 14.24 07.07
18:1n-9 content 26.70 46.09 09.09 16.84 09.94 15.95 13.25 19.29 16.84
22:1n-11 content 02.67 02.06 11.94 03.16 26.55 14.13 00.95 11.92 07.67
20:5n-3 content 18.66 08.89 18.42 17.11 11.14 13.07 17.49 14.64 15.69
22:6n-3 content 11.74 07.54 16.77 19.30 08.79 13.76 27.97 10.83 16.61
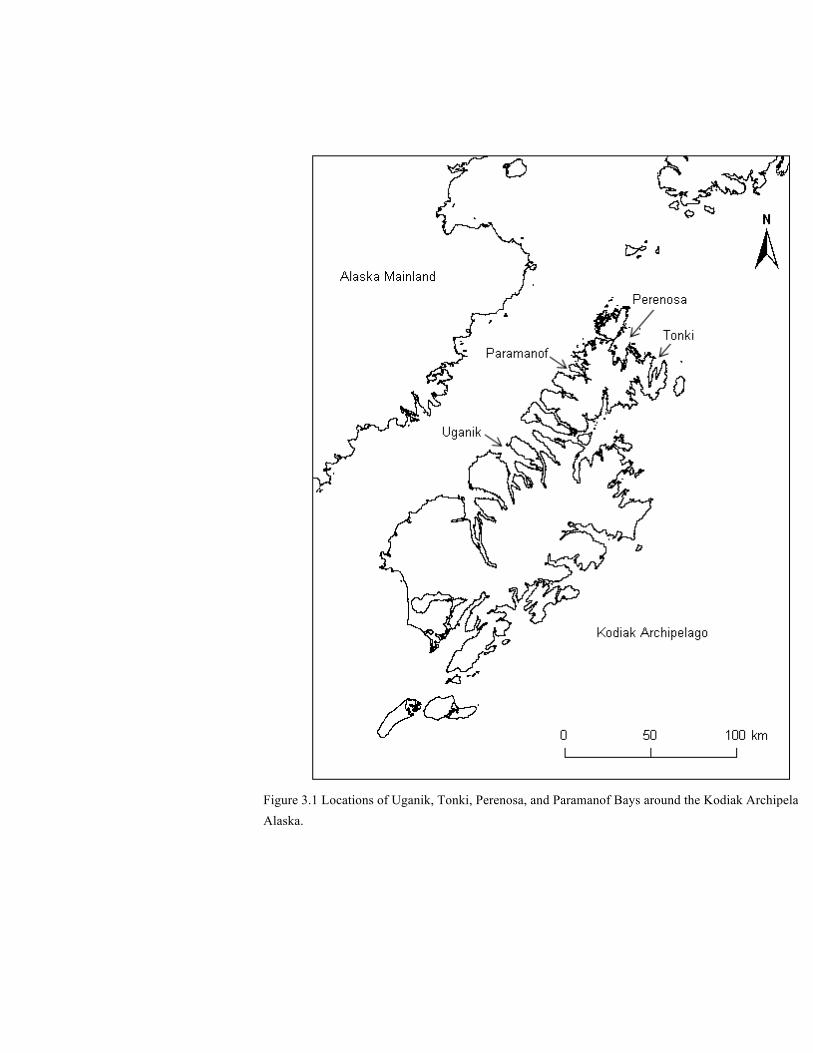
74
Figure 3.1 Locations of Uganik, Tonki, Perenosa, and Paramanof Bays around the Kodiak Archipelago, Alaska.
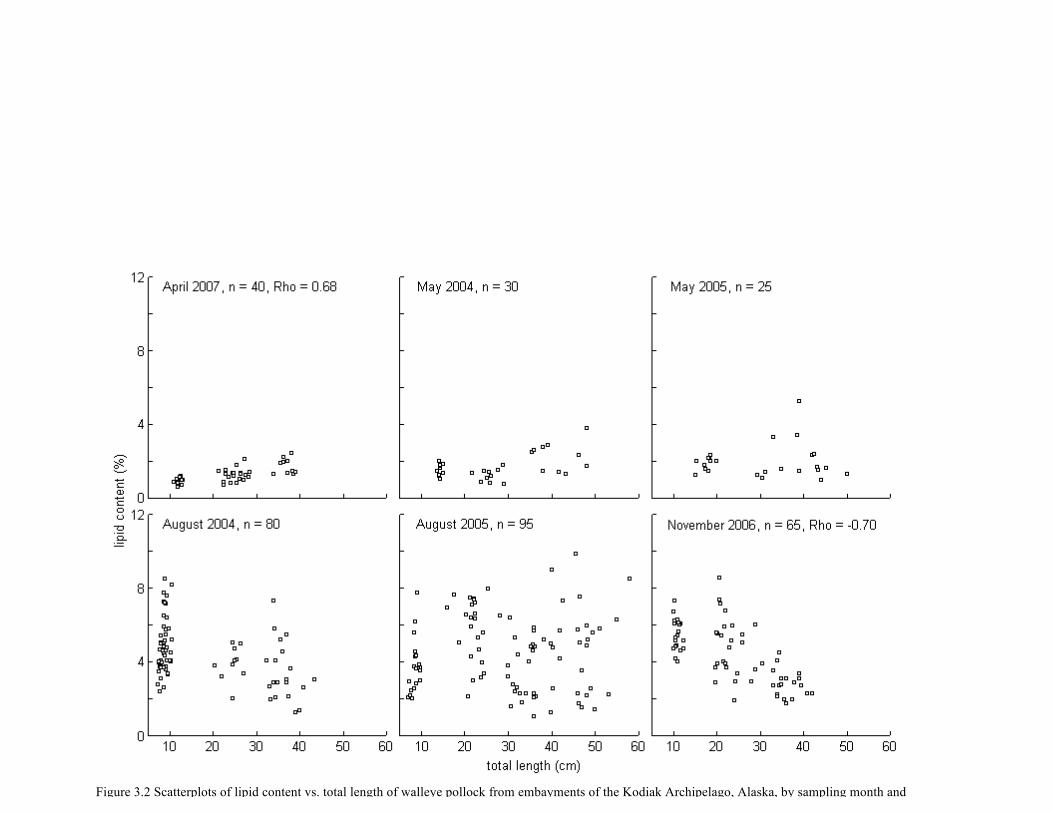
75
Figure 3.2 Scatterplots of lipid content vs. total length of walleye pollock from embayments of the Kodiak Archipelago, Alaska, by sampling month and year. n: sample size; Spearman Rho values indicate significant correlations (p < 0.01) between lipid content and total length

76
Figure 3.3 MDS ordination of walleye pollock fatty acid composition (n = 120) sampled from embayments of the Kodiak Archipelago, Alaska. MDS two-dimensional stress = 0.083
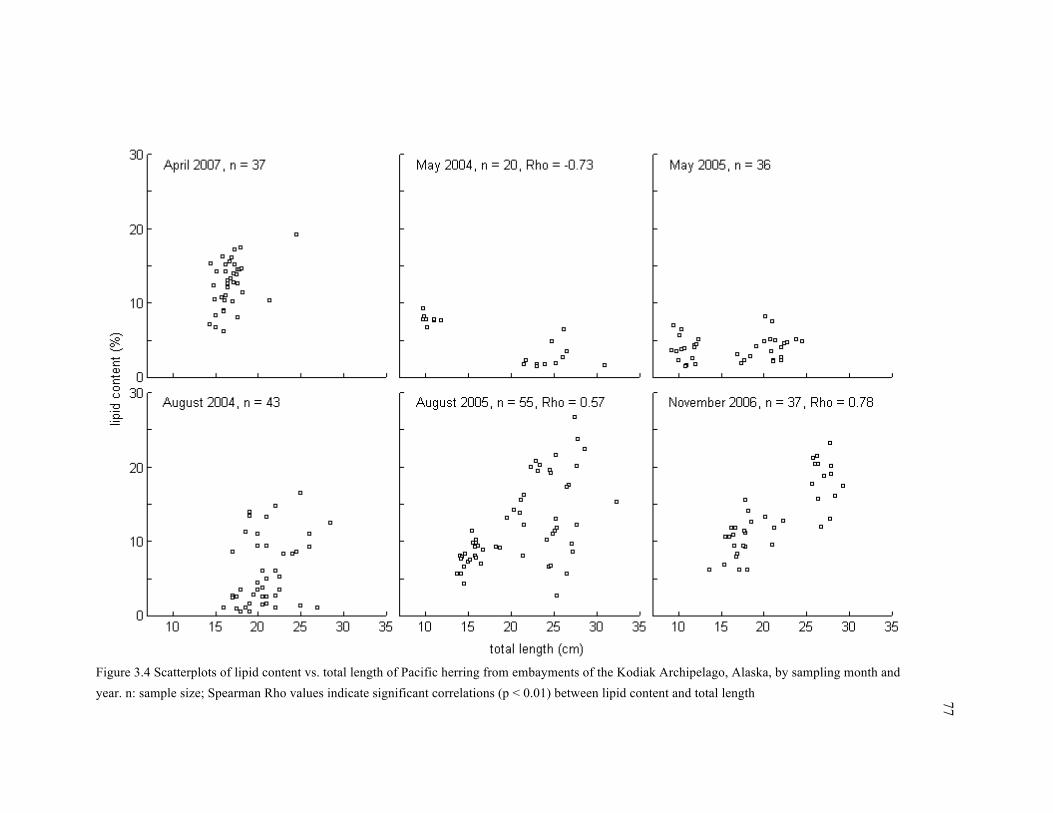
77
Figure 3.4 Scatterplots of lipid content vs. total length of Pacific herring from embayments of the Kodiak Archipelago, Alaska, by sampling month and year. n: sample size; Spearman Rho values indicate significant correlations (p < 0.01) between lipid content and total length

78
Figure 3.5 MDS ordination of Pacific herring fatty acid composition (n = 57, of which one sample considered as outlier) sampled from embayments of the Kodiak Archipelago, Alaska. MDS two-dimensional stress = 0.059

79
Figure 3.6 Contents (% of the total quantified fatty acids by weight) of four fatty acids plotted against total length of Pacific herring (n = 36) sampled from Uganik Bay, Alaska, in November 2006.
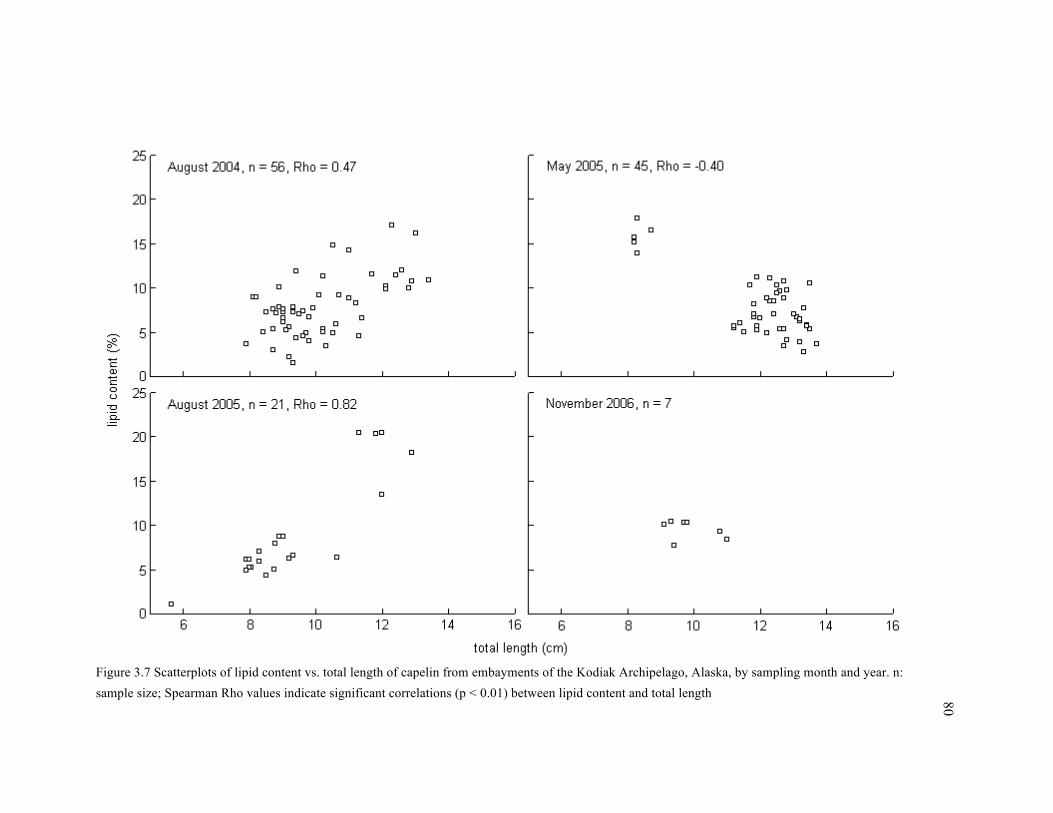
80
Figure 3.7 Scatterplots of lipid content vs. total length of capelin from embayments of the Kodiak Archipelago, Alaska, by sampling month and year. n: sample size; Spearman Rho values indicate significant correlations (p < 0.01) between lipid content and total length

81
Figure 3.8 Content (% of the total quantified fatty acids by weight) of fatty acid 22:1n-11 plotted against total length of capelin sampled from embayments of the Kodiak Archipelago, Alaska, in May (2005, n = 20) and August (2004 and 2005 combined, n = 36).

82
Figure 3.9 MDS ordination of capelin fatty acid composition (n = 56) sampled from embayments of the Kodiak Archipelago, Alaska. Sample group A to I described in Table 3.5; MDS two-dimensional stress = 0.081
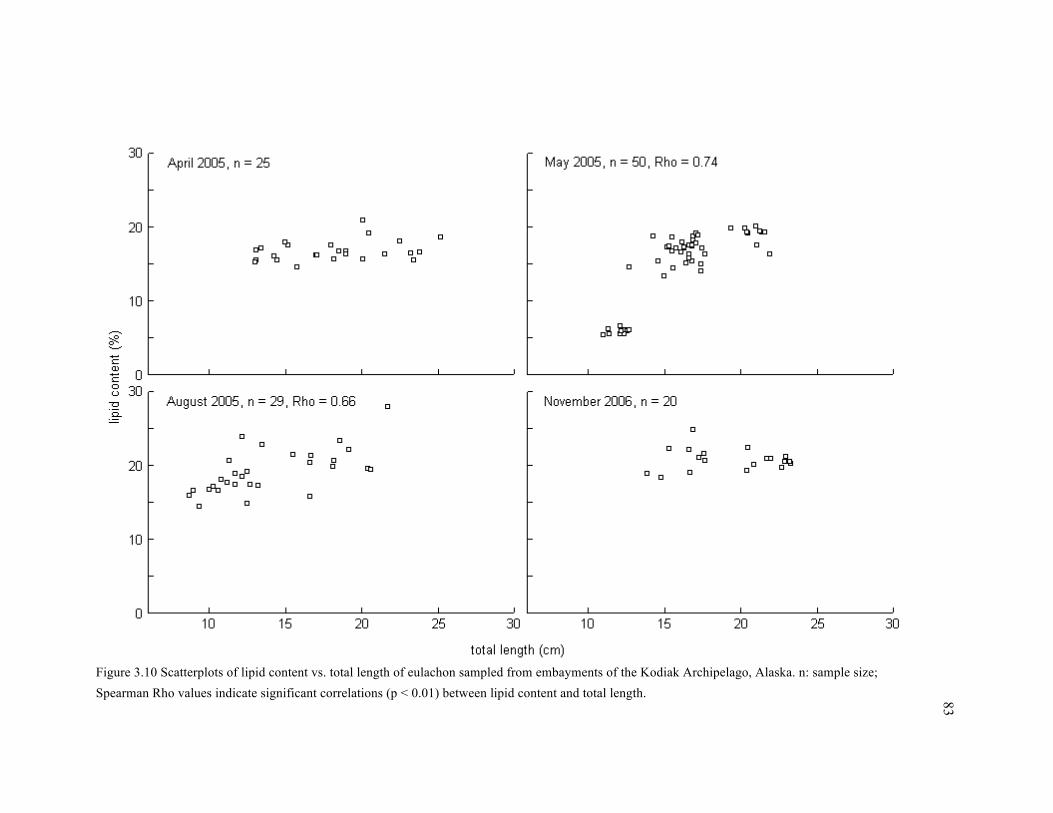
83
Figure 3.10 Scatterplots of lipid content vs. total length of eulachon sampled from embayments of the Kodiak Archipelago, Alaska. n: sample size; Spearman Rho values indicate significant correlations (p < 0.01) between lipid content and total length.

84
Chapter 4:
Measuring Mesoscale Horizontal Distribution Characteristics and Energy Density
of Pelagic Forage Fishes in Coastal Waters of the Kodiak Archipelago, Alaska1
ABSTRACT
The quality of prey fields available to piscivorous predators is largely defined by mesoscale
(0.1’s – 10’s km) attributes of forage fish aggregations. To better understand forage fish
availability to local apex predators, we measured mesoscale horizontal distribution characteristics
and energy density of four pelagic forage fishes, Pacific herring (Clupea pallasii), eulachon
(Thaleichthys pacificus), capelin (Mallotus villosus), and walleye pollock (Theragra
chalcogramma), in coastal waters off the Kodiak Archipelago, Alaska, in May and August 2005.
Distribution parameters, including area of occupation, aggregation size, and index of aggregation,
varied considerably among fish species and month. Patchiness was consistently higher in
narrower embayments than wider ones or open areas. Biomass of forage fish assemblages was
found to be a reasonable proxy for energy content at the scales of 10’s to 100’s km2. Dense
aggregations formed seasonal energetic “hotspots” of prey fields for piscivorous predators,
exemplified by herring schools on the west side of the Archipelago in May and capelin schools on
the northeast side in August. The spatial patterns of seasonal “hotspots” may have profound
implications for prey choice and feeding success of local apex predators, which could affect
predator bioenergetics at the population level.
1 Prepared for submission to Marine Ecology Progress Series. Guo L, Foy RJ, Wynne KM.
Measuring mesoscale horizontal distribution characteristics and energy density of pelagic forage
fishes in coastal waters of the Kodiak Archipelago, Alaska.

85
INTRODUCTION
Attributes of mesoscale (0.1’s – 10’s km) forage fish aggregations are key aspects in
defining the quality of prey fields for apex predators (Suryan et al. 2002, Bogetveit et al. 2008). It
is at these scales that many interactions between pelagic prey and predators take place (Schneider
1989, Winter et al. 2009). Aggregation attributes, such as pithiness and energy density, affect
predator feeding behavior and efficiency (Schneider & Piatt 1986, Womble et al. 2005, Womble
& Sigler 2006). Therefore, information on mesoscale forage fish aggregations is valuable to
understand both short-term and long-term fluctuations in apex predator populations.
Patchiness is an important feature of pelagic forage fish distributions due to schooling
behaviors (Shaw 1961, Springer & Speckman 1997). Highly dense schools of forage fishes often
develop during pre-spawning and spawning periods (Marston et al. 2002, Davoren et al. 2006), or
over regions of relatively high zooplankton prey availability (Winter & Swartzman 2006,
Hollowed et al. 2007). These aggregations form ideal prey fields and typically attract large
numbers of piscivorous predators (Piatt 1990, Sigler et al. 2004, Bogetveit et al. 2008). Hence
measuring the patchiness of forage fish distributions is essential to reveal the heterogeneity of
prey fields available to apex predators.
The major parameters for describing the quality of prey fields include density (number per
unit), biomass (mass per unit), and energy density (energy per unit) (Willson & Womble 2006,
Winter et al. 2009). While density and biomass are relatively easy to estimate with standard
survey data, energy density values are more widely applicable because they incorporate
differences in weight and energy content among species (Ney 1993, Ball et al. 2007). However,
energetic measurements are logistically difficult and therefore more expensive to carry out, which
explains why prey availability is most often described using biomass instead of energy, despite
the relatively large variability of energy content among and within species (Anthony et al. 2000,
Vollenweider et al. 2006, Spitz et al. 2010).

86
In this study, we measured distribution parameters and energy density of mesoscale
aggregations of forage fishes to describe pelagic prey fields for apex predators in coastal waters
of the Kodiak Archipelago, Alaska. We hypothesized that 1) patchiness of local forage fishes is
species specific and these patchy distributions form seasonal “hotspots” of prey fields for upper
trophic level predators, and that 2) biomass of forage fish assemblages is an inadequate proxy for
the amount of energy available to predators.
MATERIALS AND METHODS
Sampling
Vessel surveys were conducted to sample nearshore waters off the northern part of the
Kodiak Archipelago in May (05/21 – 06/04) and August (08/06 – 08/21), 2005. Fish Resource
Permits authorized by Alaska Department of Fish and Game were held for all sample collections
and are documented in Appendix A. We selected five regions, three on the northeastern side of
the Archipelago and two on the western side (Fig. 4.1). The five regions are hereafter referred to
as Tonki (Tonki Bay), Shelf (the shelf area northeast of Tonki and Perenosa Bay), Perenosa
(Perenosa Bay), Uganik North (the northern part of Uganik Bay), and Uganik South (the southern
part of Uganik Bay). The division of Uganik Bay into two regions was based on differences in
fish species composition (Loewen 2007) and the degree of transect coverage. Unlike in Tonki,
Shelf, and Perenosa, where the degrees of transect coverage within regions were similar
(Fig. 4.2A), the degree of transect coverage in Uganik Bay was much lower in the northern part
than in the southern part as the bay narrows southward (Fig. 4.2B). These differences required the
two regions in Uganik Bay to be processed separately in the subsequent geostatistical analysis
(Rivoirard et al. 2008). The boundary of each region (Fig. 4.1) was based on the extent of
transects (Fig. 4.2). Because transects in embayments rarely covered waters shallower than 20 m,
the 20-m depth isobath (based on bathymetric data from Alaska Department of Natural Resources)
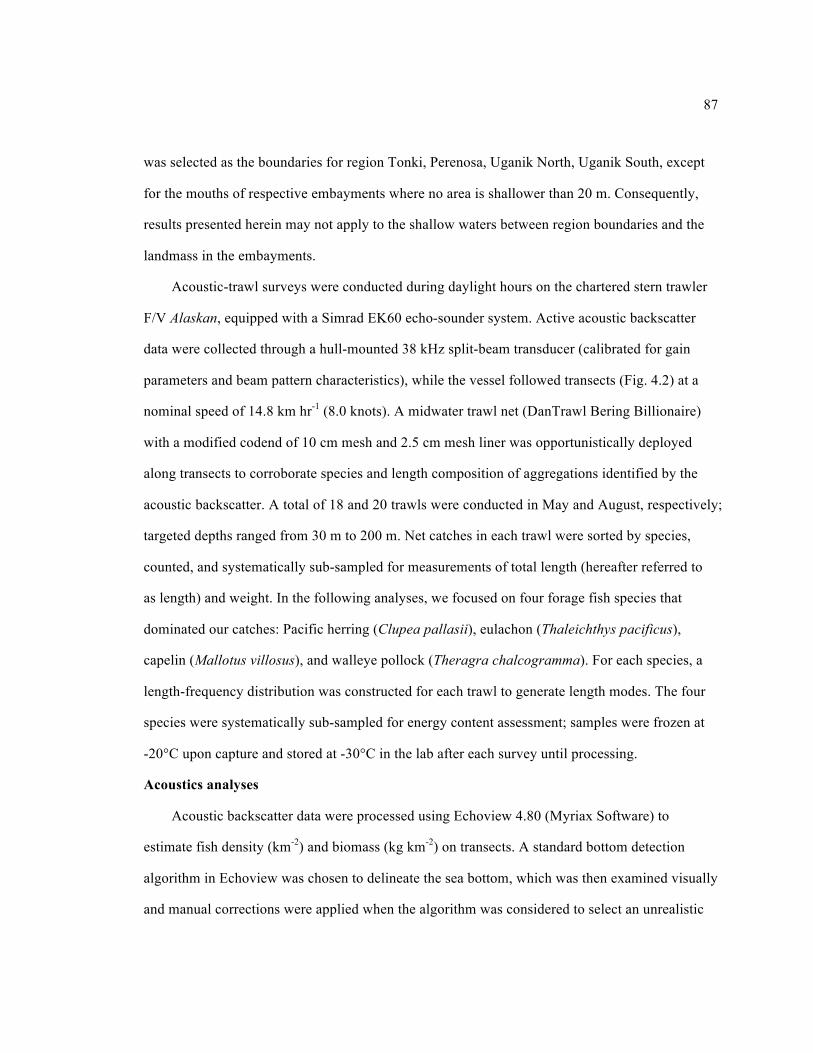
87
was selected as the boundaries for region Tonki, Perenosa, Uganik North, Uganik South, except
for the mouths of respective embayments where no area is shallower than 20 m. Consequently,
results presented herein may not apply to the shallow waters between region boundaries and the
landmass in the embayments.
Acoustic-trawl surveys were conducted during daylight hours on the chartered stern trawler
F/V Alaskan, equipped with a Simrad EK60 echo-sounder system. Active acoustic backscatter
data were collected through a hull-mounted 38 kHz split-beam transducer (calibrated for gain
parameters and beam pattern characteristics), while the vessel followed transects (Fig. 4.2) at a
nominal speed of 14.8 km hr-1 (8.0 knots). A midwater trawl net (DanTrawl Bering Billionaire)
with a modified codend of 10 cm mesh and 2.5 cm mesh liner was opportunistically deployed
along transects to corroborate species and length composition of aggregations identified by the
acoustic backscatter. A total of 18 and 20 trawls were conducted in May and August, respectively;
targeted depths ranged from 30 m to 200 m. Net catches in each trawl were sorted by species,
counted, and systematically sub-sampled for measurements of total length (hereafter referred to
as length) and weight. In the following analyses, we focused on four forage fish species that
dominated our catches: Pacific herring (Clupea pallasii), eulachon (Thaleichthys pacificus),
capelin (Mallotus villosus), and walleye pollock (Theragra chalcogramma). For each species, a
length-frequency distribution was constructed for each trawl to generate length modes. The four
species were systematically sub-sampled for energy content assessment; samples were frozen at
-20°C upon capture and stored at -30°C in the lab after each survey until processing.
Acoustics analyses
Acoustic backscatter data were processed using Echoview 4.80 (Myriax Software) to
estimate fish density (km-2) and biomass (kg km-2) on transects. A standard bottom detection
algorithm in Echoview was chosen to delineate the sea bottom, which was then examined visually
and manual corrections were applied when the algorithm was considered to select an unrealistic
88
bottom. Fish target strength (TS) values were calculated from the standard regression equation
(Simmonds & MacLennan, 2005):
TS = 20 log L + b,
where L values (cm) were the modes of length-frequency distributions; b = -65.1, -84.5, -69.3,
and -67.2 for herring, eulachon, capelin, and pollock, respectively (Gauthier & Horne 2004).
Euphausiids and larval fishes, occasionally caught in net catches, were assigned -70 as their
collective TS. Volume backscattering strength was echo-integrated through Echoview algorithms
over horizontal bins of 185.2 m (0.1 nmi) between 8.5 m below sea surface (the transducer was at
~ 4 m below surface) and 0.5 m above corrected delineation of the sea bottom. The latitude and
longitude of the center point in each horizontal bin were used as the coordinate of that bin in the
subsequent geostatistical analysis. Based on net catch percentages and target strength values,
Echoview apportioned the integrated backscatter to each length mode for each of the four species.
Then the apportioned backscatter was converted to fish density and biomass, the latter
incorporating length-weight regressions established for each species and each month.
Biochemical analyses
Lipid content (%) and protein content (%) in whole-body wet mass were measured in order
to compute energy content. Lipids were extracted from homogenates with the modified Folch
method (Folch et al. 1957, Ways & Hanahan 1964) and afterwards lipid content was calculated
gravimetrically. To determine protein content, nitrogen content was quantified with a LecoTM -
FP2000 Analyzer, in which triplicates of ~ 0.5 g homogenate were conveyed through a
combusting chamber at 1000 °C and resulting nitrogen was measured before its content was
computed gravimetrically. Protein content (%) was calculated as the product of nitrogen content
(%) times 6.25 (Dowgiallo 1975). Because the amounts of carbohydrates are basically negligible
in fish (Brett 1995), energy content was computed by the following equation:
Energy content (kJ g-1) = (lipid content × 36.43 kJ g-1 + protein content × 20.10 kJ g-1) / 100,
89
where 36.43 and 20.10 are the respective energetic equivalents for lipids and proteins, adopted
from Brett (1995).
Statistical analyses
Ordinary kriging, a geostatistical interpolation method, was used to reproduce the stochastic
processes of fish distribution across each survey region and to estimate off-transect density and
biomass from on-transect values. By comparing different kriging methods, Simard et al. (1993)
showed that ordinary kriging performed best for assessing pelagic fishes in coastal areas. To
simplify calculations, length modes within species that were clustered together were grouped into
length classes, referred to as Small, Medium, Large, and Very Large (Table 4.1). For each length
class, biomass values were kriged separately from density to account for heterogeneity of
length-mode composition among different locations within a given region. An anisotropic
spherical semivariogram model was constructed for each length class of each fish species in each
region from the respective experimental semivariogram. The lag size of all models was set at 190
m, which was aimed to be slightly larger than the distance between the centers of two
neighboring echo-integration bins of 185.2 m (Isaaks & Srivastava 1989). In ArcGIS 9.3 (ESRI
Inc.), models were parameterized with the goal of minimizing errors (in terms of
root-mean-squared error) between predicted and measured on-transect values based on
leave-one-out cross-validation. The parameterized models and ordinary point kriging in ArcGIS
9.3 were applied to predict off-transect values, which in combination with on-transect values
form prediction surfaces of density and biomass (species- and length class-specific) in each of the
five regions. The prediction surfaces by default are of rectangular shape, which unrealistically
span over surrounding landmass. To solve this problem, the prediction surfaces were extracted
using the predefined region boundaries (Fig. 4.1). The extracted prediction surfaces were then
gridded into area units of 185.2 m × 185.2 m (0.01 nmi2). Within each area unit, values of each
length class were averaged and the length-class means were summed for each species.
90
Horizontal distribution characteristics of the four fish species in each region were described
with the following parameters: 1) proportion of area units with positive fish density (> 0) as a
measurement of geographic occupation, 2) median of positive area-unit fish density, and 3) index
of aggregation (Bez 2000), which measures the degree of aggregation or patchiness:
Index of aggregation = ∑izi2 / [S × (∑izi)2] ,
where zi is density in area unit i and S is the total area of a given region. A larger value of the
index means that distribution is patchier or less even. Values of positive area-unit density were
subjected to Mann-Whitney U or Kruskal Wallis tests for inter-region comparison.
For each forage fish length class, lipid (protein) density (kg km-2) was calculated as the
product of biomass and lipid (protein) content (%), and energy density (kJ km-2) was computed as
the product of biomass and energy content (kJ g-1).
We evaluated whether biomass of a fish assemblage was a reasonable quantitative proxy for
its energy density, in other words, how well variations in biomass among area units or regions
quantitatively represented the variations in energy density. The evaluation was carried out at two
spatial scales: within regions and among regions. Within regions, species-combined biomass and
energy density values in each area unit were standardized following the equation:
Standardized value = area-unit value / sum × 100%,
where sum is the summation of all area-unit values in the region. The differences between
standardized biomass (SB) and standardized energy density (SED) were then further standardized
into proportional differential (PD), calculated with the equation:
PD = abs (SB – SED) / SED × 100%,
where abs denotes absolute value. The frequency distribution of PD values measures how well
variations in biomass among area units quantitatively represented the variations in energy density;
if most PD values are close to zero, biomass is a good quantitative proxy on this scale. Among
regions, biomass and energy density were standardized in the same way as within a region, except
91
that values were the means of regions instead of area units and the summation across regions
were weighted by the area (km2) of regions.
RESULTS
In May, Pacific herring were not captured in Tonki, Shelf, and Perenosa, the three regions on
the northeastern side of the Archipelago; eulachon were not encountered in Tonki and Uganik
South; capelin and walleye pollock were found in all five regions. When encountered, the
proportions of area units with positive fish densities varied considerably among regions
(Table 4.2: n’/n). For example, capelin were found in 83.7% of area units in Perenosa but only in
23.3% in Shelf, and pollock occupied 91.8% of area units in Uganik North but only 34.7% in
Shelf. Aggregation densities, measured by positive area-unit fish density values, were
significantly different among regions for all species (p < 0.05, Table 4.2). The densest
aggregations of herring and pollock were found in Uganik South, while the densest aggregation
of eulachon and capelin were encountered in Uganik North and Tonki, respectively. Index of
aggregation was consistently higher in Tonki and Uganik South than other regions for herring,
capelin, and pollock (Table 4.2), indicating that distributions of these species were relatively
patchier in Tonki and Uganik South compared to other regions.
In August, herring were not captured in Tonki and Shelf; eulachon, capelin, and pollock
were encountered in all five regions. Compared to May (Table 4.2: n’/n), the proportions of area
units with positive fish densities generally increased (Table 4.3: n’/n). In particular, herring
occupied at least 85.3% of area units in the regions where encountered, and capelin were found in
at least 69.9% of area units in all regions. Aggregation densities in different regions were
significantly different from each other for all four species (p < 0.05, Table 4.3), except for
eulachon in Uganik North and Uganik South. Similar to May, index of aggregation values were
relatively high in Tonki and Uganik South compared to other regions (Table 4.3).
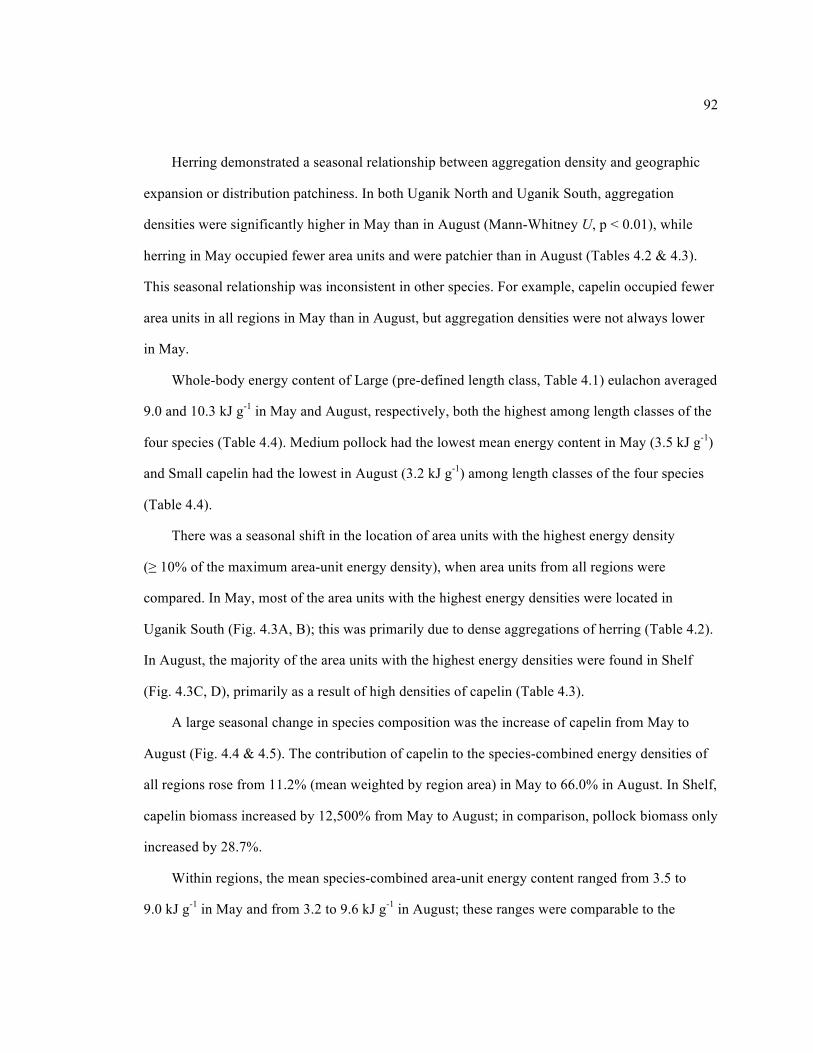
92
Herring demonstrated a seasonal relationship between aggregation density and geographic
expansion or distribution patchiness. In both Uganik North and Uganik South, aggregation
densities were significantly higher in May than in August (Mann-Whitney U, p < 0.01), while
herring in May occupied fewer area units and were patchier than in August (Tables 4.2 & 4.3).
This seasonal relationship was inconsistent in other species. For example, capelin occupied fewer
area units in all regions in May than in August, but aggregation densities were not always lower
in May.
Whole-body energy content of Large (pre-defined length class, Table 4.1) eulachon averaged
9.0 and 10.3 kJ g-1 in May and August, respectively, both the highest among length classes of the
four species (Table 4.4). Medium pollock had the lowest mean energy content in May (3.5 kJ g-1)
and Small capelin had the lowest in August (3.2 kJ g-1) among length classes of the four species
(Table 4.4).
There was a seasonal shift in the location of area units with the highest energy density
(≥ 10% of the maximum area-unit energy density), when area units from all regions were
compared. In May, most of the area units with the highest energy densities were located in
Uganik South (Fig. 4.3A, B); this was primarily due to dense aggregations of herring (Table 4.2).
In August, the majority of the area units with the highest energy densities were found in Shelf
(Fig. 4.3C, D), primarily as a result of high densities of capelin (Table 4.3).
A large seasonal change in species composition was the increase of capelin from May to
August (Fig. 4.4 & 4.5). The contribution of capelin to the species-combined energy densities of
all regions rose from 11.2% (mean weighted by region area) in May to 66.0% in August. In Shelf,
capelin biomass increased by 12,500% from May to August; in comparison, pollock biomass only
increased by 28.7%.
Within regions, the mean species-combined area-unit energy content ranged from 3.5 to
9.0 kJ g-1 in May and from 3.2 to 9.6 kJ g-1 in August; these ranges were comparable to the
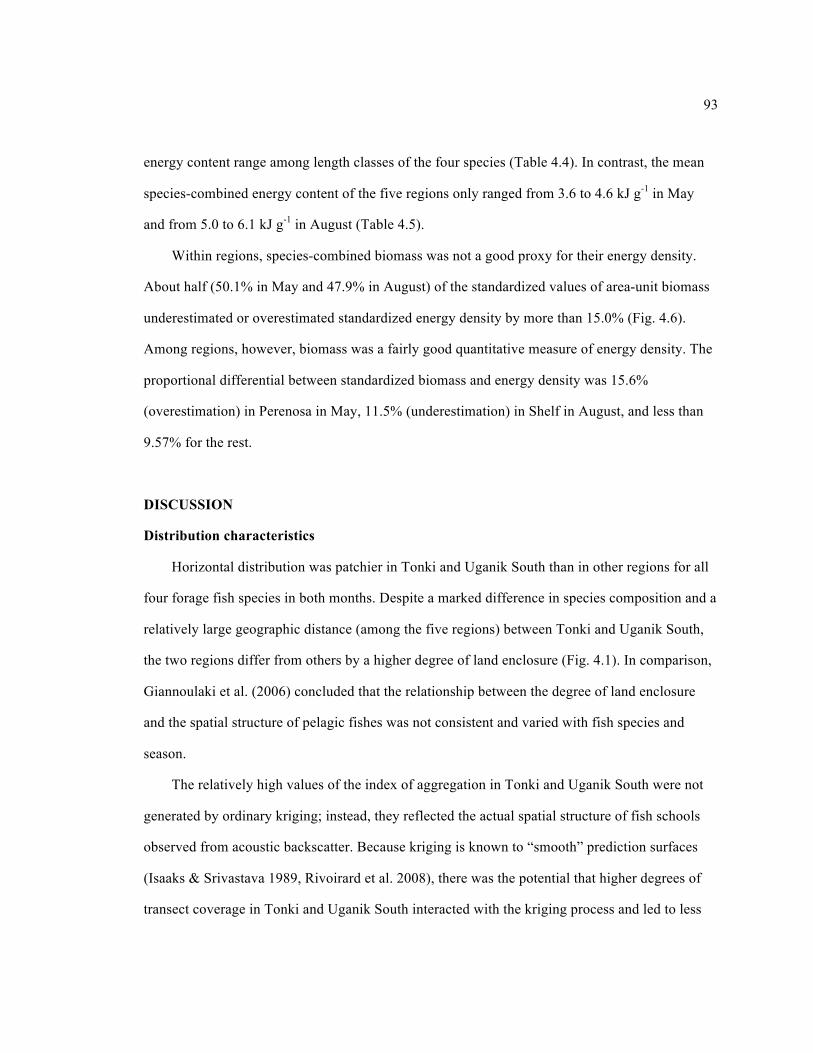
93
energy content range among length classes of the four species (Table 4.4). In contrast, the mean
species-combined energy content of the five regions only ranged from 3.6 to 4.6 kJ g-1 in May
and from 5.0 to 6.1 kJ g-1 in August (Table 4.5).
Within regions, species-combined biomass was not a good proxy for their energy density.
About half (50.1% in May and 47.9% in August) of the standardized values of area-unit biomass
underestimated or overestimated standardized energy density by more than 15.0% (Fig. 4.6).
Among regions, however, biomass was a fairly good quantitative measure of energy density. The
proportional differential between standardized biomass and energy density was 15.6%
(overestimation) in Perenosa in May, 11.5% (underestimation) in Shelf in August, and less than
9.57% for the rest.
DISCUSSION
Distribution characteristics
Horizontal distribution was patchier in Tonki and Uganik South than in other regions for all
four forage fish species in both months. Despite a marked difference in species composition and a
relatively large geographic distance (among the five regions) between Tonki and Uganik South,
the two regions differ from others by a higher degree of land enclosure (Fig. 4.1). In comparison,
Giannoulaki et al. (2006) concluded that the relationship between the degree of land enclosure
and the spatial structure of pelagic fishes was not consistent and varied with fish species and
season.
The relatively high values of the index of aggregation in Tonki and Uganik South were not
generated by ordinary kriging; instead, they reflected the actual spatial structure of fish schools
observed from acoustic backscatter. Because kriging is known to “smooth” prediction surfaces
(Isaaks & Srivastava 1989, Rivoirard et al. 2008), there was the potential that higher degrees of
transect coverage in Tonki and Uganik South interacted with the kriging process and led to less

94
“smoothed” prediction surfaces than other regions. To test whether relatively high patchiness in
Tonki and Uganik South was created during kriging, we calculated the index of aggregation
based only on acoustic estimates from transect lines (Table 4.6), assuming that fish density in the
185.2-m horizontal bin of echo integration represented a square area of 185.2 m by 185.2 m.
Although the absolute values of the index were different from those after kriging due to
differences in total abundance and the potential smoothing effect of kriging, the relatively high
values in Tonki and Uganik South were similar to the post-kriging results.
The consistently high patchiness of fish distribution in local embayments requires special
consideration during survey planning. To retain reasonable precision for estimating fish density, a
relatively high degree of transect coverage should be applied in narrow embayments or arms of
embayments. In this study, we happened to have higher degrees of transect coverage in Tonki and
Uganik South, not because we expected that fish distribution would be more patchy in the two
regions, but because we adopted zig-zag transect lines to minimize vessel turning points and
maximize transecting time in semi-enclosed areas (Simmonds & MacLennan 2005). At least in
these embayments, zig-zag transecting has an additional advantage over other transect designs.
The higher degree of patchiness in more enclosed areas may be attributed to a collective
anti-predator strategy by the four species. There is little evidence suggesting that oceanographic
features in narrow areas of local embayments are more heterogeneous than those in relatively
open areas (Loewen 2007); hence, habitat preference does not seem to be the driving force. In
addition, the sampling periods did not coincide with the peak in spawning of the four species
(Dougherty et al. 2007, Brown 2002, Marston et al. 2002), thus the observed pattern cannot be
explained by site fidelity to spawning grounds. The patchy distribution in narrow embayments is
most likely due to the shared strategy by forage fishes to extend the time needed for predators to
search prey in relatively enclosed areas (Iwasa et al. 1981), considering the high variety and
abundance of potential local predators (Wynne 2005, Witteveen et al. 2007, Knoth & Foy 2008).
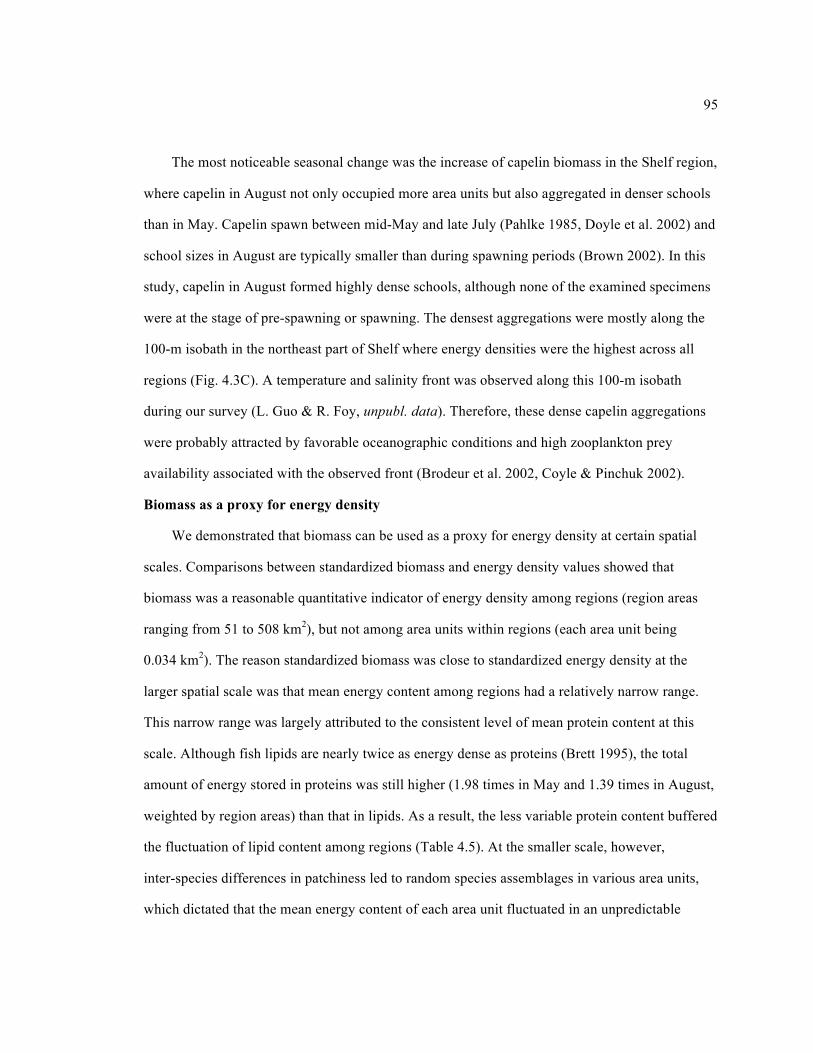
95
The most noticeable seasonal change was the increase of capelin biomass in the Shelf region,
where capelin in August not only occupied more area units but also aggregated in denser schools
than in May. Capelin spawn between mid-May and late July (Pahlke 1985, Doyle et al. 2002) and
school sizes in August are typically smaller than during spawning periods (Brown 2002). In this
study, capelin in August formed highly dense schools, although none of the examined specimens
were at the stage of pre-spawning or spawning. The densest aggregations were mostly along the
100-m isobath in the northeast part of Shelf where energy densities were the highest across all
regions (Fig. 4.3C). A temperature and salinity front was observed along this 100-m isobath
during our survey (L. Guo & R. Foy, unpubl. data). Therefore, these dense capelin aggregations
were probably attracted by favorable oceanographic conditions and high zooplankton prey
availability associated with the observed front (Brodeur et al. 2002, Coyle & Pinchuk 2002).
Biomass as a proxy for energy density
We demonstrated that biomass can be used as a proxy for energy density at certain spatial
scales. Comparisons between standardized biomass and energy density values showed that
biomass was a reasonable quantitative indicator of energy density among regions (region areas
ranging from 51 to 508 km2), but not among area units within regions (each area unit being
0.034 km2). The reason standardized biomass was close to standardized energy density at the
larger spatial scale was that mean energy content among regions had a relatively narrow range.
This narrow range was largely attributed to the consistent level of mean protein content at this
scale. Although fish lipids are nearly twice as energy dense as proteins (Brett 1995), the total
amount of energy stored in proteins was still higher (1.98 times in May and 1.39 times in August,
weighted by region areas) than that in lipids. As a result, the less variable protein content buffered
the fluctuation of lipid content among regions (Table 4.5). At the smaller scale, however,
inter-species differences in patchiness led to random species assemblages in various area units,
which dictated that the mean energy content of each area unit fluctuated in an unpredictable
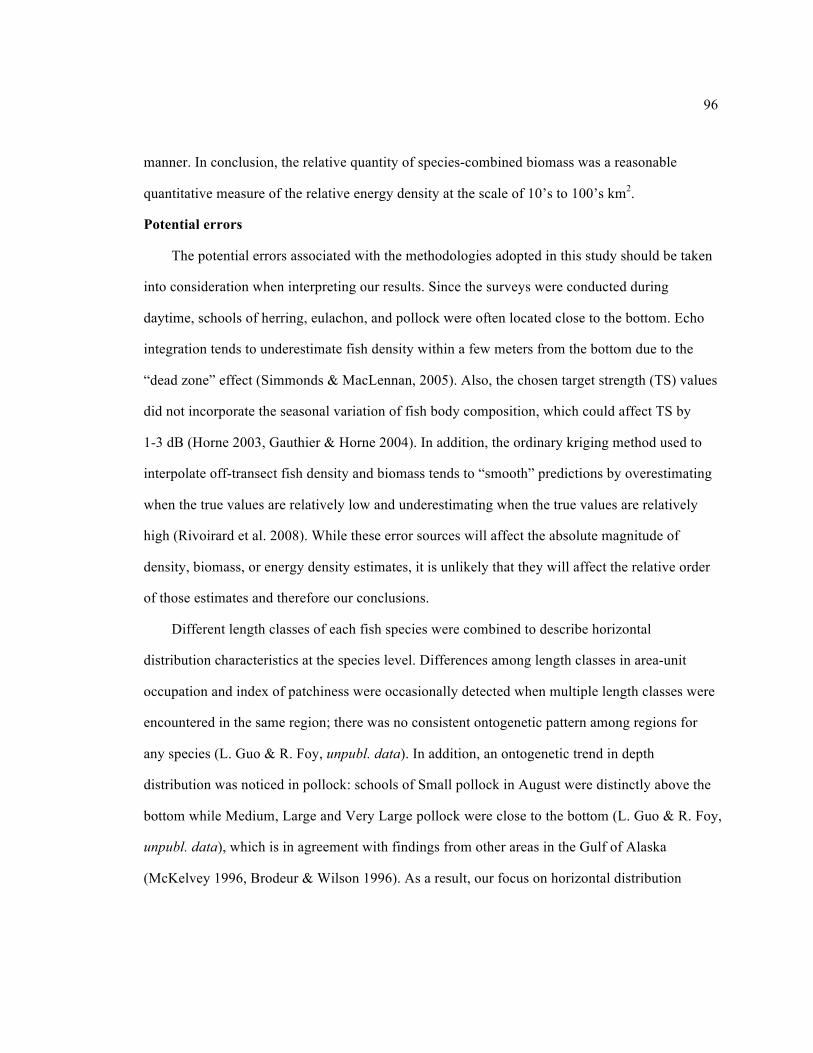
96
manner. In conclusion, the relative quantity of species-combined biomass was a reasonable
quantitative measure of the relative energy density at the scale of 10’s to 100’s km2.
Potential errors
The potential errors associated with the methodologies adopted in this study should be taken
into consideration when interpreting our results. Since the surveys were conducted during
daytime, schools of herring, eulachon, and pollock were often located close to the bottom. Echo
integration tends to underestimate fish density within a few meters from the bottom due to the
“dead zone” effect (Simmonds & MacLennan, 2005). Also, the chosen target strength (TS) values
did not incorporate the seasonal variation of fish body composition, which could affect TS by
1-3 dB (Horne 2003, Gauthier & Horne 2004). In addition, the ordinary kriging method used to
interpolate off-transect fish density and biomass tends to “smooth” predictions by overestimating
when the true values are relatively low and underestimating when the true values are relatively
high (Rivoirard et al. 2008). While these error sources will affect the absolute magnitude of
density, biomass, or energy density estimates, it is unlikely that they will affect the relative order
of those estimates and therefore our conclusions.
Different length classes of each fish species were combined to describe horizontal
distribution characteristics at the species level. Differences among length classes in area-unit
occupation and index of patchiness were occasionally detected when multiple length classes were
encountered in the same region; there was no consistent ontogenetic pattern among regions for
any species (L. Guo & R. Foy, unpubl. data). In addition, an ontogenetic trend in depth
distribution was noticed in pollock: schools of Small pollock in August were distinctly above the
bottom while Medium, Large and Very Large pollock were close to the bottom (L. Guo & R. Foy,
unpubl. data), which is in agreement with findings from other areas in the Gulf of Alaska
(McKelvey 1996, Brodeur & Wilson 1996). As a result, our focus on horizontal distribution
97
characteristics at the species level may have obscured the variations among length classes and
depths.
Implications for local apex predators
The dense aggregations of capelin in August offer an ideal feeding opportunity for predators,
which was supported by sightings of tens of thousands of piscivorous feeding seabirds in the
northeast part of Shelf during the survey. In addition, co-occurring eulachon and pollock in the
Shelf region happened to be of the lowest density among the five regions and were generally
found in deeper waters than capelin; herring were not encountered in Shelf in August. The
relative isolation from other species and dense aggregations over a large area make capelin
potentially the dominate prey for apex predators. We used data from McKenzie & Wynne (2008)
to compute the mean prey-specific numerical percentage (%) of capelin in Steller sea lion
(Eumetopias jubatus) scats collected from sites around the Kodiak Archipelago from1999 to 2005.
Prey-specific numerical percentage measures the numeral percentage in samples that contain a
specific prey taxa; samples that do not contain the given prey taxa are excluded in the
computation (Amundsen et al. 1996). The prey-specific numerical percentage of capelin was
91.9%, only slightly lower than Pacific sand lance (Ammodytes hexapterus) among important
prey (Table 4.7); in contrast, both percentage frequency of occurrence and mean numerical
percentage of capelin were much lower than those of sand lance (Table 4.7). The high
prey-specific value means that when encountered by sea lions, capelin are the preferred prey and
tend to be consumed exclusively during the time frame representative of scat results, typically
two to three days (Tollit et al. 1997, 2007). In comparison, herring, eulachon, and pollock were
typically ingested in mixed diets (Table 4.7). Therefore, the aggregative patterns of capelin may
be an important factor in their relative importance in Steller sea lion diets.
Capelin are also an important prey resource for humpback whales (Megaptera novaeangliae),
a local apex predator that prefer capelin over co-occurring pollock of similar sizes (Witteveen et

98
al. 2008). In 2005, the humpback population feeding on the east side of the Kodiak Archipelago
was estimated to be 192, based on the 2002 estimate of 157 (Witteveen et al. 2007) and a 6.8%
annual increase in the North Pacific over the last four decades (Calambokidis et al. 2008). The
population in 2005 required 5.29 × 10¹⁰ kJ of energy from prey during a five-month feeding
season (Witteveen et al. 2006), assuming total energy requirement is proportional to population
level. If 24.3% of the total required energy is met by feeding on capelin (based on a simplified
diet composition derived from stable isotopes of the same humpback population, B. Witteveen,
University of Alaska Fairbanks, pers. comm.), and 6.1 kJ g-1 is the energy content of capelin (the
species average in the Shelf region in August, weighted by biomass of length classes), the
humpback population in 2005 would consume 2.10 × 10⁶ kg of capelin over five months. This
estimate accounts for 13.0% of the total capelin biomass in the Shelf region and exceeds the total
capelin biomass of all other regions in August. Therefore, the removal by humpback whales may
cause significant localized reduction of capelin population, which would potentially limit the
availability of capelin to other sympatric predators.
Forage fish aggregation density and distribution patchiness may be important factors
influencing the utilization of haulout sites by Steller sea lions. Previous studies have suggested
that sea lion counts in haulouts are correlated to forage fish abundance and energy density in
surrounding waters (Womble & Sigler 2006, Winter et al. 2009). At Cape Ugat, a haulout
~ 15 km away from Uganik Bay, aerial counts of Steller sea lions decreased from May to August
in most of the observation years (Wynne 2005). Because herring were the most common prey in
Steller sea lion scats deposited from the same haulout (McKenzie & Wynne 2008), we expected
that energy density of herring would have been higher in May than in August. In contrast, we
found that the mean area-unit energy densities of herring in August were actually 14 and 1.3
times higher than in May for Uganik North and Uganik South, respectively; species-combined
energy densities were also noticeably higher in August than in May. However, herring in May

99
occupied fewer area units and aggregated in denser schools than in August for both Uganik North
and Uganik South. In addition, relatively low aerial counts of sea lion in August at Cape Ugat
were corresponded to seasonal peaks of sea lion counts at Chief Cove, ~ 20 km south of Cape
Ugat, where sea lions have been observed to prey on salmon at setnet sites (Wynne 2005).
Therefore, highly aggregated prey over a relatively small area may shorten the mean time
predators spend in capturing each prey (Orians & Pearson 1979), and may outweigh the benefit of
a higher total energy available over a broader area.
Summary
This study presents a comprehensive description of mesoscale distribution characteristics
and energy density of pelagic forage fishes in coastal waters of the Kodiak Archipelago.
Distribution was highly variable but consistently patchier in narrower embayments for all species.
Despite the marked difference in species composition, the mean energy content of forage fish
assemblages was similar among regions. Thus biomass of forage fish assemblages was found to
be an adequate proxy for energy density at the scales of 10’s to 100’s km2. Dense aggregations
were encountered after spawning periods and formed seasonal prey “hotspots” for piscivorous
predators. The spatial patterns of forage fish “hotspots” may have profound implications for
feeding behaviors of local apex predators, which could affect predator bioenergetics at the
population level.
LITERATURE CITED
Amundsen PA, Gabler HM, Staldvik FJ (1996) A new approach to graphical analysis of feeding
strategy from stomach contents data - modification of the Costello (1990) method. J Fish
Biol 48:607-614
Anthony JA, Roby DD, Turco KR (2000) Lipid content and energy density of forage fishes from
the northern Gulf of Alaska. J Exp Mar Biol Ecol 248:53-78

100
Ball JR, Esler D, Schmutz JA (2007) Proximate composition, energetic value, and relative
abundance of prey fish from the inshore eastern Bering Sea: implications for piscivorous
predators. Polar Biol 30:699-708
Bez N (2000) On the use of Lloyd's index of patchiness. Fish Oceanogr 9:372-376
Bogetveit FR, Slotte A, Johannessen A (2008) The ability of gadoids to take advantage of a
short-term high availability of forage fish: the example of spawning aggregations in
Barents Sea capelin. J Fish Biol 72:1427-1449
Brett JR (1995) Energetics. In: Groot C, Margolis L, Clarke WC (eds) Physiological ecology of
Pacific salmon. UBC Press, Vancouver, British Columbia, Canada, p 3-68
Brodeur RD, Wilson MT (1996) Mesoscale acoustic patterns of juvenile walleye pollock
(Theragra chalcogramma) in the western Gulf of Alaska. Can J Fish Aquat Sci
53:1951-1963
Brodeur RD, Wilson MT, Ciannelli L, Doyle M, Napp JM (2002) Interannual and regional
variability in distribution and ecology of juvenile pollock and their prey in frontal
structures of the Bering Sea. Deep Sea Res II 49:6051-6067
Brown ED (2002) Life history, distribution, and size structure of Pacific capelin in Prince
William Sound and the northern Gulf of Alaska. ICES J Mar Sci 59:983-996
Calambokidis J, Falcone EA, Quinn TJ, Burdin AM, Clapham PJ, Ford JKB, Gabriele CM,
LeDuc R, Mattila D, Rojas-Bracho L, Straley JM, Taylor BL, Urbán JR, Weller D,
Witteveen BH, Yamaguchi M, Bendlin A, Camacho D, Flynn K, Havron A, Huggins J,
Maloney N (2008) SPLASH: structure of populations, levels of abundance and status of
humpback whales in the North Pacific. Contract AB133F-03-RP-00078
Coyle KO, Pinchuk AI (2002) The abundance and distribution of euphausiids and zero-age
pollock on the inner shelf of the southeast Bering Sea near the Inner Front in 1997-1999.
Deep Sea Res II 49:6009-6030
101
Davoren GK, Anderson JT, Montevecchi WA (2006) Shoal behaviour and maturity relations of
spawning capelin (Mallotus villosus) off Newfoundland: demersal spawning and diel
vertical movement patterns. Can J Fish Aquat Sci 63:268-284
Dougherty AB, Bailey KM, Mier KL (2007) Interannual differences in growth and hatch date
distributions of age-0 year walleye pollock Theragra chalcogramma (Pallas) sampled from
the Shumagin Islands region of the Gulf of Alaska, 1985-2001. J Fish Biol 71:763-780
Dowgiallo A (1975) Chemical composition of an animal's body and of its food. In: Grodzinski W,
Klekowski RZ, Duncan A (eds) Methods for Ecological Bioenergetics (IBP Handbook No
24). Blackwell Scientific, Oxford, p 169-199
Doyle MJ, Busby MS, Duffy-Anderson JT, Picquelle SJ, Matarese AC (2002) Aspects of the
early life history of capelin (Mallotus villosus) in the northwest Gulf of Alaska: a historical
perspective based on larval collections October 1977 - March 1979. NOAA Tech Memo
NMFS-AFSC-132
Folch J, Lees M, Sloane-Stanley GH (1957) A simple method for the isolation and purification of
total lipids from animal tissues. J Biol Chem 226:497-509
Gauthier S, Horne JK (2004) Acoustic characteristics of forage fish species in the Gulf of Alaska
and Bering Sea based on Kirchhoff-approximation models. Can J Fish Aquat Sci
61:1839-1850
Giannoulaki M, Machias A, Koutsikopoulos C, Somarakis S (2006) The effect of coastal
topography on the spatial structure of anchovy and sardine. ICES J Mar Sci 63:650-662
Hollowed AB, Wilson CD, Stabeno PJ, Salo SA (2007) Effect of ocean conditions on the
cross-shelf distribution of walleye pollock (Theragra chalcogramma) and capelin
(Mallotus villosus). Fish Oceanogr 16:142-154
Horne JK (2003) The influence of ontogeny, physiology, and behaviour on the target strength of
walleye pollock (Theragra chalcogramma). ICES J Mar Sci 60:1063-1074

102
Isaaks EH, Srivastava RM (1989) Applied Geostatistics. Oxford University Press, New York
Iwasa Y, Higashi M, Yamamura N (1981) Prey distribution as a factor determining the choice of
optimal foraging strategy. Am Nat 117:710-723
Knoth BA, Foy RJ (2008) Temporal variability in the food habits of arrowtooth flounder
(Atheresthes stomias) in the western Gulf of Alaska. NOAA Tech Memo
NMFS-AFSC-194
Loewen ME (2007) Seasonal oceanographic influences on Pacific herring and walleye pollock
distribution and abundance in nearshore embayments of Kodiak Island, Alaska. MS thesis,
University of Alaska, Fairbanks, AK
Marston BH, Willson MF, Gende SM (2002) Predator aggregations during eulachon Thaleichthys
pacificus spawning runs. Mar Ecol Prog Ser 231:229-236
McKelvey DR (1996) Juvenile pollock distribution and abundance in Shelikof Strait–what can we
learn from acoustic survey results? In: Brodeur RD, Livingston PA, Loughlin TR,
Hollowed AB (eds) Ecology of juvenile walleye pollock. NOAA Tech Rep
NMFS-AFSC-126
McKenzie J, Wynne KM (2008) Spatial and temporal variation in the diet of Steller sea lions in
the Kodiak Archipelago, 1999 to 2005. Mar Ecol Prog Ser 360:265-283
Ney JJ (1993) Bioenergetics modeling today: Growing pains on the cutting edge. Trans Am Fish
Soc 122:736-748
Orians GJ, Pearson NE (1979) On the theory of central place foraging. In: Horn DJ, Mitchell, RD
(Eds.) Analysis of ecological systems. Ohio State University Press, Columbus, p155-177
Pahlke KA (1985) Preliminary studies of capelin (Mallotus villosus) in Alaskan waters. MS
Thesis, University of Alaska, Juneau, AK
Piatt JF (1990) The aggregative response of common murres and Atlantic puffins to schools of
capelin. S Avian Biol 14:36-51

103
Rivoirard J, Simmonds J, Foote KG, Fernandes P, Bez N (2008) Geostatistics for Estimating Fish
Abundance. Wiley-Blackwell, Chichester
Schneider DC (1989) Identifying the spatial scale of density-dependent interaction of predators
with schooling fish in the southern Labrador Current. J Fish Biol 35:109-115
Schneider DC, Piatt JF (1986) Scale-dependent correlation of seabirds with schooling fish in a
coastal ecosystem. Mar Ecol Prog Ser 32:237-246
Shaw E (1961) The development of schooling behaviour in fishes II. Physiol Zool 34:263-272
Sigler MF, Womble JN, Vollenweider JJ (2004) Availability to Steller sea lions (Eumetopias
jubatus) of a seasonal prey resource: a prespawning aggregation of eulachon (Thaleichthys
pacificus). Can J Fish Aquat Sci 61:1475-1484
Simard Y, Marcotte D, Bourgault G (1993) Exploration of geostatistical methods for mapping
and estimating acoustic biomass of pelagic fish in the Gulf of St. Lawrence: size of
echo-integration unit and auxiliary environmental variables. Aquat Living Resour
6:185-199
Simmonds J, MacLennan D (2005) Fisheries Acoustics. Blackwell Science, Oxford
Spitz J, Mourocq E, Schoen V, Ridoux V (2010) Proximate composition and energy content of
forage species from the Bay of Biscay: high- or low-quality food? ICES J Mar Sci
67:909-915
Springer AM, Speckman SG (1997) A forage fish is what? Summary of the symposium. In:
Mecklenburg W (ed) Forage fishes in marine ecosystems. Proc 14th Lowell Wakefield
Fish Symp. University of Alaska Sea Grant College Program, Fairbanks, AK
Suryan RM, Irons DB, Kaufman M, Benson J, Jodice PGR, Roby DD, Brown ED (2002)
Short-term fluctuations in forage fish availability and the effect on prey selection and
brood-rearing in the black-legged kittiwake Rissa tridactyla. Mar Ecol Prog Ser
236:273-287
104
Tollit DJ, Steward MJ, Thompson PM, Pierce GJ, Santos MB, Hughes S (1997) Species and size
differences in the digestion of otoliths and beaks: Implications for estimates of pinniped
diet composition. Can J Fish Aquat Sci 54:105-119
Tollit DJ, Heaslip SG, Barrick RL, Trites AW (2007) Impact of diet-index selection and the
digestion of prey hard remains on determining the diet of the Steller sea lion (Eumetopias
jubatus). Can J Zool 85:1-15
Vollenweider J, Womble J, Heintz R (2006) Estimation of seasonal energy content of Steller sea
lion (Eumetopias jubatus) diet. In: Trites AW, Atkinson SK, DeMaster DP, Fritz LW,
Gelatt TS, Rea LD, Wynne KM (eds) Sea lions of the world. Proc 22nd Lowell Wakefield
Fish Symp. University of Alaska Sea Grant College Program, Fairbanks, AK
Ways P, Hanahan DJ (1964) Characterization and quantification of red cell lipids in normal man.
J Lipid Res 5:318-328
Willson MF, Womble JN (2006) Vertebrate exploitation of pulsed marine prey: a review and the
example of spawning herring. Rev Fish Biol Fish 16:183-200
Winter AG, Swartzman GL (2006) Interannual changes in distribution of age-0 walleye pollock
near the Pribilof Islands, Alaska, with reference to the prediction of pollock year-class
strength. ICES J Mar Sci 63:1118-1135
Winter A, Foy RJ, Wynne K (2009) Seasonal differences in prey availability around a Steller sea
lion haulout and rookery in the Gulf of Alaska. Aquat Mamm 35:145-162
Witteveen BH, Foy RJ, Wynne KM (2006) The effect of predation (current and historical) by
humpback whales (Megaptera novaeangliae) on fish abundance near Kodiak Isand, Alaska.
Fish Bull 104:10-20
Witteveen BH, Wynne KM, Quinn TJI (2007) A feeding aggregation of humpback whales near
Kodiak Island, Alaska: current and historic abundance estimation. Alaska Fisheries
Research Bulletin 12:187-196
105
Witteveen BH, Foy RJ, Wynne KM, Tremblay Y (2008) Investigation of foraging habits and prey
selection by humpback whales (Megaptera novaeangliae) using acoustic tags and
concurrent fish surveys. Mar Mamm Sci 24:516-534
Womble JN, Sigler MF (2006) Seasonal availability of abundant, energy-rich prey influences the
abundance and diet of a marine predator, the Steller sea lion Eumetopias jubatus. Mar Ecol
Prog Ser 325:281-293
Womble JN, Willson MF, Sigler MF, Kelly BP, VanBlaricom GR (2005) Distribution of Steller
sea lions Eumetopias jubatus in relation to spring-spawning fish in SE Alaska. Mar Ecol
Prog Ser 294:271-282
Wynne KM (2005) Aerial monitoring of terrestrial habitat use by Steller sea lions in the Kodiak
Archipelago, 1999–2003. In: Wynne KM, Foy R, Buck L (eds) Gulf Apex Predator–Prey
study (GAP) final report (FY2001-2003). NOAA Grant NA16FX1270, University of
Alaska Fairbanks, AK
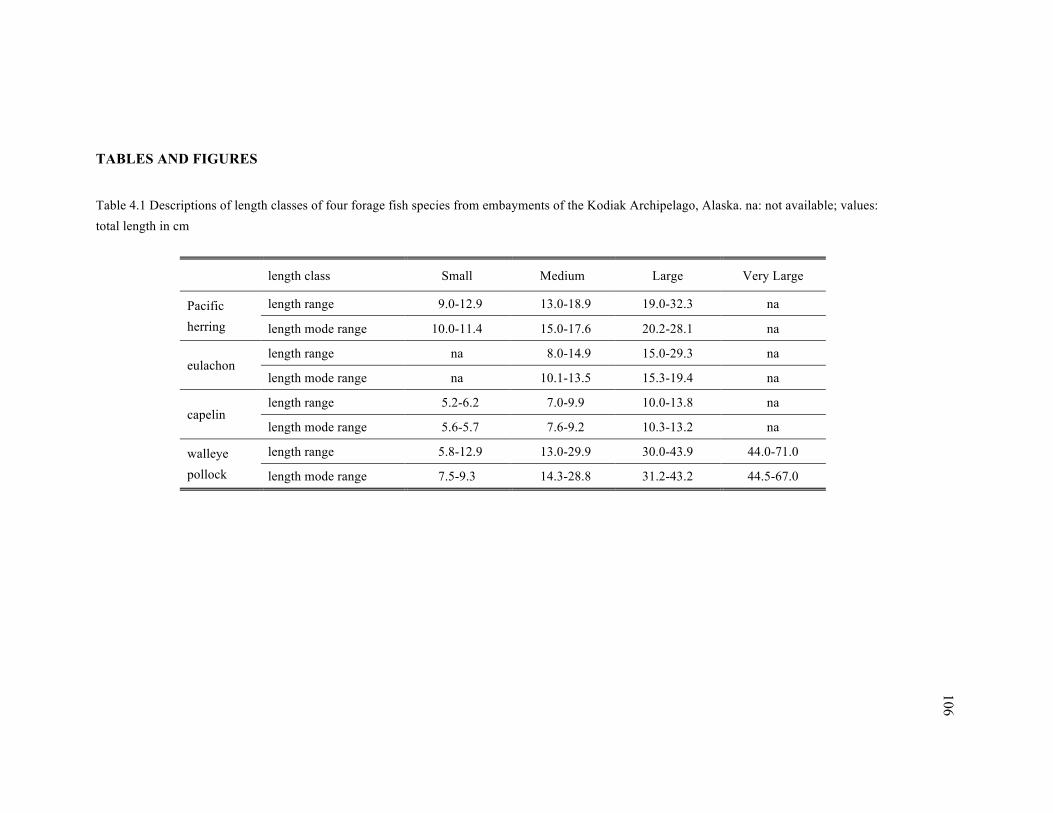
106
TABLES AND FIGURES
Table 4.1 Descriptions of length classes of four forage fish species from embayments of the Kodiak Archipelago, Alaska. na: not available; values: total length in cm
length class Small Medium Large Very Large
Pacific herring
length range 9.0-12.9 13.0-18.9 19.0-32.3 na
length mode range 10.0-11.4 15.0-17.6 20.2-28.1 na
eulachon length range na 8.0-14.9 15.0-29.3 na
length mode range na 10.1-13.5 15.3-19.4 na
capelin length range 5.2-6.2 7.0-9.9 10.0-13.8 na
length mode range 5.6-5.7 7.6-9.2 10.3-13.2 na
walleye pollock
length range 5.8-12.9 13.0-29.9 30.0-43.9 44.0-71.0
length mode range 7.5-9.3 14.3-28.8 31.2-43.2 44.5-67.0

107
Table 4.2 Horizontal distribution parameters of four forage fish species (post-kriging, length classes combined) in five regions around the Kodiak Archipelago, Alaska, in May 2005. n: total number of area units; n’: number of area units with positive fish density; median: median of positive area-unit fish density (number km-2); IA: index of aggregation; different superscript letters indicate significant inter-region differences within species (Mann-Whitney U or Kruskal Wallis, p < 0.05) and letter A indicate the highest values
Tonki Shelf Perenosa Uganik North Uganik South
n 1555 14825 2862 4523 1506
Pacific herring
n’ 0 0 0 1205 668
n’/n (%) 0 0 0 26.6 44.4
median (×103 km-2) na na na 1.60B 35.7A
IA (×10-5 km-2) na na na 0.91 13.8
eulachon
n’ 0 5032 1574 3939 0
n’/n (%) 0 33.9 55.0 87.1 0
median (×103 km-2) na 15.5B 0.15C 21.3A na
IA (×10-5 km-2) na 0.09 1.29 0.49 na
capelin
n’ 363 8117 2395 1208 464
n’/n (%) 23.3 54.8 83.7 26.7 30.8
median (×103 km-2) 58.7A 15.7C 1.73E 7.01D 54.5B
IA (×10-5 km-2) 42.0 0.27 0.81 6.04 11.3
walleye pollock
n’ 1020 5141 1806 4150 1282
n’/n (%) 65.6 34.7 63.1 91.8 85.1
median (×103 km-2) 1.43E 2.24D 3.07C 4.69B 6.98A
IA (×10-5 km-2) 3.89 0.09 1.15 0.70 3.78
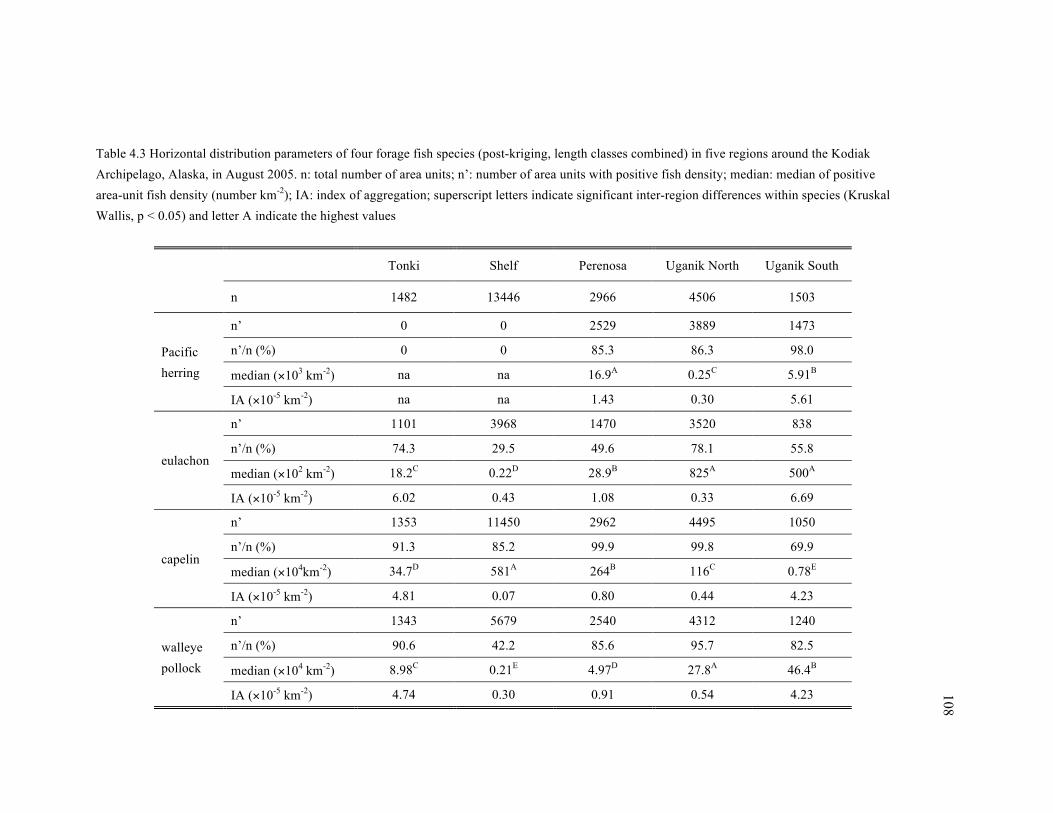
108
Table 4.3 Horizontal distribution parameters of four forage fish species (post-kriging, length classes combined) in five regions around the Kodiak Archipelago, Alaska, in August 2005. n: total number of area units; n’: number of area units with positive fish density; median: median of positive area-unit fish density (number km-2); IA: index of aggregation; superscript letters indicate significant inter-region differences within species (Kruskal Wallis, p < 0.05) and letter A indicate the highest values
Tonki Shelf Perenosa Uganik North Uganik South
n 1482 13446 2966 4506 1503
Pacific herring
n’ 0 0 2529 3889 1473
n’/n (%) 0 0 85.3 86.3 98.0
median (×103 km-2) na na 16.9A 0.25C 5.91B
IA (×10-5 km-2) na na 1.43 0.30 5.61
eulachon
n’ 1101 3968 1470 3520 838
n’/n (%) 74.3 29.5 49.6 78.1 55.8
median (×102 km-2) 18.2C 0.22D 28.9B 825A 500A
IA (×10-5 km-2) 6.02 0.43 1.08 0.33 6.69
capelin
n’ 1353 11450 2962 4495 1050
n’/n (%) 91.3 85.2 99.9 99.8 69.9
median (×104km-2) 34.7D 581A 264B 116C 0.78E
IA (×10-5 km-2) 4.81 0.07 0.80 0.44 4.23
walleye pollock
n’ 1343 5679 2540 4312 1240
n’/n (%) 90.6 42.2 85.6 95.7 82.5
median (×104 km-2) 8.98C 0.21E 4.97D 27.8A 46.4B
IA (×10-5 km-2) 4.74 0.30 0.91 0.54 4.23

109
Table 4.4 Lipid, protein, and energy content in whole-body wet mass of four forage fish species from embayments of the Kodiak Archipelago, Alaska, in May and August 2005. Numbers in parentheses: sample size for protein content analysis when different from that of lipid content analysis; na: not available; *: one or more samples consist of five or ten individual fish (as opposed to one); values of lipid and protein content: means ± SD (when SD was available); values of energy content: calculated from means of lipid and protein content
----------------------------May---------------------------- ---------------------------August---------------------------
length class sample size
lipid content
(%)
protein content
(%)
energy content (kJ g-1)
sample size
lipid content
(%)
protein content
(%)
energy content (kJ g-1)
Pacific herring
Small 25 (9) 5.2 ± 2.2 17.7 ± 0.5 5.5 0 na na na
Medium 0 na na na 32 6.7 ± 3.2 17.0 ± 1.2 5.8
Large 27 (11) 03.7 ± 1.8 15.3 ± 1.0 4.4 66 10.6 ± 6.7 17.0 ± 1.0 7.2
eulachon Medium 13 (3) 08.2 ± 4.7 12.8 ± 0.1 5.7 18 18.0 ± 2.5 13.2 ± 0.7 9.2
Large 37 (27) 17.4 ± 1.7 13.0 ± 0.3 9.0 11 21.0 ± 3.0 13.2 ± 0.4 10.3
capelin
Small 0 na na na 1* 1.1 14.0 3.2
Medium 5 (1*) 15.8 ± 1.5 15.0 8.8 44* (12*) 6.3 ± 2.0 17.0 ± 1.5 5.7
Large 40 (20) 07.0 ± 2.3 15.4 ± 0.4 5.6 32* (7) 10.9 ± 4.8 15.4 ± 0.9 7.1
walleye pollock
Small 0 na na na 70* (61*) 4.5 ± 1.5 17.1 ± 1.8 5.1
Medium 31 01.5 ± 0.4 14.8 ± 1.1 3.5 34 5.2 ± 1.7 16.4 ± 1.3 5.2
Large & Very Large
21 02.2 ± 1.0 14.1 ± 2.0 3.6 71 4.0 ± 2.0 15.4 ± 1.2 4.5

110
Table 4.5 Species-combined (Pacific herring, eulachon, capelin, and walleye pollock) areal mean biomass (kg km-2), lipid density (kg km-2), protein density (kg km-2), energy density (kJ km-2), lipid content (%), protein content (%), and energy content (kJ g-1) in five regions around the Kodiak Archipelago, Alaska, in May and August 2005.
Tonki Shelf Perenosa Uganik North Uganik South
May
region area (km2) 53.34 508.48 98.16 155.13 51.65
biomass 1.81×10³ 2.18×10³ 3.10×10³ 4.08×10³ 1.58×10⁴
lipid density 6.27×101 1.03×10² 6.82×101 1.86×10² 4.60×10²
protein density 2.59×10² 3.07×10² 4.36×10² 5.70×10² 2.31×10³
energy density 7.48×10⁶ 9.94×10⁶ 1.12×10⁷ 1.82×10⁷ 6.31×10⁷
lipid content 3.5 4.7 2.2 4.6 2.9
protein content 14.3 14.1 14.1 14.0 14.6
energy content 4.1 4.6 3.6 4.5 4.0
August
region area (km2) 50.83 461.18 101.73 154.55 51.55
biomass 1.16×10⁴ 3.69×10⁴ 2.14×10⁴ 2.76×10⁴ 2.21×10⁴
lipid density 6.07×10² 2.79×10³ 1.24×10³ 1.39×10³ 1.37×10³
protein density 1.80×10³ 6.06×10³ 3.49×10³ 4.43×10³ 3.51×10³
energy density 5.84×10⁷ 2.24×10⁸ 1.15×10⁸ 1.40×10⁸ 1.20×10⁸
lipid content 5.2 7.6 5.8 5.0 6.2
protein content 15.6 16.4 16.3 16.1 15.9
energy content 5.0 6.1 5.4 5.1 5.4
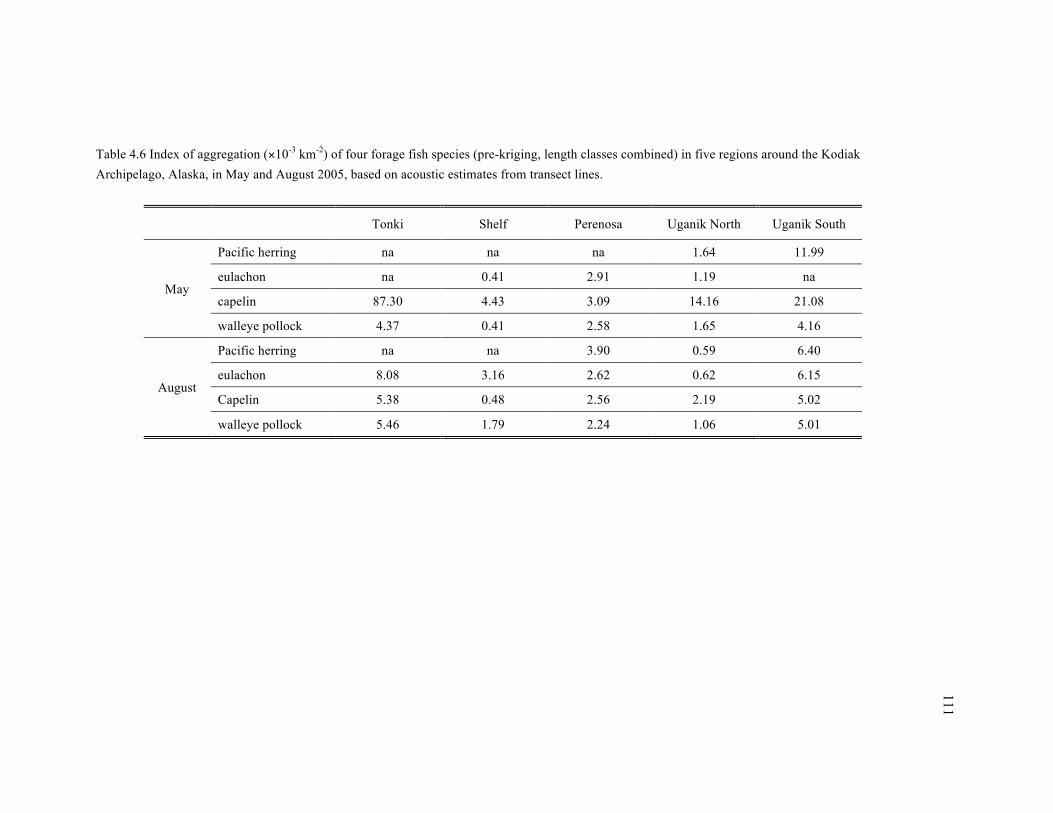
111
Table 4.6 Index of aggregation (×10-3 km-2) of four forage fish species (pre-kriging, length classes combined) in five regions around the Kodiak Archipelago, Alaska, in May and August 2005, based on acoustic estimates from transect lines.
Tonki Shelf Perenosa Uganik North Uganik South
May
Pacific herring na na na 1.64 11.99
eulachon na 0.41 2.91 1.19 na
capelin 87.30 4.43 3.09 14.16 21.08
walleye pollock 4.37 0.41 2.58 1.65 4.16
August
Pacific herring na na 3.90 0.59 6.40
eulachon 8.08 3.16 2.62 0.62 6.15
Capelin 5.38 0.48 2.56 2.19 5.02
walleye pollock 5.46 1.79 2.24 1.06 5.01
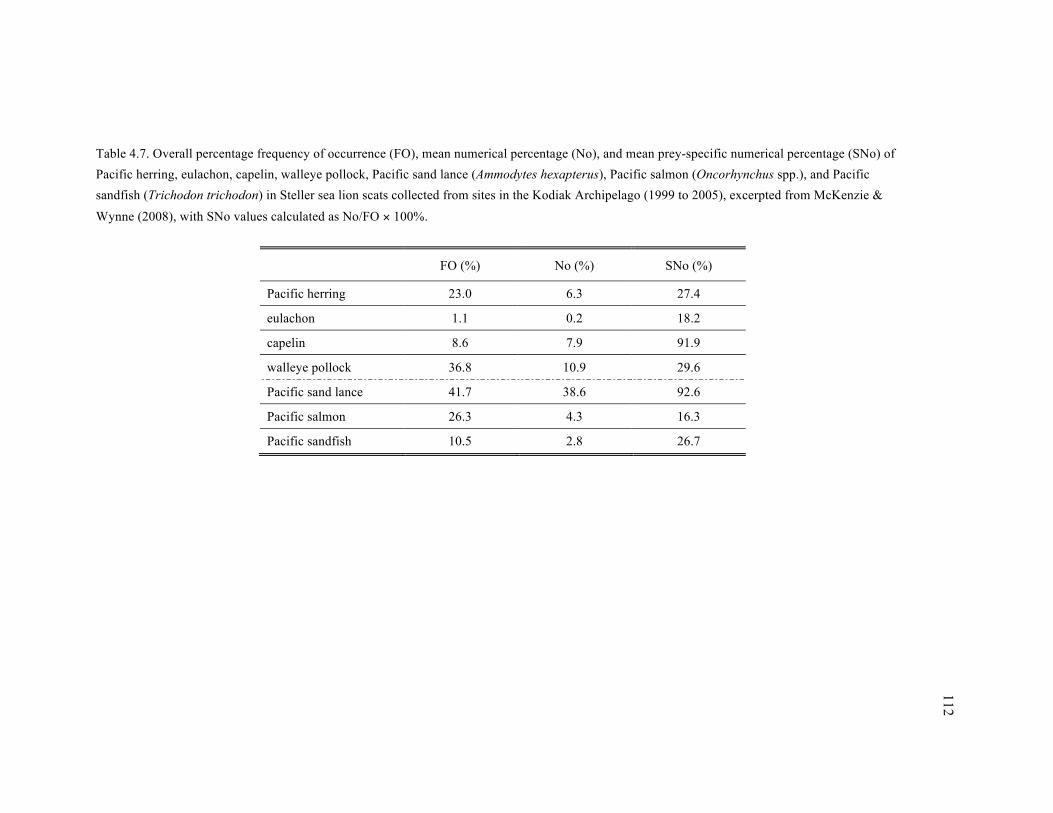
112
Table 4.7. Overall percentage frequency of occurrence (FO), mean numerical percentage (No), and mean prey-specific numerical percentage (SNo) of Pacific herring, eulachon, capelin, walleye pollock, Pacific sand lance (Ammodytes hexapterus), Pacific salmon (Oncorhynchus spp.), and Pacific sandfish (Trichodon trichodon) in Steller sea lion scats collected from sites in the Kodiak Archipelago (1999 to 2005), excerpted from McKenzie & Wynne (2008), with SNo values calculated as No/FO × 100%.
FO (%) No (%) SNo (%)
Pacific herring 23.0 6.3 27.4
eulachon 1.1 0.2 18.2
capelin 8.6 7.9 91.9
walleye pollock 36.8 10.9 29.6
Pacific sand lance 41.7 38.6 92.6
Pacific salmon 26.3 4.3 16.3
Pacific sandfish 10.5 2.8 26.7
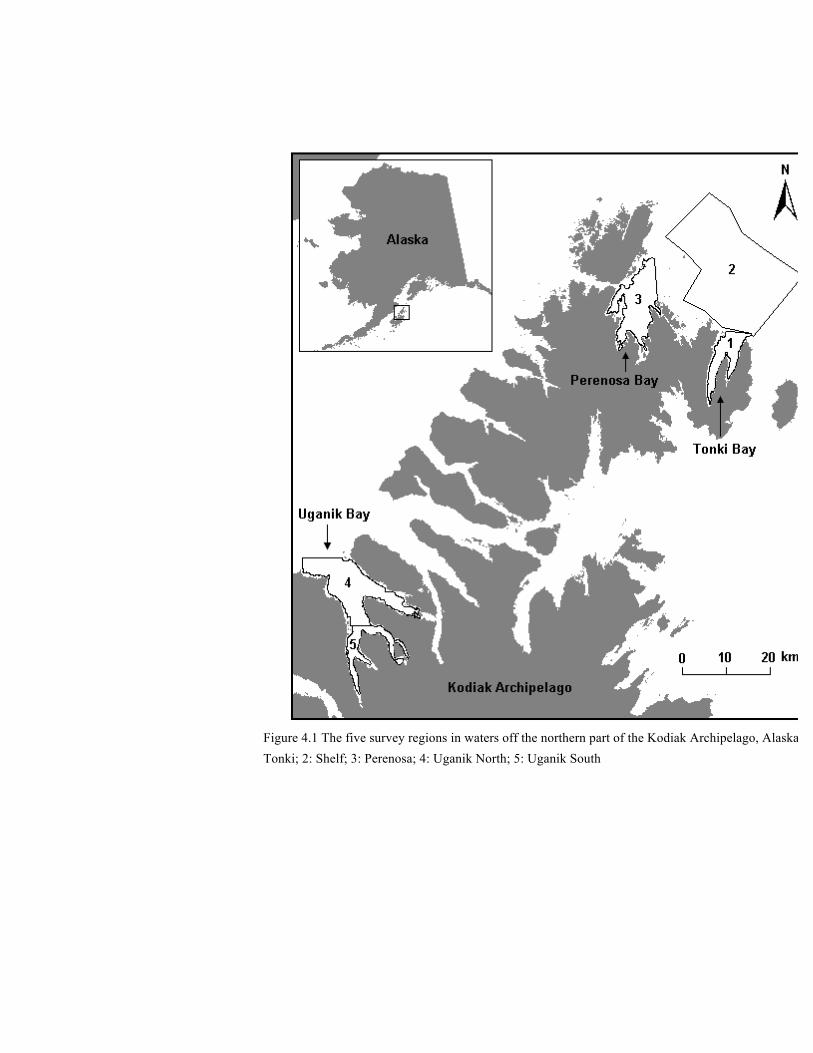
113
Figure 4.1 The five survey regions in waters off the northern part of the Kodiak Archipelago, Alaska. 1: Tonki; 2: Shelf; 3: Perenosa; 4: Uganik North; 5: Uganik South
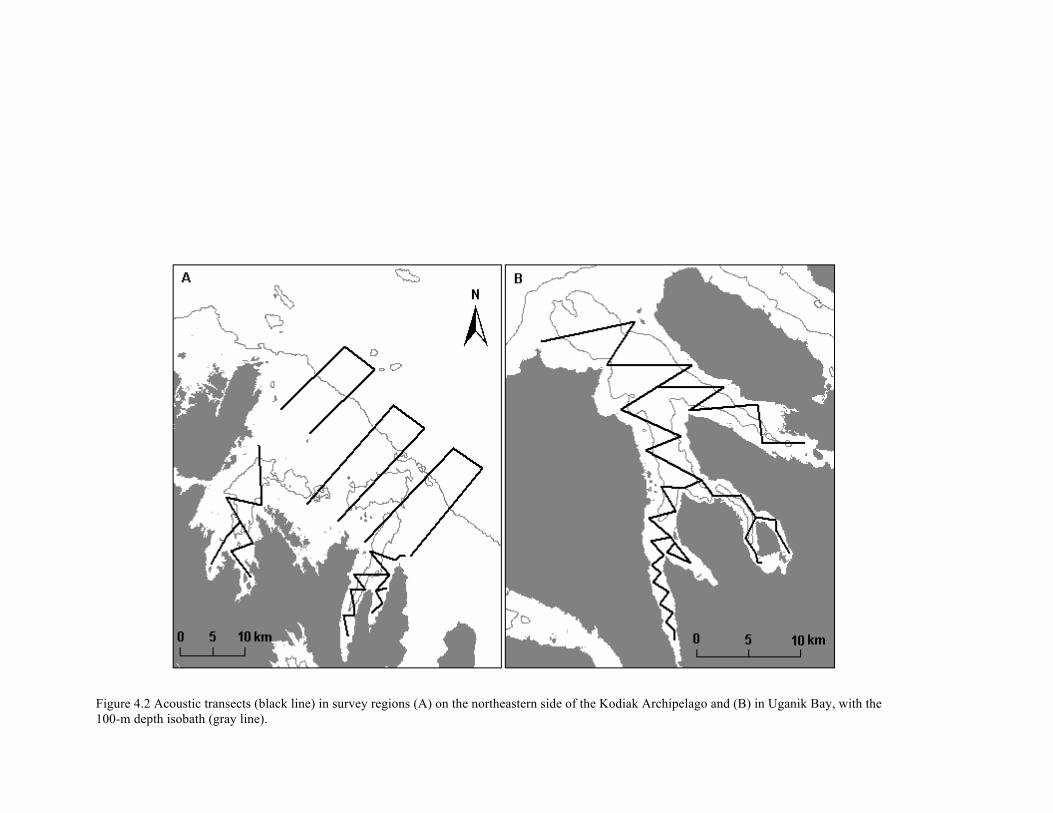
114
Figure 4.2 Acoustic transects (black line) in survey regions (A) on the northeastern side of the Kodiak Archipelago and (B) in Uganik Bay, with the 100-m depth isobath (gray line).
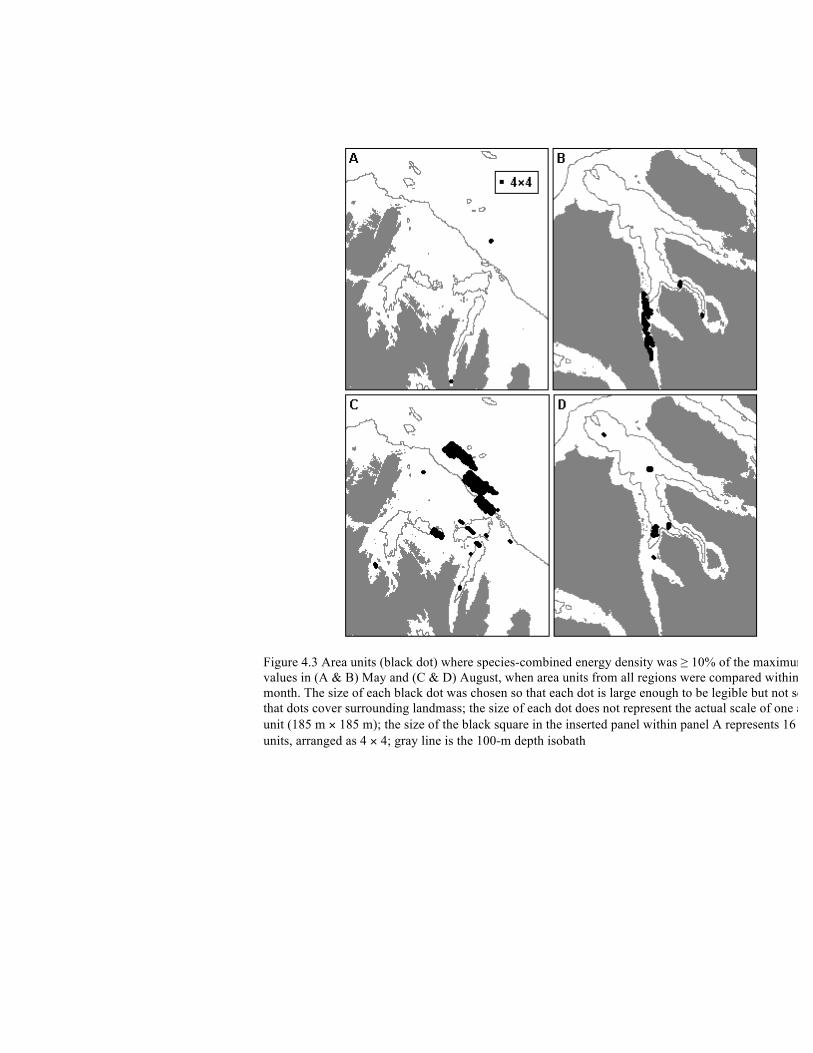
115
Figure 4.3 Area units (black dot) where species-combined energy density was ≥ 10% of the maximum values in (A & B) May and (C & D) August, when area units from all regions were compared within each month. The size of each black dot was chosen so that each dot is large enough to be legible but not so large that dots cover surrounding landmass; the size of each dot does not represent the actual scale of one area unit (185 m × 185 m); the size of the black square in the inserted panel within panel A represents 16 area units, arranged as 4 × 4; gray line is the 100-m depth isobath
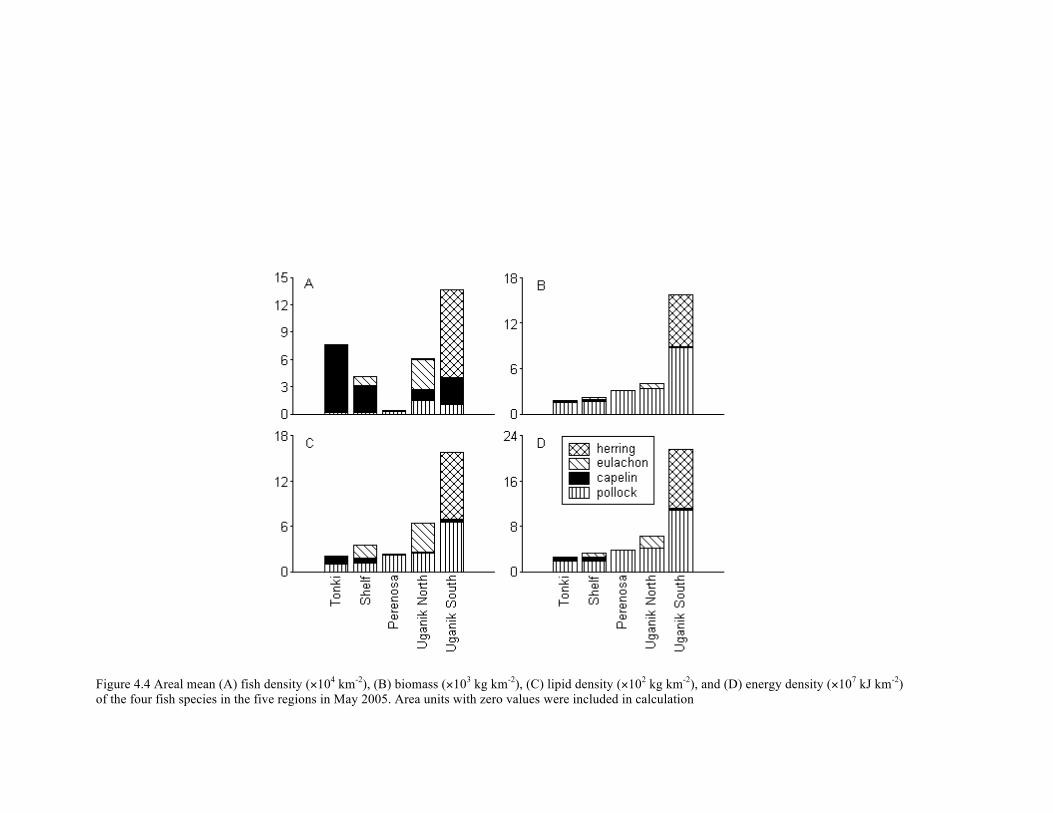
116
Figure 4.4 Areal mean (A) fish density (×104 km-2), (B) biomass (×103 kg km-2), (C) lipid density (×102 kg km-2), and (D) energy density (×107 kJ km-2) of the four fish species in the five regions in May 2005. Area units with zero values were included in calculation

117
Figure 4.5 Areal mean (A) fish density (×106 km-2), (B) biomass (×103 kg km-2), (C) lipid density (×103 kg km-2), and (D) energy density (×108 kJ km-2) of the four fish species in the five regions in August 2005. Area units with zero values were included in calculation
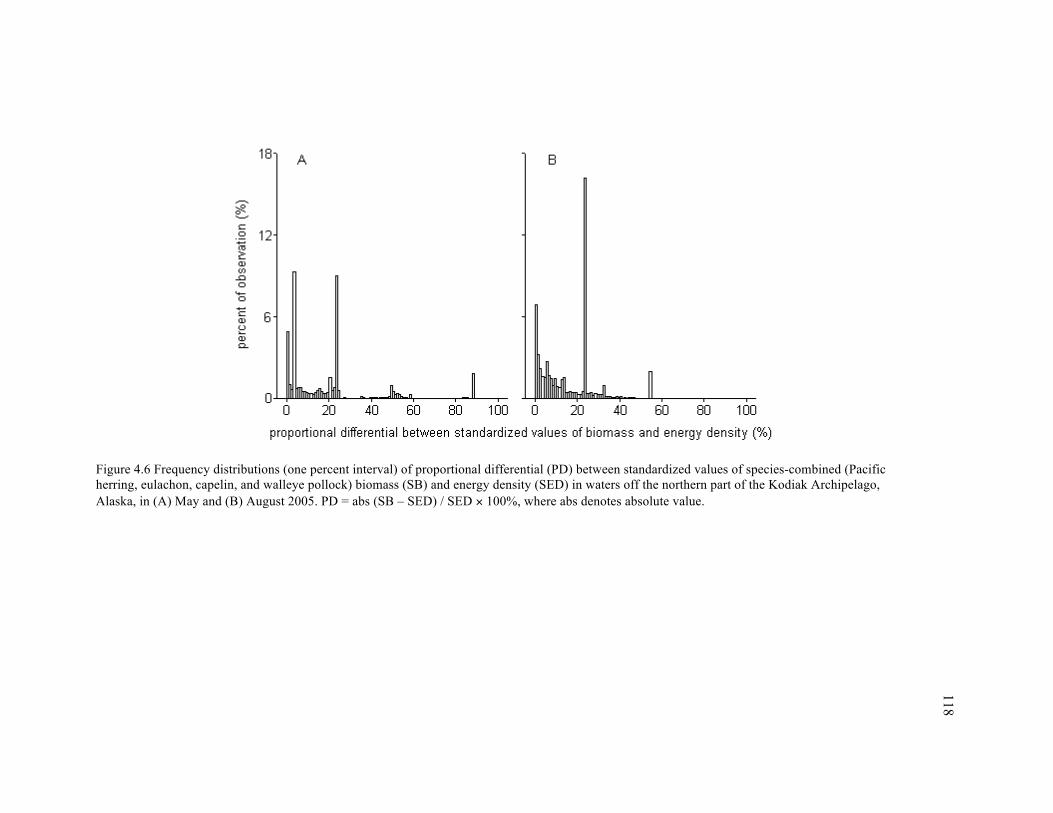
118
Figure 4.6 Frequency distributions (one percent interval) of proportional differential (PD) between standardized values of species-combined (Pacific herring, eulachon, capelin, and walleye pollock) biomass (SB) and energy density (SED) in waters off the northern part of the Kodiak Archipelago, Alaska, in (A) May and (B) August 2005. PD = abs (SB – SED) / SED × 100%, where abs denotes absolute value.
1
Chapter 5:
General Conclusion
This study examined multiple aspects of forage fish availability in the coastal waters of the
Kodiak Archipelago, Alaska, as a key step to refine our knowledge on local trophic interactions
and ecosystem functioning. I provided an improved estimation of diet composition,
systematically described intra-species variations in lipid content and fatty acid composition, and
measured mesoscale distribution characteristics and energy density of forage fish assemblages.
The objectives were achieved through a multidisciplinary approach, involving biochemical,
stomach content, acoustics, and geostatistical analyses. Major findings of this dissertation are
summarized as follows.
• Comparisons between copepod-originated fatty acids and stomach contents in four forage
fish species indicated the underestimation of dietary copepods by stomach content
analysis.
• Lipid content of forage fishes varied significantly by month and fish length; inter-month
variations did not strictly mirror the annual cycle of zooplankton production; ontogenetic
patterns were specific to fish species and varied by month.
• Fatty acid composition of forage fishes varied significantly by month, fish length, and
embayment; contents (weight percentages of total quantified fatty acids) of certain fatty
acids were significantly correlated with lipid content.
• Mesoscale horizontal distribution parameters, including area of occupation, aggregation
size, and index of aggregation, varied considerably among fish species and month.
• Patchiness of forage fish distribution was consistently higher in narrower embayments
than wider ones or open areas.
2
• Dense post-spawning aggregations formed energetic “hotspots” for piscivorous predators,
exemplified by herring schools on the west side of the Archipelago in May and capelin
schools on the northeast side in August.
• Biomass of forage fish assemblages was found to be a reasonable proxy for energy
content at the scales of 10’s to 100’s km2, but not at smaller scales.
Large variations in measured parameters were demonstrated among study regions.
Significant differences in forage fish fatty acid composition were found between embayments that
are only 10’s km apart, which indicates substantial localized differences in diet; abundance,
biomass, energy density, and index of patchiness were highly variable among study regions.
Spatial scales of sampling regimes influence our understanding of ecosystem functioning
(Vlietstra 2005, Fauchald 2009). The high spatial variability in physical and biological parameters
in waters around the Kodiak Archipelago presented in this and previous studies (Mueter &
Norcross 2000, Loewen 2007, McKenzie & Wynne 2008) emphasizes the importance of
mesoscale (0.1’s – 10’s km) assessment of forage fish availability.
My results demonstrated large intra-species variations in lipid content, fatty acid
composition, and energy content. These findings and similar conclusions from other regions (Ball
et al. 2007, Litz et al. 2010) affirm the need to incorporate intra-species variability in
trophodynamic studies. Currently, average values at a species level are most widely used. For
example, fatty acid models designed to delineate forage fish-predator relationships operate at the
species level and frequently combine samples from different locations or months, which leads to
model outputs that obscure spatial and temporal patterns (Iverson et al. 2004, Williams & Buck
2010). Furthermore, significant differences in lipid or energy content derived from inter-species
comparison are often used to divide forage fishes into high- and low-quality prey, which grossly
simplifies the natural variability and therefore is potentially misleading. For example, capelin
(Mallotus villosus) are commonly referred to as “lipid-rich” or high-energy species (Abookire &
Piatt 2005, Litzow et al. 2006); in this study, capelin of 5.2 – 6.2 cm total length in August had
3
the lowest lipid and energy content among all forage fish species studied, including walleye
pollock (Theragra chalcogramma) that are typically considered a “lipid-poor” or low-energy
species (Abookire & Piatt 2005, Litzow et al. 2006). For these reasons, intra-species variations in
forage fish biochemical parameters need to be carefully considered in order to obtain a more
realistic assessment of trophodynamics.
Spatial patterns of post-spawning forage fish aggregations may be a critical aspect of forage
fish availability. The relationship between pre-spawning or spawning aggregations of forage
fishes and their predators have been extensively studied (Sigler et al. 2004, Bogetveit et al. 2008);
the locations of these aggregations are typically consistent interannually due to fidelity to
spawning sites (Willson & Womble 2006, Womble & Sigler 2006). In contrast, the relationship
between post-spawning aggregations and predators are more difficult to examine, partly because
the locations of these aggregations are relatively unpredictable and more associated with
oceanographic conditions (Hollowed et al. 2007). The abrupt climatic changes in the North
Pacific Ocean over the last several decades (Mantua et al. 1997, Hare & Mantua 2000) may
dramatically alter the spatial patterns of post-spawning aggregations of forage fishes (Anderson &
Piatt 1999). The change in aggregation locations can have diverse effects on different types of
predators. For example, central-place foragers, such as seabirds and pinnipeds that return from
feeding forays to shore nests or haulouts, may switch to more dispersed prey when dense forage
fish aggregations move out of their foraging distance, which will increase foraging costs. In
comparison, predators that feed over relatively larger distances, such as cetaceans, may be able to
follow and exploit these aggregations at different locations. This behavioral difference may partly
explain the contrasting population trends between different types of apex predators, exemplified
by the western stock of Steller sea lions (Eumetopias jubatus) and humpback whales (Megaptera
novaeangliae): the former declined by 80% between the 1970s and 1990s (Trites & Larkin 1996,
Loughlin 1998), while the latter increased by 6.8% annually over the last four decades
(Calambokidis et al. 2008).
4
This dissertation provides the most comprehensive description of forage fish availability in
coastal waters of the Kodiak Archipelago, Alaska. As one part of the larger Gulf Apex
Predator-Prey Program, this project offers a key piece that will be integrated with results from
other trophic levels, especially apex predators, to better delineate local trophic interactions. The
final products will provide us with a more holistic view of the local ecosystems and with valuable
references for fisheries management in the North Pacific Ocean.
LITERATURE CITED
Abookire AA, Piatt JF (2005) Oceanographic conditions structure forage fishes into lipid-rich and
lipid-poor communities in lower Cook Inlet, Alaska, USA. Mar Ecol Prog Ser 287:229-240
Anderson PJ, Piatt JF (1999) Community reorganization in the Gulf of Alaska following ocean
climate regime shift. Mar Ecol Prog Ser 189:117-123
Ball JR, Esler D, Schmutz JA (2007) Proximate composition, energetic value, and relative
abundance of prey fish from the inshore eastern Bering Sea: implications for piscivorous
predators. Polar Biol 30:699-708
Bogetveit FR, Slotte A, Johannessen A (2008) The ability of gadoids to take advantage of a
short-term high availability of forage fish: the example of spawning aggregations in
Barents Sea capelin. J Fish Biol 72:1427-1449
Calambokidis J, Falcone EA, Quinn TJ, Burdin AM, Clapham PJ, Ford JKB, Gabriele CM,
LeDuc R, Mattila D, Rojas-Bracho L, Straley JM, Taylor BL, Urbán JR, Weller D,
Witteveen BH, Yamaguchi M, Bendlin A, Camacho D, Flynn K, Havron A, Huggins J,
Maloney N (2008) SPLASH: structure of populations, levels of abundance and status of
humpback whales in the North Pacific. Contract AB133F-03-RP-00078
Fauchald P (2009) Spatial interaction between seabirds and prey: review and synthesis. Mar Ecol
Prog Ser 391:139-151
5
Hare SR, Mantua NJ (2000) Empirical evidence for North Pacific regime shifts in 1977 and 1989.
Prog Oceanogr 47:103-145
Hollowed AB, Wilson CD, Stabeno PJ, Salo SA (2007) Effect of ocean conditions on the
cross-shelf distribution of walleye pollock (Theragra chalcogramma) and capelin
(Mallotus villosus). Fish Oceanogr 16:142-154
Iverson SJ, Field C, Bowen WD, Blanchard W (2004) Quantitative fatty acid signature analysis: a
new method of estimating predator diets. Ecol Monogr 74:211-235
Litz MNC, Brodeur RD, Emmett RL, Heppell SS, Rasmussen RS, O'Higgins L, Morris MS (2010)
Effects of variable oceanographic conditions on forage fish lipid content and fatty acid
composition in the northern California Current. Mar Ecol Prog Ser 405:71-85
Litzow MA, Bailey KM, Prahl FG, Heintz R (2006) Climate regime shifts and reorganization of
fish communities: the essential fatty acid limitation hypothesis. Mar Ecol Prog Ser
315:1-11
Loewen ME (2007) Seasonal oceanographic influences on Pacific herring and walleye pollock
distribution and abundance in nearshore embayments of Kodiak Island, Alaska. MS Thesis,
University of Alaska, Fairbanks, AK
Loughlin TR (1998) The Steller sea lion: a declining species. Biosph Conserv 1:91-98
Mantua NJ, Hare SR, Zhang Y, Wallace JM, Francis RC (1997) A Pacific interdecadal climate
oscillation with impacts on salmon production. B Am Meteorol Soc 78:1069-1079
McKenzie J, Wynne KM (2008) Spatial and temporal variation in the diet of Steller sea lions in
the Kodiak Archipelago, 1999 to 2005. Mar Ecol Prog Ser 360:265-283
Mueter FJ, Norcross BL (2000) Changes in species composition of the demersal fish community
in nearshore waters of Kodiak Island, Alaska. Can J Fish Aquat Sci 57:1169-1180
Sigler MF, Womble JN, Vollenweider JJ (2004) Availability to Steller sea lions (Eumetopias
jubatus) of a seasonal prey resource: a prespawning aggregation of eulachon (Thaleichthys
pacificus). Can J Fish Aquat Sci 61:1475-1484
6
Trites AW, Larkin PA (1996) Changes in the abundance of Steller sea lions (Eumetopias jubatus)
in Alaska from 1956 to 1992: how many were there? Aquat Mamm 22:153-166
Vlietstra LS (2005) Spatial associations between seabirds and prey: effects of large-scale prey
abundance on small-scale seabird distribution. Mar Ecol Prog Ser 291:275-287
Williams CT, Buck CL (2010) Using fatty acids as dietary tracers in seabird trophic ecology:
theory, application and limitations. J Ornithol 151:531-543
Willson MF, Womble JN (2006) Vertebrate exploitation of pulsed marine prey: a review and the
example of spawning herring. Rev Fish Biol Fish 16:183-200
Womble JN, Sigler MF (2006) Seasonal availability of abundant, energy-rich prey influences the
abundance and diet of a marine predator, the Steller sea lion Eumetopias jubatus. Mar Ecol
Prog Ser 325:281-293

7
Appendices

8
Appendix A Fishing Permits

9

10
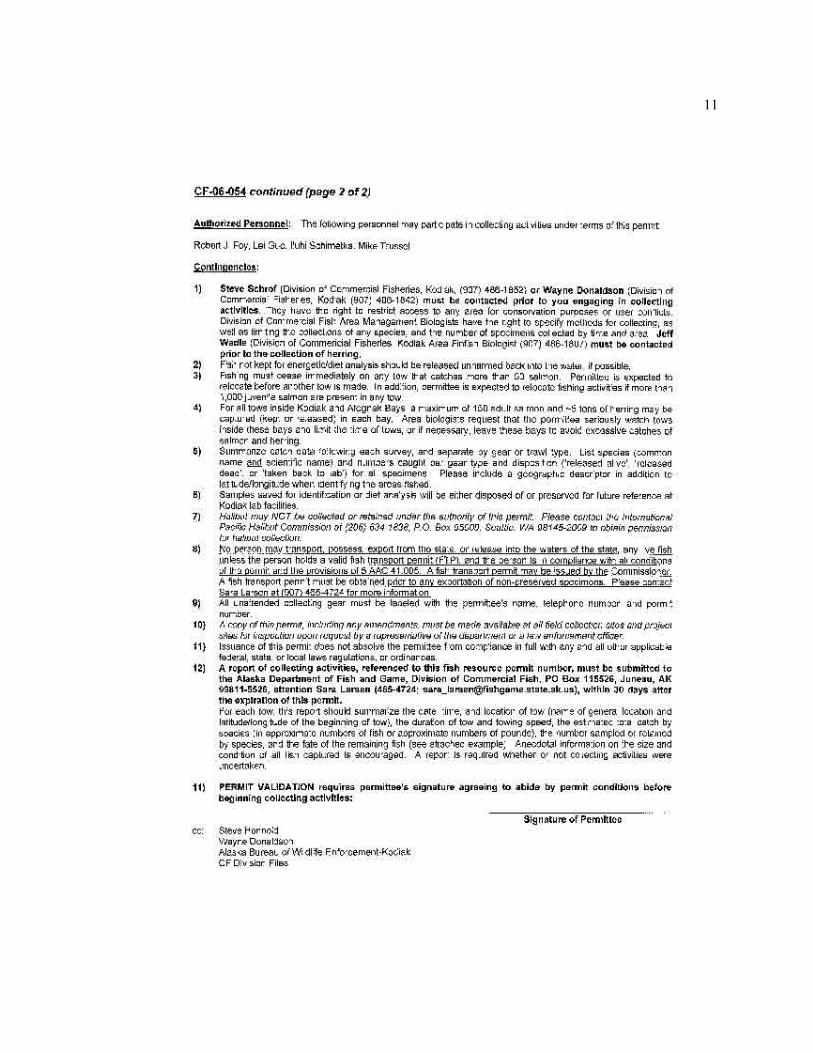
11

12

13
14
15
16
Appendix B IACUC Certificate
Institutional Care and Use Committee
PO Box 757560, 206 Eielson Building
University of Alaska Fairbanks
Fairbanks, Alaska 99775-7560
(907) 474-7800
IACUC Web Page: http://www.uaf.edu/iacuc
IACUC e-mail: [email protected]
May 11, 2004
Subject: Completion of IACUC Humane Animal Care and Use Training
Dear Lei Guo:
The record indicates that the following modules of the University of Alaska Fairbanks
Institutional Animal Care and Use Committee training program have been successfully
completed:
Module 1: Introduction to Animal Care Issues
Module 5: Field Biology
Part 1- Fish
Teresa Lyons
Research Committee Coordinator
Office of Research Integrity