Embed Size (px)
Citation preview
t TYCO LABORATORIES, I N C . . BEAR H I L L , W A L T H A M , M A S S A C H U S E T T S 02154 T E L E P H O N E 617 899-1650
GPO PRICE $ I CFSTI PRICE(S) $
Hard copy ( H C ) , a .
Microfiche (MF)
n e53 JUC es
. '
Tyco Laboratories, Inc. Bear Hill
Waltham, Massachusetts 02154
[-DEVELOPMENT OF CATHODIC ELECTROCATALYSTS FOR USE IN LOW TEMPERATURE Hz/O2 FUEL CELLS WITH A N
ALKALINE ELECTROLYTE -7
-IMuIyr
Contract No. NASW- 1233
Q-1 First Quarterly Report Covering Period July 1
Through September 30, 1965
for National Aeronautics and Space
Administration Headquarters, Washington, D. C.
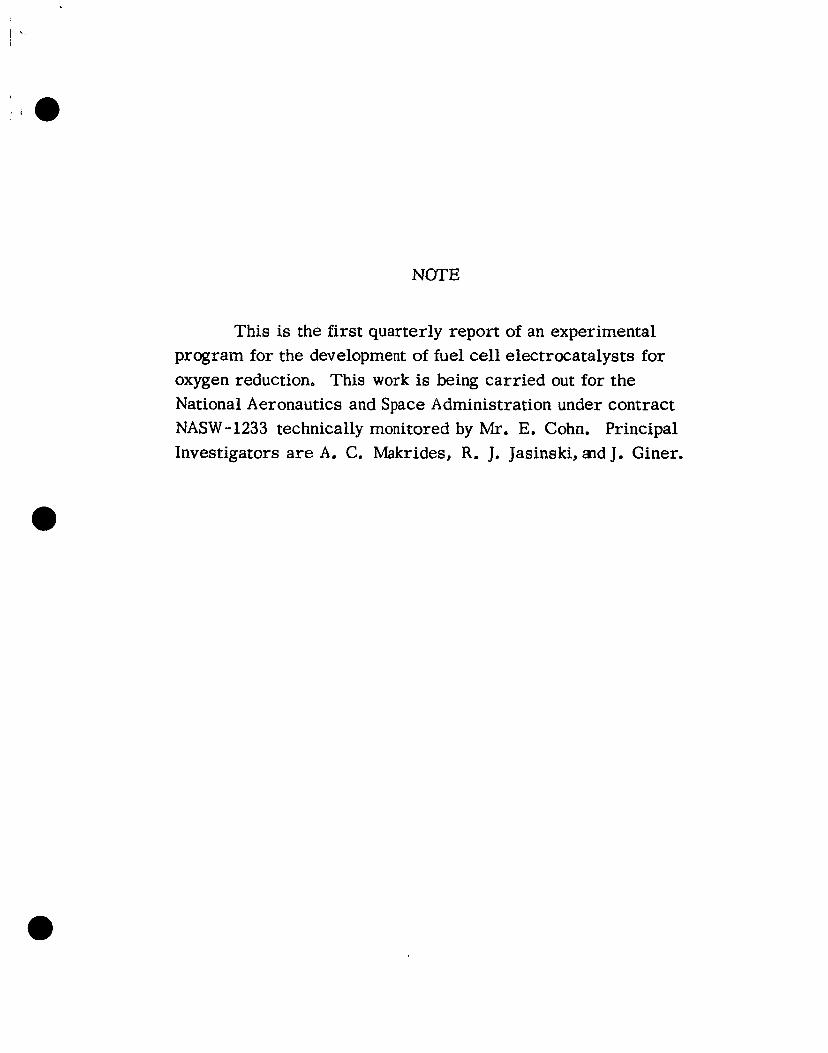
NOTE
This is the first quarterly repor t of an experimental program for the development of fuel cell electrocatalysts f o r oxygen reduction. This work is being ca r r i ed out fo r t h e National Aeronautics and Space Administration under contract NASW -1233 technically monitored by Mr. E. Cohn. Principal Investigators are A. C. Makrides, R, J. Jasinski, znd J. Ciner.

CONTENTS
I. INTRODUCTION
11. EXPERIMENTAL METHODS
111. RESULTS
APPENDIX A
APPENDIX B
Page No.
1
4
14
45
49
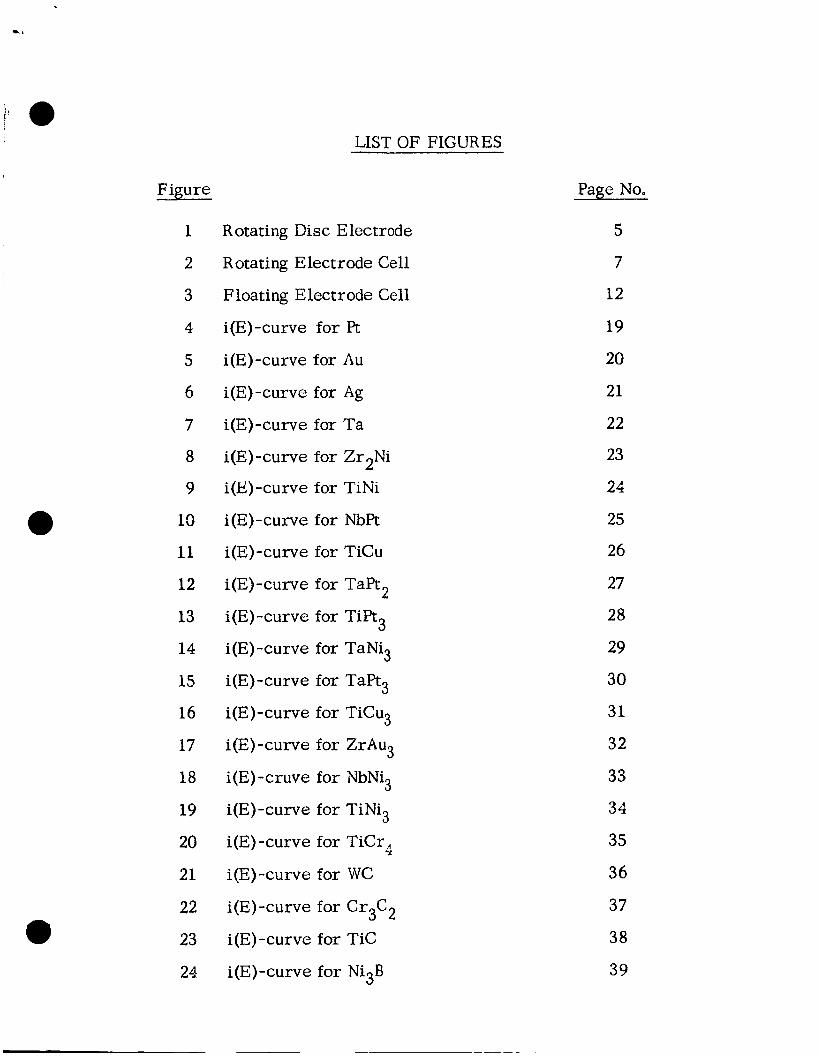
LIST OF FIGURES
Figure
~-
1
2
3
4
5
6
7
8
9
13
11
12
13
14
15
16
17
18
19
20
21
22
23
24
Rotating Disc Electrode
Rotating Electrode Cell
Floating Electrode Cell
i(E)-curve for Pt
i(E)-curve for Au
i(E)-curve for Ag
i(E)-curve for Ta
i(E)-curve for ZrZNi
i(E)-curve for TiNi
i(E)-curve for NbPt
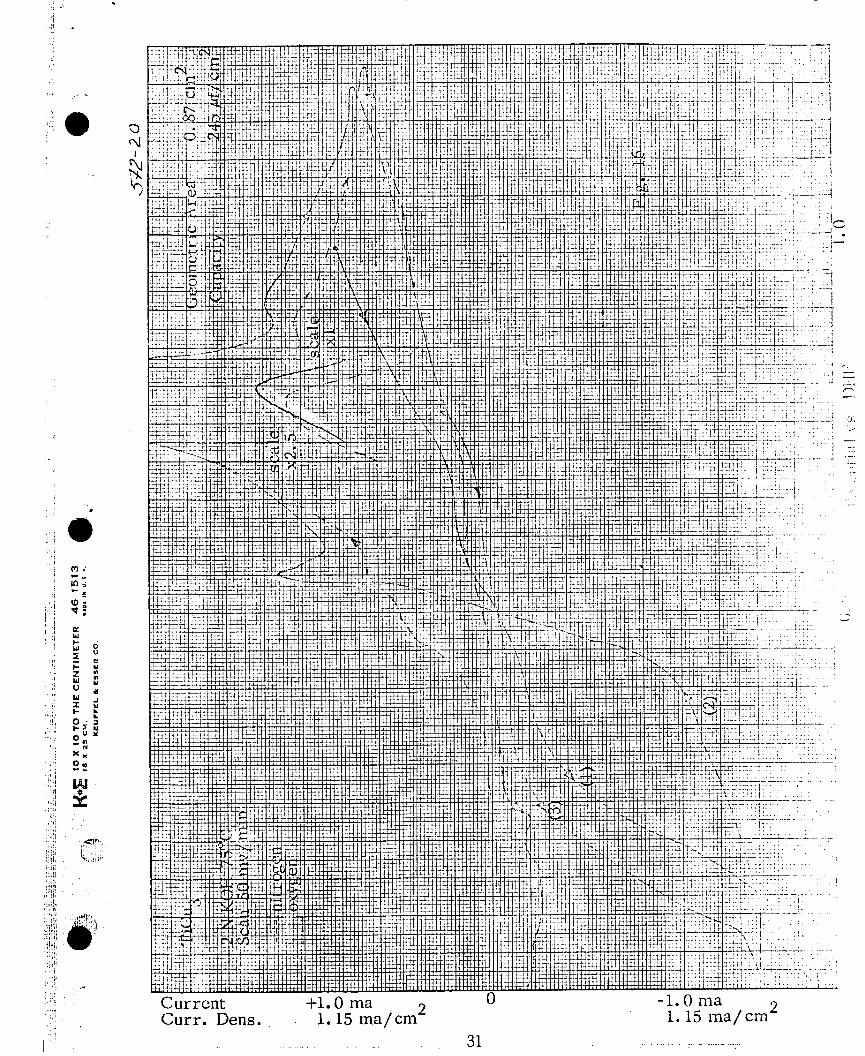
i(E)-curve for TiCu
i(E)-curve for TaPt2
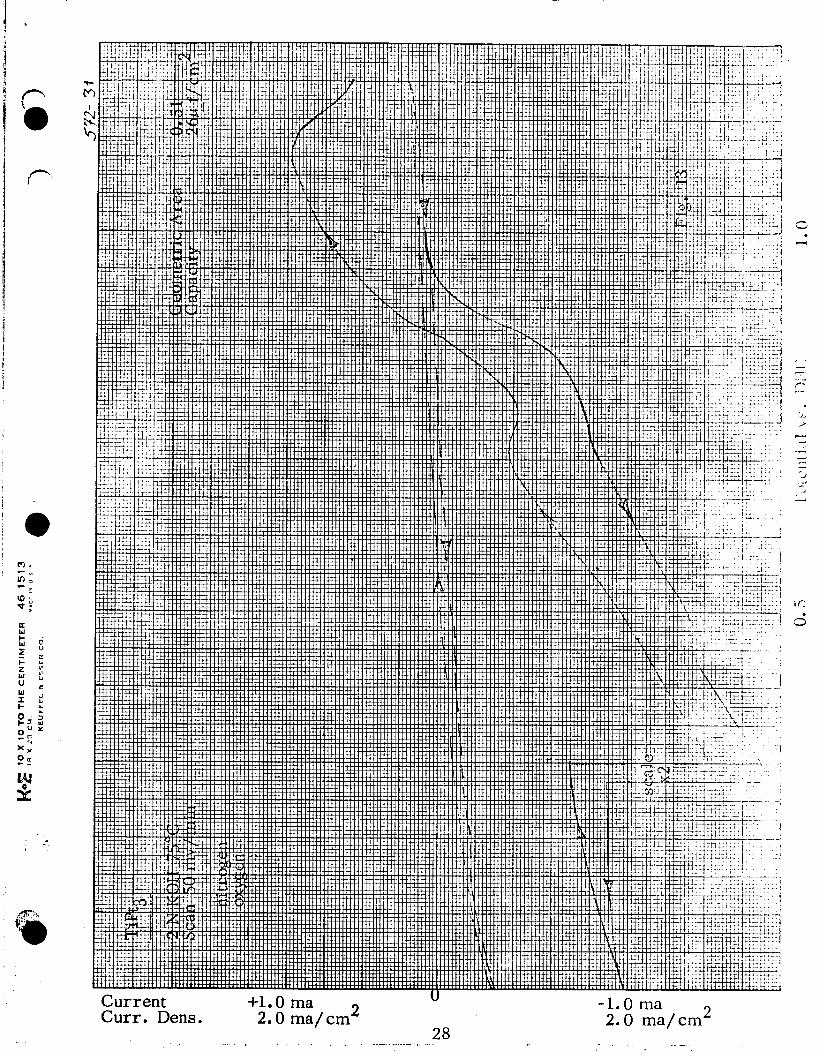
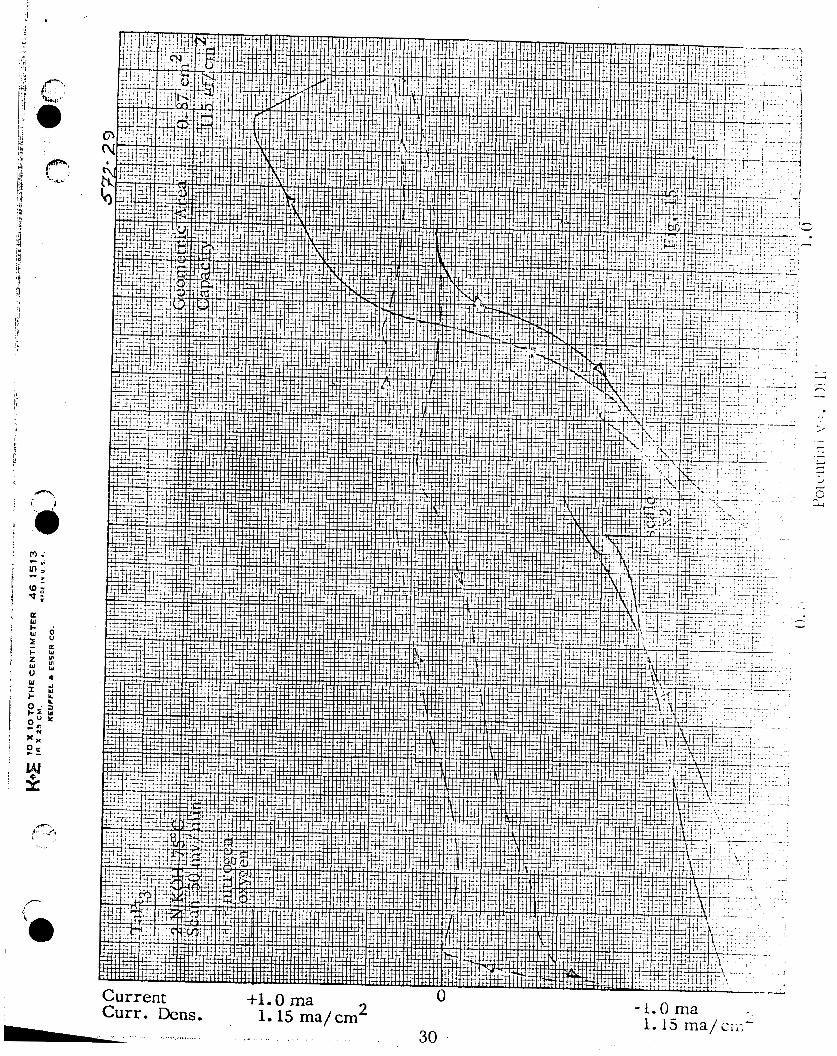
i(E)-curve for TiPt3
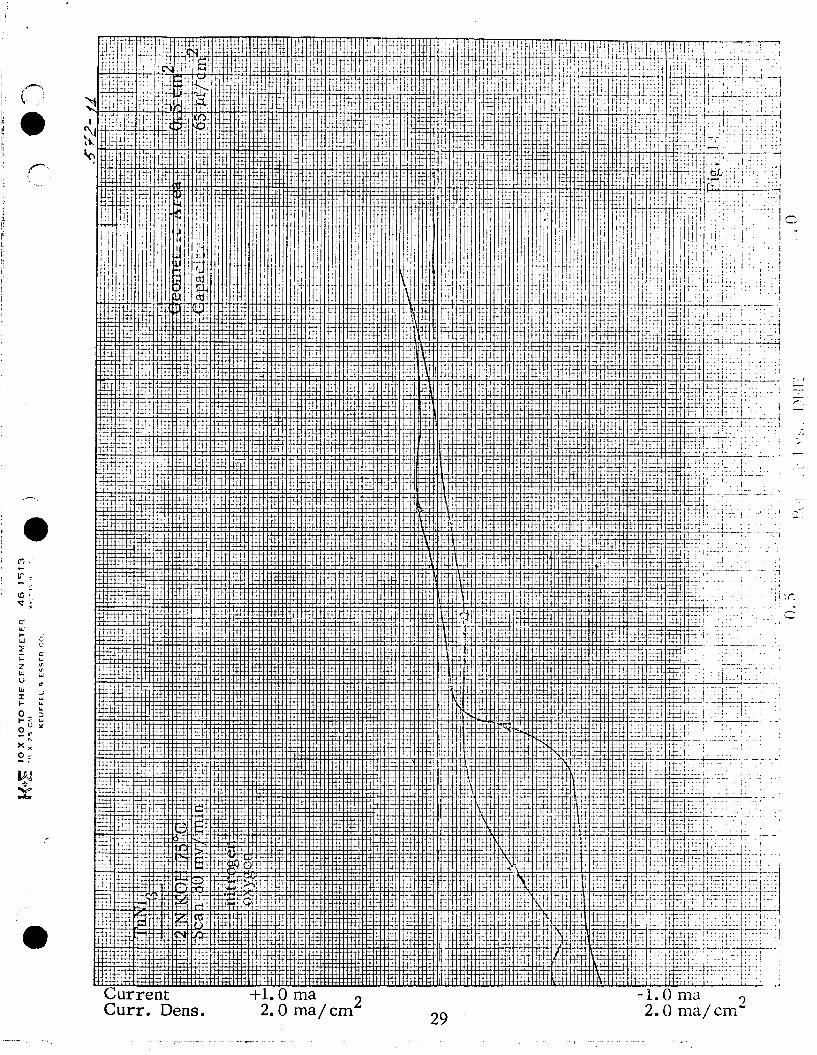
i(E)-curve for TaNi3
i(E)-curve for TaPt3
i(E)-curve for TiCu3
i(E)-curve for ZrAu3
i (E) - cruve for NbNi3
i(E)-curve for TiNi3
i(E)-curve for TiCrq
i(E)-curve for WC
i(E)-curve for Cr3C2
i(E)-curve for Tic
i(E)-curve for Ni3B
Page No.
5
7
12
19
20
21
22
23
24
25
26
27
28
29
30
31
32
33
34
35
36
37
38
39
I. INTRODUCTION !
The objective of this program is to investigate, in the least ambiguous manner, a large number of electrically conductive materials over a relatively wide range of composition and structure for catalytic activity in the electro-reduction of oxygen. Materials screened i n this manner a re to be developed as cathodes for low temperature hydrogen- a i r fuel cells employing alkaline electrolyte.
Basically, two approaches a re being used in selecting the materials for this study. In one approach, the structure is the criterion of selection. Specifically, intermetallic compounds, including inter - stitials such as borides, nitrides, silicides, carbides, and oxides wi l l be studied. The structure classification is given i n Appendix A. In the second approach, compounds wi l l be selected according to atomic considerations or because of previous work with related systems, for example, spinels or special solid solutions. Comparison of alloys having a common element with each other and with pure elements wi l l help to ascertain the relative importance or contribution of structure versus that of the atomic components.
Since the surface of the material in contact with the electrolyte assumes a composition corresponding to its galvanic potential, (by oxidation, leaching of surface atoms, etc. ) the difference between s u r - face and bulk composition at the working potential of an oxygen (air) cathode wi l l have to be taken in account and, when possible, investigated.
A. Materials
A close examination of the literature and discussions with people in the field of catalysis showed that preparations of highly dis- persed metal powders by precipitation, decomposition, or reduction of salts a r e all beset by difficulties i n obtaining well-defined alloys, It is apparent that i n general one does not know even with simple systems, e.g. Ni-Cu, whether material prepared by one of these methods is a homogeneous alloy, a mixture, or perhaps a unique,
- 1 -
low -temperature alloy form. Therefore, w e have decided to postpone examination of such materials to the second quarter of the program, after w e shall have built a backlog of experimental information with alloy systems whose structure could be ascertained without doubt.
Alloys a r e prepared from the melt in the initial phase of this program. Arc-melting, which yields well-defined, homogeneous alloys, is being used at present. The least ambiguous procedure for identifying the alloy, provided the phase diagram is known, is by metallographic examination, which shows whether a second phase is present or not. By starting with known quantities of each component and by ascertaining that a single phase is produced, we can achieve an unambiguous characterization to a degree of sensitivity higher than that of either chemical 6r X -ray analysis. Supplementary measurements a re made whenever there is doubt about the structure of the material. A l l binary or ternary systems with known phase diagrams can be treated in this way. In cases where the phase diagram has not been determined, the phase or phases present must be identified.
B. Testing Procedures
A convenient method of testing a material for corrosion resistance and catalytic activity is to use the material as a solid ingot. As such it can be mounted in an alkali resistant resin and tested potentiostatically a s a rotating disc electrode r u n consecutively i n N2- and 02- saturated KOH -solution.
an inert atmosphere w e can not only estimate the dissolution rate under open circuit conditions, but also measure the corrosion behavior over the whole potential region which is relevant to performance as an oxygen electrode. It is likely that in certain cases a material which corrodes at too high a rate on open circuit is nevertheless acceptable because it passivates in the region of positive potentials where oxygen is reduced.
By potentiostatic measurement of the corrosion current under
- 2 -
The advantages of this method a re that the samples can be prepared with relative ease and speed, and have well-defined surfaces. These can then be tested unequivocally for corrosion and reasonably well for 02- activity under well-defined transport conditions (Levich equation). The disadvantages of the method are: (a) the sensitivity of the electrode, with its low roughness factor, to poisoning by impurities ( th i s is minimized by the high electmde potential at which O2 is reduced and by the continuous surface renewal due to the small corrosion current present in most cases); (b) the low concentration of surface peculiarities which a re abundantly present i n the very rough surface of porous electrodes and which may have enhanced activity for the electro- reaction; and (c) the difference i n electrode structure from the structure of the practical electrode.
This combination of advantages and disadvantages necessitates using this method as a test for corrosion rate (with and without forced convection), and as a screening test for indications of 02-activity on materials which show reasonable corrosion resistance; this method wil l also be used for a more detailed study on mechanisms of 02- reduction on selected materials. Simultaneously, w e plan to examine materials which show promise either from the rotating disc experi- ments or from previous experiences and literature data. This wi l l be accomplished by mixing these materials with a hydrophobic binder and testing them as a half cell in a floating electrode setup (described below). Finally, exceptionally active materials wi l l be tested in complete fuel cells,
- 3 -
11. EXPERIMENTAL WTHODS
This section describes the procedures now i n operation for the preparation of the ingot, the mounting of the sample as a rotating disc electrode, and the actual testing of this sample, The results on several materials tested by this method a r e summarized i n Section 111.
In addition, a technique of examining half cell electrodes which previously have been shown to yield consistent results is described. This apparatus has been built, but no experiments have yet been made.
A. Testing of Solid Ingots as Rotating Discs
PreDaration of the Disc Electrode
1. Carefully weighed mixtures of pure elements a r e arc-melted in a furnace with six water-cooled copper heaters (each one-inch i n diameter) using a tungsten tip under an argon atmosphere. A Ti getter is fired before each r u n in order to eliminate traces of 02. A maximum of six ingots weighing 5 to 10 grams can be obtained in one run.
2. If the alloy or compcund is formed peritectically (i. e. during the solidification, the composition of the solid phase differs from the composition of the liquid phase) the ingot has to be annealed, preferably overnight at a convenient temperature. If the alloy or compound is formed congruently (i. e. the solidifying phase always has t h e same composition as the molten phase) this ingot can be used without any subsequent thermal treatment.
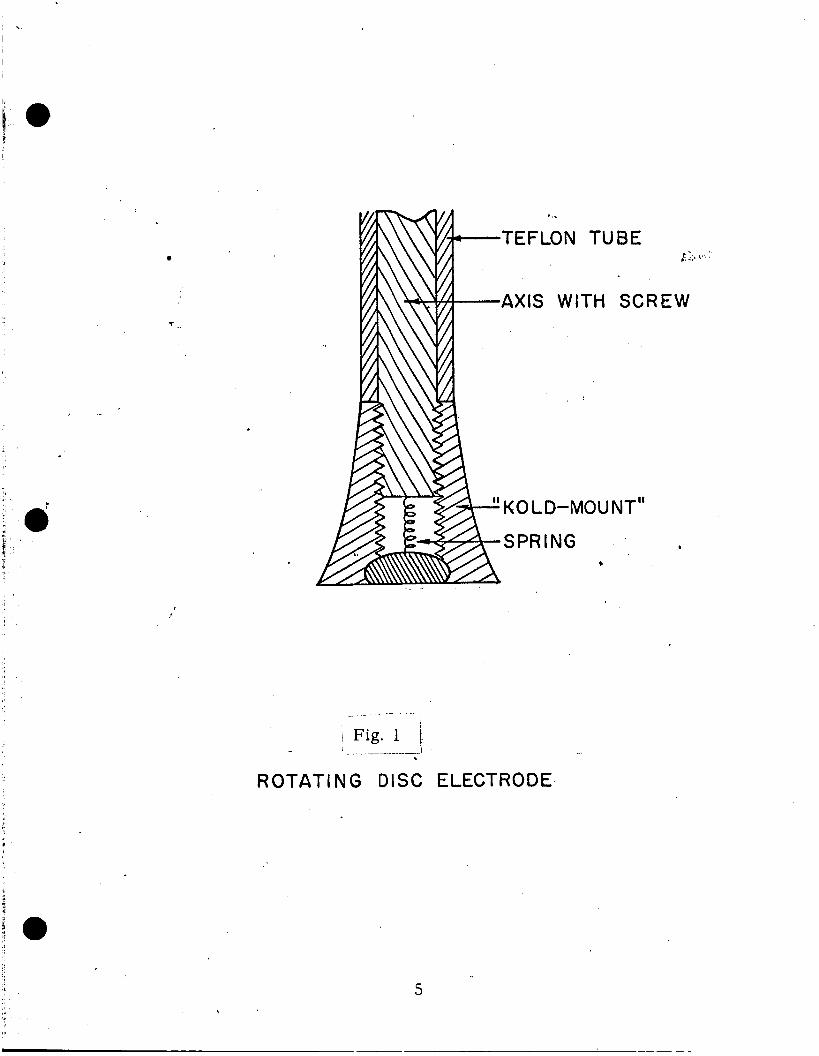
3. The ingot has a button shape when removed from the furnace and has to be cut with a boron carbide or chromonel saw i n order to expose two parallel flat circular faces (see Fig. 1).
4. One part of the sawed button is used for metallo- graphic analysis, according to standard procedures.
- 4 -
I,
_...- I
i Fig. 1 f
ROTATING DISC ELECTRODE
5 ,
.
5. The part of the button with the two parallel flat circular planes is incorporated as shown i n Fig. 1 with "Koldmount" (a resin used for metal1 raphic work, which w e have found to errode less than 0.05 mg/cm in 2 N KOH at 80°C over a period of 80 hrs.) This arrangement, besides isolating the electrical contact to the elec- trode from the electrolyte, also constitutes an ideal configuration for controlling precisely mass transport to the electrode.
?!
6. Electrical contact with the button is achieved by screwing a metal stirring rod down on a spring-loaded contact i n the threaded shaft of the Koldmount. For protection against the electro- lyte, the rod, spring, and contact a r e gold plated and the rod is covered with heat shrinkable Teflon tubing (see Fig. 1). The electrode assembly is mounted in a Sargent 600 kpin' synchronous motor designed for voltammetry with solid electrodes. Contact between the stirring rod and the fixed lead is made by dipping a w i r e into a pool of mercury in t h e hollow top of the rod.
B. Electrochemical Testing
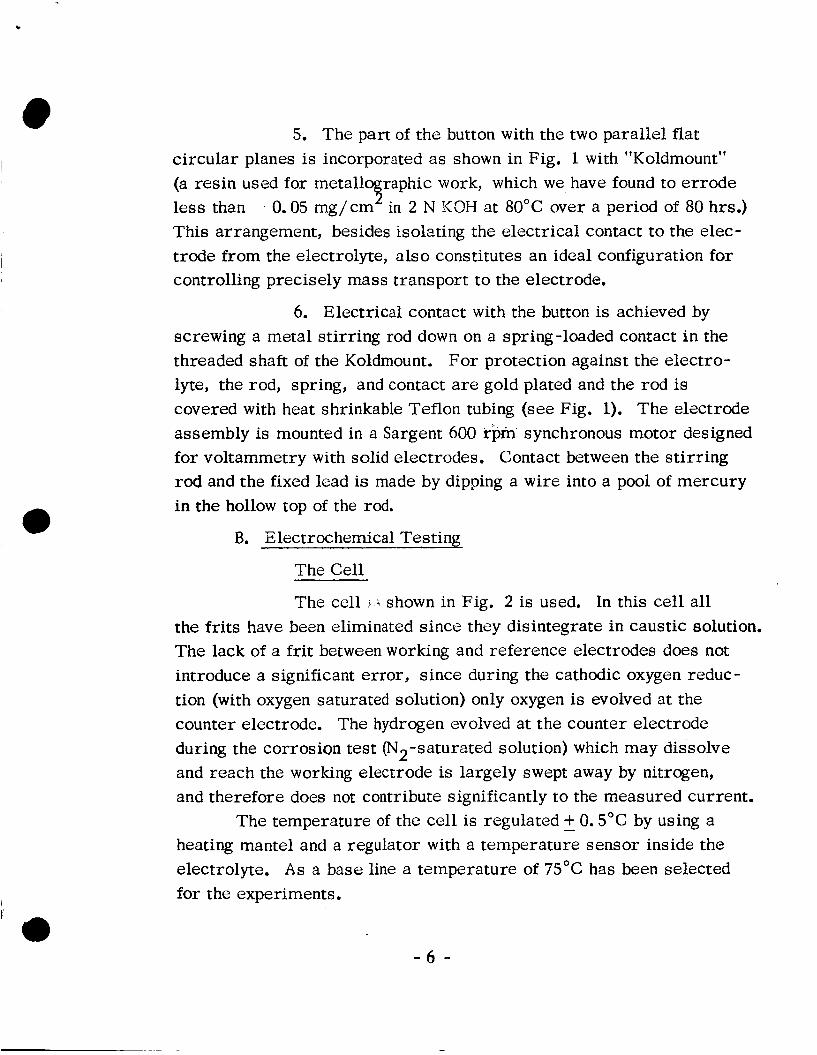
The Cell
The cell j i shown in Fig. 2 is used. In this cell all the frits have been eliminated since they disintegrate i n caustic solution. The lack of a frit between working and reference electrodes does not introduce a significant error, since during the cathodic oxygen reduc- tion (with oxygen saturated solution) only oxygen is evolved at the counter electrode. The hydrogen evolved at t he counter electrode during the corrosion test (N2-saturated solution) which may dissolve and reach the working electrode is largely swept away by nitrogen, and therefore does not contribute significantly to the measured current.
The temperature of the cell is regulated + - 0.5"C by using a heating mantel and a regulator with a temperature sensor inside the electrolyte. A s a base line a temperature of 75°C has been selected for the experiments.
- 6 -
0
\
i
1 i 1--
I
i i
i 1 -r
I ! ' ! ?
I !
/'
" /
\ I
Fig. 2
7
I .
A l l the experiments reported have been done using only one cell. A second cell has been built and w i l l be used i n parallel, in order to utilize better the electronic instrumentation and the available time, since extended periods a r e consumed with deaeration, repolis hing the samples, etc.
preliminary experiments with 35% (8.4 M) KOH (see "Results"). This concentration has a more favorable transport factor (D x C) than 8.4 M KOH solutions used in practical fuel cells. Since the screening electrolyte is milder than practical conditions, the chances of missing a possible catalyst a r e reduced. However, favorable results obtained with 2 M KOH solution have to be extended to higher concentrations by subsequent tests.
The electrolyte concentration has been set at 2 M KOH after
Electrochemical Measurements
i (E)-curves a re generated by imposing a linear potential scan on the working electrode by means of a slow linear potential signal to a Wenking potentiostat. The slow function generator was constructed with t w o standard batteries, two 10 turn, 10 K potentio- meters, and a synchronous motor (Insco Corp., Groton, Mass. ), The motor has a basic speed of 4 rpm and six gear ratios of 1:1, 2:1, 5:1, 10: 1, 20:l and 50:l. By changing these gear ratios and the peak voltage, scanning rates from 10 mv;/.'min to 800 mv/min can be obtained. For the initial routine screening, a rate of 50 mv/min has been selected.
recorder. Current -time curves at constant potential for relatively long times can be recorded on the same recorder by using the slow function generator to feed the y-axis of the recorder.
inert gas (N2) is measured at a series of potentials. This corrosion current has to be measured with stirring in order to subtract it quan- titatively from the O2 reduction current. It is also measured without
The current-potential curve is recorded directly on an x-y
Before an activity test experiment, the corrosion current under
- 8 -
stirring in order to apply the results to a practical electrode. Also the possibility of corrosion decrease with time has to be investigated. A s long as the corrosion current is small compared with the expected 02-current (iL = 2 - 4 m a / c m ) the CZ-curve w i l l be run , even if the corrosion rate is higher than useful for a practical cell.
an intrinsic activity of the compound and not a mere increase of the surface area, the real surface area of the electrode has to be estimated. The only practical method of doing th i s during screening of a large number of flat electrodes is by measuring the double layer capacity of the electrode.
For the capacity measurements, w e have selected a method i n which a triangular wave of 50 cycles/sec and a peak-to-peak voltage of 100 mv (i. e. a sweep rate of 10 volts/sec), biased by a convenient dc voltage, is fed to the signal input of the potentiostat. The dc voltage is selected so that faradaic currents a r e avoided. If the electrode behaves as a perfect capacitor (no faradaic or ohmic resistance) the small triangular potential wave is transformed into a square current wave, with a peak-to-peak value which is proportional to the electrode capacity and therefore to the real surface (see Appendix B).
2
In order to ascertain whether a n observed performance represents
Procedure
The following procedure is being used at the present for routine screening. Modifications of the procedure w i l l be introduced when advisable.
1) - N2 Saturation: A f reshly prepared 2 M KOH solution is saturated with pure nitrogen for at least 45 minutes. The electrode is kept inside the cell but not exposed to the electrolyte until N2 saturation is complete.
2) Corrosion i(E) Curve: The electrode is introduced into the solution at a potential of E = 0 mv. The potential scan is initiated within a minute at a rate of 50 mv/min and 600 $pm rotation.
- 9 -
.
The potential scan is reversed between E = 0.8 volt and E = 1.23 volts, depending on the extent of corrosion in this range. If there is a high corrosion rate at the lower potentials, higher potentials a r e still investigated since there may be a region of passivation i n the potential range of interest.
1 or 2 minutes without stopping the potential sweep (in order to see the effect of stirring on corrosion).
A t several points of the i(E)-curve, stirring is stopped for
3) Measurements of the Double Layer Capacity: A t several points in the i(E)-curve (under N2) the recording is interrupted and a double layer capacity measurement is made as described above.
The electrode potential is never left uncontrolled in order to control the history of the electrode from t h e moment it is immersed in solution. If, in addition to the i(5)-curve, the electrode has to be left for some time at =! known potential, the time at this potential is kept as short as possible and noted. During extended periods of inactivity the electrode is removed from the solution and any attached electrolyte is removed by rotating the electrode i n the gas phase for a short time (for iwtance, half a minute).
4) - 02-Saturation: If the corrosion current is within tolerable limits, the test for 02-activity is carried out. The electrode is removed from the system and repolished, and the solution is saturated with O2 (at least 3 / 4 hour ).
is introduced into the electrolyte at a high, passive potential when possible, but below any current wave (usually between 0.8 volt and 1.23 volt) and the i(E)-curve is initiated i n the direction of the decreasing potentials. A t E = 0, the direction of the potential sweep is reversed.
5) i(E)-Curve for 02-Rzduction: The repolished sample
6) To eliminate the effect of poisoning it may be advisable i n a few cases to repeat some i(E)-curves with different potential sweep rates ranging from 20 mv/min to 400 mv/min.
- 10 -
7) Measurement of the double layer capacity in the region of the limiting current may be necessary when doubts exist about real surface increase incurred during the recording of the i(E)-curve.
8) After recording the i@)-curves a micrograph of the electrode surface is taken and the sample is filed for subsequent study.
C. Testing of Finely Divided Catalysts
Materials showing negligible corrosion and some degree of 02-activity in the previous test, o r materials which are known from previous experience (including literature) for activty i n O2 - reduction wi l l be tested as finely divided powders, These will be prepared by any method yielding f ine powders such as pulverizing of solid ingots, co-precipitation (with the reservations expressed in the introduction), plasma spraying, explosion of wires, thermal decomposition of salt mixtures? etc. After preparation? thc real surface of the resulting finely divided material will be measured using the B. E. T. krypton adsorption s ys tern.
The electrode will be made by mixing the material with a suitable amount of Teflon powder (Teflon - 30) or with polyvinyl resin, sintering or drying, and bonding to a fine mesh Ni-screen for electrical contact,
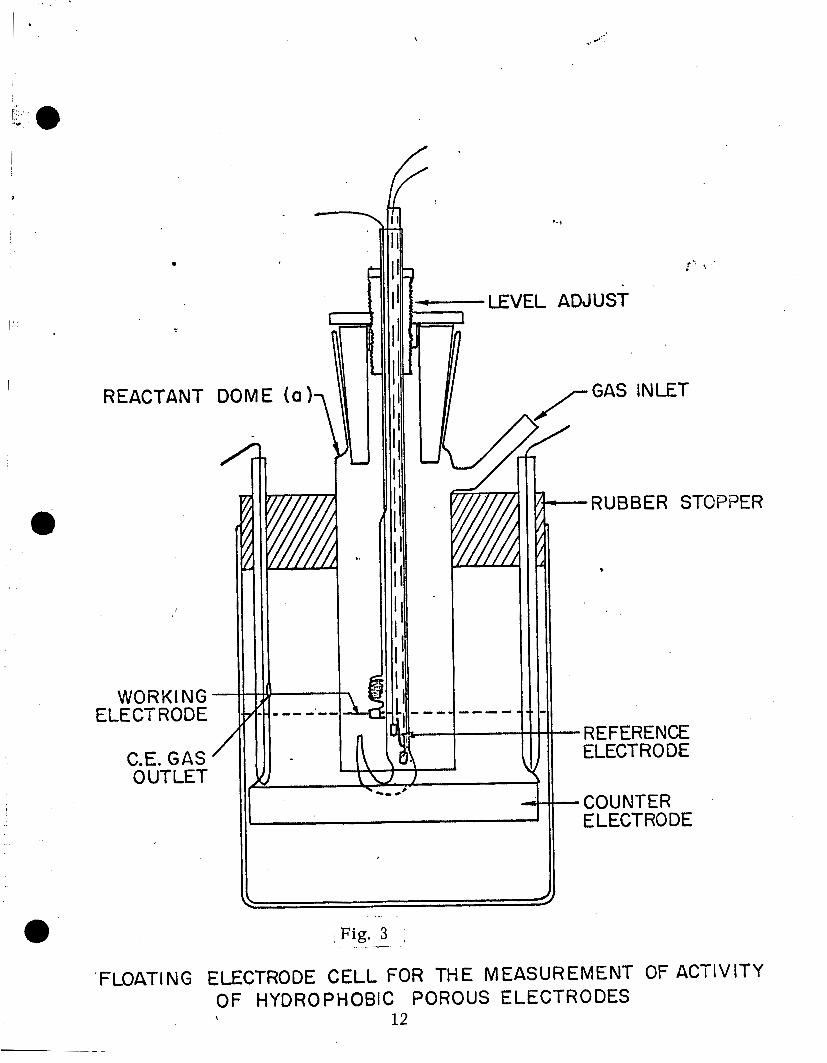
which is already fabricated and operable (see Fig. 3). This cell con- sists of an electrode (Q 1 cm area) placed on the surface of the electrolyte over which reactant gas is passed. This simulates the operation of a half cell without the complications of cell construction and operation i n a contained electrolyte. In addition the time required for characterization with O2 is about 1/2 hour, a considerable saving.
The electrode will be tested in a "floating electrode"* system
2
* J. Giner and S . Smith to be published.
- 11 -
REACTANT
I
WORKING ELECTRODE
C.E. GAS OUTLET
-LEVEL ADJUST
RUBBER STOP?ER
Fig. 3 , - - _ - -
FLOATING ELECTRODE CELL FOR THE MEASUREMENT OF ACTIVITY \ OF HYDROPHOBIC POROUS ELECTRODES
12
‘ 0
0
The body of the cell is a 500 ml resin reaction kettle. The cover supports the working electrode, reference electrode, and gas inlet. The gas exits from the cell through the threads i n the level adjust screw. The reference electrode and the working electrode holder are made in one piece so that the capillary tip is always at the same distance from the electrode. With this arrangement the resistance included in the electrode potential measurement is a constant for a given electrolyte and need be measured only once for a series of determinations i n a given electrolyte. This is a distinct advantage, since it is very difficult to place the capillary tip in such a position with respect to the working elec- trode that a constant or zero iR drop w i l l be included i n the polarization measurements, if the distance is adjusted with each electrode.
The electrode holder is fitted into the center t u b e with a screw device which permits a fine control on the level of the electrode with respect to the electrolytes and permits the electrode to be accurately placed i n the solution. Using this device it was found that raising or lowering the electrode from a position level with the electrolyte surface by 3 mm made less than 2% change in the current and thus the elevation of the electrode with respect to the solution is not critical.
- 13 -
111. RESULTS
The following intermetallic compounds and alloys have been melted thus far i n the program:
Cr3C2
Cr3Pt
HfC
Hf2Pt
MoNi
MoNi3
MoNi4
M o ~ Pt
NbC
Nb - 37.5 a /o Et
(CJ phase)
NbPt
Nb - 47.5 at % R e
Ni3C b
NiZrZ
Ta2Ni
TaNi
TaNi2
TaNi3
TaPd3
TaR2
TaV2
TaIr3
Ti3Au
Tic
TiCo
TiCrZ
TiZCu
TiCu
TiCu3
Ti2Ni
T i N i
TiNi3
Ti - 81 a t % C r
(Ti, Zr)Cr2*
WC
W2Hf
Zr2Au
ZrAu3
ZrAuq
ZrC
%rNi5
Zr 2Pd
ZrPd2
Nb+75 at % R e X phase
In addition, carbides of Nb, Ta, Mo, V?, Cr, Ti, Zr , and Hf a re available a s (- 325) mesh powders.
A l l of these compounds and alloys cannot be immediately tested for corrosion, since some of these form via a peritectic reaction, and must be heat treated in order to attain a single phase compound. Those
* 21.6 a / o Ti, 15.0 a / o Z r , 63.4 a /o C r
- 14 -
compobnds ddch fork cuHgklently may be tes ted as soon a s the particular ingot has been cut and metallographically prepared. The p r imary emphasis now is to work with those compounds which form congruently.
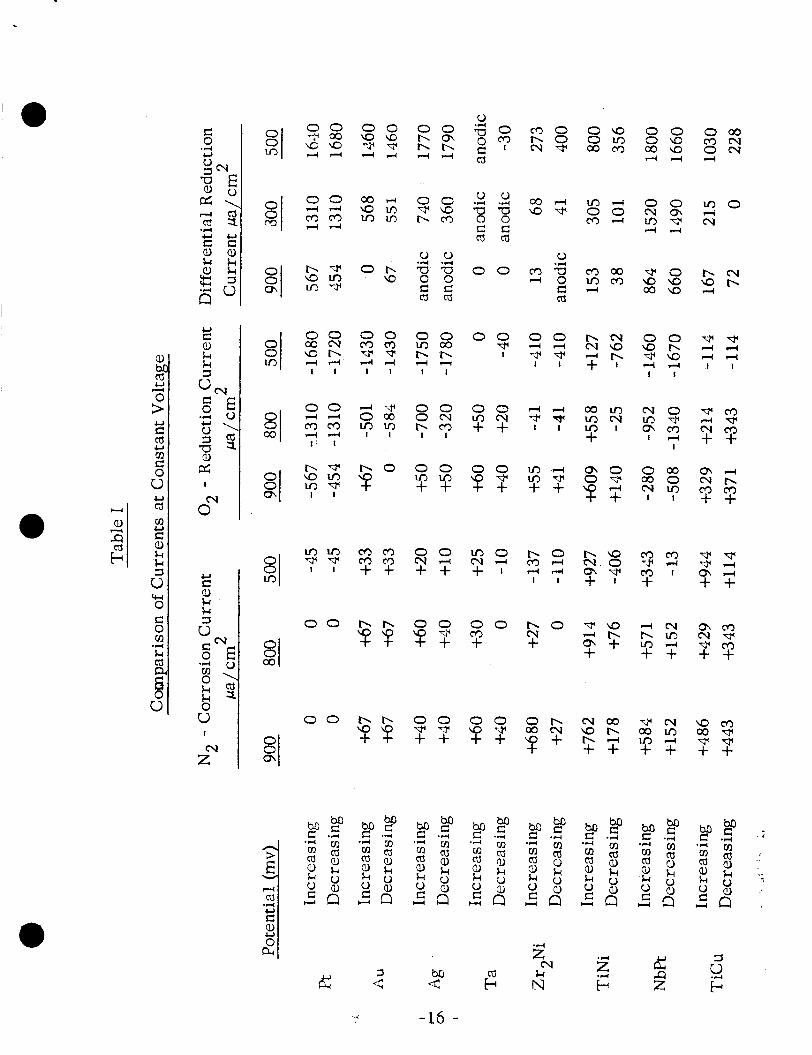
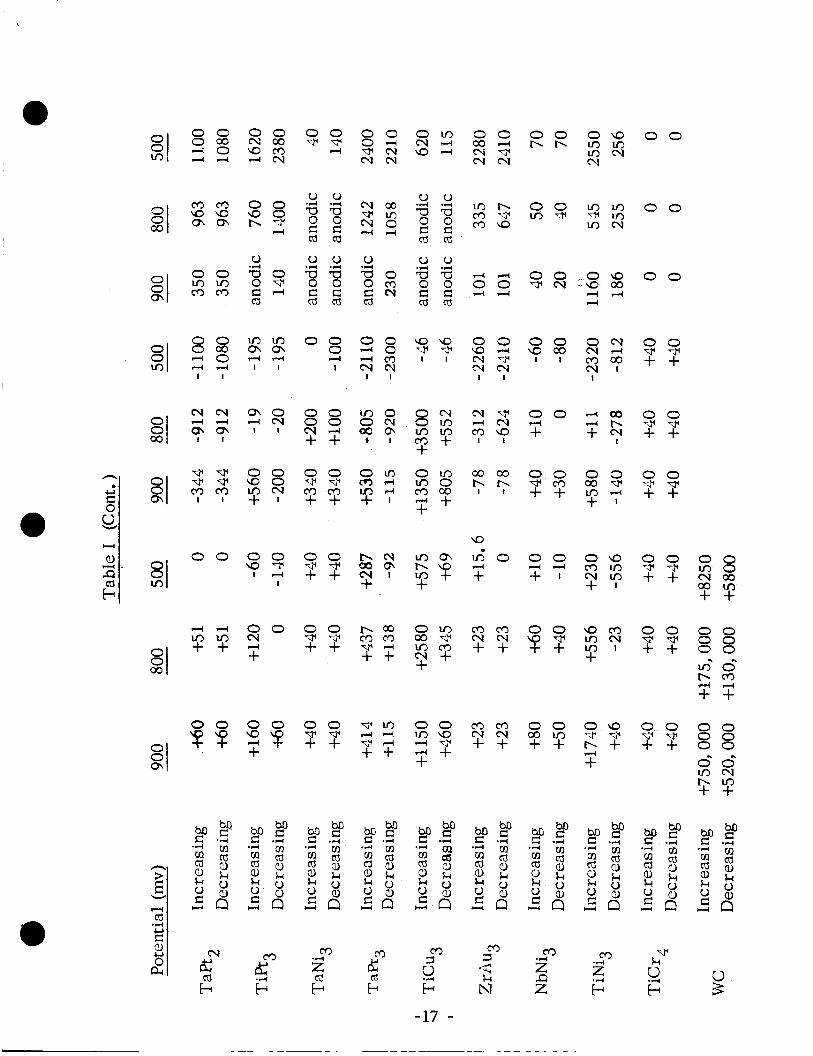
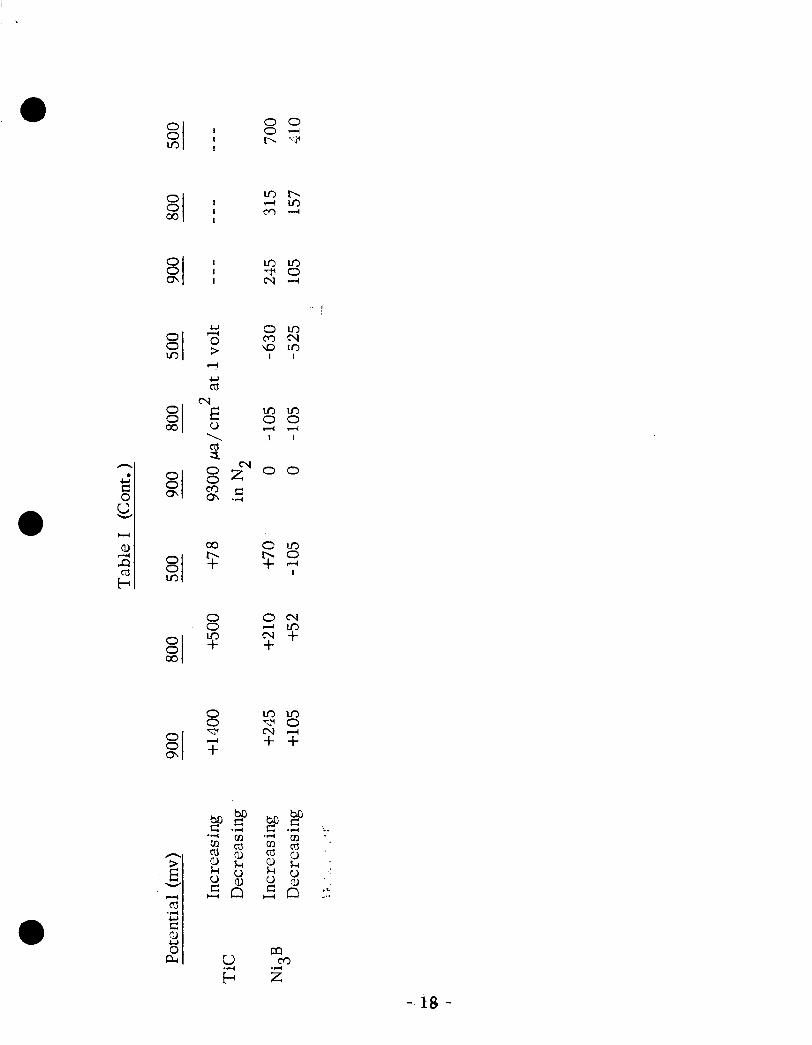
T h e results for corrosion and oxygen reduction obtained this far a r e given in Table I and Figs. 4 - 24. Only a brief discussion of the results is given here. A more extended analysis will be ca r r i ed out later.
A. Behavior of Pure Metals
Pure metals with known catalytic behavior fo r the reduction of 02, such as Pt, Ag, and Au have been tested i n o r d e r to confirm the applicability of the method and to establish some standards of comparison under the same testing conditions. In addition, testing has been s tar ted with other elements i n order to compare their behavior (corrosion and 02-activity) with that of the alloys.
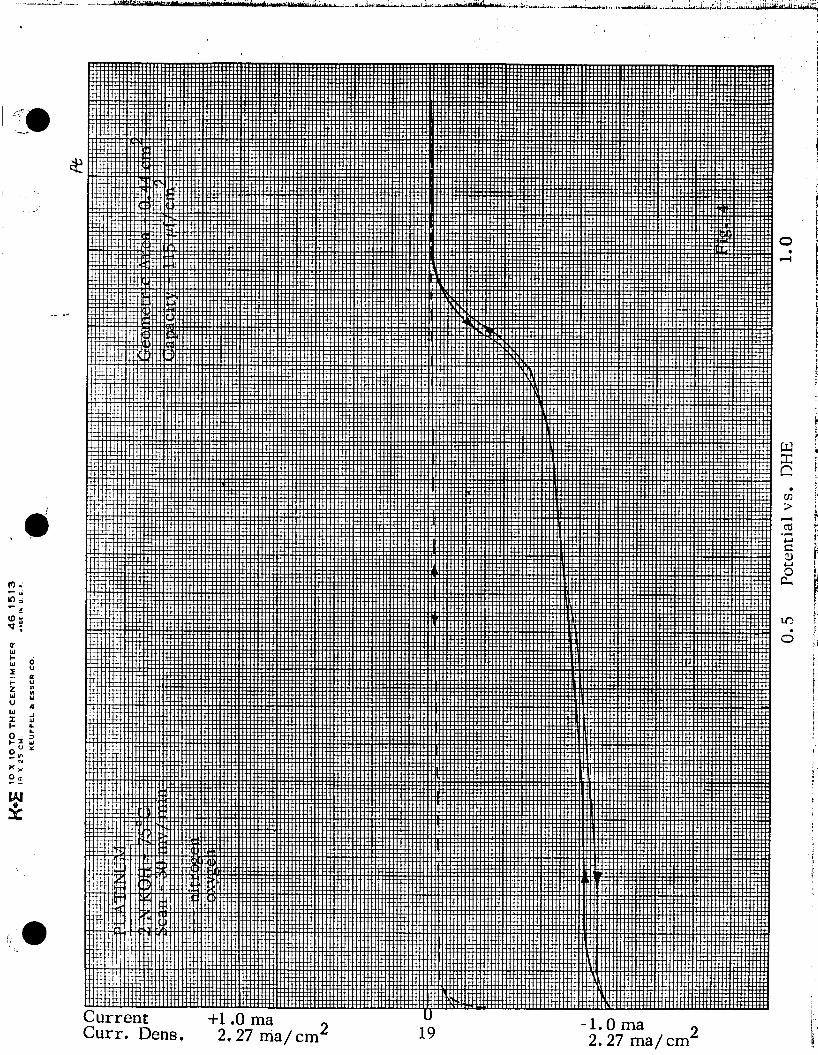
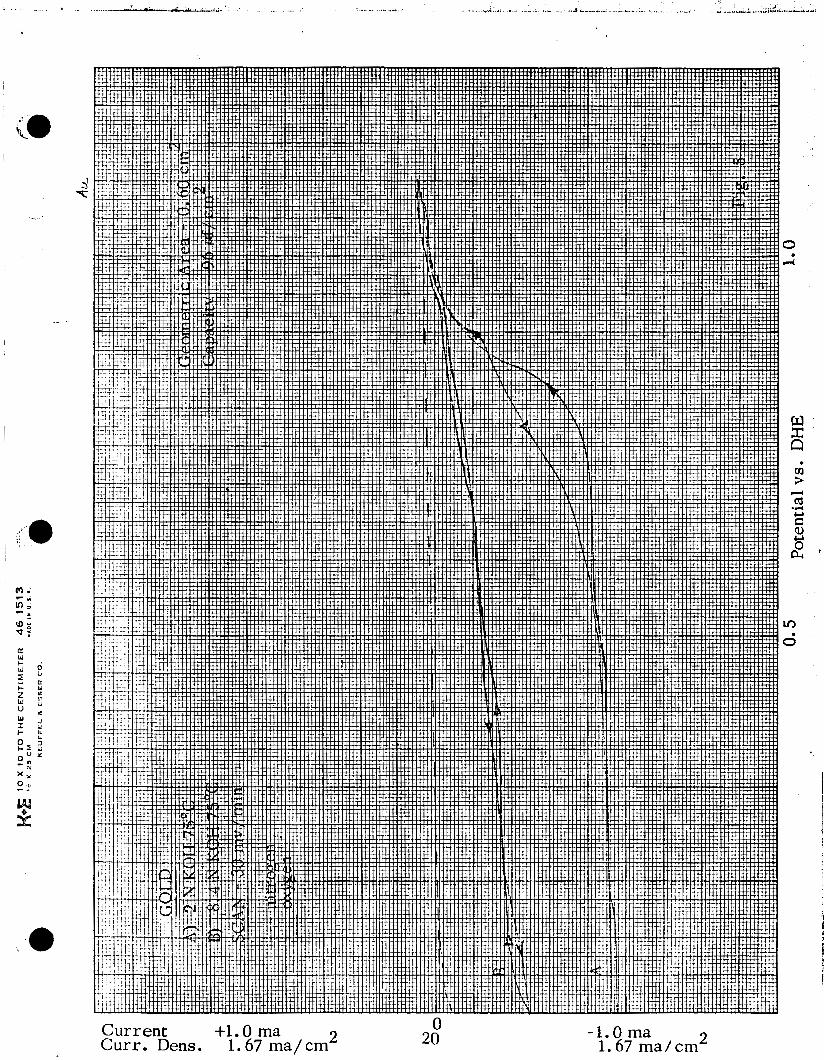
,Platinum (Fig. 4): T h e electrochemical behavior of Pt has been the object of numerous studies; therefore this metal can be taken as a standard. T h e i(E)-curve shows no activity above 1.0 volt, and below this potential the current increases sharply with increasing polarization. This agrees we l l with the results obtained with porous electrodes. T h e lack of activity and the hysteresis in the activation controlled section of the curve can be explained by assuming that the pt-0 layer which covers the electrode almost completely at potentials higher than E = 1 volt is inactive for DZ-reduction. As this oxide is reduced, the activity of the electrode increases sharply.
Gold: The i(E)-curves of Fig. 5 show, in the first place, that at high KOH concentrations (35%, 8.4 Molar) the i(E)-curve is not a8 w e l l defined as with 2 M solution; this can be attributed to decreasing O2-so1ubility with increasing KOH concentration and these considerations have dictated the selection of the 2M solution for all
- 15 -
' 0
m 8/ 0 0 m m 0 0 m c o 0 0
'cr I
0 0 "1-1
Y Y 0 0 9 h - 9 4 4
- 9 " 4 " 4 I I
b h 4 1 - 1 I I
" 4 I I I I
m m 0 0 O N v?
0 0 m N + +
m m m N I n 1 +
N O m * 7.2
I
v m 4 - c y m + + I I
0 0 m u , + + m - 4 m * + +
0 0 0 coo N u ) I I
m 4 N b m m + + 0" I + +
m m mer, + +
m o N 4 + I
b o m - 4 h v 3
N O
+ I 4 " I I u c
a, k k
k k 0 u
0 0 0 0 m + b o N +
1-1m b m m - 4 + + m m NTF P h + +
0 0 0 0 9 - 3 + +
O b
T T c y m a h b-4 + +
v m m m I n " + +
9 m cov p-4 + +
I
zN
2 cy
k N
M 4
.-< -14 -
n
0 c) v
M $ 1
I I I
I I I
U
0 > 4
u rd
N E u \ cj 3
oc) b +
0 0 Lo +
b
li!
In 0 4
I
In m In
I
Lo 0 4
I
0
4 I
N In +
b Z
I !
:.
2 C u r r e n t +1.0 ma Curr. Dens. 1.67 ma/cm
0 20 2 -1.0 ma
1.67 ma/cm
,I-
*
Current +l.Oma Curr. Dens. I l .Oma/cm
0 -1.0ma 1.0 ma/cm
c r
2
c 5
K
Current +1.0 ma -1.0ma Curr. Dens. 1.7 ma/cm 1.7 ma/cm
--- I ~ - 2- - , r ~ - . -__- -.- - 22 " -c -
Current Curr. Dens. 2 +1.0 ma
1.37 ma/cm 0
23
\
2 -1.0 ma 1.37 ma/cm
-.. . .. , . . .. ___,. . . .. -. - , .. .. .- . __ .. . . . . .
,-,
4
Current Curr. Dens. 2 +1.0 ma
1.27 ma/cm U
24 2 -1.0 ma
1.27 ma/cm
e.. .
- ..
. : , -
t
c
/--.
@
X X
0 .
x Y
-1.0 ma *? 1.27 ma/ CiiIr
2 Cur ren t +l. 0 C u r r . Dens. 1.27 ma/cm
- - - 25 -- - - - - _ - ,
.."+,.. I. ,, , . , . .. / , . , '
c; u r r e n t Curr. Dens.
+l.Oma U
26 1.43 ma/cm
7- - , - - _.
2 -1.0 ma 1.43 ma/cm
I
t
1
.I
.I It
2 -1.0 ma 0
27 1.72 ma/cm 2 Current +1.0 ma
Curr. Dens. 1.72 ma/cm _ _ - - - - - _ _ _ * -
Cur ren t Cur r . Dens.
+ L O ma 2.0 ma/ cm
U
28
-1 .0ma 2.0 ma/cm
c”
C
.-- ... r ,
I
nc1 . i 1
’ ‘0
Cum. Dens. -
1.15 ma/cmZ -1.0 ma . ? -
I
I '
!
,
*
K W
I 1.56 ma/cm" Curr. Dens. 1.56 ma/ cmL
32
r-1 - c - c
A
'.'
1 ,
Current Curr. Dens.
+1.0 ma 1.0 ma/ c m
0 -1.0 ina 1.0 ma/cm
i'
a
Current Curr. Dens.
+1.0 ma 0 0 2.04 ma/cm"
35
-1.0ma ,, 2.04 ma/ cinr
. . .. . .. . .. ... . .~ . ... . - . . --. . ., . _. .
Current Curr. Dens.
+l.Oma 2.9 ma/ cm
0
36 -1.0ma 2.9 ma/cm
.
2 Current +LO ma Curr. Dens. 1.55 ma/cm
-1.0 n u 7 1.55 ma/ CM-
. - . _ _ _ . . .. --. 37 .. . . .. . . . . . , . . . .. .. .. . . -. - . .. .
L
... , ...L.:l::
, ,,1
. . , . .. -. . . .
0 2 Current +1.0 ma
Curr. Dens. 1.64 ma/ cm 38
_ . - _.
-1.0 ma 3 1.64 ma/ cm-
, -,
e
experiments, as explained above. In addition, it can be seen that under similar conditions (2 N KOH and 75°C) gold has activity similar to platinum (compare current at 900 mv). The shape of the curve obtained in the direction of cathodic potentials (especially the indication of two steps) may mean that after anodic prepolarization the second step of the 02-reduction, H202 - H20, is inhibited to a greater extent than after cathodic polarization (gold may be more sensitive than platinum to poisoning in this region).
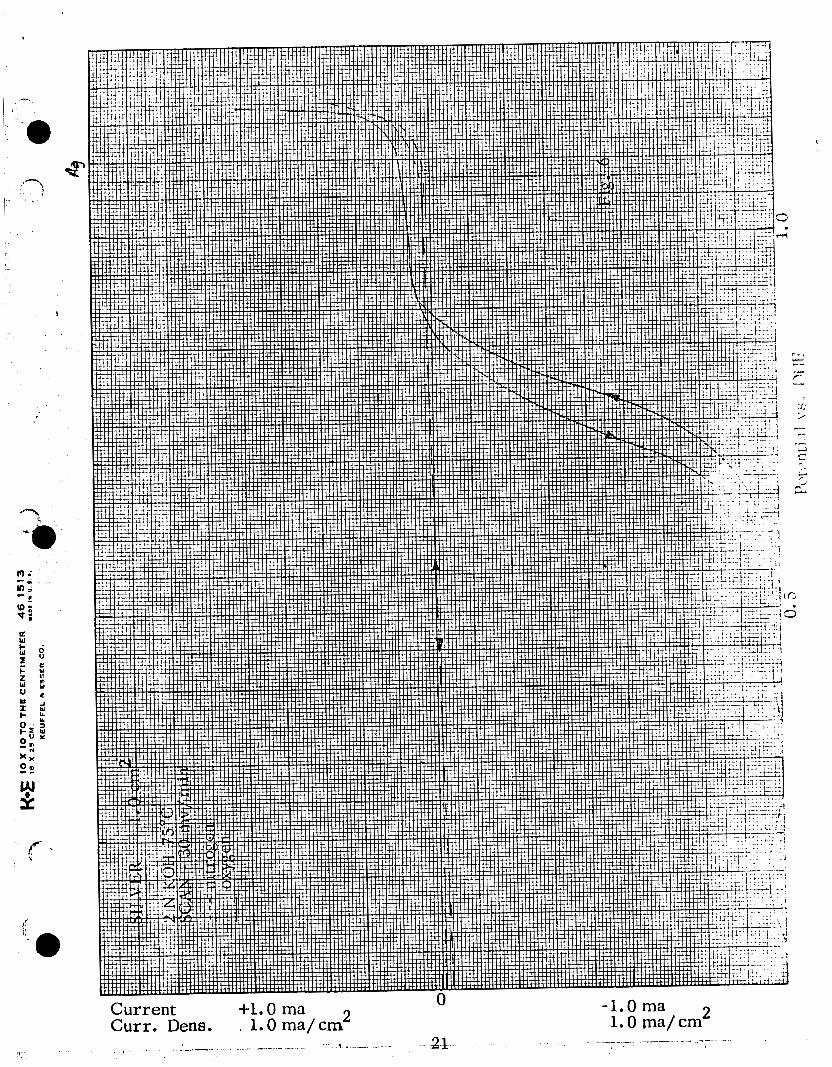
Silver (Fig. 6): Silver shows, at 0.8 volts polarization, a very sizeable 02-reduction current. This agrees with results obtained elsewhere by several groups with porous electrodes. There are also clear indications of oxidation of the metal at higher potentials. This oxidation causes the activity of the electrode to decrease a s shown by the hysteresis loop in the activation controlled region.
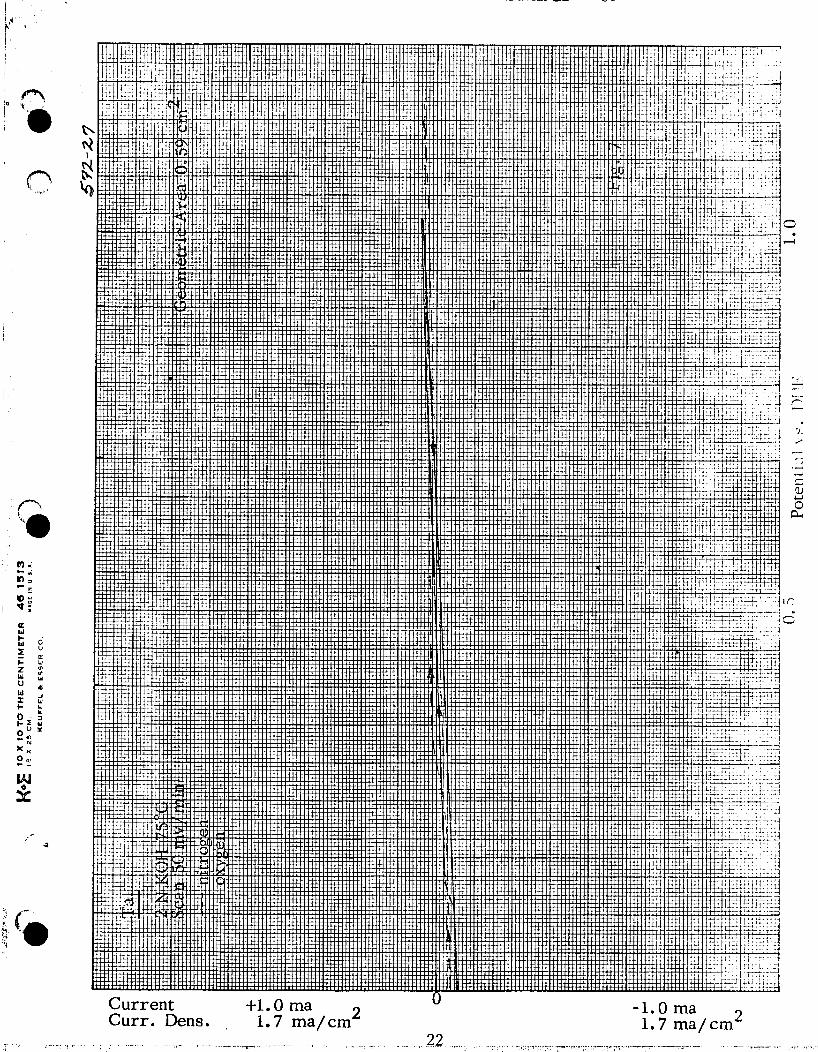
Tantalum (Fig. 7): Corrosion is low; activity for 02- reduction is also very low.
B. Intermetallic Compounds
A t this stage of the program, the materials tested a r e scattered without logical order through the classification of Appendix A. Even with these materials not all the tests have been yet performed (for instance, data on metallographic analysis a r e incomplete); this characterization wi l l be completed in the immediate future. It is expected that a s more materials a r e investigated, filling the holes in the systematic classification of Appendix A, comparison of the verious com- pounds wi l l show general trends with respect to the importance of structure vs. atomic composition. A t that point, materials w i l l be selected to confirm or extend the findings. Special emphasis will be placed on interstitial and substitutional compounds (borides, carbides, nitrides, and oxides).
a r e given below, and finally, a summary table with values of current Some comments on the i(E)-curves of the materials tested
- 40 -
density at several potentials is given (Table I). These values a r e of a relative and semiquantitative nature indicating trends rather than absolute figures e
- A2B - Stoichiometry
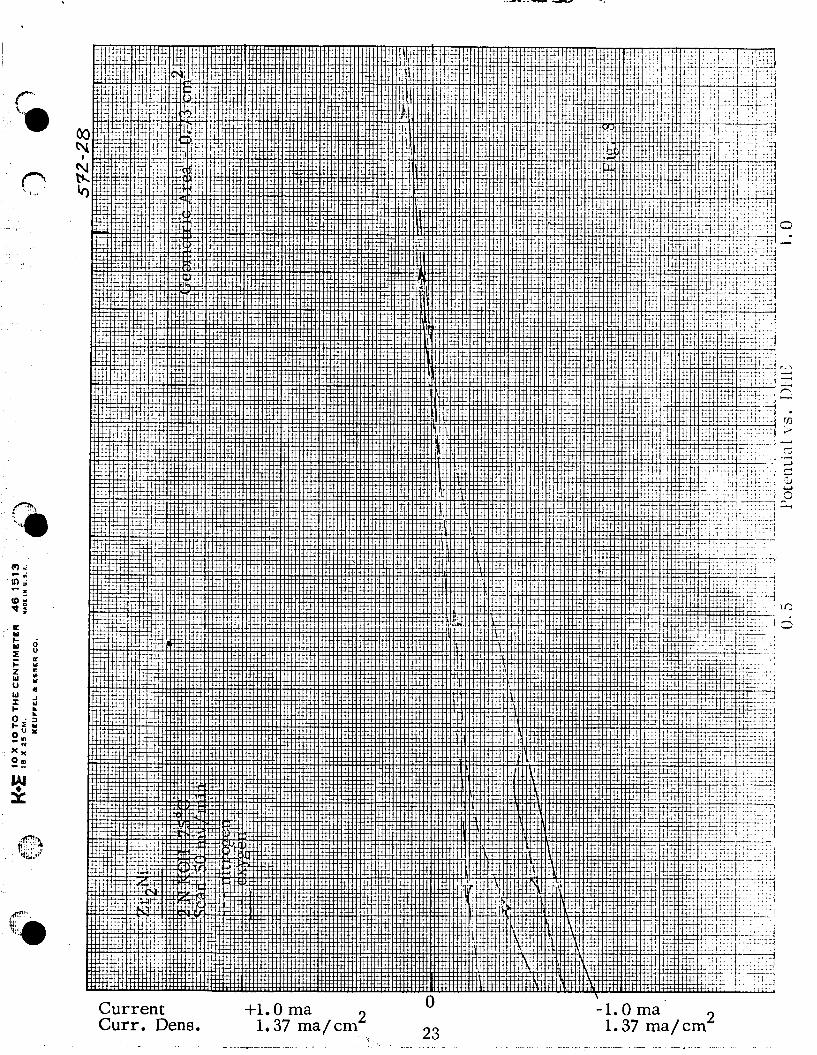
- - Zr2Ni (CuA12-type, C16 structure) (Fig. 8): corrosion is moderate; 02-activity is low but not insignificant,
AB - Stoichiometrv
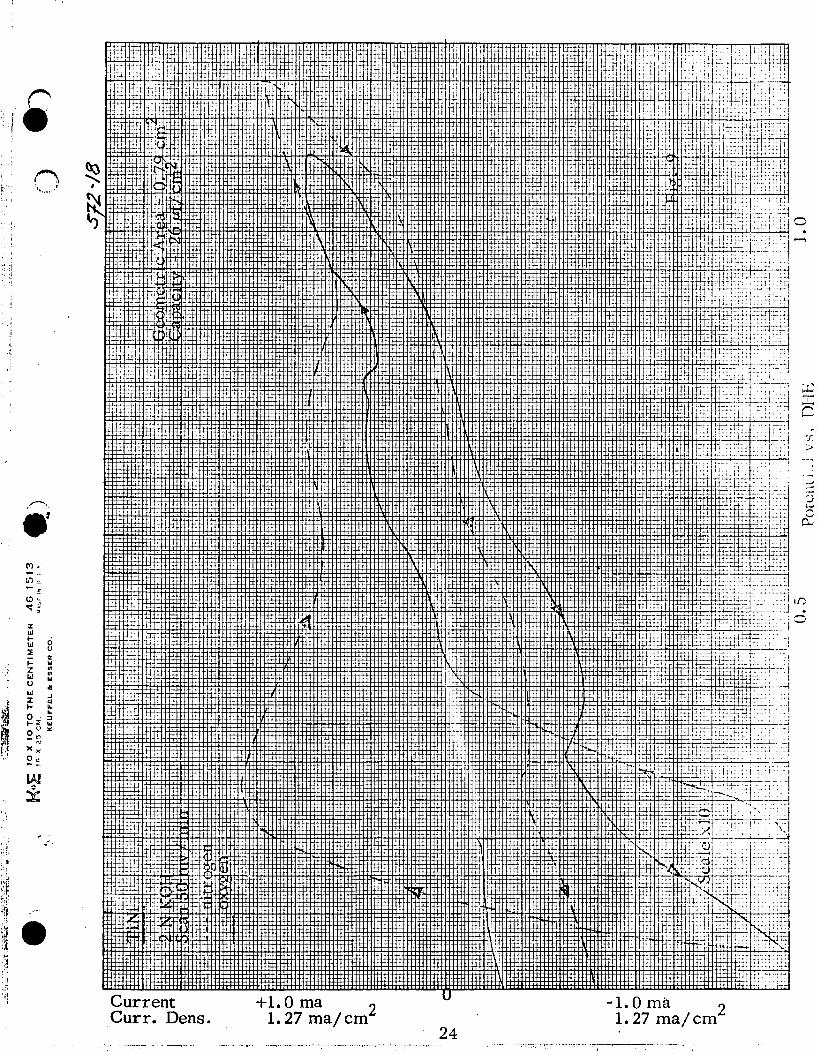
T i N i (C5C1-type, B2 structure) (Fig. 9): corrosion is excessive although passivation with time is possible; (large hysteresis). Activity for 02-reduction is low but not insignificant.
NbPt (AuCd-type, B19 structure) (Fig. 10): corrosion is excessive, although decrease with time is possible. Activity for 02-reduction is high.
high corrosion current showing little decrease with time, Activity for 02-reduction is very low at potentials higher than 500 mv.
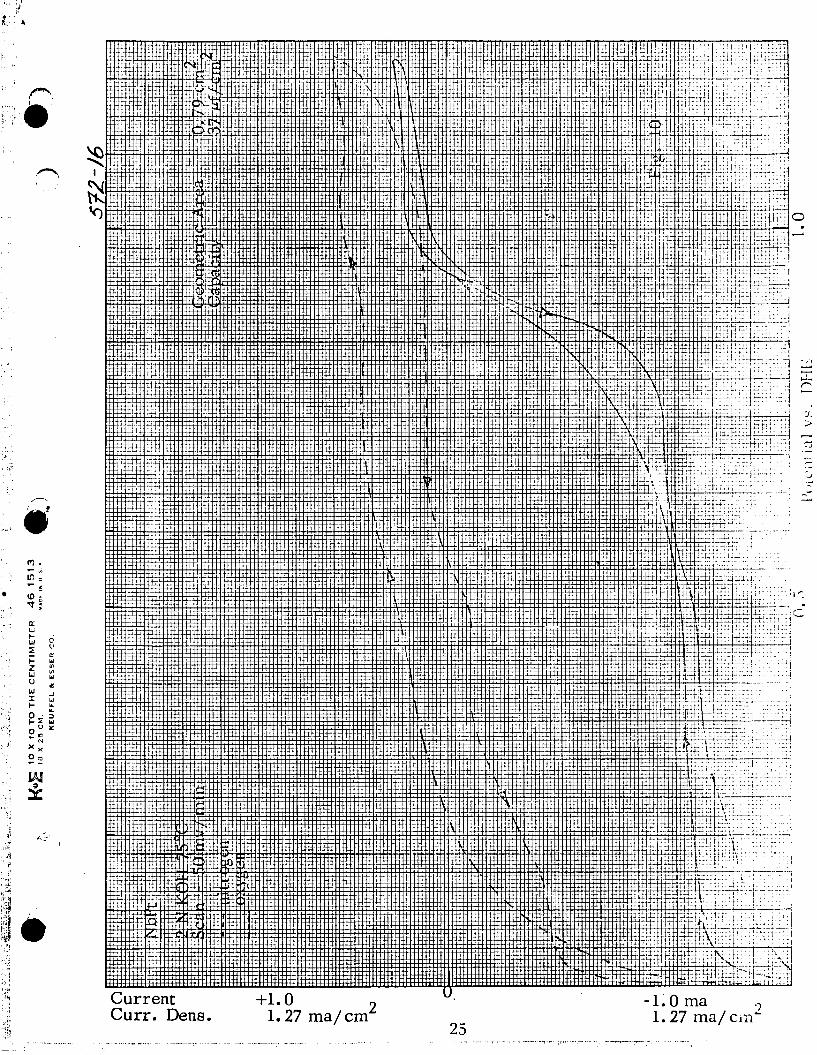
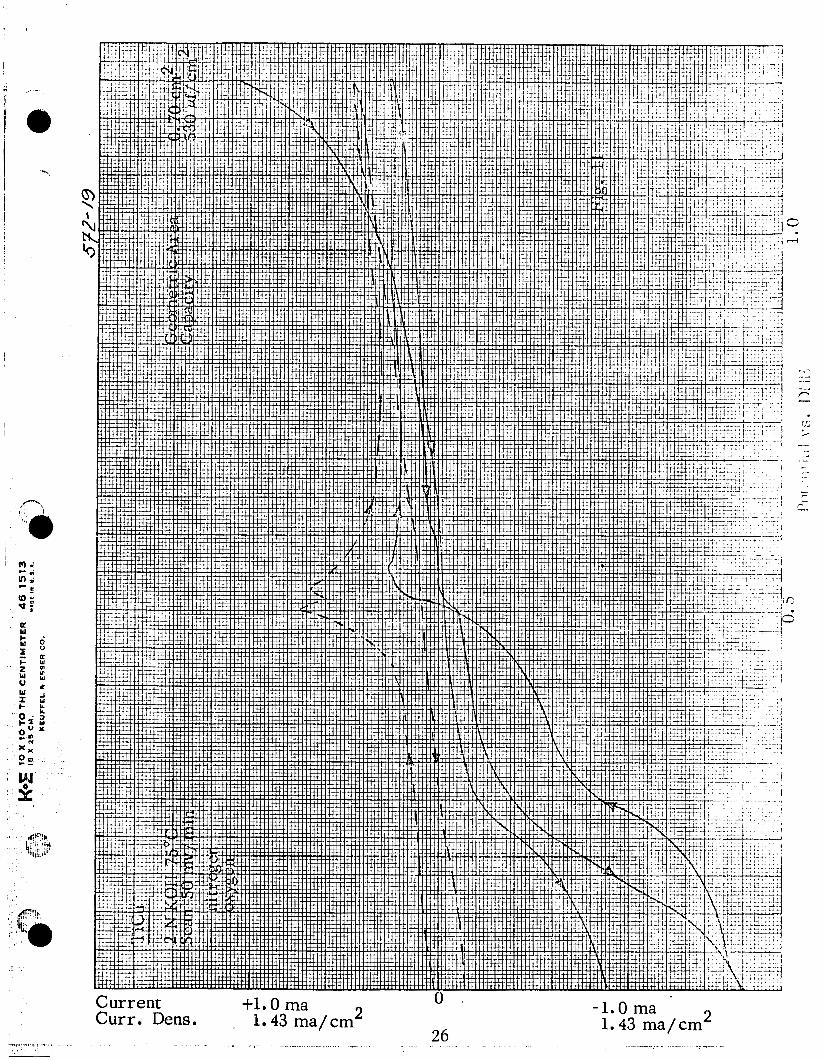
TiCu (CuAu-type, LLo structure) (Fig. 11):
- AB2 -Stoichiometry
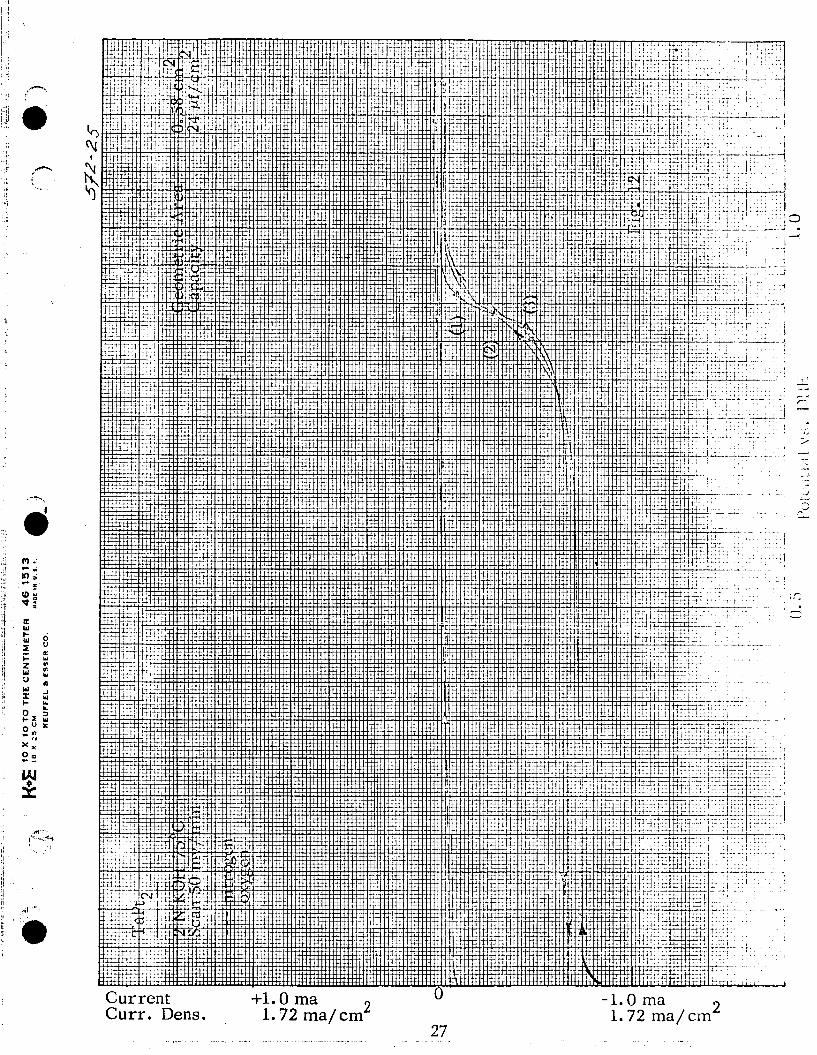
TaPta corrosion is very low; activity for 02-reduction is equal or better than pure Pt. (It may be a way of diluting Pt),
(Fig? 12) (c. p. orthorhombic phase):
AB3 - Stoichiometry - - TiR3 (AuCu3-type, L12 structure) (Fig. 13):
Although only moderate corrosion is found i n the N2-i(E)-curve and in the 02-i(E)-curve in the direction of decreasing potentials, the 02- i(E)-curve obtained i n the direction of increasing potentials ahows very high anodic currents. This apparent contradiction has to be clarified. Activity for 02-reduction is good.
TaNi3 (12 P s h - type, orthorhombic structure) (Fig. 14): corrosion is low. Activity for 02-reduction is low at potentials lower than 400 mv,
- 41 -
TaPtq (12 I s h - type, DOa structure) (Fig.. 15): corrosion is high, with some small decrease with time. A strong anodic current is encountered in 02- i(E)-curve taken in anodic direction, (similar to the one observed with Tie3), Activity for 02-reduction is good.
more than TaPt2, in spite of the larger Pt concentration, This may be a structural effect.
It is interesting to observe that TaPtg corrodes considerably
TiCu3 (2 Q s h - type, orthorhombic structure) (Fig 16): corrosion is ve ry high in the potential range of 02-reduction; activity for 02-reduction is very low at potentials higher than 500 m$.
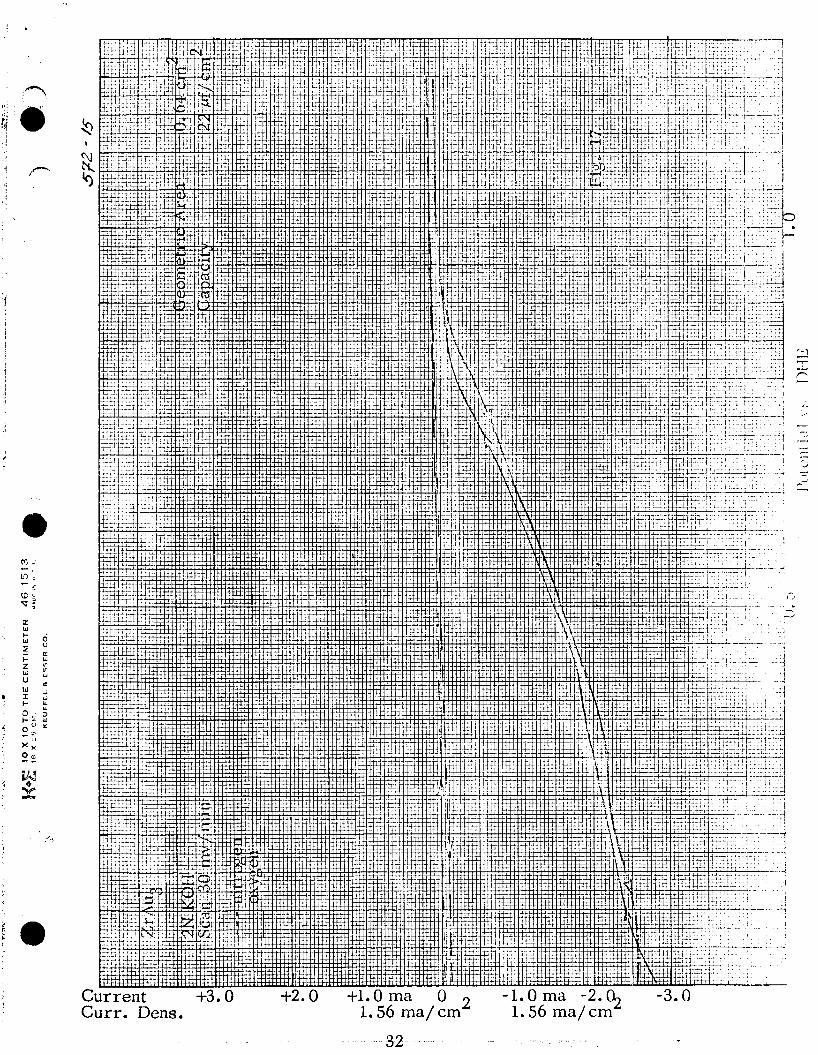
(2 P s h - type, orthorhombic structure) (Fig. 17): corrosion is very low, Activity for 02-reduction is high, although current does not increase abruptly with increasing polarization and no w e l l defined limiting current exists.
-
ZrAug
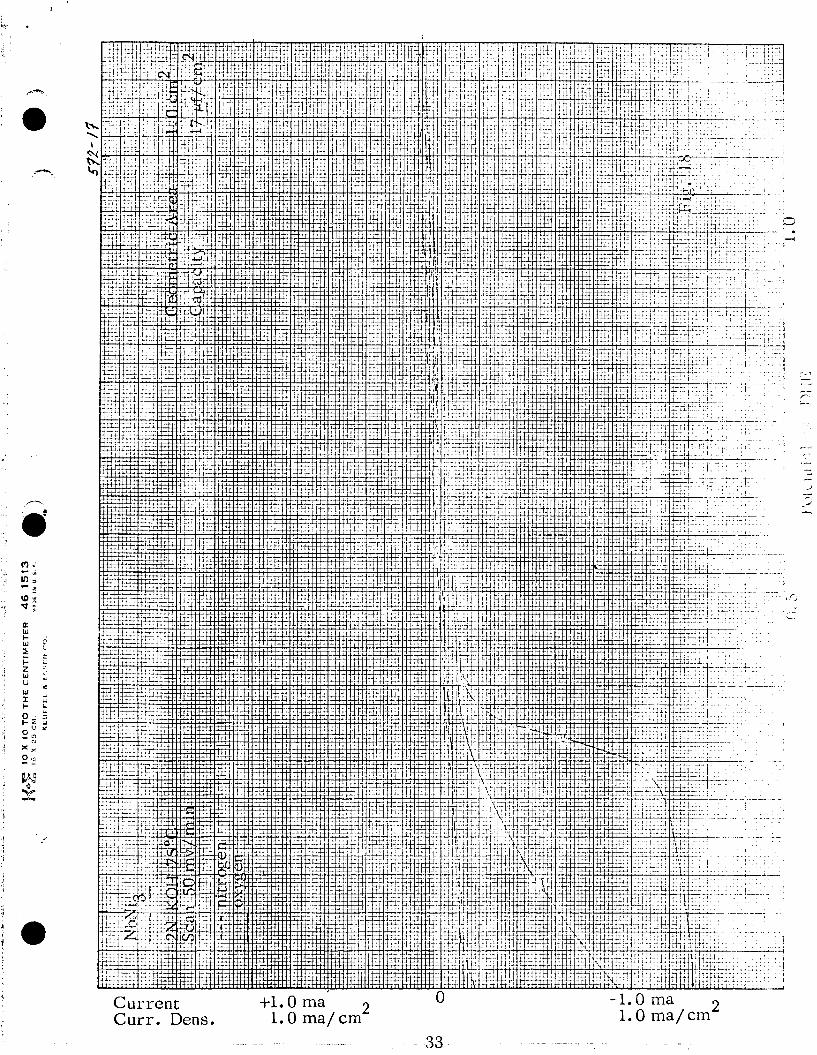
NbNi3 (TiCu3 -type, orthorhombic structure) (Fig. 18): corrosion is very moderate; activity for 02-reduction is very low at potentials higher than 400 mv.
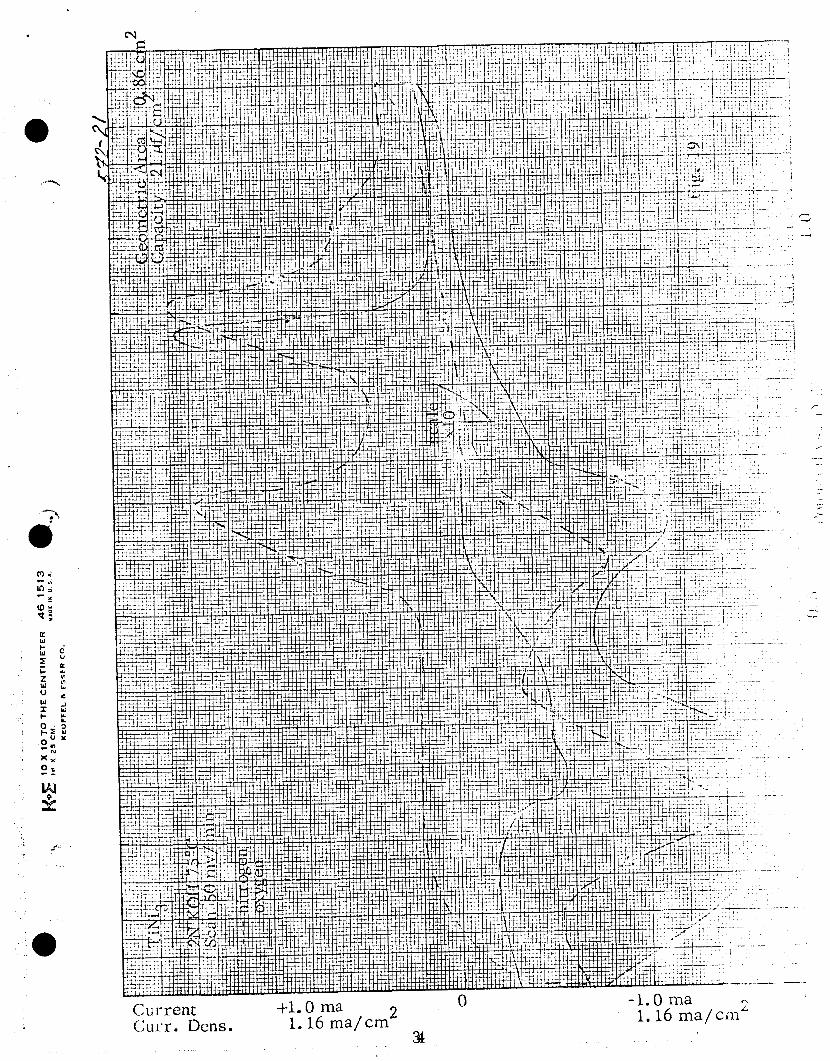
TiNi3 (DO24 structure) (Fig. 19): corrosion is high. There are t w o strong anodic peaks with t w o corresponding cathodic peaks which a re not characteristic for Ni or for Ti. This point should be confirmed, The activity for 02-reduction cannot be estimated due to the large corrosion current.
- AB4 Stoichiometry - TiCr4 (A2 structure) (Solid solution at __I
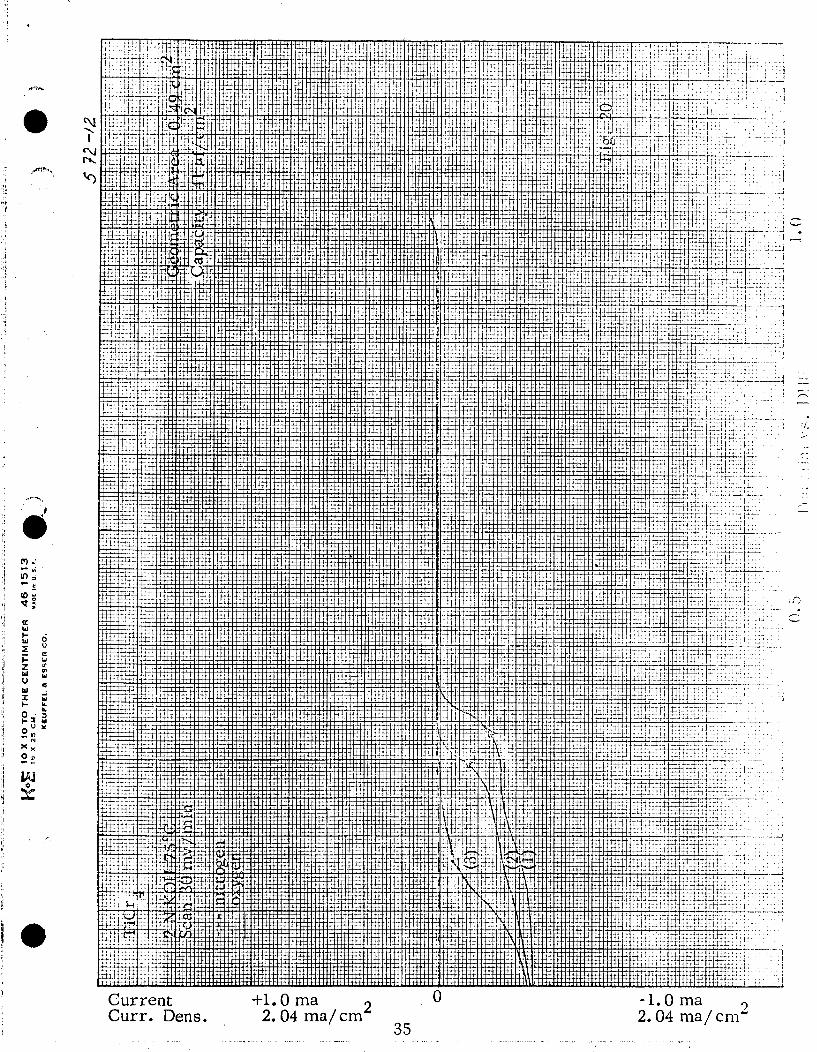
elevated temperature) (Fig. 20): corrosion is low at potentials below 1 volt. Activity for 02-reduction is very low at potentials higher than E = 0.4 volt.
- 42 -
Inters titials
extremely of current
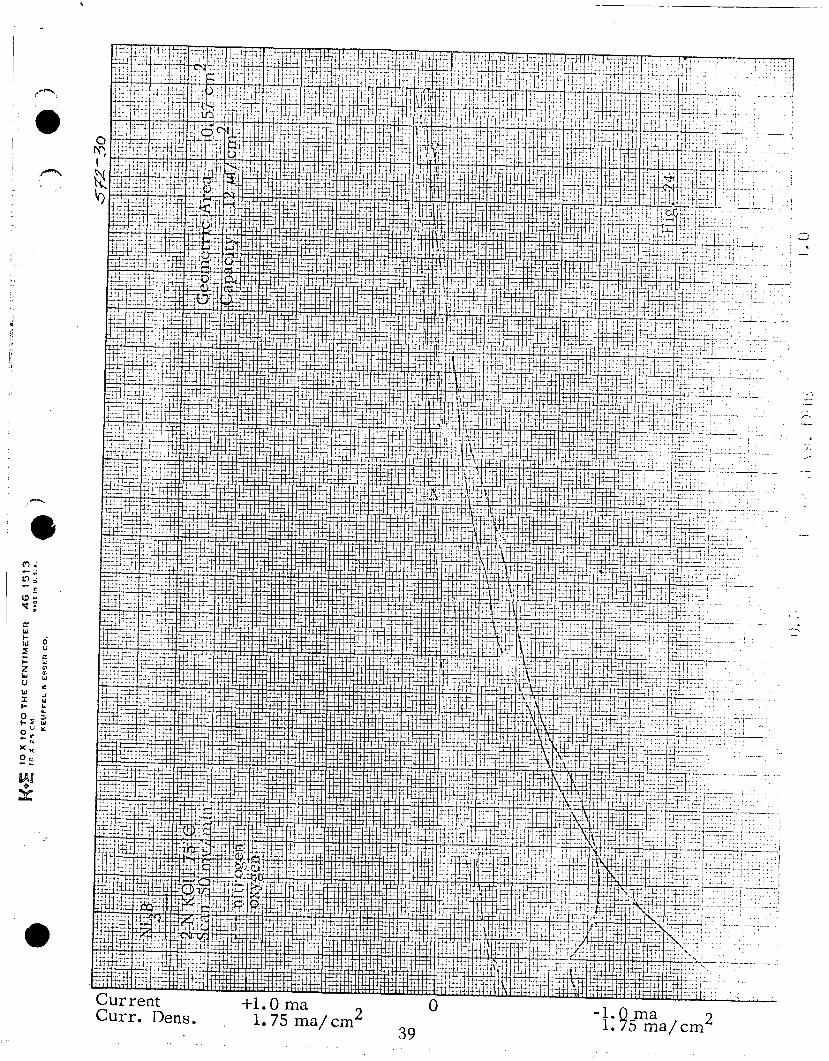
- VVC (Bh structure) (Fig. 21): corrosion is high in potential range of 02-reduction; no sizeable decrease with time is apparent.
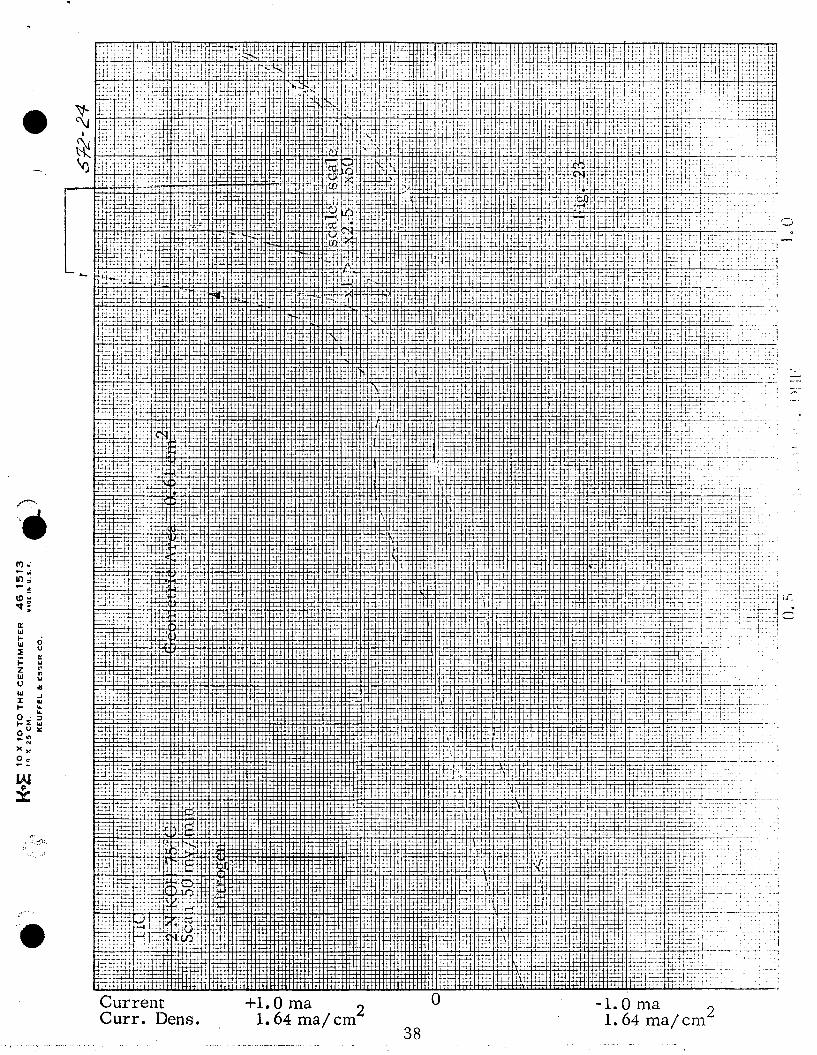
C r C -3-2 (D510 structure) (Fig. 22): corrosion is extremely high in potential range of 02-reduction; no decrease of current observed when keeping potential constant at 900 mv,
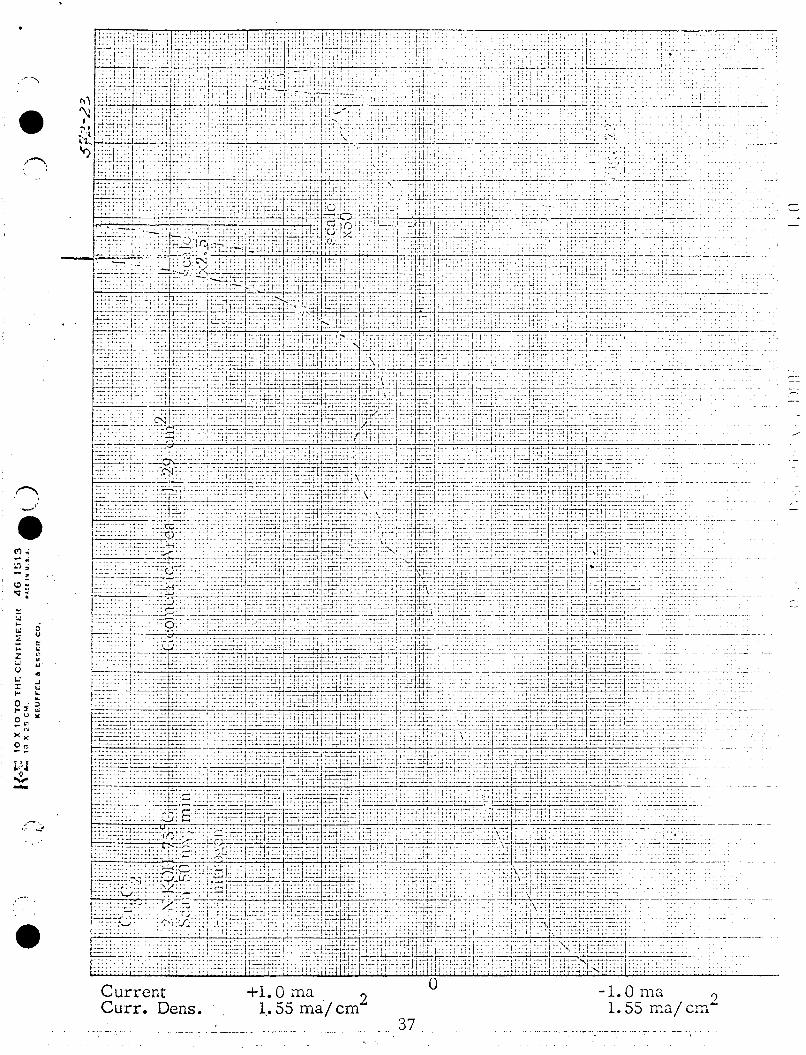
T i c - (B1 structure) (Fig. 23): corrosion is extremely high; no sizeable decrease of current with time is observed.
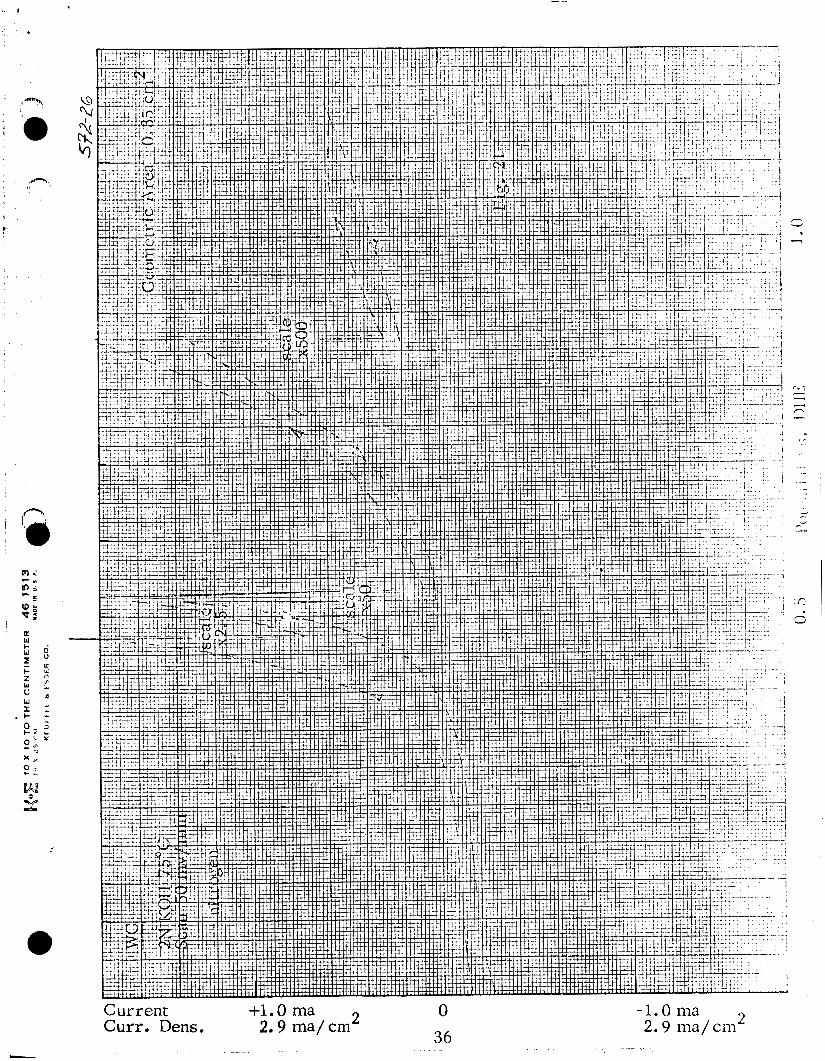
N i B (DOll structure) (Fig., 24): corrosion is -3- moderately high at potentials of Q2-reduction. Activity for oxygen reduction is moderate.
C. Corrosion Studies with Powders - Carbides
A t the beginning of the program the only materials immediately available were various carbides in the form of -325 mesh powders and four alloys also i n the form of -325 mesh powders. These materials were tested for corrosion by a manual potentiostatic method, i. e. the current was measured at controlled potentials from 0 to 1200 mv in a KOH solution saturated with N2” The electrodes were stationary and the r u n s were made i n 35% KOH at 80°C. The powder electrodes were made by mixing the powder with 3lvax trichloroethylene, applying to a nickel screen, and air-drying. This method has the disadvantages that the real surface is difficult to measure in the presence of a binder and that a current corresponding to corrosion can be measured only for particles in contact with both the electrolyte and the nickel screen. The results of these tests are given i n Table 11. In view of the dubious and qualitative nature of the data obtained from these powder electrode techniques, most of the above-mentioned materials will be re - run on the rotating disc electrode system as ingots or hot-pressed powders, and the powder electrode technique w i l l not be used further for corrosion s cr eeni ng .
- 43 -
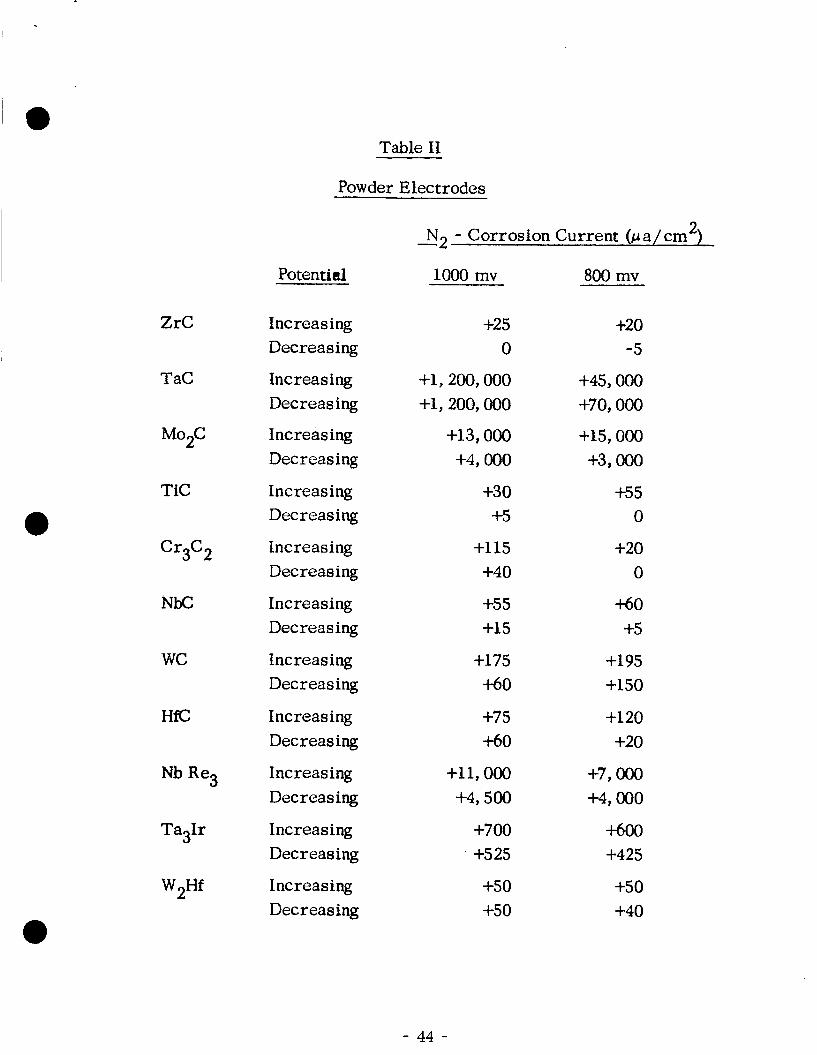
Table I1
Pow der Electrodes
ZrC
TaC
Mo2C
TIC
Cr3C2
NbC
wc
HfC
Nb Re3
Ta31r
W2Hf
Potential
I nc rea s i ng Decreasing
Encreas ing Decreasing
Increasing Decreasing
Increasing Decreasing
Increasing Decreasing
Increasing Decreasing
Increasing Decreasing
Increasing Decreasing
Increasing Decreasing
Increasing Decreasing
Increasing Decreasing
- Corrosion Current (Cca/cm 2) 3 2
1000 mv
+25 0
+1,200,000 +1,200,000
+13,000 +4,000
+30 +5
+115 +40
+s5 +15
+175 +60
+75 +60
+11,000 +4,500
+700 +525
+so +50
800 mv
+20 -5
+45,000 +70, OOO
+15,000 +3,000
+55 0
+20 0
+60 +5
+195 +150
+120 +20
+7, OOO +4,000
+600 +425
+so +40
- 44 -

APPENDIX A
CLASSIFICATION OF .CCrJGfPDUNDS BY STRUCTURE \
. , . I 8 .:, d m . . ~
. I
We wil l consider initialiy a lbys and compounds of the type
T - T
T - B
where T is a transition e l e m m t and B a nontransition element belonging to groups IIA through VIA. In the T - B class w e wi l l con- sider especially beryll ides , borides, carbides, silicides, antimonides, nitrides, phosphides, and oxides. Later on, w e wil l include ternary systems, e. g, boronitrides, nitrocarbides, etc.
1) T - T: Alloys and compounds of the type AxBy a r e con- sidered (note: both A and B a re transition elements, A being to the left of B. V?e follow here the classical terminology at t h e r isk of con- fusion between this B and the B elemcnts above).
Typical Members to Stoichiometry Structure be Examined
A3B " P 0 $I" Ti3Au
V31r
Cr3R
NbgPt
A 2B CuAl 2-type
MoS i2 -type
M O ~ Pt
ZraNi
Ta2Ni
Zr2Pd
Zr2Au
Ti2Cu
- 45 -
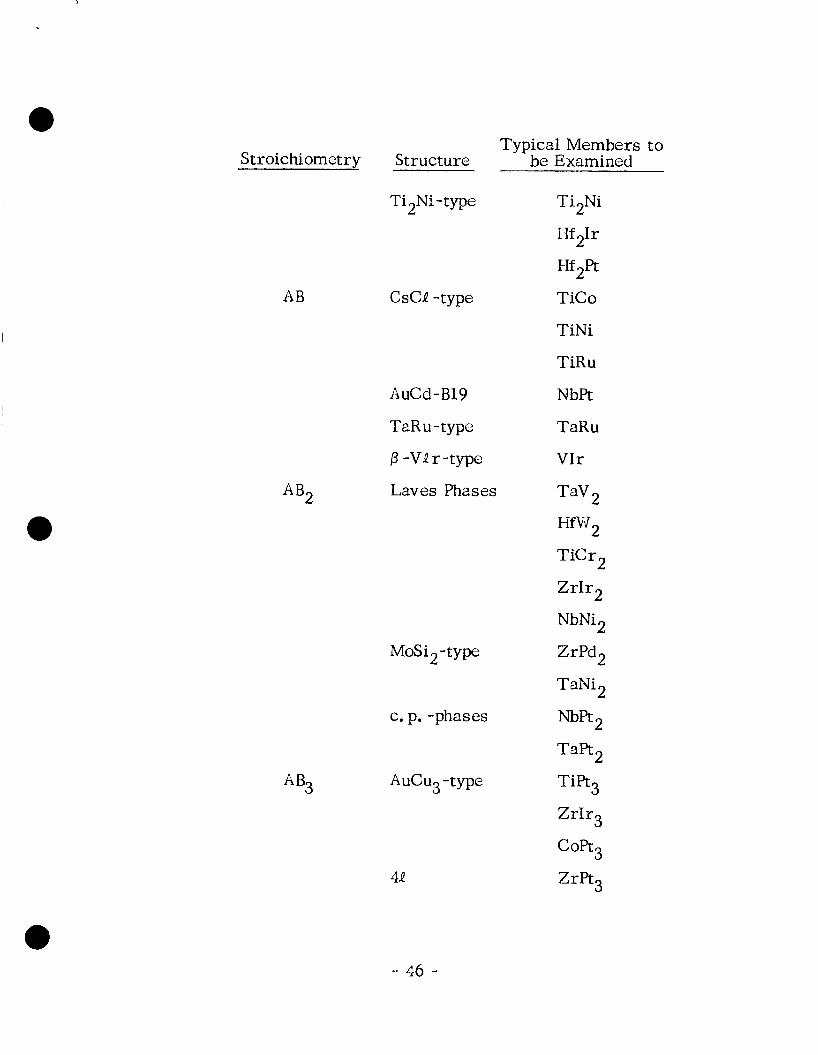
Typical Members to Stroichiometry Structure be Examined
Ti2Ni-type ti2ni Hf21r
A B
Hf2R
CsCl -type TiCo
T i N i
T i R u
A uCd - B19 NbPt
TeRu-type TaRu
/3 -VQr-type VIr
AB2 Laves Phases TaV2
HfW2
t1cr2 zr1r2 nbn12
MoSi2 -type ZrPd2
tan12 c.p. -phases NbR2
TaR2
A B3 AuCu3-type t1r3 ZrIrg
c0pt3 4Q ZrR3
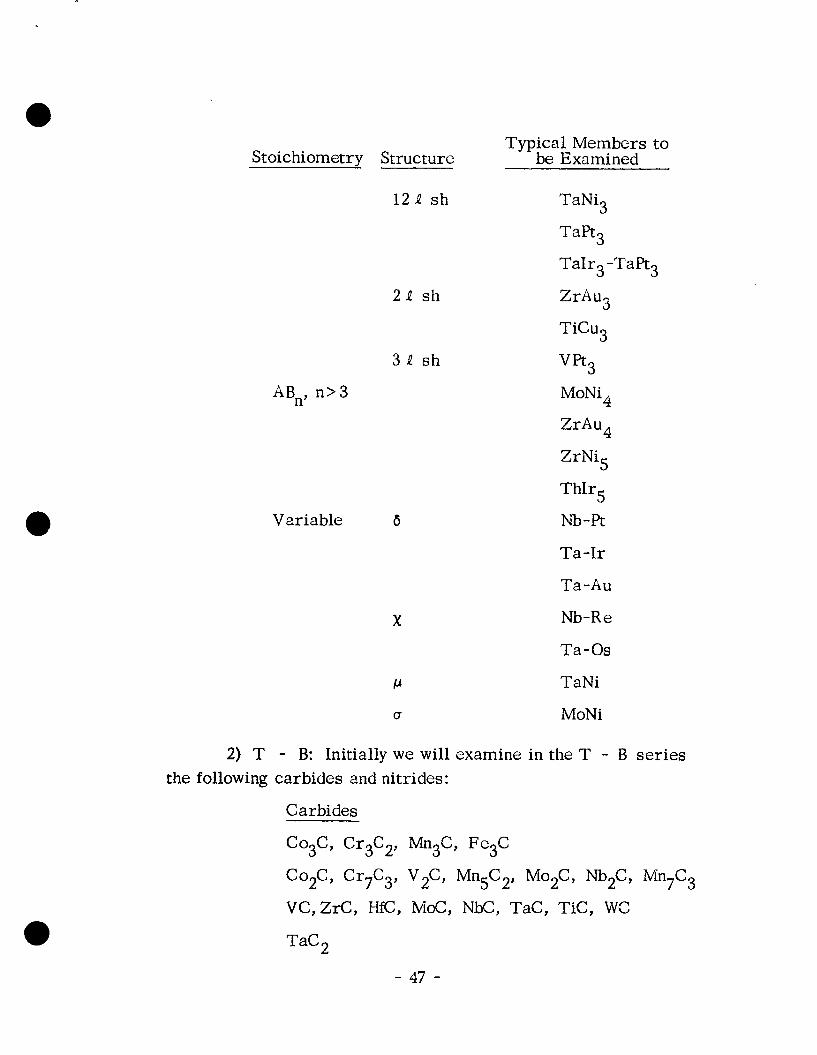
Typical Members to Stoichiometry Structure be Examined
ABn, n > 3
1 2 2 s h TaNi3
TaR3
TaIr3 -TaPt3
2 1 s h ZrAu3
TiCu3
vR3 3 1 s h
MoNi4
ZrAuq
ZrNi5
V e r iable 6
ThIr5
Nb-R
Ta -1r
Ta-Au
X Nb-Re
Ta-Os
IJ TaNi
(5 MoNi
2) T - B: Initially w e wi l l examine i n the T - B series the following carbides and nitrides:
C ar bi des
Co36, Cr3C2, Mn3C, Fe3C
Coz@, Cr7C3, V2C, Mn5C2, Mo2C, NbZC, Mn7C3
VC,ZrC, H E , MoC, NbC, TaC, Tic, WC
TaC2
- 47 -
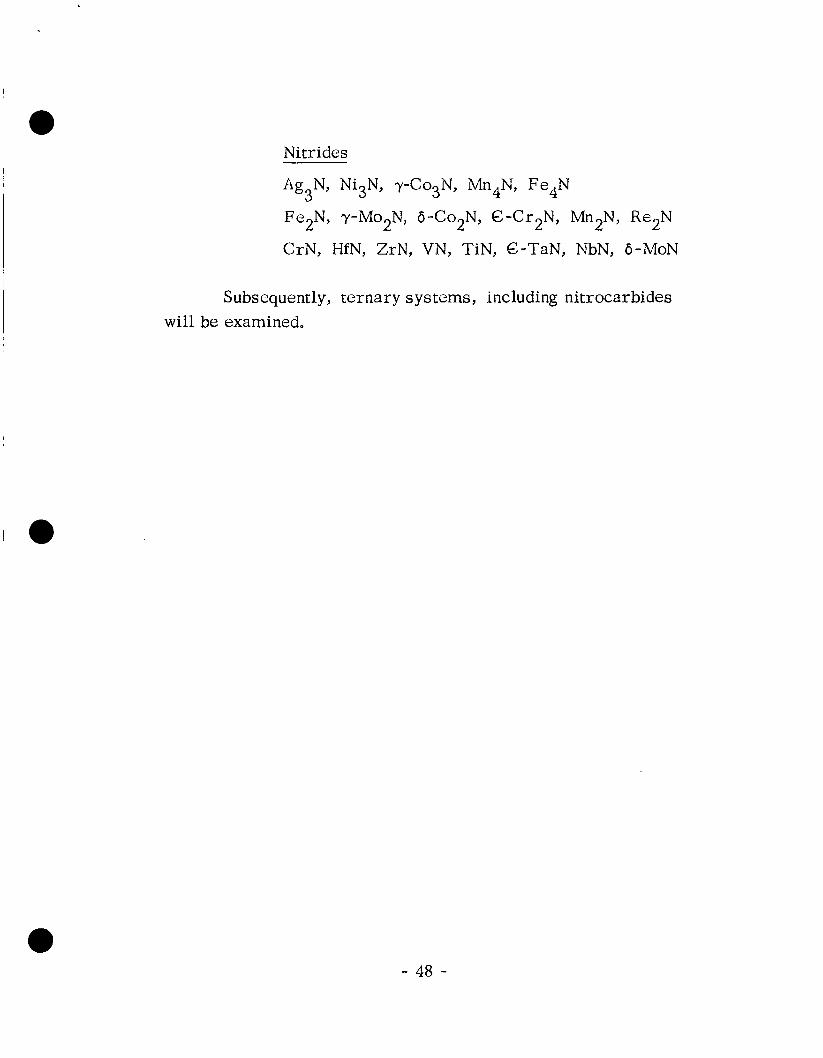
N i t r i d e s
Ag N, Ni3N, r-Co3N, MnqN, F e 4 N
Fe2N, yMo2N, 6-Co2N, 6-Cr2N, Mn2N, Re2N 3
CrN, HfN, ZrN, VN, T i N , 6 - T a N , NbN, 6-MoN
Subsequent ly , t e r n a r y systems, including n i t r o c a r b i d e s w i l l be examined .
- 48 -
APPENDIX B
DETERMNATIQN OF THE DOUBLE LAYER CAPACITY
When the potential of an electrode is varied, a current flows equal to
(CD = double layer capacity) - P dE ic - "D dt
required to charge the double layer. Accordingly, i f a triangular wave dE dt applied to a working electrode which behaves as a pure condenser (io e. without faradaic current or ohmic resistance), a current square- wave results. The peak-to-peak amplitude of this square wave is equal to ic = 2 cy CD, i. e, proportional to the double layer capacity and therefore to the real surface,, A convenient way of using th is method is to apply the triangular wave, superimposed on a dc-voltage (selected to avoid faradaic current) to the reference input of 2 poten- tiostat. The resulting current wave can be recorded by using the y-input of an x-y oscilloscope for the current wave and the x-input for the triangular voltage wave. The resulting oscilloscopic trace is , i n the case of a perfect condenser, a rectangular current-voltage box. This method is subject to similar limitations as the ac methods, Its main advantage is that from the form of the i(t) curve (or i(E) box) the validity of the assumption that the electrode behaves as a pure condenser can be verified and conditions to reduce the deviations from this assumption can be more easily found than when working with sinusoidal ac. In the following examples, conditions have been selected i n which the effect of faradaic currents and ohmic resistances can be easily calculated and corrected.
= cy E constant) of small peak-to-peak amplitude (< 100 mv) is - -
- 49 -
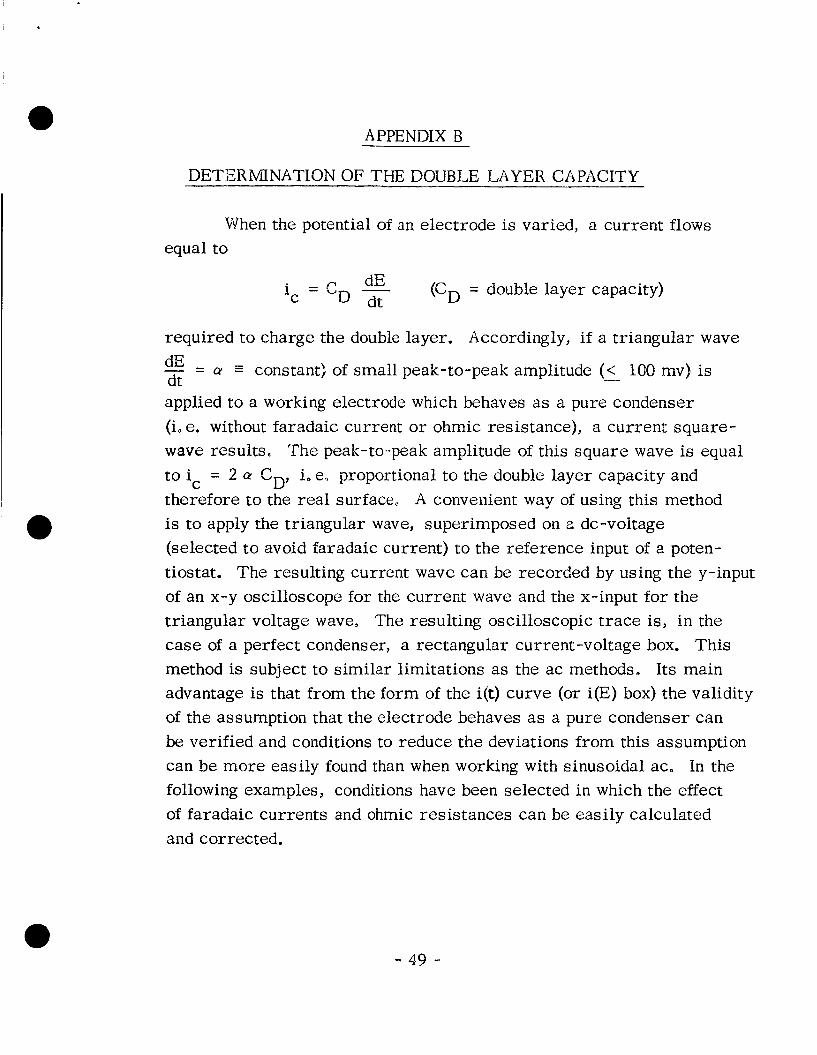
Case 1: ‘Ohmic resistance in series with the condenser -
E = X1 + E2
= a dE - dt
iR = E 2
Differentiating Eq. (1) and substituting i n the resulting differential equation one obtains:
CY - - = o di i - +- dt RC C
This linear differential equation can be easily integrated to give:
t RC
i = Ccu + kexp - - .
In the case of a single lincar pulse at t = 3, i = 0 and
t RC
i = Ca, (I - exp ----).
The current wil l change as a function of time (voltage) and become equal to the capacity current when exp - - << 1 Obviously by keeping RC s.mal1 the time necessary to measure the pure capacity current wi l l become smaller.
RC
- 50 -
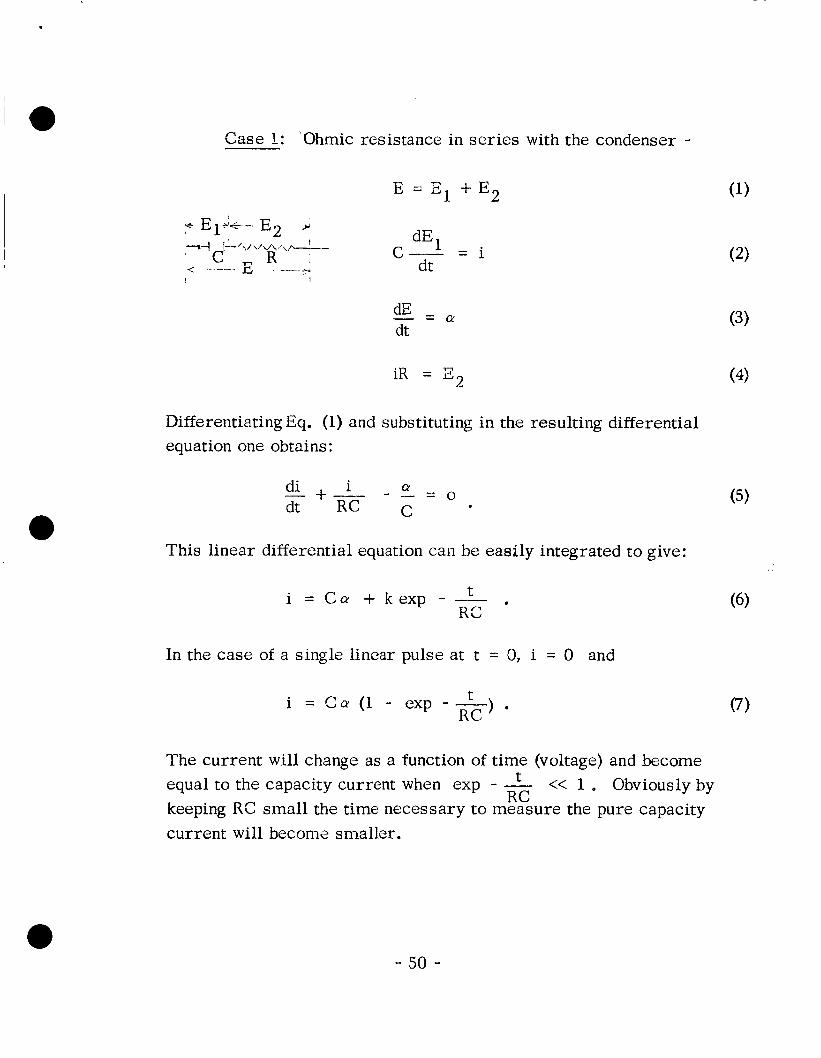
Case 2: Ohmic resistance in parallel to the condenser
7-7 c i z - K . -
Substituting in Eq. (8) gives:
E i = C c u + - i R
(for the increasing potential sweep)
E = -ccu + - or
id R
(for the decreasing potential sweep) or
A i = i - id = 2 C a 0 i
This case is unusual in electrochemistry.
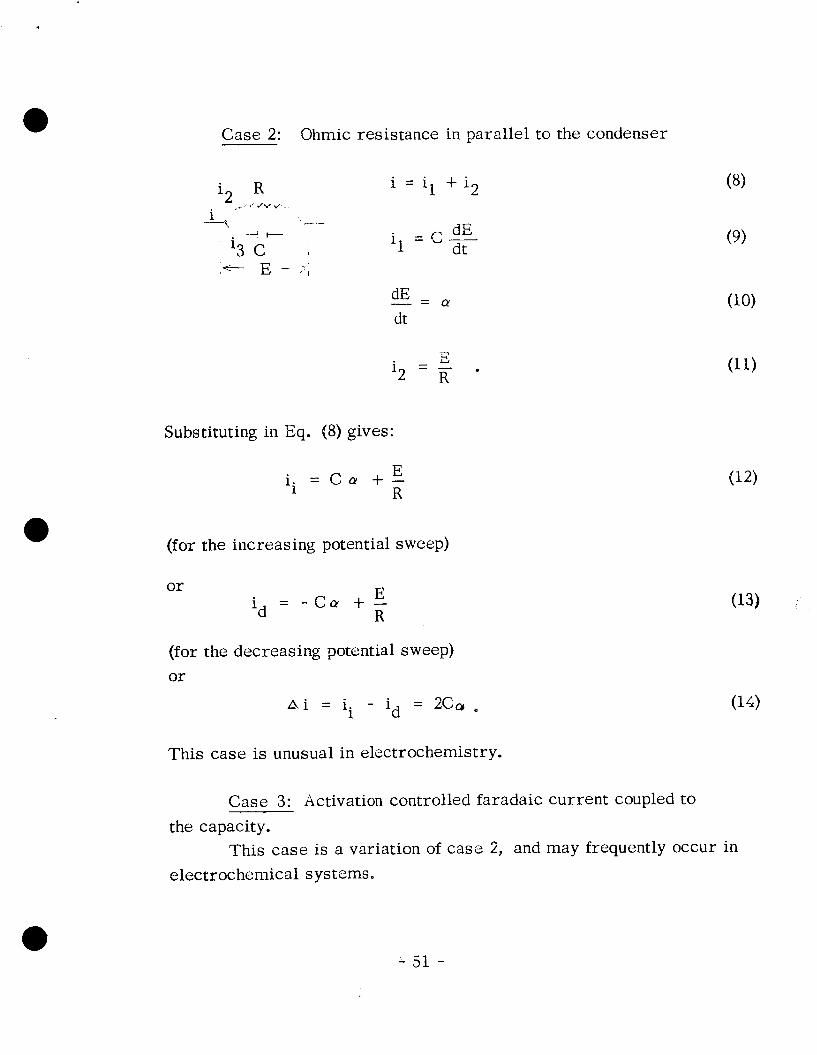
Case 3: Activation controlled faradaic current coupled to the capacity.
electrochemical sys tems e
This case is a variation of case 2, and may frequently occur in
- 51 -
Similarly to case 2, one obtains:
CY nFE R T
ii = C a + i o exp
c
(for the increasing potential sweep) and
CY nFE R T
id = Ccu + i o e x p
(for the decreasing potential sweep)
or
i. e. if the method is used under these conditions, from the difference between increasing and decreasing sweep, GD can be found. By varying a these conditions can be confirmed.
impedance is a combination of capacity and resistance which changes with time, Although the problem can be solved by integration of Fick’ s second law, its solution is outside the scope of this presentation. Only in the region of the limiting current is the determination of CD possible without using involved calculations, as shown i n the following:
If diffusion polarization is present, the resulting diffusion
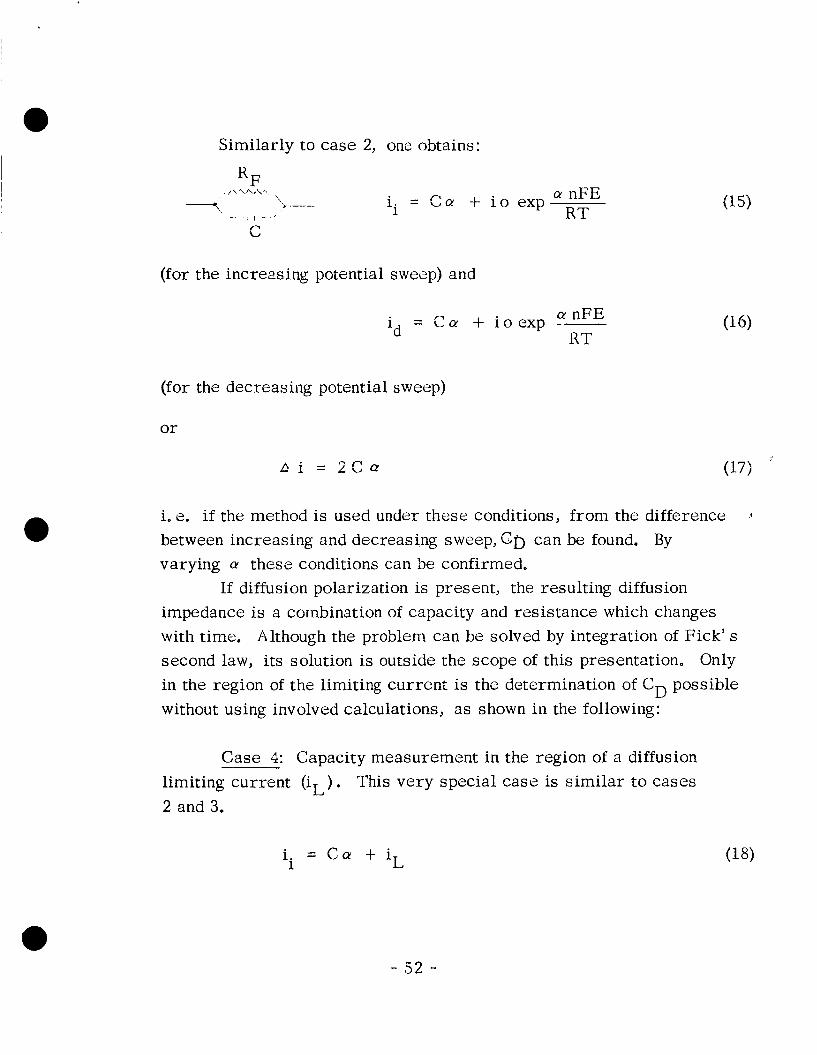
Case 4: Capacity measurement in the region of a diffusion limiting current (iL). This v e r y special case is similar to cases 2 and 3.
i = C a + i L i
- 52 -

Similarly to case 2, one obtains:
R, a nFE
R T ii = C a + i o exp
C
(for the increasing potential sweep) and
a nFE R T
id = C a + i o e x p
(for the decreasing potential sweep)
or
i. e. if the method is used under these conditions, from the difference between increasing and decreasing sweep, GD can be found. By varying a these conditions can be confirmed.
impedance is a combination of capacity and resistance which changes with time, Although the problem can be solved by integration of Fick' s second law, its solution is outside the scope of this presentation. Only i n the region of the limiting current is the determination of CD possible without using involved calculations, as shown i n the following:
If diffusion polarization is present, the resulting diffusion
Case 4: Capacity measurement in the region of a diffusion limiting current (i,) . This very special case is similar to cases 2 and 3.
i = C a + i L i
- 52 -
and
id = -Ccu + iL
or
A i = ii - id = 2ccu e
In addition to these s imple cases, there a r e many combinaions of faradaic and ohmic resistances. Therefore, measurements will be made preferably i n the absence of faradaic current, minimizing ohmic resistances. When faradaic currents a r e unavoidable, regions of pure activation control or of diffusion limiting current will be selected,
- 53 -