Embed Size (px)
Citation preview

GPRA Modernization:Finding and Using Your Compass
Telling Your Story: Using Measures to Spotlight Problems and Find Solutions

Jon DesenbergPolicy Director
The Performance Institute
805 15th Street NW, Third Floor
Washington, DC 20005
Phone: 202-739-9642
www.PerformanceInstitute.org


GPRA Modernization: But what are we measuring and why?

GPRA Modernization “The biggest little bill no one has ever
heard of."
• "When you measure everything, you often end up measuring nothing“
• “There’s a difference this time.”• “Money may need to move from
additional services to evaluation.”• "If we implement this the right way,
this will go down as one of the more significant acts of this Congress,"

Page 7
20 Years of Progress An Underappreciated Success Story:
Stronger Planning – Measureable Results At Multiple Levels
Efficiency, Process, and Talent Indicators to demonstrate future success
Leadership Commitment to the power of Evaluation, Reporting and Transparency
A growing Federal capability to develop and validate performance information
Alignment to the program and Senior Executive level
More frequent and more accurate reporting

Are we missing the Big Picture?• Programs and organizations operating, measuring and reporting progress
in isolation
• GPRA plans and reports often contained little information on how agencies work with others to accomplish goals that cut across organizational lines.
• Cross-Programmatic Outcomes are often difficult to determine and measure due to the original legislation and policies.
• Congressional Fiefdoms and appropriations exacerbate many of these issues.
.

How Is it possible to legislate better management and decision-making?
• Is it possible to legislate better management and decision-making?
• Compliance Reporting often leads to Low Level Activity Measures– How will we avoid “Check The Box” Style Reporting?
• Does the creation of a COO add another layer to management?– Will the absence of CFO direction work against budget-
performance integration?
• Can data and performance information be effectively used to guide decision making with political leadership?

GPRAMA Adds Governmentwide Planning and Reporting Requirements
• The Act creates a new governmentwide framework including
– long-term federal government priority goals
– revised federal government performance plan requirements
– quarterly priority progress reviews
– a governmentwide performance website
Federal High Priority Goals:Will they impact you?
• Long-term goals for the federal government covering
– select crosscutting policy areas
– management improvements needed government wide
• Developed every 4 years, beginning in a President’s 2nd year
• Informed by consultations with Congress at least every 2 years
• May be adjusted due to significant changes in the environment

The Quote of The Year
“My Boss really just wants us to start measuring something, but he doesn’t believe in Strategic Planning, he says it’s a waste of time.”
• Have you heard something like this?
• Why is this an issue?
Are We Measuring the Right Things?
Congress and OMB Push on Measuring “The Difficult Areas”
• Intelligence, Defense, and Infrastructure
• Evaluating Social and Fiscal Programs
• Prevention Indicators
• Science and Technology

8 Critical Success Factors for Effective Performance Management Systems
1. Defining and Aligning to Enterprise Strategy
2. Developing Meaningful Performance Measures
3. Increasing Data Availability
4. Maximizing Data Integrity
5. Enhancing Performance Reporting
6. Improving Evaluation and Analysis
7. Achieving Performance Integration
8. Driving Decision-Making
Performance, Transparency and Value
• How much is the government delivering and at what value?
• If we cant identify our value, the taxpayer only can see costs.
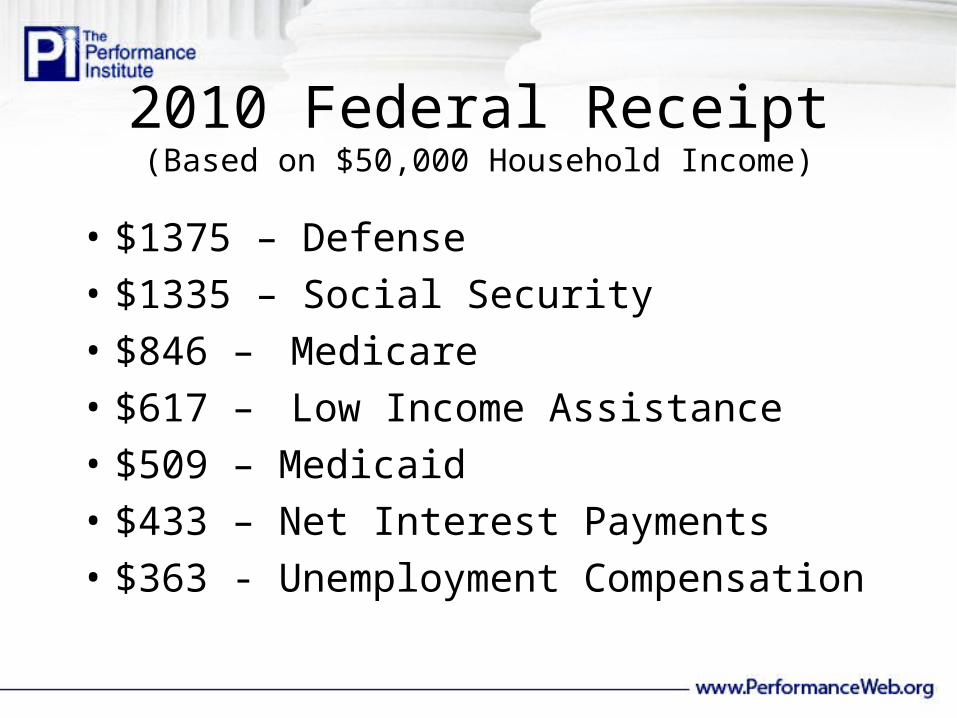
2010 Federal Receipt(Based on $50,000 Household Income)
• $1375 – Defense
• $1335 – Social Security
• $846 – Medicare
• $617 – Low Income Assistance
• $509 – Medicaid
• $433 – Net Interest Payments
• $363 - Unemployment Compensation

Performance Management:Have We Forgotten “Why?”
• Do the same problems still need our attention? And what are their causes?
• Is the strategy effective? – Can it be replicated?– Can we speed adoption?– Avoiding Duplication is critical
• Can we improve real communication?– To the White House, Congress and
(even) appropriators– State, Local, Non-profit and other
partners

Charting Progress, Building Visions, Improving Life
International Focus on Better Indicators

Did your last planning process build on transparency to improve results?
Did your last strategic plan and planning process give you insight into a wide range of opinions on your current and future risks, strengths and opportunities ?
What was done with citizen input ?
Was there a structured process to present strategies, measures and results for the entire community?

I skate to where I think the puck will beWayne Gretzky
Transparency underscores the dynamic nature of planning and measuring
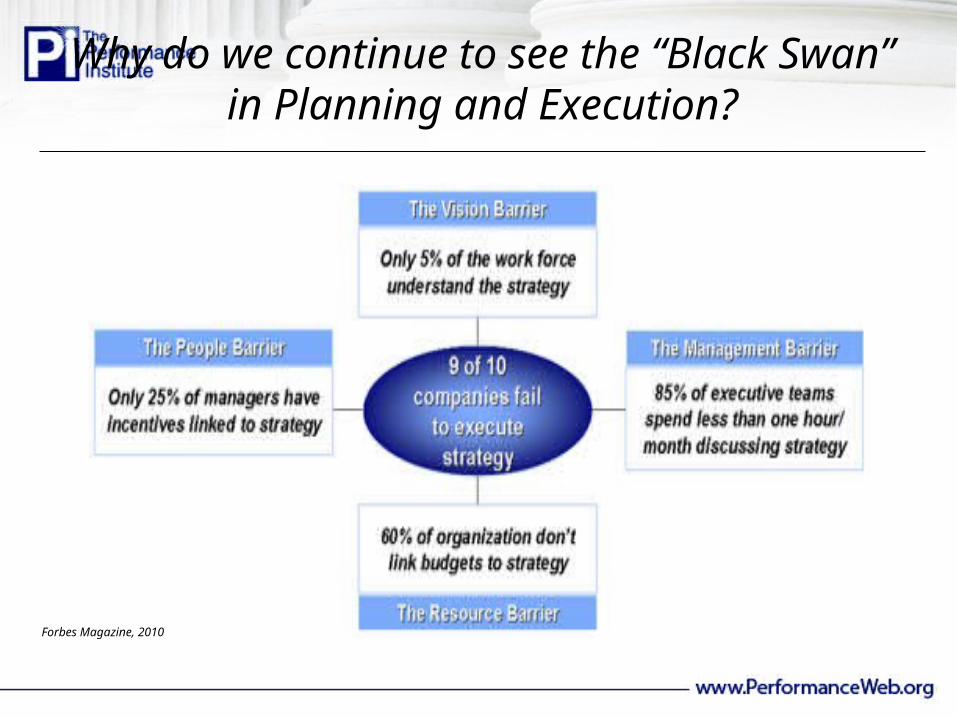
Why do we continue to see the “Black Swan” in Planning and Execution?
Forbes Magazine, 2010
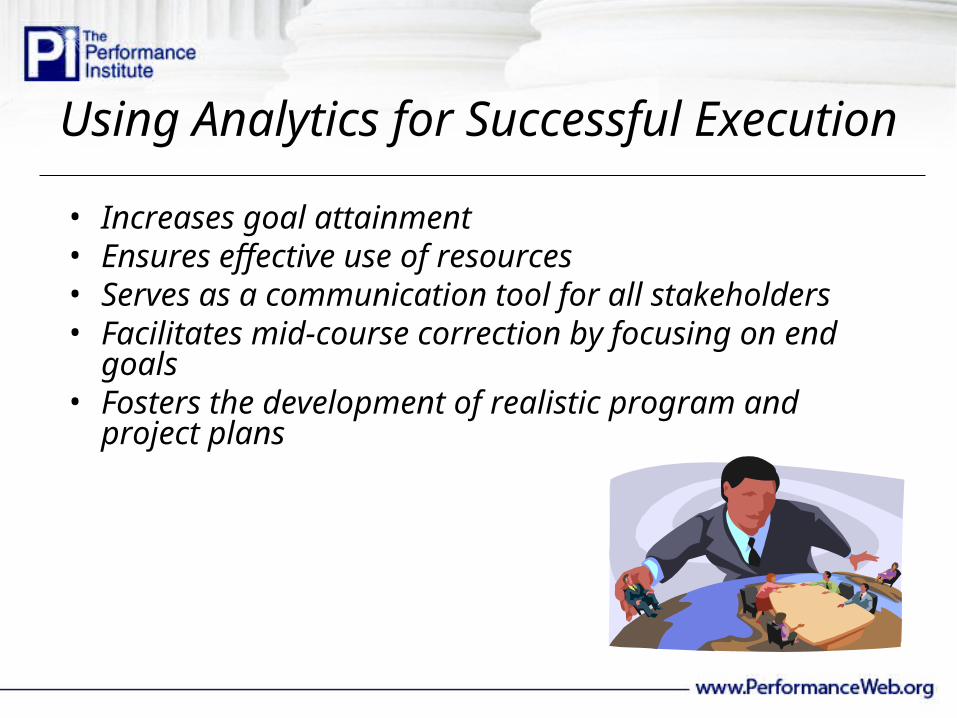
Using Analytics for Successful Execution
• Increases goal attainment• Ensures effective use of resources• Serves as a communication tool for all stakeholders• Facilitates mid-course correction by focusing on end goals• Fosters the development of realistic program and project
plans

Creating the “Not-To-Do” List is critical for Realistic Citizen Engagement
• Tabling the ineffective activities or programs• Developing new programs • Altering organizational structure• Reallocating resources to critical areas• Rethinking required employee skill sets• Adopting new data collection and
management tools

Setting Strategies only with real input
Identify Products &
Services
Identify Products &
Services
Determine Key Customers
Determine Key Customers
Set GoalsSet Goals
SWOTSWOT
Develop a Vision
Develop a Vision
Checking the Mission
Statement
Checking the Mission
Statement
Set StrategiesSet Strategies
Identify Performance
Measures
Identify Performance
Measures
Set TargetsSet Targets
Develop Initiatives
Develop Initiatives
CHECK-IN Evaluate the PlanCHECK-IN Evaluate the Plan
Where you are Your destination Road to get there
Establish Organizational
Core Values
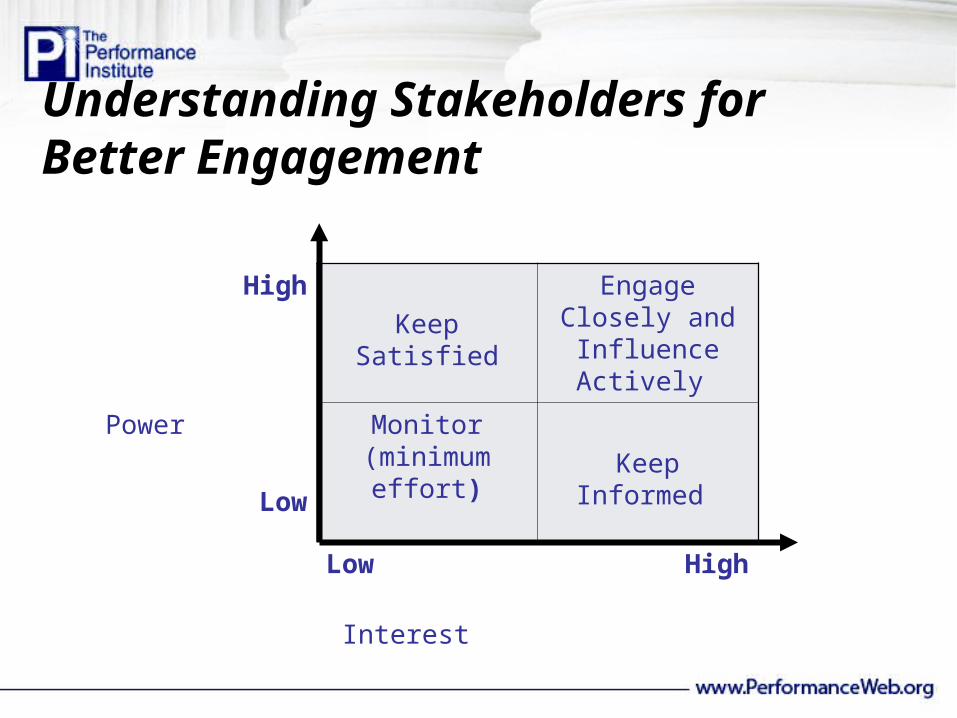
High
Keep SatisfiedEngage Closely and Influence Actively
Power
Low
Monitor (minimum effort) Keep Informed
Low Interest
High
Understanding Stakeholders for Better Engagement

Using the Center of Gravity to set priorities and develop better measures
1. What attitude, behavior or condition needs to change to achieve the outcome goals? (Target)
2. Identify who possesses the critical capability to cause the change or achieve the end outcomes. What must they do? (Who & What?)
3. How can you get them to do that? (How?)

Staff
Money
Partners
Develop parent ed curriculum
Deliver series of interactivesessions
A: Parents increase knowledge of child develop.
A: Parents better understanding their own parenting style
B: Parents use effective parenting practices
C: Improved child-parent relations
Research
INPUTS OUTPUTS OUTCOMES
Facilitate support groups
A: Parents gain skills in effective parenting practices
Emphasizing the Center of GravityEmphasizing the Center of Gravity
B: Parents identify appropriate actions to take
C: Strong families
Targetedparentsattend
SITUATION: During a county needs assessment, majority of parents reported that they were having difficulty parenting and felt stressed as a result

Inputs Activities Outputs End Outcomes
Most logic models incorporate the following elements.
Intermediate Outcomes
Attitudes Behaviors Conditions
WHY?
HOW
EFFECT
CONTROL
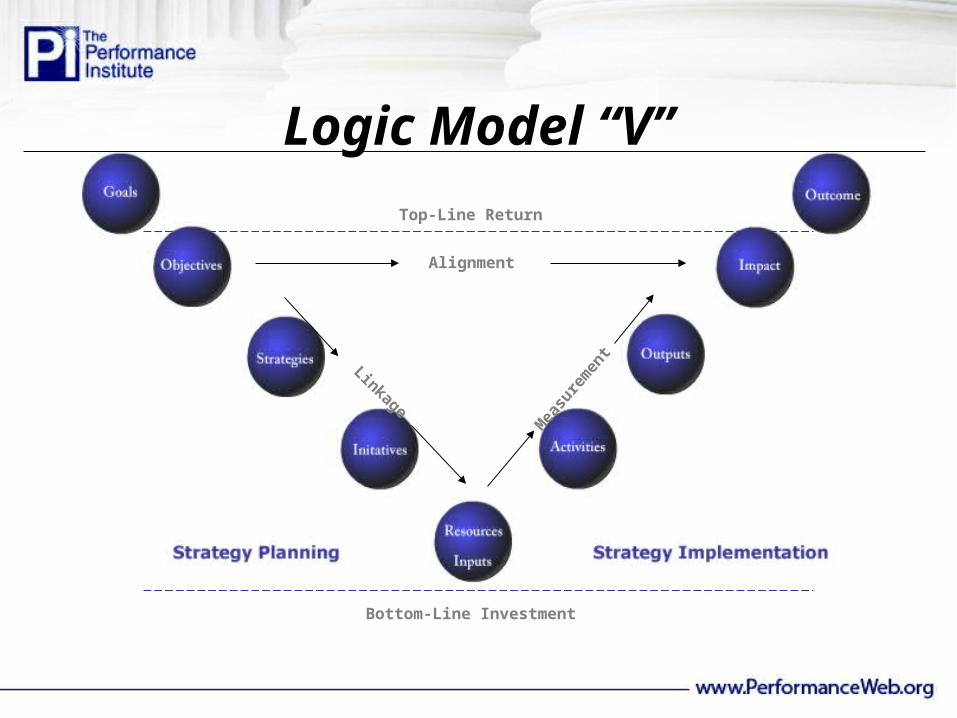
Logic Model “V”
Bottom-Line Investment
Top-Line Return
Alignment
Linkage
Mea
sure
men
t
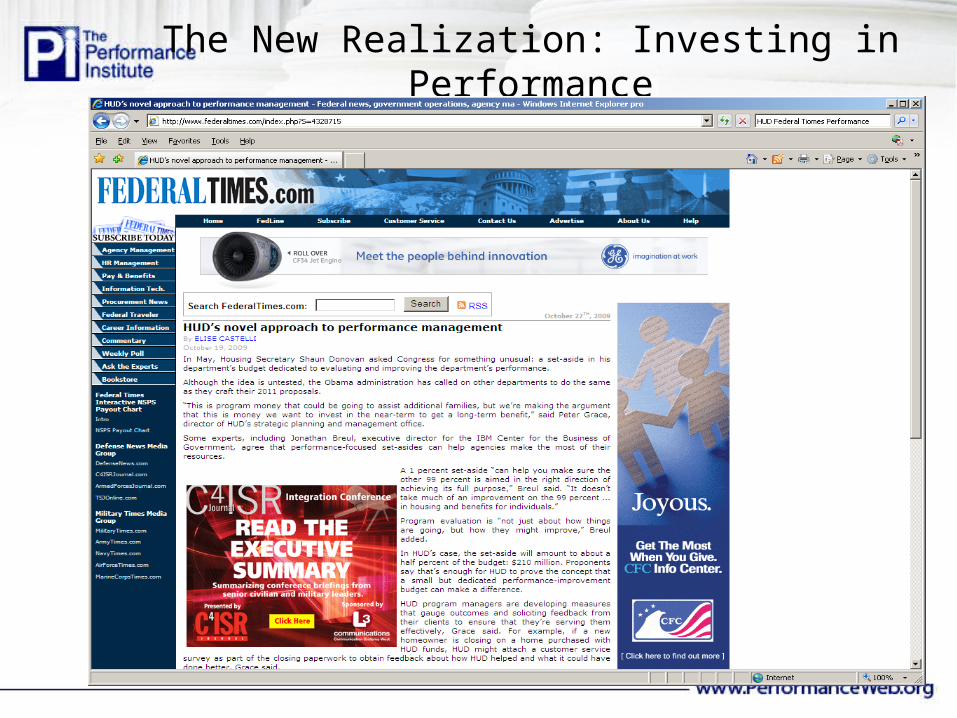
The New Realization: Investing in Performance
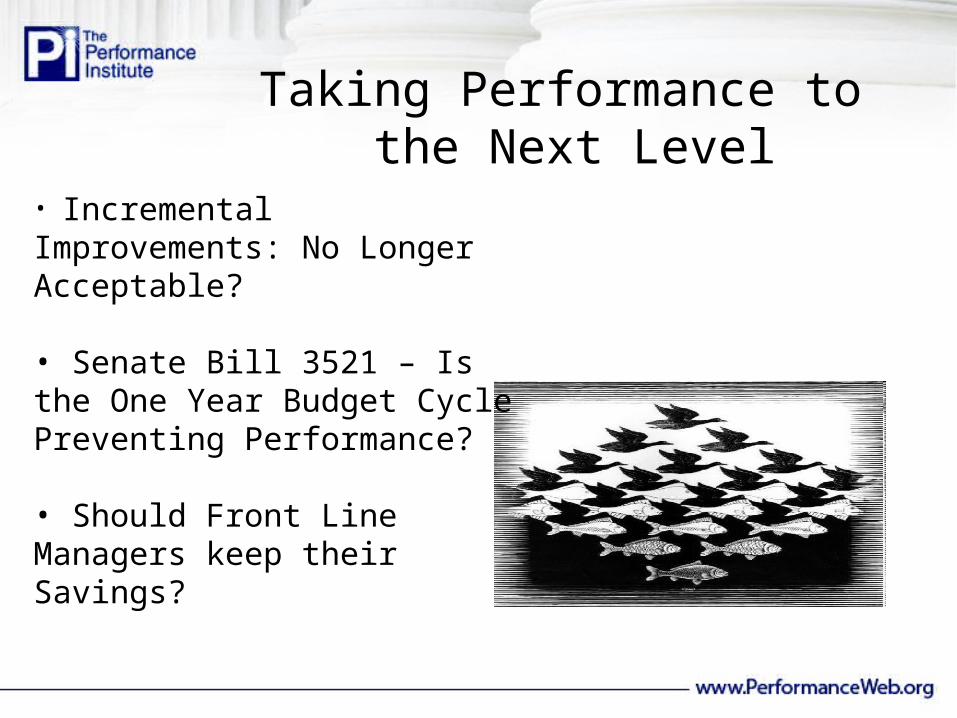
Taking Performance to the Next Level
• Incremental Improvements: No Longer Acceptable?
• Senate Bill 3521 – Is the One Year Budget Cycle Preventing Performance?
• Should Front Line Managers keep their Savings?

Views from The Hill
• “The Information is buried in thousands of p ages that we end up throwing out.”
• “I pick up the phone and call GAO, PART is political.”
• “They act as if we appropriate by goals. We want information by program area.”
• The Administration redesigned the budget process so that we couldn’t find
core information.”


Most organizations do some sort of target setting with some regularity
Many organizations limit their efforts to targeting a period-on-period improvement
Target Setting for Greater Transparency

Industry averages versus internal insight
> Averages are, well, average; facts are better
> External benchmarks may be incompatible with internal goals
Making Benchmarks Matter to the Citizen

Citizen experience considerations
> Studies correlate the citizens experience with behavior (e.g., loyalty, understanding, trust)
> Citizen expectations can guide benchmarks
Rethink Benchmarking

Budgets are tight
> Spending smarter is an imperative
> Avoid over spending—andunder spending in the wrong areas
Satisfaction guides spending
> Customer satisfaction data can helpset accurate targets
> Get maximum gains for minimal investments
Spend Right
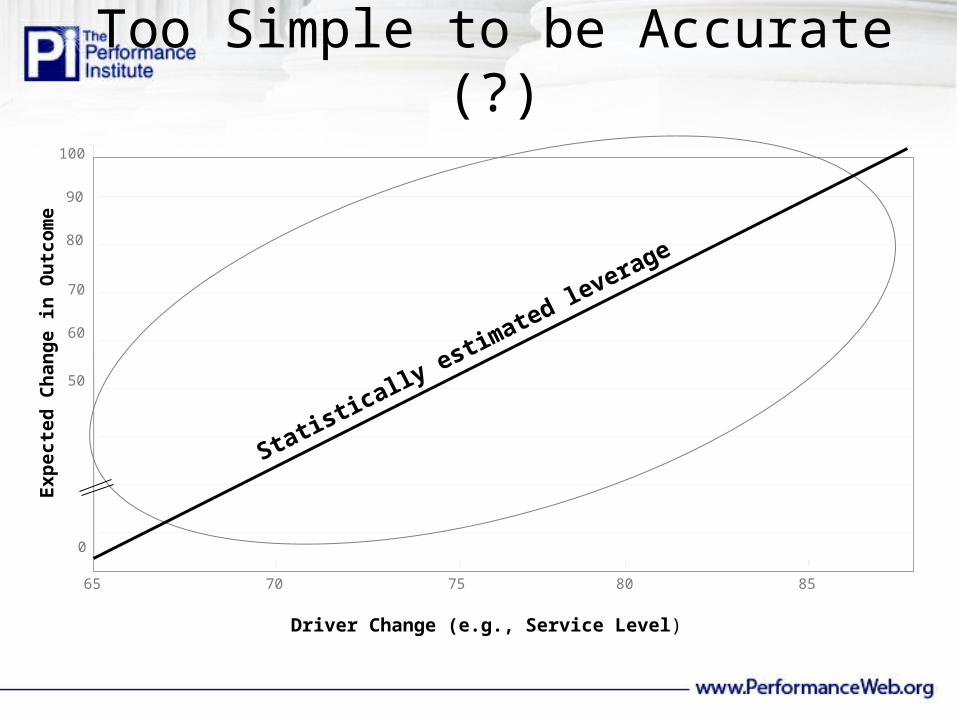
65 70 75 80 85
Driver Change (e.g., Service Level)
Exp
ecte
d C
han
ge
in O
utc
om
e
Statistically estimated leverage
100
90
80
70
60
50
0
Too Simple to be Accurate (?)

65 70 75 80 85
Driver Change (e.g., Service Level)
Exp
ecte
d C
han
ge
in O
utc
om
e
Statistically estimated leverage
100
90
80
70
60
50
0
Too Simple to be Accurate (?)
Complex situations create
opportunities to… over invest or under invest
When is Enough Really Enough?
Negative outcomeso Wasted resourceso Lost opportunity, credibilityo Failure to achieve organizational mission

6.6%
Revised Target
7.1%
6 7 8 9 10 11 12 13 14
% Calls Abandoned while in Queue at Call Center
Ch
ang
e i
n S
atis
fact
ion
Qualitative “best practice” indicated 5% was a good target.
3 4 5
9.77%
CurrentOriginal Target
5.0%
Optimizing Contact Center Metrics

Based on a series of analyses of this type, the agency determined it could drive taxpayer satisfaction and loyalty while:
• Avoiding investment in a new facility
• Improving its contact center performance (to the empirically-determined level) with less capital-intensive investment
• Re-directing the majority of resources from investment in new facilities to other initiatives (i.e., less money spent on call centers and more spent addressing the underlying problems causing taxpayer dissatisfaction)

Multiple Interpretations: What does this say?
0
0.2
0.4
0.6
0.8
1
1.2
2:00 2:15 2:29 2:44 2:58 3:12 3:27 3:41 3:56Tran
sact
iona
l Sat
isfa
ctio
n
Average Talk Time (Minutes:Seconds)
Aggregate Level Results
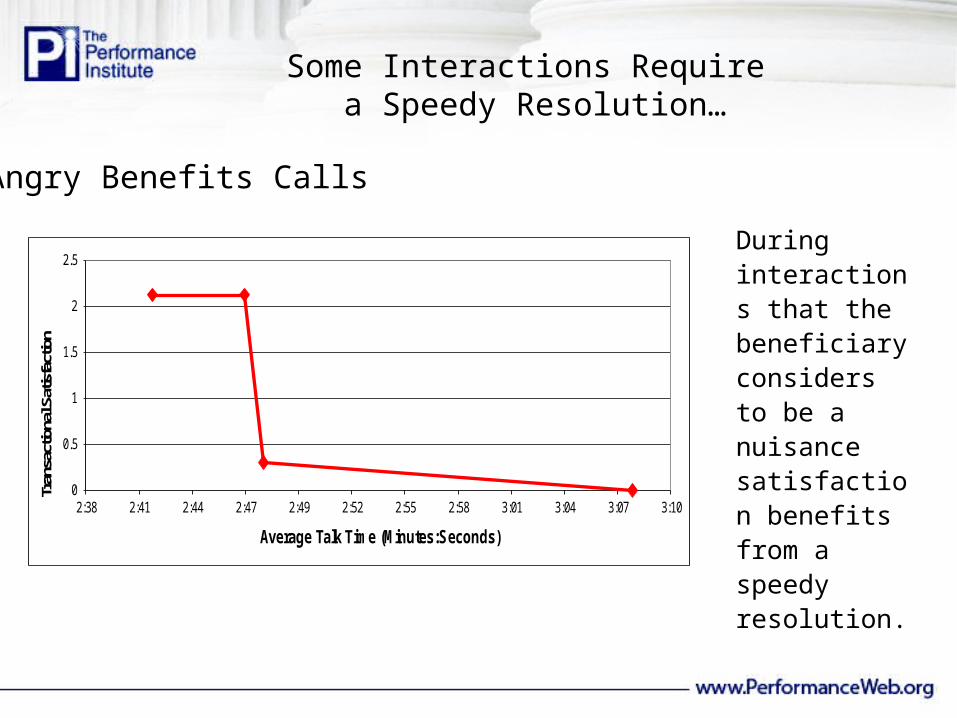
During interactions that the beneficiary considers to be a nuisance satisfaction benefits from a speedy resolution.
Some Interactions Require a Speedy Resolution…
0
0.5
1
1.5
2
2.5
2:38 2:41 2:44 2:47 2:49 2:52 2:55 2:58 3:01 3:04 3:07 3:10
Tran
sact
iona
l Sat
isfa
ctio
n
Average Talk Time (Minutes:Seconds)
Angry Benefits Calls

For certain types of calls, however, citizens expect to spend a certain amount of time to properly address the issue.
These calls also tend to be more complex and inherently longer.
Cutting the call off early leaves the citizen feeling short changed and as if their issue wasn’t taken seriously.
…While Others Need More Care
0
0.1
0.2
0.3
0.4
0.5
0.6
0.7
0.8
3:28 3:36 3:43 3:50 3:57Tra
ns
ac
tio
na
l S
ati
sfa
cti
on
Average Talk Time (Minutes:Seconds)
Desperate Beneficiary Requests

Identified variable performance targets
• Understood that a “one-size-fits-all” approach would not meet citizens’ needs
• Educated staff on proper handling of varied citizen requirements
Opportunity to improve the agency’s image through greater trust and positive word-of-mouth
Results

The New model: The Spread of “stat” Management and Predictive Analytics
• Baltimore
• Philadelphia
• DC
• LA
• New Orleans
• Most Major Cities by 2004
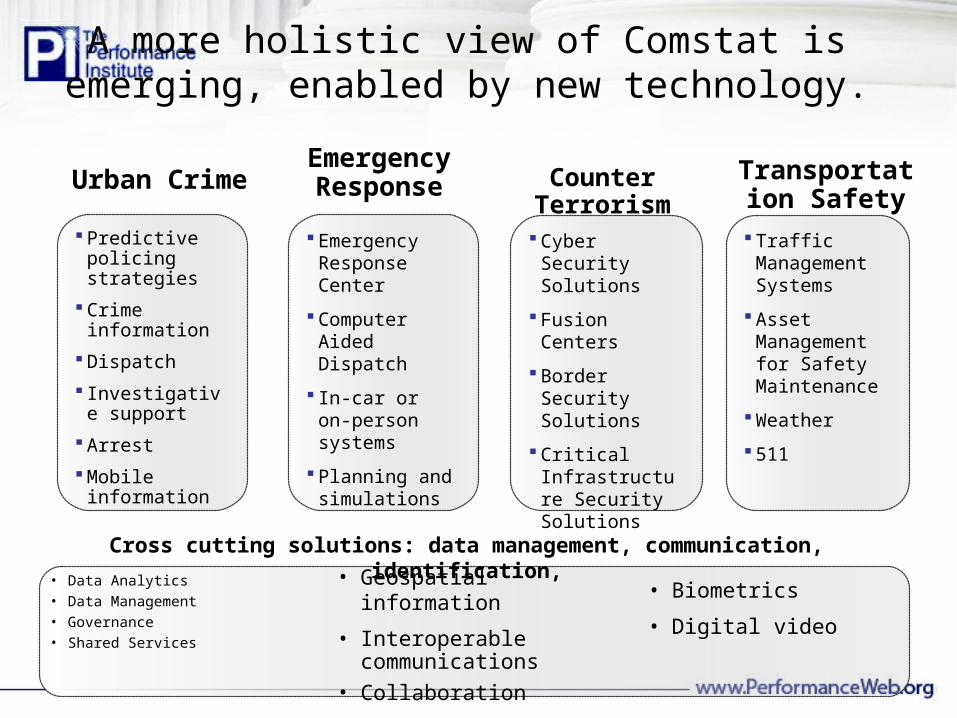
Urban Crime
A more holistic view of Comstat is emerging, enabled by new technology.
Predictive policing strategies
Crime information
Dispatch
Investigative support
Arrest
Mobile information
Emergency Response Center
Computer Aided Dispatch
In-car or on-person systems
Planning and simulations
Cyber Security Solutions
Fusion Centers
Border Security Solutions
Critical Infrastructure Security Solutions
Traffic Management Systems
Asset Management for Safety Maintenance
Weather
511
Emergency Response Counter
TerrorismTransportation
Safety
Cross cutting solutions: data management, communication, identification,
• Data Analytics• Data Management• Governance• Shared Services
• Biometrics
• Digital video
• Geospatial information
• Interoperable communications
• Collaboration

Smarter decision-making, better outcomes and better performance through
• Holistic view of programs, budgets and results, today and in the future
• Managing and reducing risk• Improving operational
efficiency• Increasing transparency and
accountability

Early Predictive Success: Maintenance Management
Problem: most preventive maintenance schedules assume independent part failureSolve: exploit maintenance records to discover the associated/sequential failure patterns
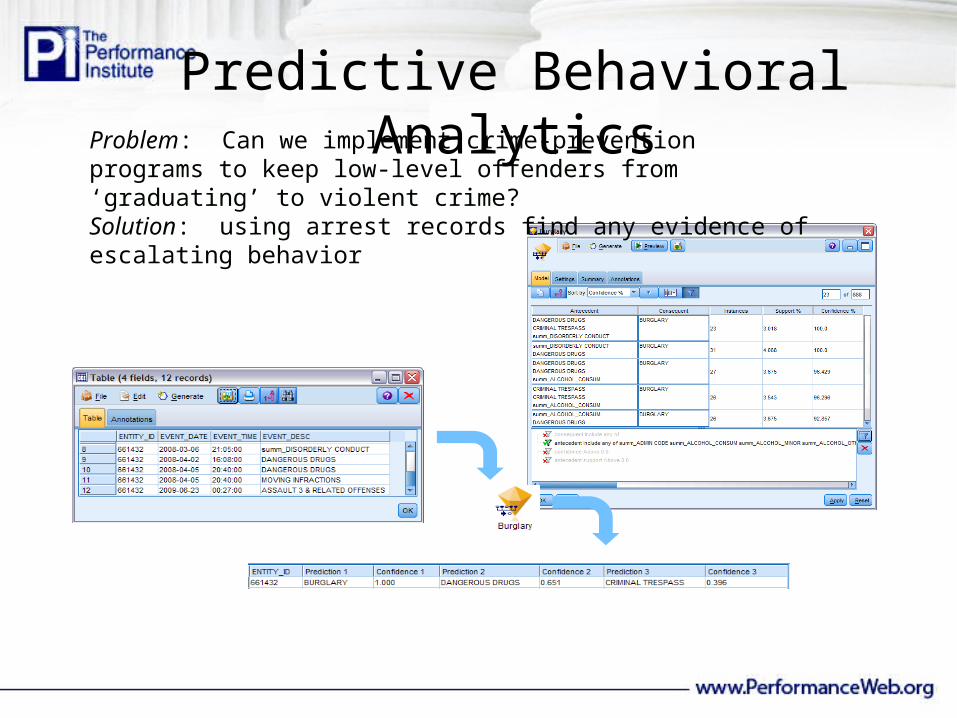
Predictive Behavioral AnalyticsProblem: Can we implement crime-prevention programs to keep low-level offenders from ‘graduating’ to violent crime?Solution: using arrest records find any evidence of escalating behavior

Competing Predictive Modeling for Greater Accuracy
Problem: Spiraling crime rates, limited officer resources -- better deployment decisions requiredSolve: (In addition to incident data) weather, city events, holiday/payday cycles, etc – better picture of criminal incidents, more accurate prediction, more effective deployment

Real time crime center – founded on a crime information warehouse - in NYPD joins and analyzes billions of records from multiple sources.
“It used to take us days to find a number or an address. Now we send stuff to detectives who are literally standing in the blood”.
Better and timelier information
fire

Predictive Analytics
– Provide more granular predictors (6 crime types)
– Include GPS data from vehicles as a factor for models
– Enhanced notifications to officers when they enter >90% dispatch zones
GPSGPSData
WarehouseData
WarehouseModel

7 & 30 Day Analysis
– Predict intensity of crime by 4 hour windows within 7 and 30 day forecasts
– Provide single click interface directly to GIS perspective for each 4 hour window
– Provide “what if” scenario options based on deployment tactics
S M T W H F S
S M T W H F S

Moon Phases?
• Yes, Predictive Crime Models with years of data in Europe and the US have linked temperature, humidity and even moon phases to crime.

More Data, More Computer Power, More (Unexpected) Correlations
• Fewer and More Meaningful Measures are still better strategically.
• But, the explosion of available data and the decline in the price of computing power has allowed for better modeling and sometimes surprising relationships.
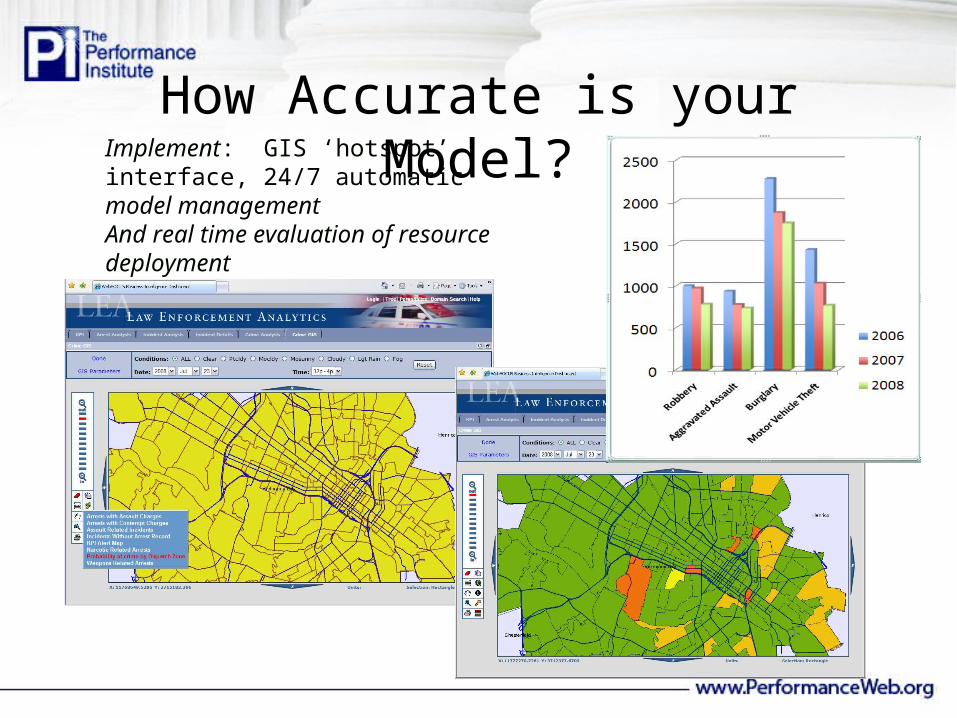
Implement: GIS ‘hotspot’ interface, 24/7 automatic model managementAnd real time evaluation of resource deployment
How Accurate is your Model?

NYPD’s real time crime center using analytics and GIS
60
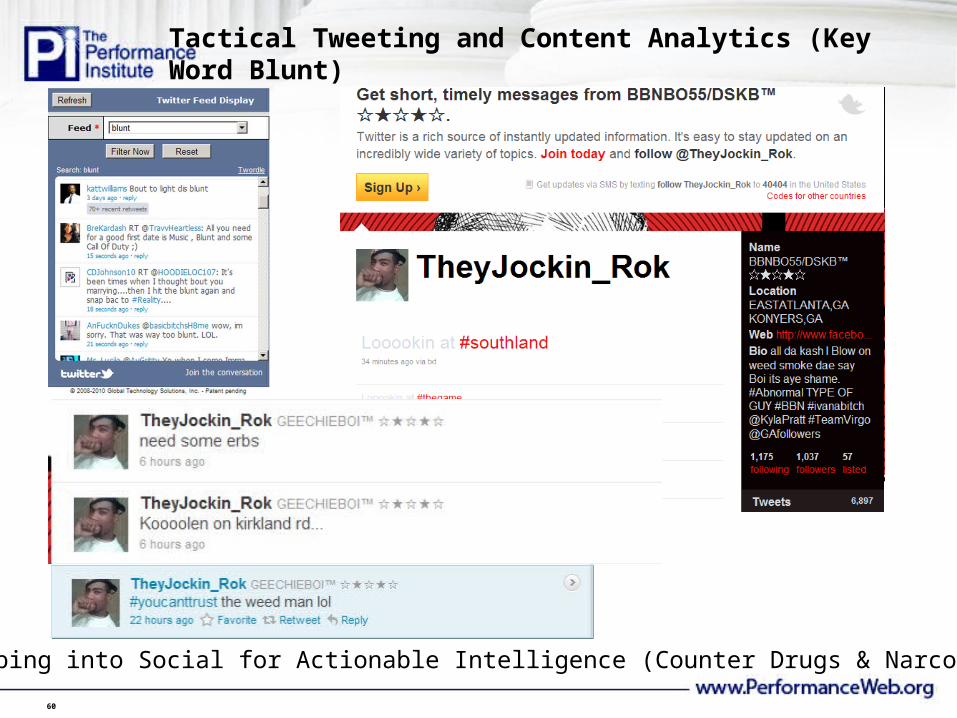
Tapping into Social for Actionable Intelligence (Counter Drugs & Narcotics)
Tactical Tweeting and Content Analytics (Key Word Blunt)
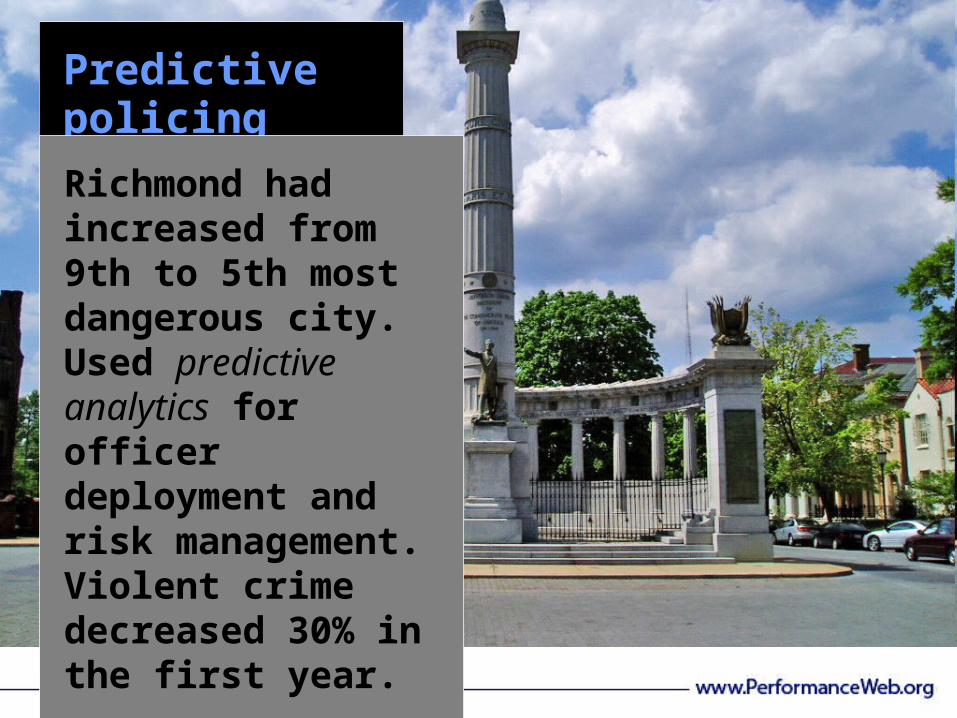
Predictive policing
Richmond had increased from 9th to 5th most dangerous city. Used predictive analytics for officer deployment and risk management. Violent crime decreased 30% in the first year.
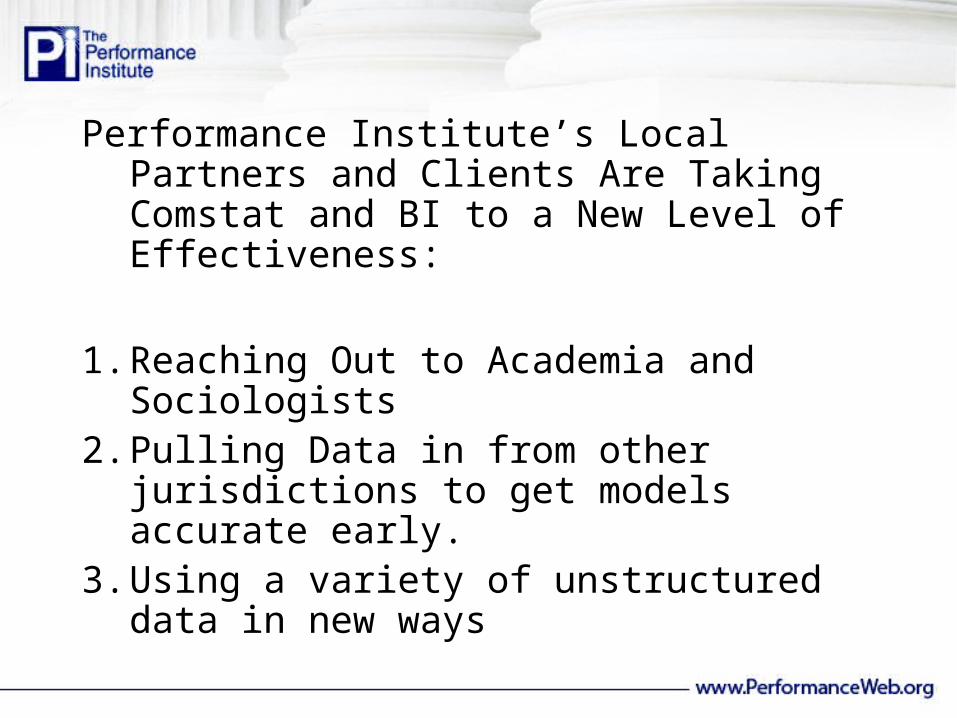
Performance Institute’s Local Partners and Clients Are Taking Comstat and BI to a New Level of Effectiveness:
1. Reaching Out to Academia and Sociologists2. Pulling Data in from other jurisdictions to get
models accurate early.3. Using a variety of unstructured data in new
ways

The Knowledge – Data Gap
1. Lessons are learned inadequately,
2. Memories are recalled incompletely,
3. The futures is predicted inaccurately,
4. Data rarely overcomes
preconceived notions.

When The Data isn’t enough
Possible Solutions:
• Rich histories
• Multiple observers and multiple interpretations
• Hypothetical histories

A Data Driven Culture Embraces Experimentation
Think of:
• Trial programs, pilot studies, and small experiments, and about the inferences that can be drawn from them.
• Does the Government embrace experimentation?

How to Get Fired at Harrah’s
“Institute a program without first running a data driven experiment.”-Gary Loveman
Measurement Maturity Index
• In order to have a good idea of your organization’s measurement progress the index will give a score up to a maximum of 300 in 4 key areas.
• Continue to assess your organizations over time to understand their progress and help them understand where to focus.

Four Maturity Themes
1. Interaction Discussion, Feedback, Pilots, Learning, Actionable
2. Integration Cross-Functional Understanding, Casual Relationships Explored

Four Maturity Themes
3. Focus Results-focus, Critical and Strategic The routine measures are eliminated for the
high-leverage
4. Context Widely Used, Valued, Trusted No Fear, Positive and Motivating
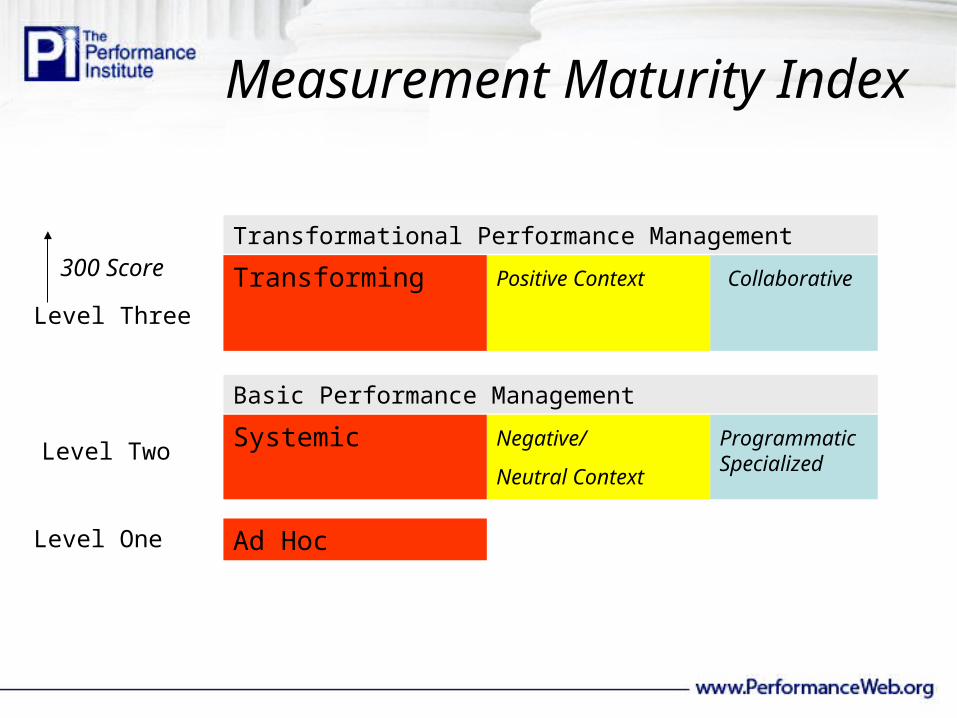
Level One
Basic Performance Management
Ad Hoc
Level Two
Transformational Performance Management
Transforming Positive Context Collaborative
Level Three
300 Score
Measurement Maturity Index
Systemic Negative/
Neutral Context
ProgrammaticSpecialized
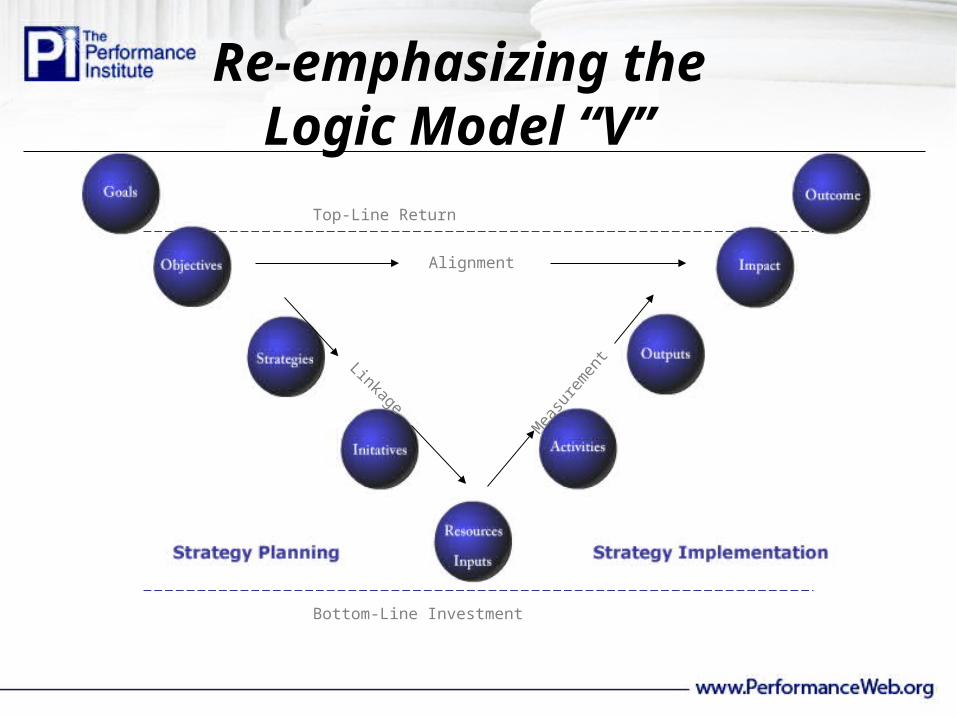
Re-emphasizing theLogic Model “V”
Bottom-Line Investment
Top-Line Return
Alignment
Linkage
Mea
sure
men
t
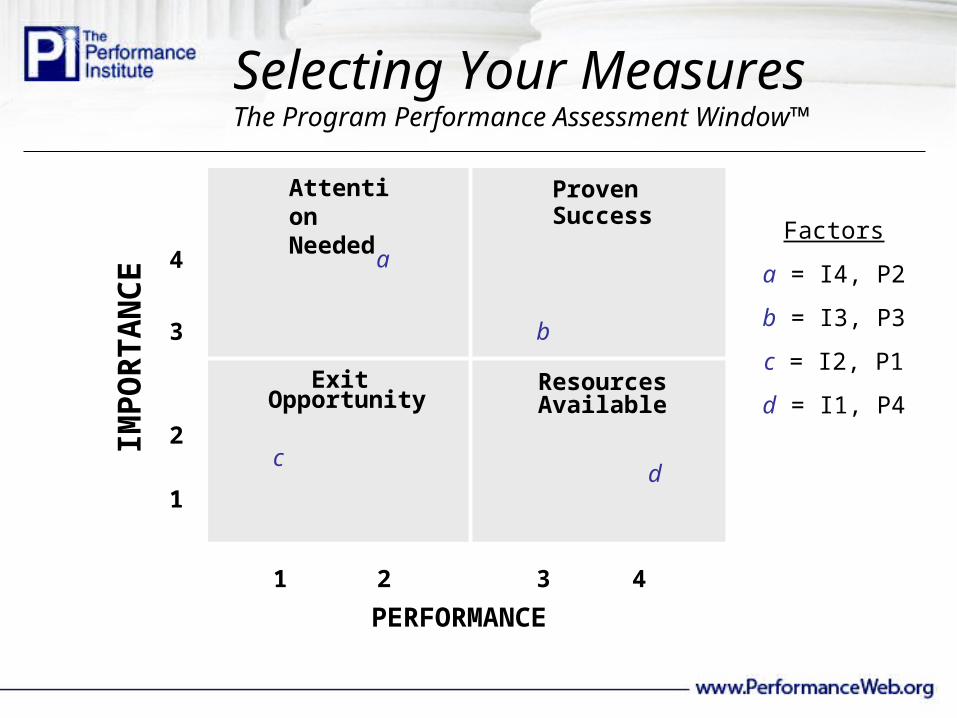
Selecting Your MeasuresThe Program Performance Assessment Window™
Exit Opportunity
Proven Success
ResourcesAvailable
PERFORMANCE
4
3
2
1
1 2 3 4
aFactors
a = I4, P2
b = I3, P3
c = I2, P1
d = I1, P4
b
cd
Attention Needed
IMP
OR
TA
NC
E