Embed Size (px)
Citation preview
Integrity.Excellence.Results.
GPU-Accelerated Databases: addressing FRTB Risk Results Reporting and other performance-at-scale challenges in Financial Services
www.citihub.com
Contents
Introduction
Test Definition and Framework
Technology Selection and Configuration
Use Case and Findings
Interactive Data
Big Data
ConclusionConclusion
About Citihub Consulting
3
5
6
99
14
1616
20
AuthorsTim JenningsAssociate Partner, Citihub [email protected]
Tim works in Citihub Consulting’s Business Transformation practice, focusing on setting and executing
strategically aligned business change for capital markets firms. He has 20+ years experience in capital
markets, having worked in both business-focused and technology teams including analysis, development
and support leadership.
Kieron BradleyAssociate Partner, Citihub [email protected]
Kieron is a senior technologist with over 20 years’ experience in solving capital markets challenges. He can
rapidly understand business environments and uses his deep knowledge of distributed systems typically
found within investment banks to address complex business and technical problems. Educated to a BSc,
MSc and MBA level, he uses his enterprise architecture and solution design skills to build a strong client
network across a broad set of disciplines.
10
Introduction
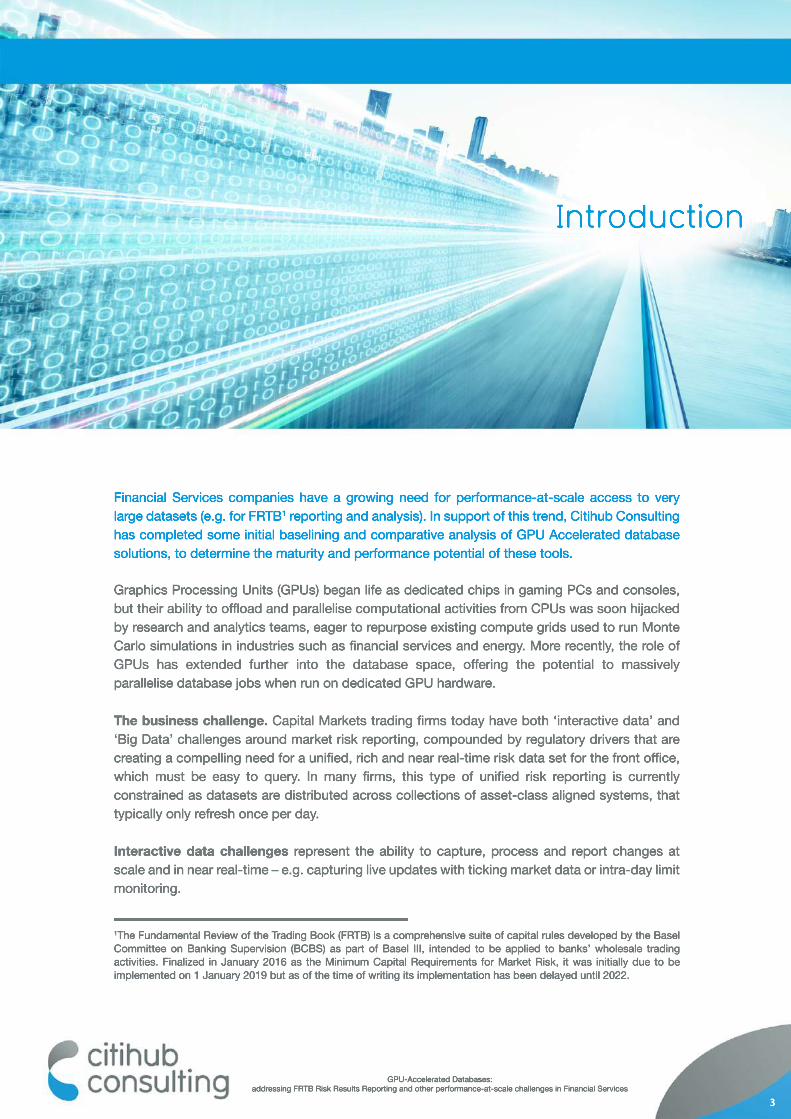
Financial Services companies have a growing need for performance-at-scale access to very large datasets (e.g. for FRTB1 reporting and analysis). In support of this trend, Citihub Consulting has completed some initial baselining and comparative analysis of GPU Accelerated database solutions, to determine the maturity and performance potential of these tools.
GraphicsGraphics Processing Units (GPUs) began life as dedicated chips in gaming PCs and consoles, but their ability to offload and parallelise computational activities from CPUs was soon hijacked by research and analytics teams, eager to repurpose existing compute grids used to run Monte Carlo simulations in industries such as financial services and energy. More recently, the role of GPUs has extended further into the database space, offering the potential to massively parallelise database jobs when run on dedicated GPU hardware.
TheThe business challenge. Capital Markets trading firms today have both ‘interactive data’ and ‘Big Data’ challenges around market risk reporting, compounded by regulatory drivers that are creating a compelling need for a unified, rich and near real-time risk data set for the front office, which must be easy to query. In many firms, this type of unified risk reporting is currently constrained as datasets are distributed across collections of asset-class aligned systems, that typically only refresh once per day.
InteractiveInteractive data challenges represent the ability to capture, process and report changes at scale and in near real-time – e.g. capturing live updates with ticking market data or intra-day limit monitoring.
1The Fundamental Review of the Trading Book (FRTB) is a comprehensive suite of capital rules developed by the Basel Committee on Banking Supervision (BCBS) as part of Basel III, intended to be applied to banks’ wholesale trading activities. Finalized in January 2016 as the Minimum Capital Requirements for Market Risk, it was initially due to be implemented on 1 January 2019 but as of the time of writing its implementation has been delayed until 2022.
GPU-Accelerated Databases: addressing FRTB Risk Results Reporting and other performance-at-scale challenges in Financial Services
3
Big Data challenges represent the ability to easily access the huge quantities of risk result information that are generated daily across many financial services firms without losing fidelity through aggregation. Use cases for this are typically data analytics-based, e.g. mining the data for trends, correlations and historic events. Users in these cases are able to wait minutes (or longer) for responses to these types of large-scale queries.
InIn most firms, current risk technology stacks don’t lend themselves well to the unification of scale and performance as defined by the need to support both interactive queries, and ever-expanding Big Data sized datasets.
AA potential new technology solution? There are several new GPU database solutions starting to make a big noise in IT circles, reporting vast performance increases over both traditional and Big Data style SQL database solutions. Independent technologist Mark Litwintschik runs a popular blog reporting benchmarks across a range of these database solutions, which demonstrates clearly the potential of GPU solutions using generic datasets (http://tech.marksblogg.com/benchmarks.html).
SoSo we got curious. Given the performance-at-scale results reporting challenges we were seeing in leading financial services firms, we were curious to know whether GPU accelerated databases could assist with vastly improved SQL processing times. Could the performance gains offered by GPU databases have the potential to solve the interactive data and Big Data challenges facing financial services firms?
TTo put this potential to the test, we worked with a tier 1 investment bank, to generate a pseudo financial services industry risk result dataset, suited specifically to FRTB reporting and analysis and set about putting the GPU databases to the test.
Our objective was to see how fast GPU databases could potentially be and in particular, assess:
Thus, taking this approach, we would be able to consider interesting questions like:
• are GPU databases candidates to support live intra-day type blotters? • can we envisage pre-calculated OLAP cubes2 being replaced by GPU databases fulfilling live queries on in-bound streaming data?• are GPU databases viable and performant alternatives to Big Data solutions?• are GPU databases mature enough for mission-critical solutions?
2OLAP cube: a multidimensional database that is optimised for data warehouse and online analytical processing applications.
• query performance - as compared to alternative platforms• scalability and relative performance - on a single node type system• overall product enterprise readiness and functional maturity
GPU-Accelerated Databases: addressing FRTB Risk Results Reporting and other performance-at-scale challenges in Financial Services
4
Test Definition and Framework
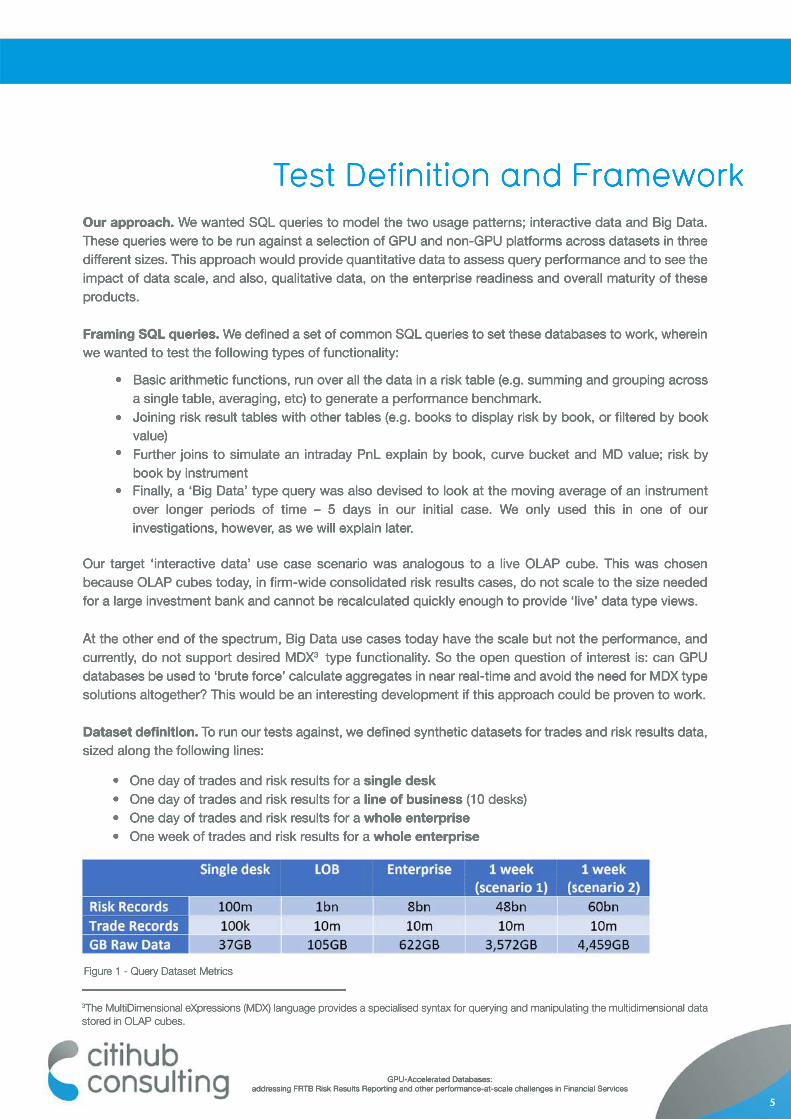
• One day of trades and risk results for a single desk• One day of trades and risk results for a line of business (10 desks)• One day of trades and risk results for a whole enterprise• One week of trades and risk results for a whole enterprise
Our target ‘interactive data’ use case scenario was analogous to a live OLAP cube. This was chosen because OLAP cubes today, in firm-wide consolidated risk results cases, do not scale to the size needed for a large investment bank and cannot be recalculated quickly enough to provide ‘live’ data type views.
AtAt the other end of the spectrum, Big Data use cases today have the scale but not the performance, and currently, do not support desired MDX3 type functionality. So the open question of interest is: can GPU databases be used to ‘brute force’ calculate aggregates in near real-time and avoid the need for MDX type solutions altogether? This would be an interesting development if this approach could be proven to work.
Dataset definition. To run our tests against, we defined synthetic datasets for trades and risk results data, sized along the following lines:
Our approach. We wanted SQL queries to model the two usage patterns; interactive data and Big Data. These queries were to be run against a selection of GPU and non-GPU platforms across datasets in three different sizes. This approach would provide quantitative data to assess query performance and to see the impact of data scale, and also, qualitative data, on the enterprise readiness and overall maturity of these products.
Framing SQL queries. We defined a set of common SQL queries to set these databases to work, wherein we wanted to test the following types of functionality:
•
•
•
•
Basic arithmetic functions, run over all the data in a risk table (e.g. summing and grouping across a single table, averaging, etc) to generate a performance benchmark.Joining risk result tables with other tables (e.g. books to display risk by book, or filtered by book value)Further joins to simulate an intraday PnL explain by book, curve bucket and MD value; risk by book by instrumentFinallFinally, a ‘Big Data’ type query was also devised to look at the moving average of an instrument over longer periods of time – 5 days in our initial case. We only used this in one of our investigations, however, as we will explain later.
Figure 1 - Query Dataset Metrics
3The MultiDimensional eXpressions (MDX) language provides a specialised syntax for querying and manipulating the multidimensional data stored in OLAP cubes.
GPU-Accelerated Databases: addressing FRTB Risk Results Reporting and other performance-at-scale challenges in Financial Services
5
Technology Selection and ConfigurationTechnology selection. We selected the candidate database solutions as follows:
In the GPU camp we selected: Kinetica, MapD and SQream.
In the non-GPU databases case, we chose: Google BiqQuery and SAP IQ.
Our intention was to compare traditional and understood enterprise products, some recognised new cloud products and a selection of the new leading GPU solutions.
InIn this particular evaluation, because we were trying just to capture typical ‘raw’ performance, we did not look at clustered solutions (in the conclusion we suggest this as follow-on work). Instead, we wanted to find out just what was the best performance we could really get out of a single best-in-class type server today. Obviously though, this approach could not be applied to ‘serverless’ offerings such as Google BigQuery where resource allocation was outside our control.
AllAll our testing was run in the cloud. Running the benchmarks in the cloud gave us the flexibility to change and experiment with host configurations and gave rapid time-to-market on host provisioning, which was particularly valuable for GPU-enabled hosts. We wanted to know how the GPU solutions would fare on the fastest available GPU hardware at the time of testing, so we used Nvidia Volta V100 type GPUs. We collectively ran our tests across all three of the main cloud providers: Amazon Web Services, Microsoft Azure and Google Cloud Platform, given our requirement to test out a variety of different high-end configurations.
TheThe initial Azure offering we tested had a maximum of 4 GPU boards per host which we used, but we also wanted larger 8-way GPU boxes to help us explore the scalability of a single host, and these – at the time of writing - were only available on AWS. It is understood that 8-way GPU machines will be available later in the year on Azure as well. For the other configurations considered: we ran BigQuery in the Google Cloud, and we hosted our SAP IQ solution on AWS. Machine specs for all of these configurations are summarised later.
UsingUsing the cloud meant that we could not have dedicated and identical hardware in all scenarios, which would be a pre-requisite for a full performance-only type benchmark. However, we tried to re-use common host configurations, – given active constraints on platform availability and overall system calculated costs.
Configuration.Configuration. One final and important caveat is that the GPU solutions we used were largely ‘out of the box’ configurations. But we also know there are configuration tweaks available for both MapD and Kinetica which we expect would improve the performance of these platforms, but which we did not fully explore in this exercise.
GPU-Accelerated Databases: addressing FRTB Risk Results Reporting and other performance-at-scale challenges in Financial Services
6
Technology overview. Before we get to reviewing the benchmark results, let’s look briefly at the technology in use here and clarify how these technologies work, to head off any potential misconceptions.
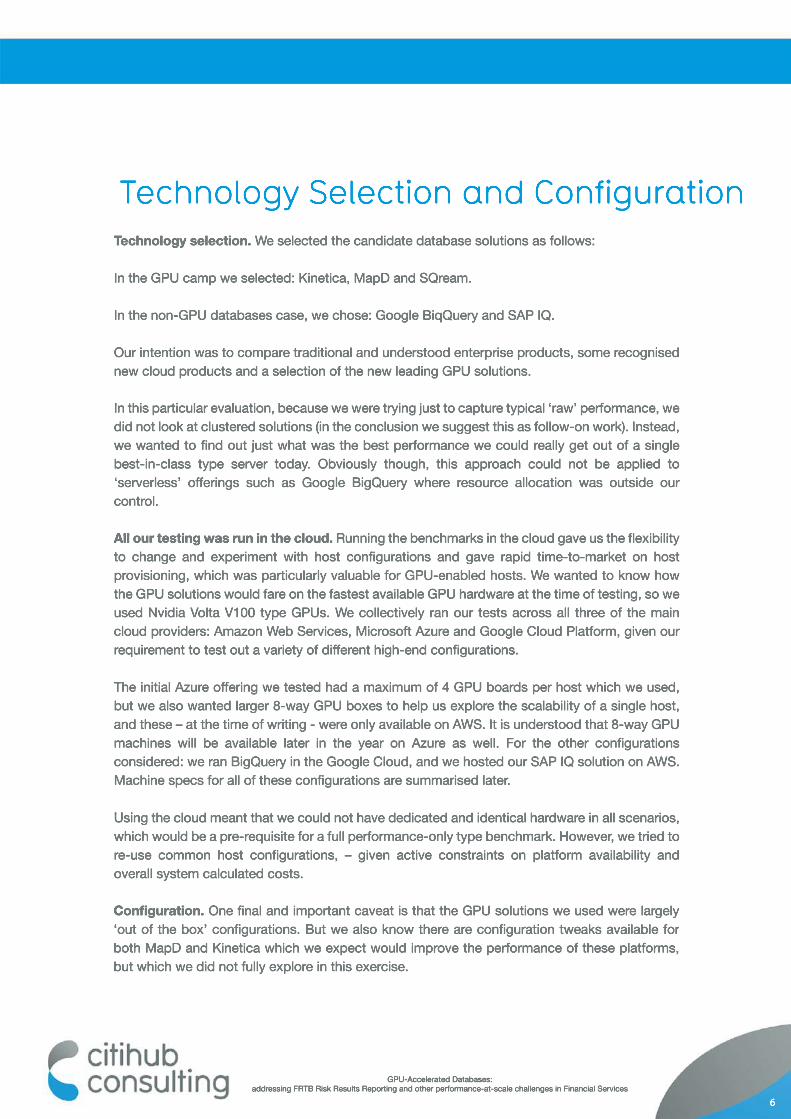
With the SQream case: SQream did not release a version of their code for us to get hands-on experience with, but they were very responsive to our approach and provided the benchmark numbers using data generated from the data creation tools we supplied.
Hardware
Both Kinetica and MapD are in-memory solutions; SQream is not, as illustrated in figure 3 above. Thus, we would expect MapD and Kinetica to work well on our ‘interactive data’ use cases, but performance will only scale to the amount of CPU and GPU memory available. With the GPU databases, data is loaded to GPU RAM from the CPU RAM, and best performance will come from queries executed in GPU RAM.
Figure 3 - Performance Scope
4NB: “$ month” shows the cloud provider rate for the host and does not include data storage or network bandwidth to load data, etc
GPU-Accelerated Databases: addressing FRTB Risk Results Reporting and other performance-at-scale challenges in Financial Services
Peformance
Sybase IQMapDKinetica
BigQuerySQream
Test scopeTest scope
Figure 2 - Testing Rigs
7
When running our interactive tests: our timings are based on ‘hot’ data and exclude load times from storage. SAP IQ - the way we provisioned it - is likewise comparable here, since it has advanced caching capability configured. Note also that SAP IQ has had indexes applied, where Kinetica and MapD did not. That said, our limited experimentation with indexes showed little performance improvement when used with the two GPU databases.
TheThe SQream solution deliberately targets ‘Big Data’, offering speed across large volumes of data (>2TB) rather than raw performance at lower levels. This means that the times quoted in SQream are ‘round-trip’ times and include loading the data from cold on the disk storage. This is more comparable to BiqQuery, and not comparable with the in-memory solutions where the load from cold scenarios have been excluded. It is only for this reason that SQream and BigQuery are singled out as the only databases tested in our Big Data case.
InIn our tests, all of the data was immutable and did not need to be updated as part of our query execution. We would envisage in the future GPU solutions being used to augment existing data warehouses and Data Lakes, and we see this technology being used increasingly in use cases where query performance is at a premium.
RiskRisk calculations were out of scope. There may be a case for GPU adoption to generate pricing and risk sensitivity values as well, but this use was not investigated at all in our tests. Instead, our focus was purely on evaluating SQL engine performance across large volumes of fact table data and associated dimensions using basic query operators.
GPU-Accelerated Databases: addressing FRTB Risk Results Reporting and other performance-at-scale challenges in Financial Services
8
Use Case and FindingsInteractive Data
The following charts and tables summarise the benchmark results we obtained for each of queries shown, when we tested the database against our three different sized risk results datasets: 100M rows, 1 billion rows, and the 8 billion row cases.
Queries 1-6 shown below were the queries we defined to test the basic benchmarking and ‘interactive data’ use cases.
Query 7, talked about in the next section shows our follow-on additional Big Data case, which was limited to just reviewing the performance of SQream and BigQuery.
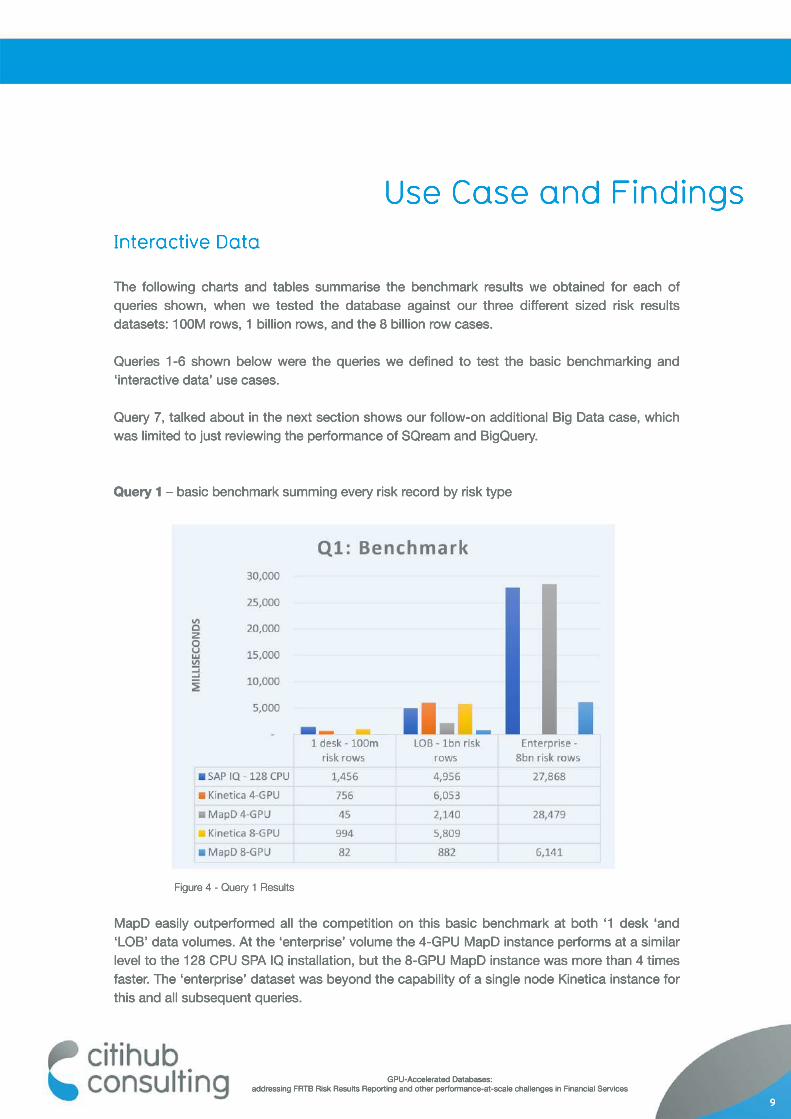
Query 1Query 1 – basic benchmark summing every risk record by risk type
MapD easily outperformed all the competition on this basic benchmark at both ‘1 desk ‘and ‘LOB’ data volumes. At the ‘enterprise’ volume the 4-GPU MapD instance performs at a similar level to the 128 CPU SPA IQ installation, but the 8-GPU MapD instance was more than 4 times faster. The ‘enterprise’ dataset was beyond the capability of a single node Kinetica instance for this and all subsequent queries.
Figure 4 - Query 1 Results
GPU-Accelerated Databases: addressing FRTB Risk Results Reporting and other performance-at-scale challenges in Financial Services
9
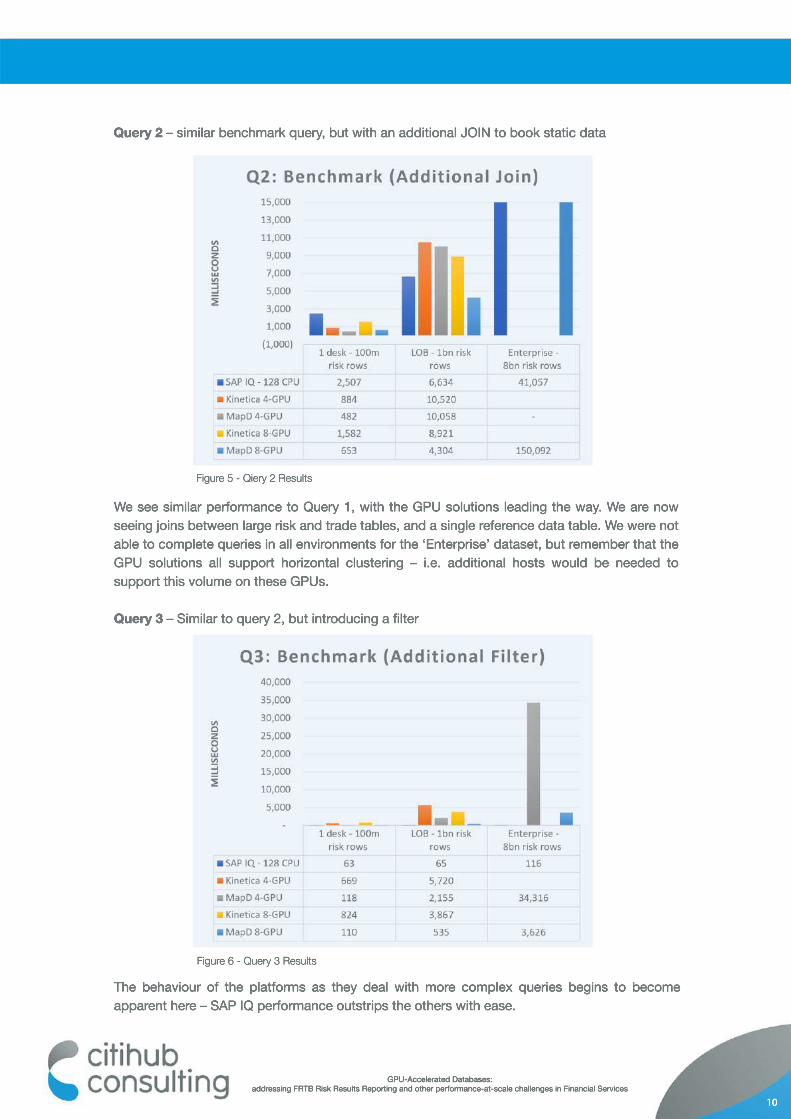
Query 2 – similar benchmark query, but with an additional JOIN to book static data
The behaviour of the platforms as they deal with more complex queries begins to become apparent here – SAP IQ performance outstrips the others with ease.
We see similar performance to Query 1, with the GPU solutions leading the way. We are now seeing joins between large risk and trade tables, and a single reference data table. We were not able to complete queries in all environments for the ‘Enterprise’ dataset, but remember that the GPU solutions all support horizontal clustering – i.e. additional hosts would be needed to support this volume on these GPUs.
Query 3 – Similar to query 2, but introducing a filter
Figure 5 - Qiery 2 Results
Figure 6 - Query 3 Results
GPU-Accelerated Databases: addressing FRTB Risk Results Reporting and other performance-at-scale challenges in Financial Services
10
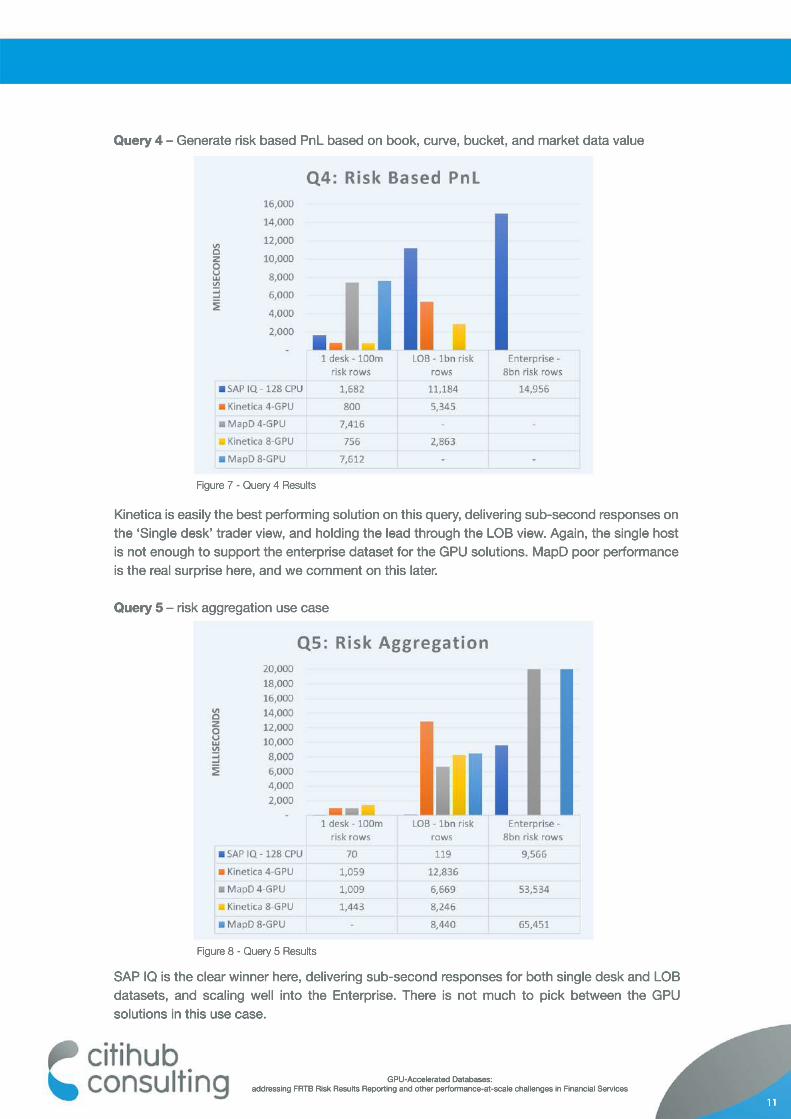
Query 4 – Generate risk based PnL based on book, curve, bucket, and market data value
SAP IQ is the clear winner here, delivering sub-second responses for both single desk and LOB datasets, and scaling well into the Enterprise. There is not much to pick between the GPU solutions in this use case.
Kinetica is easily the best performing solution on this query, delivering sub-second responses on the ‘Single desk’ trader view, and holding the lead through the LOB view. Again, the single host is not enough to support the enterprise dataset for the GPU solutions. MapD poor performance is the real surprise here, and we comment on this later.
Query 5 – risk aggregation use case
Figure 7 - Query 4 Results
Figure 8 - Query 5 Results
GPU-Accelerated Databases: addressing FRTB Risk Results Reporting and other performance-at-scale challenges in Financial Services
11
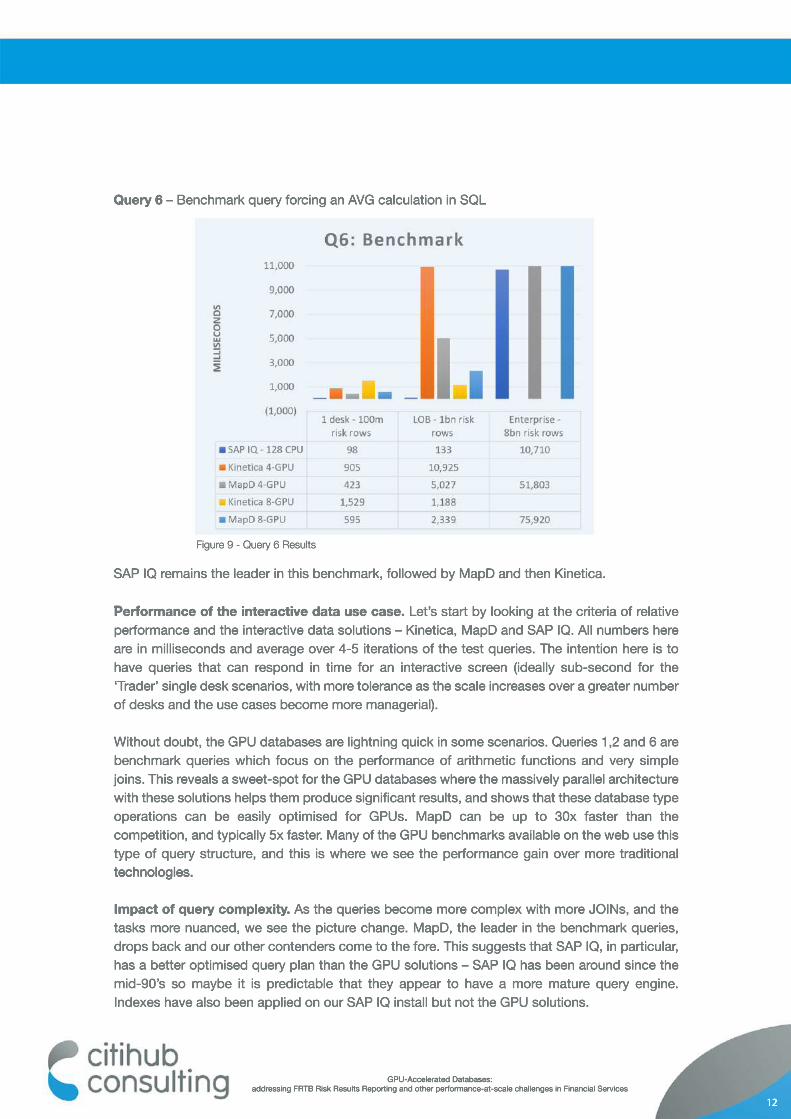
Query 6 – Benchmark query forcing an AVG calculation in SQL
SAP IQ remains the leader in this benchmark, followed by MapD and then Kinetica.
PerformancePerformance of the interactive data use case. Let’s start by looking at the criteria of relative performance and the interactive data solutions – Kinetica, MapD and SAP IQ. All numbers here are in milliseconds and average over 4-5 iterations of the test queries. The intention here is to have queries that can respond in time for an interactive screen (ideally sub-second for the ‘Trader’ single desk scenarios, with more tolerance as the scale increases over a greater number of desks and the use cases become more managerial).
WithoutWithout doubt, the GPU databases are lightning quick in some scenarios. Queries 1,2 and 6 are benchmark queries which focus on the performance of arithmetic functions and very simple joins. This reveals a sweet-spot for the GPU databases where the massively parallel architecture with these solutions helps them produce significant results, and shows that these database type operations can be easily optimised for GPUs. MapD can be up to 30x faster than the competition, and typically 5x faster. Many of the GPU benchmarks available on the web use this type of query structure, and this is where we see the performance gain over more traditional technologies.technologies.
Impact of query complexity. As the queries become more complex with more JOINs, and the tasks more nuanced, we see the picture change. MapD, the leader in the benchmark queries, drops back and our other contenders come to the fore. This suggests that SAP IQ, in particular, has a better optimised query plan than the GPU solutions – SAP IQ has been around since the mid-90’s so maybe it is predictable that they appear to have a more mature query engine. Indexes have also been applied on our SAP IQ install but not the GPU solutions.
Figure 9 - Query 6 Results
GPU-Accelerated Databases: addressing FRTB Risk Results Reporting and other performance-at-scale challenges in Financial Services
12
MapD does particularly poorly at query 4, where it appears to scan much more data than necessary (the query reports risk from a single trade) – it is likely that the SQL can be refactored to prevent this, but our result suggests immature query optimisation in this example. Also, there is no formal ordering, sharding or indexing applied to the data on MapD in this example (nor on Kinetica, although indexing has been applied on SAP IQ). More radically, de-normalising the data at ingestion would reduce the joins and very clearly lead us back towards the sorts of numbers we saw in the first query.
CapacityCapacity and scalability. It is also apparent that the 4-GPU instance was under-sized for the job of managing a complete day of IB risk results, and arguably even for the LOB dataset. This is not a surprise – the box has 4 GPUs and 24 virtual cores, with 64GB of GPU RAM and 448GB of CPU RAM. Such a layout is by no means “entry-level”, but clearly in these tests we are really finding the limits of a 4-GPU configuration. We can see the ‘single host’ scalability by comparison with the AWS 8-GPU server running the same solution, which shows vastly better performance for the LOB tests, and is generally capable of supporting the full IB dataset albeit atat compromised performance. By comparison the SAP IQ host has almost 2TB of RAM and 128 vCPUs.
Horizontal scalability is one of the key attributes of the GPU solutions – it is inherent in the architecture of all the GPU solutions to support additional hosts and to cluster the GPUs. However, we will need to take that on trust for now, as here we are limiting our focus to performance. It is clear from the results that we would need to add more hosts to recover performance for the larger datasets as they reach the capacity of our single hosts.
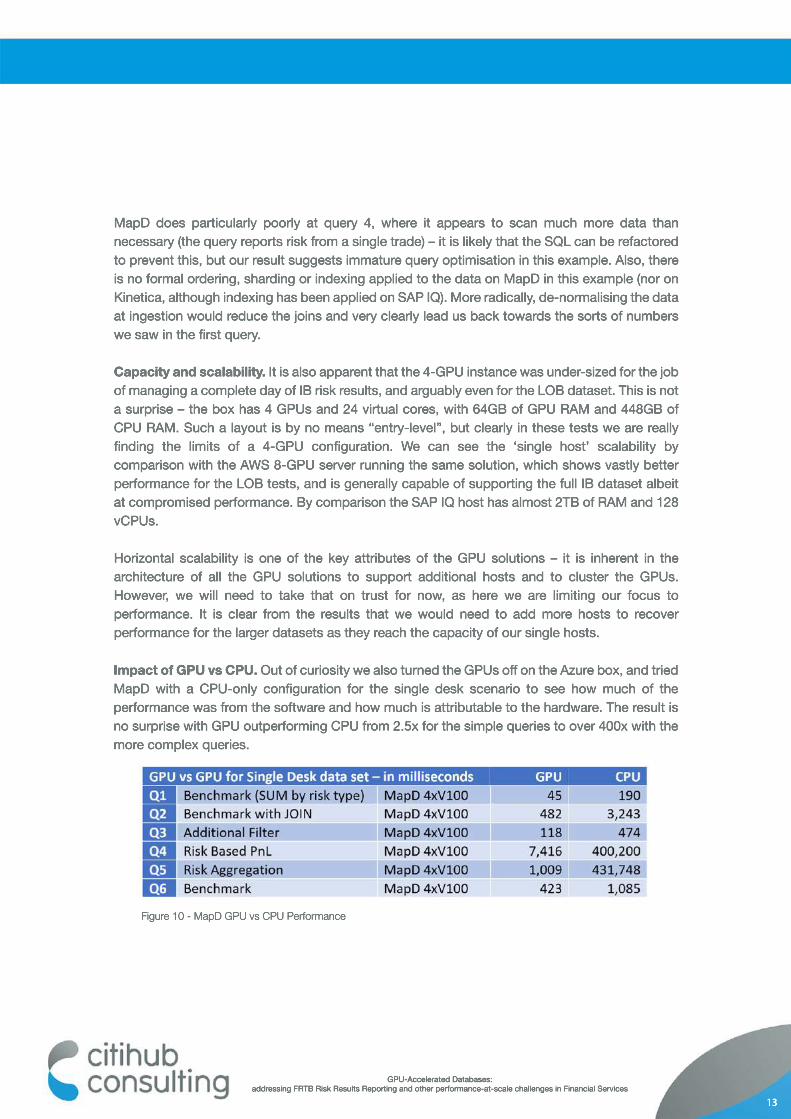
Impact of GPU vs CPU. Out of curiosity we also turned the GPUs off on the Azure box, and tried MapD with a CPU-only configuration for the single desk scenario to see how much of the performance was from the software and how much is attributable to the hardware. The result is no surprise with GPU outperforming CPU from 2.5x for the simple queries to over 400x with the more complex queries.
Figure 10 - MapD GPU vs CPU Performance
GPU-Accelerated Databases: addressing FRTB Risk Results Reporting and other performance-at-scale challenges in Financial Services
13
Big Data
SQream also predicted that query performance does not degrade linearly with scale, but instead improves relative to the size of the dataset. We begin to see this borne out by the reported results; the ‘one week’ dataset is actually 6x the Enterprise 1 day dataset, but query duration has increased by only 4.3x.
TheThere was another query run on the one week dataset to limit the results to those from a single day. This returned in significantly less time (circa 13 seconds) than the full population query, which suggests that SQream does not suffer from the query optimisation issues that we have seen elsewhere.
DataData compression. SQream reported a 90% compression ratio on the data on disk, which would certainly be of interest if you planned to run an SQream solution in parallel with a data lake in the cloud. Storage may be relatively cheap, but this is targeting very large datasets so that compression will help.
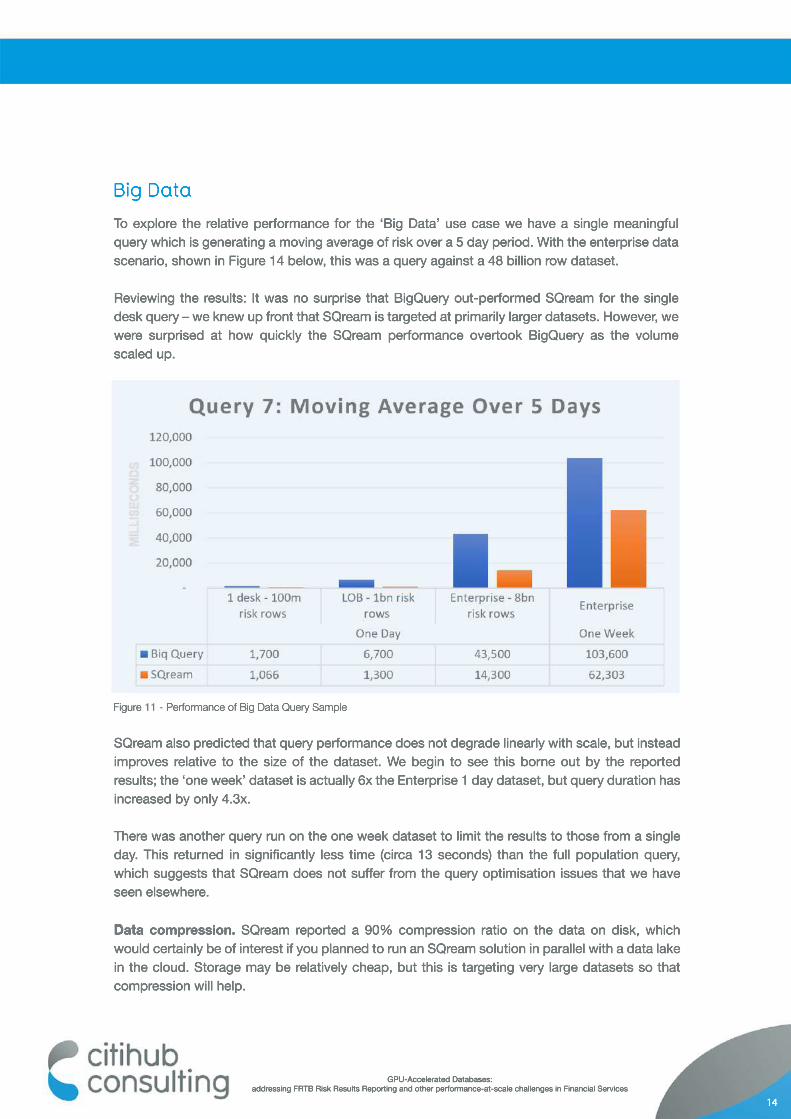
To explore the relative performance for the ‘Big Data’ use case we have a single meaningful query which is generating a moving average of risk over a 5 day period. With the enterprise data scenario, shown in Figure 14 below, this was a query against a 48 billion row dataset.
Reviewing the results: It was no surprise that BigQuery out-performed SQream for the single desk query – we knew up front that SQream is targeted at primarily larger datasets. However, we were surprised at how quickly the SQream performance overtook BigQuery as the volume scaled up.
Figure 11 - Performance of Big Data Query Sample
GPU-Accelerated Databases: addressing FRTB Risk Results Reporting and other performance-at-scale challenges in Financial Services
14
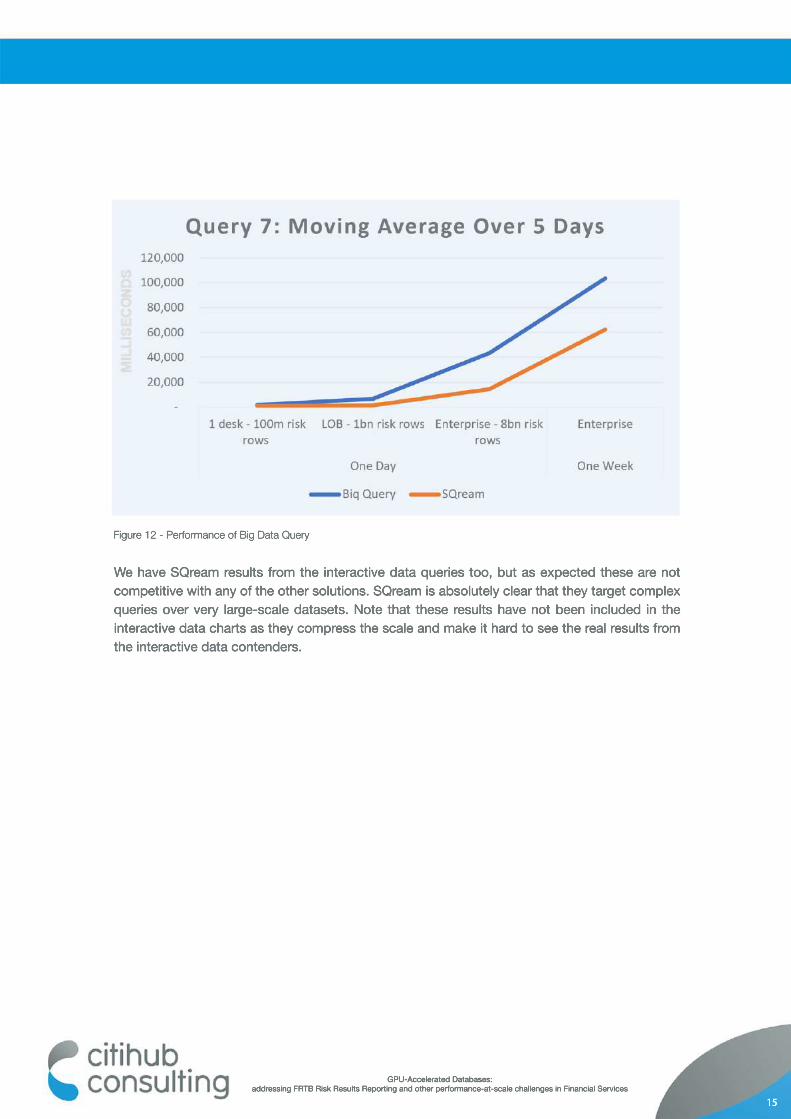
We have SQream results from the interactive data queries too, but as expected these are not competitive with any of the other solutions. SQream is absolutely clear that they target complex queries over very large-scale datasets. Note that these results have not been included in the interactive data charts as they compress the scale and make it hard to see the real results from the interactive data contenders.
Figure 12 - Performance of Big Data Query
GPU-Accelerated Databases: addressing FRTB Risk Results Reporting and other performance-at-scale challenges in Financial Services
15
Conclusion
Candidate Use Cases
To summarise our investigation, the GPU database solutions we have considered are not yet direct replacements for standard multi-purpose SQL databases (such as Microsoft SQL Server or Oracle) and may never truly replace them; they are not Swiss-army knife solutions that can do anything and are certainly not a simple add-on to turbo charge an existing platform. However, put them into the arena of OLAP / Star Schema style workloads and their potential becomes apparent.
Some use cases stand out as candidates for this technology:
Brute force solutions on de-normalised large datasets. This looks to be a sweet spot of GPU accelerated databases, which means solutions around reporting immutable data sources either live ticking or part of a data warehouse solution are realistic candidates for exploration: think OLAP and MIS type solutions. Also, there is a lot more headroom with this roadmap already: Nvidia are releasing systems later this year which will double the GPU RAM and improve inter-GPU communication, so this performance will only improve. But be aware that the current implementations are still developing and face some maturity issues. issues.
Potential for SQream to replace existing Big Data type solutions in the longer term. Clearly, the in-memory solutions will not scale to support multi-year, multi-petabyte requirements just yet. However, the SQream offering in this space is worth considering, since it does not appear (from the testing performed) to be bound by limitations on the joins etc, so retains all the query flexibility of a fully featured SQL environment. Combine the query performance of SQream on large datasets, and the vast scale that it can support on limited hardware, and SQream is certainly a candidate worth considering.
•
•
GPU-Accelerated Databases: addressing FRTB Risk Results Reporting and other performance-at-scale challenges in Financial Services
16
Enterprise Readiness
The roadmap for GPU accelerated database technology and for the underlying GPU hardware looks strong. The raw performance of these solutions continues to impress, which, combined with the promised horizontal scalability leads to an emerging story that we expect to become compelling as these technologies mature.
Having spent some time evaluating these solutions, we have some anecdotal insights on the stability, features, behaviour and tooling of the different respective platforms:
The relative performance of cloud providers. Based on the number and type of tests performed, there was no clear differentiation between the three cloud providers in terms of outright performance. Anyone wishing to utilise cloud based GPU database technology should primarily be concerned with identifying the correct use case and relative performance of the GPU databases themselves, rather than be focused on any (arguably marginal) performance gains of selecting one cloud vendor over another. This was true at the time of testing and assumes that the cloud vendors are able and willing to offer comparable GPU hacomparable GPU hardware, which may change over time.
SAP IQ and BigQuery are both well established in their fields, and the relative quality of their tooling reflects this. BigQuery, in particular, is well instrumented with good ingestion and query capability – it was very easy to use to get results and tolerant of a variety of SQL expressions/constructs. These products have the maturity and familiarity to be enterprise-ready and are already being deployed in some enterprise-class solutions today.
GPUGPU database solutions and their tooling are the new kids on the block, and some of the tooling and behaviour seen here reflects this. The out-of-the-box configuration of these solutions can leave something to be desired; in one solution this effectively excluded using any more than 2 GPUs until reconfigured. The documentation around performance tuning was also found to be sparse, so a lot is left to the implementer. We found some instability in the UI SQL tools as well.
DataData sharding across GPUs/hosts. For the interactive data GPU solutions, it is worth being aware of the way that data is sharded across GPUs and across hosts. This definitely impacts performance as well as function. If you implement an ineffective sharding strategy your queries will not be able to return the JOINs you hope for. This might be an issue if this is the final ‘golden store’ of your risk data, but given these are in-memory databases it is more likely that they would be used in conjunction with a richer long-term data store. So thankfully this limitation is not one you are forced to live with in perpetuity. Note that this is notnot unique to these solutions; for instance, there is a very similar implementation of data sharding in Microsoft Cosmos DB with a similar impact.
•
•
•
•
GPU-Accelerated Databases: addressing FRTB Risk Results Reporting and other performance-at-scale challenges in Financial Services
17
Challenges and Further Investigation
Testing of clustering and scalability. Indications are that horizontal scalability can be achieved with linear performance impact, which needs to be modelled realistically. There are implications to data distribution and grouping, as mentioned earlier, and these need to be evaluated against real-world use cases.
CombinedCombined read and ingest performance. Our testing was on a static dataset. We have been able to run queries whilst the data was loading, but this was not part of a structured test case. To build a real-time ticking risk system with interactive users, this use case must be validated.
In order to demonstrate readiness for production use, and for anyone interested in understanding more about the relevance of these solutions outside of a lab environment, we recommend careful additional consideration of the following areas:
Single node solution sizing. We found little in the documentation of either MapD or Kinetica to help with right-sizing the solution for a single node, or guidance on how to estimate scale for a cluster. Determining the load a single node could support became largely a matter of trial and error. The performance of these solutions degrades as they run short of system resources, so right-sizing a cluster is critical. In our examples, clearly the enterprise data set was too large for the nodes, and we can see some degradation between the 4-way GPU node and the 8-way node even on the LOB dataset.
DataData ingestion performance is another area ripe for improvement. There are start-up technologies looking at further uses of GPUs in this area too (e.g. fastdata.io). It may be possible for the vendors to increase the pace of ingestion or reduce the processing necessary, for example by using common formats like Parquet for storage or Arrow for in-memory representation. We found that using a single host, we spent a lot of time waiting for ingestion to complete: this appears not to use the GPUs to improve performance, and it is not easily parallelisable in all cases. In some cases, the way the data is placed on the diskdisk during ingestion cannot be easily adjusted without forcing re-ingestion (this became an issue when we configured additional GPUs, for example). With one of the GPU solutions in particular we had issues with ingestion failing, and having to restart again from the beginning. We did not take steps to improve the underlying performance of the storage on the machines (e.g. faster or multiple disks), which, had it been done may have ameliorated this to a degree.
Data structure for ‘brute force’ GPU solutions. The results of the testing have clearly demonstrated the raw performance of the GPU solution for ‘brute force’ tasks. We were guilty of ‘relational think’ at the outset and if starting this again, we would invest more time in de-normalising the data up-front (or just generate a de-normalised dataset!). We are very confident that the performance on large datasets with limited joins would be impressive.
•
•
•
•
•
GPU-Accelerated Databases: addressing FRTB Risk Results Reporting and other performance-at-scale challenges in Financial Services
18
Footnotes/Assumptions
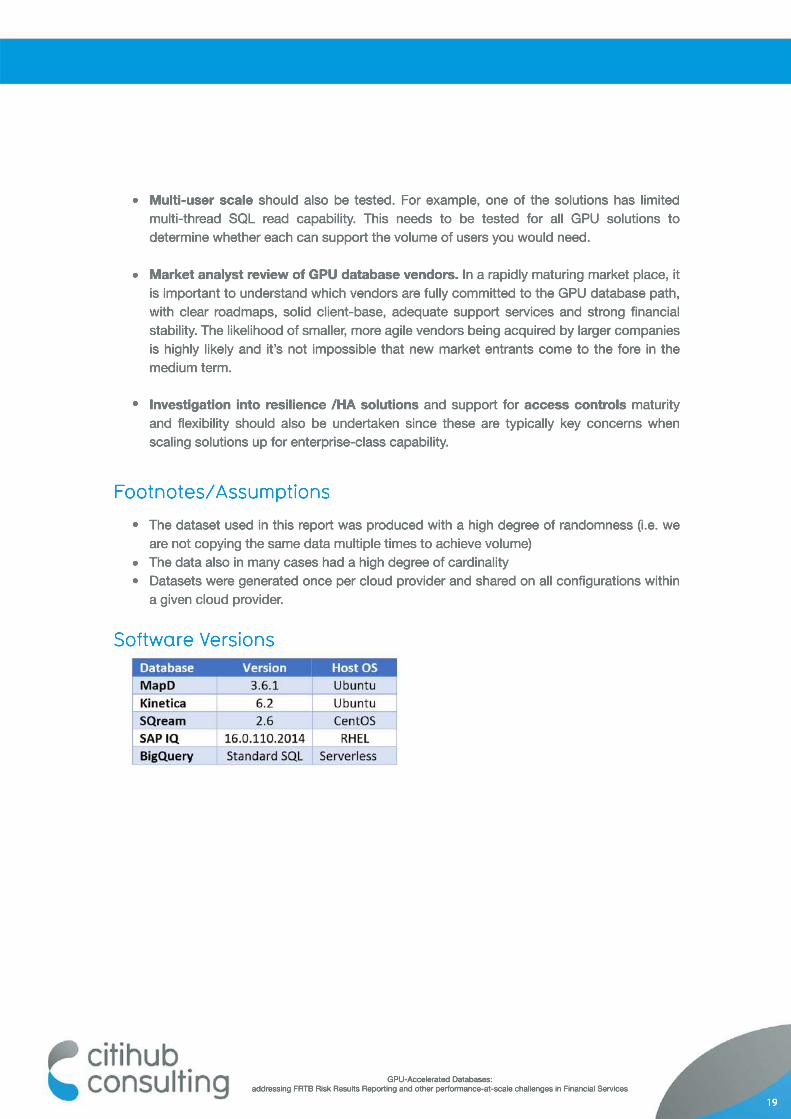
Software Versions
The dataset used in this report was produced with a high degree of randomness (i.e. we are not copying the same data multiple times to achieve volume)The data also in many cases had a high degree of cardinalityDatasets were generated once per cloud provider and shared on all configurations within a given cloud provider.
Multi-user scale should also be tested. For example, one of the solutions has limited multi-thread SQL read capability. This needs to be tested for all GPU solutions to determine whether each can support the volume of users you would need.
MarketMarket analyst review of GPU database vendors. In a rapidly maturing market place, it is important to understand which vendors are fully committed to the GPU database path, with clear roadmaps, solid client-base, adequate support services and strong financial stability. The likelihood of smaller, more agile vendors being acquired by larger companies is highly likely and it’s not impossible that new market entrants come to the fore in the medium term.
InvestigationInvestigation into resilience /HA solutions and support for access controls maturity and flexibility should also be undertaken since these are typically key concerns when scaling solutions up for enterprise-class capability.
•
•
• •
•
•
GPU-Accelerated Databases: addressing FRTB Risk Results Reporting and other performance-at-scale challenges in Financial Services
19
Citihub Consulting is a global, independent IT advisory firm with deep domain expertise across every
layer of the technology stack – from business applications and data platforms down to core
infrastructure. From IT strategy, architecture and solution development, through to cost optimisation,
risk assessment and implementation – our trusted experts deliver the right results for your business.
ForFor us, consultancy is personal. We have a relentless commitment to great execution, integrity and
client success. We aim to redefine perceptions of our industry and our commitment to delivering the
right results for our clients has never changed, even as the business has grown consistently over the
last decades.
For more information, please visit www.citihub.com
Contact UsEMEA
Richard Hamstead
Moor Place
1 Fore Street
London EC2Y 9DT
+44 800 028 1901+44 800 028 1901
North America
Keith Maitland
500 Fifth Ave, Suite 1610
New York, NY 10110
+1 646-780-1150
The Dineen BuildingThe Dineen Building
140 Yonge Street, Suite 200
Toronto, Ontario, M5C 1X6
+1 437 886 8390
Asia Pacific
Steve Rutherford
3 Pickering Street
#01-64
Singapore 048660
+65 3152 2777+65 3152 2777
About Citihub Consulting
GPU-Accelerated Databases: addressing FRTB Risk Results Reporting and other performance-at-scale challenges in Financial Services
20