Embed Size (px)
Citation preview
Cumberland, Lincoln, and Woonsocket Public Schools C-37 in collaboration with the Charles A. Dana Center at the University of Texas at Austin
Grade 4 Mathematics, Quarter 3, Unit 3.1
Identifying and Describing 2-D and 3-D Figures
Overview Number of instructional days: 10 (1 day = 45 minutes)
Content to be learned Mathematical practices to be integrated • Use the number of angles in a shape and
properties of sides (number of sides, length of sides) to identify, describe, and distinguish 2-D shapes (triangles, squares, rectangles, rhombi, trapezoids, hexagons, and octagons).
• Classify 2-D shapes based on the presence or absence of parallel and/or perpendicular attributes.
• Classify angles relative to 90 degrees (more than, less than, equal).
• Identify, compare, or describe 3-D shapes (rectangular prism, triangular prism, cylinders, spheres) using attributes of bases and lateral faces.
• Apply characteristics of similar figures (same shape, but not necessarily the same size) to identify similar figures or solve problems involving similar figures including map scale.
Model with mathematics.
• Draw conclusions, interpret results, and revise models if necessary.
• Analyze mathematical relationships to draw conclusions.
Use appropriate tools strategically.
• Consider appropriate available tools, recognizing their strengths and limitations.
• Use tools and reason to deepen understanding of mathematical concepts.
Essential questions • How can objects be represented and compared
using geometric attributes?
• How can you identify and describe solid figures by identifying faces and bases?
• How can you identify a figure using parallel sides and/or perpendicular sides or edges?
• Given specific attributes or properties, how can you classify a 2-D or 3-D figure?
• Given a 2-D or 3-D figure, how can you describe its attributes?
• What characteristics of similar figures help you identify additional similar figures?
• How do you use the scale of miles to calculate the distance between two points?
• How can you determine if an angle is greater than, less than, or equal to 90 degrees?
• How does knowing your facts help you become more efficient at solving problems?
• When would making an estimate be useful in problem solving?
Grade 4 Mathematics, Quarter 3, Unit 3.1 Identifying and Describing 2-D and 3-D Figures (10 days) Final, July 2011
Cumberland, Lincoln, and Woonsocket Public Schools C-38 in collaboration with the Charles A. Dana Center at the University of Texas at Austin
Routines • Mentally add and subtract three- and four-digit whole numbers that are multiples of 100.
• Multiply whole numbers facts to 100, and calculate related division facts.
• Make reasonable estimates.
Written Curriculum
Grade-Level Expectations
M(G&M)–4–1 Uses properties or attributes of angles (number of angles) or sides (number of sides, length of sides, parallelism, or perpendicularity) to identify, describe, or distinguish among triangles, squares, rectangles, rhombi, trapezoids, hexagons, or octagons; or classify angles relative to 90o as more than, less than, or equal to. (State) M(G&M)–4–3 Uses properties or attributes (shape of bases or number of lateral faces) to identify, compare, or describe three-dimensional shapes (rectangular prisms, triangular prisms, cylinders, or spheres. (State) M(G&M)–4–5 Demonstrates conceptual understanding of similarity by applying scales on maps, or applying characteristics of similar figures (same shape but not necessarily the same size) to identify similar figures, or to solve problems involving similar figures. Describes relationships using models orsc explanations. (State)
Routines
M(N&O)–4–6 Mentally adds and subtracts whole number facts through 20; multiplies whole number facts to a product of 100, and calculates related division facts; adds two-digit whole numbers, combinations of two-digit and 3-digit whole numbers that are multiples of ten, and 4-digit whole numbers that are multiples of 100 (limited to two addends) (e.g., 67 + 24; 320 + 430; 320 + 90; 1,300 + 1,400); and subtracts a one-digit whole number from a two-digit whole number (e.g., 67 – 9); and subtracts combinations of two-digit and three-digit whole numbers that are multiples of ten (e.g., 50 – 20, 230 – 80, 520 – 200). (Local)
(IMPORTANT: The intent of this GLE is to embed mental arithmetic throughout the instructional program, not to teach it as a separate unit.)
M(N&O)–4–7 Makes estimates in a given situation by identifying when estimation is appropriate, selecting the appropriate method of estimation, and evaluating the reasonableness of solutions appropriate to grade level GLEs across content strands. (Local)
(IMPORTANT: The intent of this GLE is to embed estimation throughout the instructional program, not to teach it as a separate unit.)
Grade 4 Mathematics, Quarter 3, Unit 3.1 Identifying and Describing 2-D and 3-D Figures (10 days) Final, July 2011
Cumberland, Lincoln, and Woonsocket Public Schools C-39 in collaboration with the Charles A. Dana Center at the University of Texas at Austin
Clarifying the Standards
Prior Learning
By the end of third grade, students used the number of angles, number of sides, or length of sides and the composition or decomposition of shapes to identify, describe, or distinguish among shapes. They also demonstrated conceptual understanding of similarity by identifying similar shapes.
Current Learning
In grade 4, students develop and demonstrate a conceptual understanding of spatial reasoning and visualizations of octagons that began in a prior unit. Students use properties or attributes of angles or sides to identify, describe, or distinguish among triangles, squares, rectangles, rhombi, trapezoids, hexagons, or octagons. They classify angles relative to 90 degrees as more than, less than, or equal to. Students use properties or attributes to identify, describe, or compare 3-D shapes. They also apply characteristics of similar figures to identify other similar figures or to solve problems involving similar figures.
Daily routines should continue throughout this unit. Students multiply numbers to 100 and calculate related division facts mentally. They also add and subtract two-, three- and four-digit numbers that are multiples of ten. In addition, students make estimates where appropriate and use them to determine whether their answers are reasonable. These daily routines help students build their numerical fluency.
Concepts in this level are addressed at reinforcement and developmental levels.
Future Learning
In grade 5, students will use properties to distinguish and classify different types of triangles (right, acute, obtuse, equiangular, or equilateral) or quadrilaterals (rectangles, squares, rhombi, trapezoids, or parallelograms). By the end of middle school, students will be able to use properties of angle relationships resulting from two or three intersecting lines or two parallel lines cut by a transversal to solve problems. Students will also have experience using the number of vertices and number of edges to identify, compare, or describe 3-D shapes. They will also apply concepts of similarity by solving problems involving scaling up or down and their impact on angle measures, linear dimensions, and areas of polygons and circles when the linear dimensions are multiplied by a constant factor.
Additional Research Findings
According to Principles and Standards for School Mathematics, “As students move from grade 3 to 5, they should develop clarity and precision in describing the properties of geometric objects and then classifying them by these properties into categories such as rectangle, triangle, pyramid, or prism. They can develop knowledge about how geometric shapes are related to one another and begin to articulate geometric arguments about the properties of these shapes” (p. 165).
The book also states, “As students sort, build, draw, model, trace, measure and construct, their capacity to visualize geometric relationships will develop. At the same time they are learning to reason and to make, test, and justify conjectures about these relationships” (p. 165).
Grade 4 Mathematics, Quarter 3, Unit 3.1 Identifying and Describing 2-D and 3-D Figures (10 days) Final, July 2011
Cumberland, Lincoln, and Woonsocket Public Schools C-40 in collaboration with the Charles A. Dana Center at the University of Texas at Austin
Notes About Resources and Materials
Resources will vary by district (i.e., Everyday Mathematics, Investigations, and/or Pearson Scott Foresman).
Cumberland, Lincoln, and Woonsocket Public Schools C-41 in collaboration with the Charles A. Dana Center at the University of Texas at Austin
Grade 4 Mathematics, Quarter 3, Unit 3.2
Spatial Reasoning and Visualization of 2-D and 3-D Representations
Overview Number of instructional days: 5 (1 day = 45 minutes)
Content to be learned Mathematical practices to be integrated • Demonstrate congruency by matching figures
using reflections, translations, and rotations.
• Copy, compare, and draw models of triangles, squares, rectangles, rhombi, trapezoids, hexagons, octagons, and circles.
• Build models of rectangular prisms from two- or three-dimensional representations.
Model with mathematics.
• Apply the mathematics they know to solve problems arising in everyday life, society, and the workplace.
• Make assumptions and approximations to simplify a complicated situation.
Use appropriate tools strategically.
• Select appropriate tools that may be helpful in problem solving.
• Recognizing tools strengths limitations.
• Use tools and reason to deepen conceptual understanding.
Essential questions Routines • How do you know figures are congruent?
• Explain how you can use reflection, translation, and rotation to determine if a figure is congruent to another figure.
• Explain your strategy for building a model of a rectangular prism.
• What is the difference between a 2-D and 3-D shape?
• What are some examples of 2-D shapes in the real world?
• What are some examples of 3-D shapes in the real world?
• How can putting shapes together and taking them apart to form other shapes help you determine congruency?
• Mentally add and subtract three- and four-digit whole numbers that are multiples of 100.
• Multiply whole numbers facts to 100, and calculate related division facts.
• Make reasonable estimates.
Grade 4 Mathematics, Quarter 3, Unit 3.2 Spatial Reasoning and Visualization of Final, July 2011 2-D and 3-D Representations (5 days)
Cumberland, Lincoln, and Woonsocket Public Schools C-42 in collaboration with the Charles A. Dana Center at the University of Texas at Austin
• What do you consider or look for when matching a 2-D representation to a 3-D figure?
• Explain why your drawing accurately represents a trapezoid.
Written Curriculum
Grade-Level Expectations
M(G&M)–4–10 Demonstrates conceptual understanding of spatial reasoning and visualization by copying, comparing, and drawing models of triangles, squares, rectangles, rhombi, trapezoids, hexagons, octagons, and circles; and builds models of rectangular prisms from two- or three-dimensional representations. (Local)
M(G&M)–4–4 Demonstrates conceptual understanding of congruency by matching congruent figures using reflections, translations, or rotations (flips, slides, or turns), or as the result of composing or decomposing shapes using models or explanations. (State)
Routines
M(N&O)–4–6 Mentally adds and subtracts whole number facts through 20; multiplies whole number facts to a product of 100, and calculates related division facts; adds two-digit whole numbers, combinations of two-digit and 3-digit whole numbers that are multiples of ten, and 4-digit whole numbers that are multiples of 100 (limited to two addends) (e.g., 67 + 24; 320 + 430; 320 + 90; 1,300 + 1,400); and subtracts a one-digit whole number from a two-digit whole number (e.g., 67 – 9); and subtracts combinations of two-digit and three-digit whole numbers that are multiples of ten (e.g., 50 – 20, 230 – 80, 520 – 200). (Local)
(IMPORTANT: The intent of this GLE is to embed mental arithmetic throughout the instructional program, not to teach it as a separate unit.)
M(N&O)–4–7 Makes estimates in a given situation by identifying when estimation is appropriate, selecting the appropriate method of estimation, and evaluating the reasonableness of solutions appropriate to grade level GLEs across content strands. (Local)
(IMPORTANT: The intent of this GLE is to embed estimation throughout the instructional program, not to teach it as a separate unit.)
Clarifying the Standards
Prior Learning
By the end of third grade, students demonstrated conceptual understanding of spatial reasoning and visualizing by copying, comparing, and drawing models of triangles, squares, rectangles, rhombi, trapezoids, hexagons, and circles. Students built models of rectangular prisms from 3-D representations. They understood congruency using reflections, translations, and rotations. They also composed and decomposed 2- and 3-dimensional objects using models or explanations.
Grade 4 Mathematics, Quarter 3, Unit 3.2 Spatial Reasoning and Visualization of Final, July 2011 2-D and 3-D Representations (5 days)
Cumberland, Lincoln, and Woonsocket Public Schools C-43 in collaboration with the Charles A. Dana Center at the University of Texas at Austin
Current Learning
In grade 4, students develop and demonstrate a conceptual understanding of spatial reasoning and visualizations of octagons. Students also build models of rectangular prisms from 2-D representations and continue to demonstrate an understanding of congruency using reflections, translations, or rotations.
Daily routines should continue throughout this unit. Students add and subtract whole numbers through 20, multiply numbers to 100, and calculate related division facts mentally. In addition, students make estimates where appropriate and use them to determine whether their answers are reasonable.
Concepts in this level should be addressed at reinforcement and developmental levels. Bloom’s taxonomy levels for this unit are: knowledge (match, draw, describe), comprehension (demonstrate), application (use, compute, apply), synthesize (build), and analysis (compare).
Future Learning
By the end of middle school, students will be able to demonstrate a conceptual understanding of spatial reasoning and visualization by sketching 3-D solids. They will draw nets of rectangular and triangular prisms, cylinders, and pyramids. They will also use nets as a technique for finding surface area and will apply concepts of congruency by solving problems on a coordinate plane, involving reflections, translations, or rotations.
Additional Research Findings
According to Principles and Standards for School Mathematics, students should examine the properties of two-dimensional and three-dimensional shapes as well as the relationship among shapes. They should be encouraged to reason about these properties by using spatial relationships. In addition to studying physical models of these geometric shapes, they should also develop and use mental images. Students at this age are ready to mentally manipulate shapes, and they can benefit from challenging experiences that can be physically verified (p. 168).
Additionally, A Research Companion to Principles and Standards for School Mathematics states that the usual preschool to middle-school curriculum requires little more than recognizing and naming geometric shapes. Through the grades, the curriculum tends to name more geometric objects but not to require deeper levels of analysis (p. 151).
The K-12 Continuums in Mathematics on the RIDE website state that fourth-graders will be expected to represent two- and three-dimensional figures by drawing and building models. Given a two-dimensional representation, students could be asked to create a model of a rectangular prism.
Grade 4 Mathematics, Quarter 3, Unit 3.2 Spatial Reasoning and Visualization of Final, July 2011 2-D and 3-D Representations (5 days)
Cumberland, Lincoln, and Woonsocket Public Schools C-44 in collaboration with the Charles A. Dana Center at the University of Texas at Austin
Notes About Resources and Materials
Resources will vary by district (i.e., Everyday Mathematics, Investigations, Pearson Scott Foresman, etc.).
• K–12 Continuums in Mathematics on the RIDE website
• NECAP released items
Websites that may be helpful
• Aplusmath.com
• Gamequarium.com
• Illuminations.com
• ixl.com/math/
• Mathfactfcafe.com
• Mathplayground.com
• Mathstories.com
• Mathwire.com
• Multiplication.com
• Teachervision.com
Cumberland, Lincoln, and Woonsocket Public Schools C-45 in collaboration with the Charles A. Dana Center at the University of Texas at Austin
Grade 4 Mathematics, Quarter 3, Unit 3.3
Measuring Length Using Customary and Metric Units
Overview Number of instructional days: 5 (1 day = 45–60 minutes)
Content to be learned Mathematical practices to be integrated • Measure length using customary and metric
units.
• Apply conversions of customary units of length.
• Identify when to use estimation and make reasonable estimates.
Uses appropriate tools strategically.
• Decide when tools are appropriate and helpful.
• Use estimations to judge reasonableness of solutions.
Attend to precision.
• Define units of measure consistently and appropriately.
• Label for clarification.
• Strive for accuracy.
Essential questions Routines • How can you estimate and measure length in
customary units?
• How can you estimate and measure length in metric units?
• How do you determine a map scale to find distance in miles/kilometers?
• How can you determine which unit of measure is appropriate to measure a given object?
• Which instrument could you use to measure a given object?
• When is it not appropriate to use estimation?
• What is your strategy for adding/subtracting two-digit numbers that are multiples of ten?
• Mentally add and subtract three- and four-digit whole numbers that are multiples of 100.
• Multiply whole numbers facts to 100, and calculate related division facts.
• Make reasonable estimates.
Grade 4 Mathematics, Quarter 3, Unit 3.3 Measuring Length Using Customary and Metric Units (5 days) Final, July 2011
Cumberland, Lincoln, and Woonsocket Public Schools C-46 in collaboration with the Charles A. Dana Center at the University of Texas at Austin
Written Curriculum
Grade-Level Expectations
M(G&M)–4–7 Measures and uses units of measures appropriately and consistently, and makes conversions within systems when solving problems across the content strands. (State)
See Benchmarks in Appendix B.
Routines
M(N&O)–4–6 Mentally adds and subtracts whole number facts through 20; multiplies whole number facts to a product of 100, and calculates related division facts; adds two-digit whole numbers, combinations of two-digit and 3-digit whole numbers that are multiples of ten, and 4-digit whole numbers that are multiples of 100 (limited to two addends) (e.g., 67 + 24; 320 + 430; 320 + 90; 1,300 + 1,400); and subtracts a one-digit whole number from a two-digit whole number (e.g., 67 – 9); and subtracts combinations of two-digit and three-digit whole numbers that are multiples of ten (e.g., 50 – 20, 230 – 80, 520 – 200). (Local)
(IMPORTANT: The intent of this GLE is to embed mental arithmetic throughout the instructional program, not to teach it as a separate unit.)
M(N&O)–4–7 Makes estimates in a given situation by identifying when estimation is appropriate, selecting the appropriate method of estimation, and evaluating the reasonableness of solutions appropriate to grade level GLEs across content strands. (Local)
(IMPORTANT: The intent of this GLE is to embed estimation throughout the instructional program, not to teach it as a separate unit.)
Clarifying the Standards
Prior Learning
By third grade, students have practiced measuring in terms of inches-to-a-half-inch, feet-to-a-whole inch, centimeter-to-a-whole centimeter, and meter-to-a-whole-centimeter. Students have also worked with converting inches to a foot and centimeters to a meter.
Current Learning
This unit reinforces measurement skills—particularly how to use measuring tools appropriately and how to measure up to grade 3 benchmarks. Students will develop skills in measuring 1 inch to a 1/4 inch, 1 centimeter to 5/10 of a centimeter, 1 meter to 5/10 of a centimeter, and 1 yard. Students are introduced to scale using measures of miles and kilometers, while converting feet to a yard will be a developing skill. Daily routines will consist of mentally adding and subtracting whole numbers that are multiples of ten and making reasonable estimates when appropriate.
Grade 4 Mathematics, Quarter 3, Unit 3.3 Measuring Length Using Customary and Metric Units (5 days) Final, July 2011
Cumberland, Lincoln, and Woonsocket Public Schools C-47 in collaboration with the Charles A. Dana Center at the University of Texas at Austin
Future Learning
By the end of middle school, students will be measuring inches to 1/16 of an inch, centimeters to 1/10 of a centimeter, meters to 1/100 of a meter, and yards, miles, and kilometers (using rate and scale). They will also convert feet to yards, millimeters to centimeters, and millimeters to meters.
Additional Research Findings
According to the K–12 Continuums in Mathematics located on the RIDE website (www.ride.ri.gov/instruction/curriculum/rhodeisland/expectations/algebra.pdf) estimating length is a fundamental skill, as it is the basis for estimation of area and volume. If one can estimate the linear dimensions of an object, s/he can transfer knowledge to compute area and volume. Therefore, it is recommended that lessons on measurement be accompanied by instruction on estimation. Students should understand that measurements of length are approximations and that measurement always involves some form of error. Therefore, it is important to learn to use tools properly and to measure several times in order to decrease the range of this error.
Principles and Standards for School Mathematics emphasizes that an expanded number and range of measurement tools and techniques should be available to students at this level. When using conventional tools, such as rulers and tape measures for measuring conventional length, students will need instruction to learn to use these tools properly (p. 173).
Notes About Resources and Materials
Grade 4 Mathematics, Quarter 3, Unit 3.3 Measuring Length Using Customary and Metric Units (5 days) Final, July 2011
Cumberland, Lincoln, and Woonsocket Public Schools C-48 in collaboration with the Charles A. Dana Center at the University of Texas at Austin
Cumberland, Lincoln, and Woonsocket Public Schools C-49 in collaboration with the Charles A. Dana Center at the University of Texas at Austin
Grade 4 Mathematics, Quarter 3, Unit 3.4
Area and Perimeter of Polygons
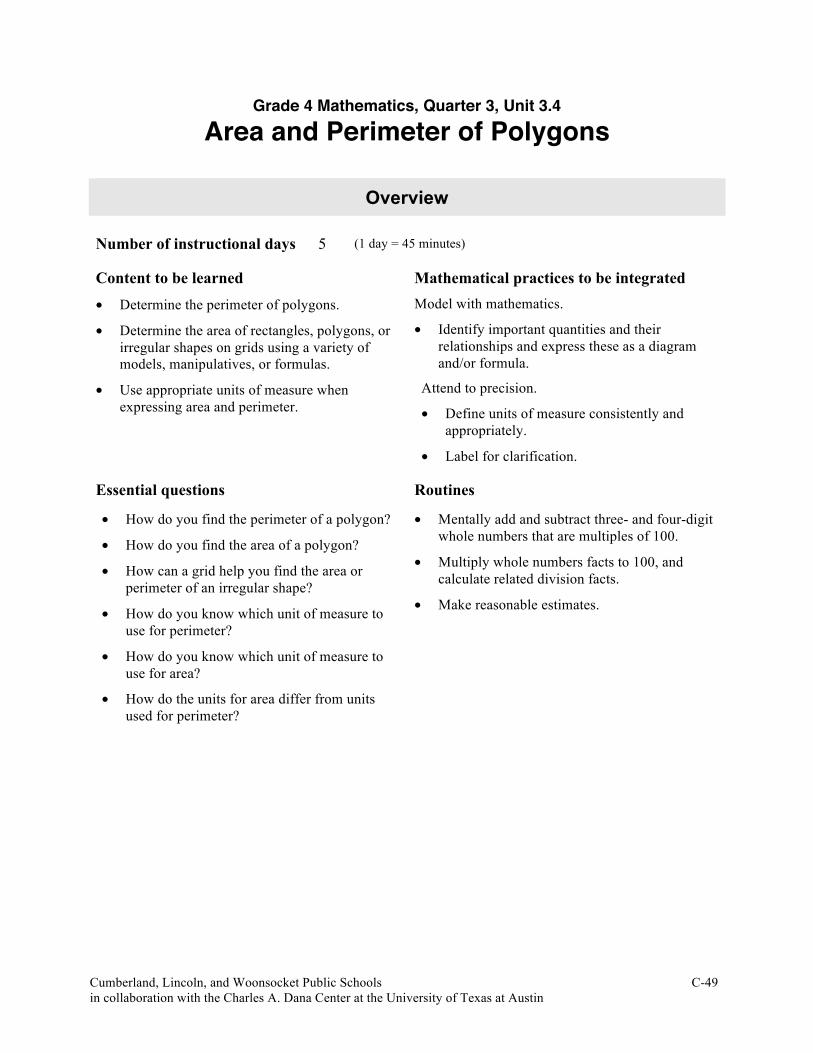
Overview Number of instructional days 5 (1 day = 45 minutes)
Content to be learned Mathematical practices to be integrated • Determine the perimeter of polygons.
• Determine the area of rectangles, polygons, or irregular shapes on grids using a variety of models, manipulatives, or formulas.
• Use appropriate units of measure when expressing area and perimeter.
Model with mathematics.
• Identify important quantities and their relationships and express these as a diagram and/or formula.
Attend to precision.
• Define units of measure consistently and appropriately.
• Label for clarification.
Essential questions Routines
• How do you find the perimeter of a polygon?
• How do you find the area of a polygon?
• How can a grid help you find the area or perimeter of an irregular shape?
• How do you know which unit of measure to use for perimeter?
• How do you know which unit of measure to use for area?
• How do the units for area differ from units used for perimeter?
• Mentally add and subtract three- and four-digit whole numbers that are multiples of 100.
• Multiply whole numbers facts to 100, and calculate related division facts.
• Make reasonable estimates.
Grade 4 Mathematics, Quarter 3, Unit 3.4 Area and Perimeter of Polygons (5 days) Final, July 2011
Cumberland, Lincoln, and Woonsocket Public Schools C-50 in collaboration with the Charles A. Dana Center at the University of Texas at Austin
Written Curriculum
Grade-Level Expectations
M(G&M)–4–6 Demonstrates conceptual understanding of perimeter of polygons, and the area of rectangles, polygons or irregular shapes on grids using a variety of models, manipulatives, or formulas. Expresses all measures using appropriate units. (State)
Routines
M(N&O)–4–6 Mentally adds and subtracts whole number facts through 20; multiplies whole number facts to a product of 100, and calculates related division facts; adds two-digit whole numbers, combinations of two-digit and 3-digit whole numbers that are multiples of ten, and 4-digit whole numbers that are multiples of 100 (limited to two addends) (e.g., 67 + 24; 320 + 430; 320 + 90; 1,300 + 1,400); and subtracts a one-digit whole number from a two-digit whole number (e.g., 67 – 9); and subtracts combinations of two-digit and three-digit whole numbers that are multiples of ten (e.g., 50 – 20, 230 – 80, 520 – 200). (Local)
(IMPORTANT: The intent of this GLE is to embed mental arithmetic throughout the instructional program, not to teach it as a separate unit.)
M(N&O)–4–7 Makes estimates in a given situation by identifying when estimation is appropriate, selecting the appropriate method of estimation, and evaluating the reasonableness of solutions appropriate to grade level GLEs across content strands. (Local)
(IMPORTANT: The intent of this GLE is to embed estimation throughout the instructional program, not to teach it as a separate unit.)
Clarifying the Standards
Prior Learning
By the end of third grade, students had an understanding of perimeter of polygons and the area of rectangles on grids using various models and manipulatives. Students expressed all measures using appropriate units.
Current Learning
In grade 4, students gain a conceptual understanding of perimeter of polygons. They also have an understanding of the area of rectangles. They can find the area of polygons and irregular shapes on grids using a variety of models, manipulatives, and formulas.
Daily routines should continue throughout this unit. Students multiply numbers to 100 and calculate related division facts mentally. They also add and subtract three- and four-digit whole numbers that are multiples of 100. In addition, students make estimates where appropriate and use them to determine whether their answers are reasonable. These routines build mathematical fluency.
Concepts in this level will be addressed at reinforcement and developmental levels. Bloom’s taxonomy levels for this unit are knowledge (determine), application (use), and comprehension (demonstrate).
Grade 4 Mathematics, Quarter 3, Unit 3.4 Area and Perimeter of Polygons (5 days) Final, July 2011
Cumberland, Lincoln, and Woonsocket Public Schools C-51 in collaboration with the Charles A. Dana Center at the University of Texas at Austin
Future Learning
By the end of middle school, students will understand surface area or volume by solving problems involving surface area and volume of rectangular prisms, triangular prisms, cylinders, or cones.
Additional Research Findings
According to Principles and Standards for School Mathematics, “Students in grades 3–5 should measure the attributes of a variety of physical objects and extend their work to measuring more complex attributes including area volume and angle. They will learn that length measurements in particular contexts are given specific names such as perimeter with height, circumference, and distance” (p. 172).
The book also states, “Students in grade 3–5 should develop strategies for determining surface area and volume on the basis of concrete experiences. These concrete experiences are essential in helping students understand the relationship between the measurement of an object and the succinct formula that produces the measurement” (p. 175).
Notes About Resources and Materials
Resources will vary by district (i.e., Everyday Mathematics, Investigations, and/or Pearson Scott Foresman).
Grade 4 Mathematics, Quarter 3, Unit 3.4 Area and Perimeter of Polygons (5 days) Final, July 2011
Cumberland, Lincoln, and Woonsocket Public Schools C-52 in collaboration with the Charles A. Dana Center at the University of Texas at Austin
Cumberland, Lincoln, and Woonsocket Public Schools C-53 in collaboration with the Charles A. Dana Center at the University of Texas at Austin
Grade 4 Mathematics, Quarter 3, Unit 3.5
Analyzing, Organizing, and Displaying Data
Overview Number of instructional days: 10 (1 day = 45 minutes)
Content to be learned Mathematical practices to be integrated • Interpret line plots, tables, bar graphs,
pictographs, or circle graphs to answer questions related to data.
• Analyze data from a given representation to formulate conclusions, make predictions, or solve problems.
• Justify conclusions based on data from a given representation.
• Analyze patterns, trends, and distributions in data using median, mode, and range.
• Organize and display data using tables, line plots, bar graphs, and pictographs to answer questions.
• Solve problems involving combinations/ permutations using counting techniques (tree diagrams or other strategies).
Make sense of problems and persevere in solving them.
• Analyze and explain relationships as displayed in tables and graphs.
• Explain correspondences between verbal descriptions and tables and graphs.
• Identify important quantities and map their relationships using tables and graphs.
Reason abstractly and quantitatively.
• Make sense of quantities and their relationships in problem situations.
• Use varied representations and approaches when solving problems.
Essential questions • What strategies do you use to find median,
mode, and range?
• What information does median, mode, and/or range tell you about data?
• How do you decide what tools to use when gathering, recording, and organizing information?
• How does a tree diagram help you solve a problem involving combinations?
• How does the type of data influence the choice of display?
• What aspects of a graph help people understand and interpret data easily?
• What kinds of questions can and cannot be answered from a graph?
• Given a map, how can you determine the number of paths from point a to point b?
Grade 4 Mathematics, Quarter 3, Unit 3.5 Analyzing, Organizing, and Displaying Data (10 days) Final, July 2011
Cumberland, Lincoln, and Woonsocket Public Schools C-54 in collaboration with the Charles A. Dana Center at the University of Texas at Austin
Routines • Mentally add and subtract three- and four-digit whole numbers that are multiples of 100.
• Multiply whole numbers facts to 100, and calculate related division facts.
• Make reasonable estimates.
Written Curriculum
Grade-Level Expectations
M(DSP)–4–1 Interprets a given representation (line plots, tables, bar graphs, pictographs, or circle graphs) to answer questions related to the data, to analyze the data to formulate or justify conclusions, to make predictions, or to solve problems. (State)
(IMPORTANT: Analyzes data consistent with concepts and skills in M(DSP)–4–2.) M(DSP)–4–2 Analyzes patterns, trends, or distributions in data in a variety of contexts by determining or using measures of central tendency (median or mode), or range. (State)
M(DSP)–4–3 Organizes and displays data using tables, line plots, bar graphs, and pictographs to answer questions related to the data, to analyze the data to formulate or justify conclusions, to make predictions, or to solve problems. (Local)
(IMPORTANT: Analyzes data consistent with concepts and skills in M(DSP)–4–2.)
M(DSP)–4–4 Uses counting techniques to solve problems in context involving combinations or simple permutations (e.g., Given a map – Determine the number of paths from point A to point B.) using a variety of strategies (e.g., organized lists, tables, tree diagrams, orsc others). (State)
Routines
M(N&O)–4–6 Mentally adds and subtracts whole number facts through 20; multiplies whole number facts to a product of 100, and calculates related division facts; adds two-digit whole numbers, combinations of two-digit and 3-digit whole numbers that are multiples of ten, and 4-digit whole numbers that are multiples of 100 (limited to two addends) (e.g., 67 + 24; 320 + 430; 320 + 90; 1,300 + 1,400); and subtracts a one-digit whole number from a two-digit whole number (e.g., 67 – 9); and subtracts combinations of two-digit and three-digit whole numbers that are multiples of ten (e.g., 50 – 20, 230 – 80, 520 – 200). (Local)
(IMPORTANT: The intent of this GLE is to embed mental arithmetic throughout the instructional program, not to teach it as a separate unit.)
M(N&O)–4–7 Makes estimates in a given situation by identifying when estimation is appropriate, selecting the appropriate method of estimation, and evaluating the reasonableness of solutions appropriate to grade level GLEs across content strands. (Local)
(IMPORTANT: The intent of this GLE is to embed estimation throughout the instructional program, not to teach it as a separate unit.)
Grade 4 Mathematics, Quarter 3, Unit 3.5 Analyzing, Organizing, and Displaying Data (10 days) Final, July 2011
Cumberland, Lincoln, and Woonsocket Public Schools C-55 in collaboration with the Charles A. Dana Center at the University of Texas at Austin
Clarifying the Standards
Prior Learning
By the end of third grade, students interpreted a given representation to answer questions related to data, and analyzed data to formulate conclusions or make predictions. They analyzed patterns, trends, or distributions in data using most frequent, least frequent, largest, or smallest. In addition, they identified and described representations that best displayed a given set of data. They also used counting techniques to solve problems involving combinations and permutations.
Current Learning
In grade 4, students interpret a given representation (pictograph and circle graph are new to grade level) to answer questions and analyze data to formulate or justify conclusions, make predictions, or solve problems. Students use median, mode, or range to analyze patterns, trends, or distributions in data. Students also organize and display data using tables, line plots, bar graphs, and pictographs. They use counting techniques to solve problems in context involving combinations or simple permutations.
Daily routines should continue throughout this unit. Students multiply numbers to 100 and calculate related division facts mentally. They also add and subtract two-, three-, and four-digit numbers that are multiples of ten. In addition, students make estimates where appropriate and use them to determine whether their answers are reasonable.
Concepts in this level are addressed at reinforcement and developmental levels.
Future Learning
In grade 5, students will interpret given representations, specifically line graphs, tables, bar graphs, and circle graphs to answer questions, analyze, and make predictions about data. They will also begin to work with mean and range to analyze situations and solve problems. They will organize and display data in tables, bar graphs, and line graphs when answering questions and analyzing data to formulate and justify conclusions. By the end of middle school, students will interpret a given representation, like scatter plots and box-and-whisker plots to analyze data. They will analyze patterns, trends, or distributions in data using measures of central tendency, dispersion, outliers, quartile values, or estimated line of best fit to analyze situations. Students continue to organize and display data using scatter plots to answer questions about data. They also use counting techniques to solve problems in context.
Additional Research Findings
According to Principles and Standards for School Mathematics, “By grades 3–5, students should be developing an understanding of aggregated data. As older students begin to see a set of data as a whole, they need tools to describe this set. Statistics such as measures of center and locations (mean, median, and mode), measures of spread or dispersion (range, standard deviation), and attributes of the shape of the data become useful to students as descriptors” (p. 50).
Grade 4 Mathematics, Quarter 3, Unit 3.5 Analyzing, Organizing, and Displaying Data (10 days) Final, July 2011
Cumberland, Lincoln, and Woonsocket Public Schools C-56 in collaboration with the Charles A. Dana Center at the University of Texas at Austin
Notes About Resources and Materials
Resources will vary by district (i.e., Everyday Mathematics, Investigations, and/or Pearson Scott Foresman).
Cumberland, Lincoln, and Woonsocket Public Schools C-57 in collaboration with the Charles A. Dana Center at the University of Texas at Austin
Grade 4 Mathematics, Quarter 3, Unit 3.6
Designing an Investigation
Overview Number of instructional days: 5 (1 day = 45 minutes)
Content to be learned Mathematical practices to be integrated • Determine appropriate method for collecting
data and collect data (survey, observation, experimentation, etc.) to answer a question or hypothesis.
• Organize and display data appropriately.
• Analyze the data to draw conclusions about the data and make predictions when appropriate.
• Ask a new question to make connections to real-world situations.
Make sense of problems and persevere in solving them.
• Explain correspondences between verbal descriptions and tables and graphs.
• Identify important quantities and map their relationships using tables and graphs.
Construct viable arguments and critique the reasoning of others.
• Make conjectures and build a logical progression of statements to explore the truth of their conjectures.
Essential questions Routines • What are some ways to effectively collect data?
• What two types of data can be collected?
• How did you collect the data? How do you know the method you chose to collect your data is effective?
• How did you choose to organize and display your data? Why is that a good choice? What are some other ways to organize the data?
• What did you learn from your data in this investigation?
• Based on your data, can you make any predictions?
• What questions do you still have about your question?
• Why is it important to have different ways of displaying data?
• Can you name several different ways to display data?
• What information does your data tell you?
• Mentally add and subtract three- and four-digit whole numbers that are multiples of 100.
• Multiply whole numbers facts to 100, and calculate related division facts.
• Make reasonable estimates.
Grade 4 Mathematics, Quarter 3, Unit 3.6 Designing an Investigation (5 days) Final, July 2011
Cumberland, Lincoln, and Woonsocket Public Schools C-58 in collaboration with the Charles A. Dana Center at the University of Texas at Austin
Written Curriculum
Grade-Level Expectations
M(DSP)–4–6 In response to a teacher or student generated question or hypothesis, groups decide the most effective method (e.g., survey, observation, experimentation) to collect the data (numerical or categorical) necessary to answer the question; collects, organizes, and appropriately displays the data; analyzes the data to draw conclusions about the question or hypothesis being tested, and when appropriate makes predictions; and asks new questions and makes connections to real world situations. (Local)
(IMPORTANT: Analyzes data consistent with concepts and skills in M(DSP)–4–2.)
Routines
M(N&O)–4–6 Mentally adds and subtracts whole number facts through 20; multiplies whole number facts to a product of 100, and calculates related division facts; adds two-digit whole numbers, combinations of two-digit and 3-digit whole numbers that are multiples of ten, and 4-digit whole numbers that are multiples of 100 (limited to two addends) (e.g., 67 + 24; 320 + 430; 320 + 90; 1,300 + 1,400); and subtracts a one-digit whole number from a two-digit whole number (e.g., 67 – 9); and subtracts combinations of two-digit and three-digit whole numbers that are multiples of ten (e.g., 50 – 20, 230 – 80, 520 – 200). (Local)
(IMPORTANT: The intent of this GLE is to embed mental arithmetic throughout the instructional program, not to teach it as a separate unit.)
M(N&O)–4–7 Makes estimates in a given situation by identifying when estimation is appropriate, selecting the appropriate method of estimation, and evaluating the reasonableness of solutions appropriate to grade level GLEs across content strands. (Local)
(IMPORTANT: The intent of this GLE is to embed estimation throughout the instructional program, not to teach it as a separate unit.)
Clarifying the Standards
Prior Learning
Prior to fourth grade, students had experience responding to teacher- and/or student-generated questions or hypotheses. Groups of students decided the most effective method to collect the data necessary to answer the question. Students collected, organized, and appropriately displayed the data. They also analyzed the data to draw conclusions about the question or hypothesis being testing. Students made predictions when appropriate.
Current Learning
Students work on responding to a teacher- or student-generated question or hypothesis. Groups of students decide the most effective method (survey, observation, experimentation) to collect the data necessary to answer the question. Students collect, organize, and appropriately display the data that they collect. Students then analyze the data to draw conclusions about the question or hypothesis that is being tested and make predictions when appropriate. Students also ask new questions and make connections to real-world situations.
Grade 4 Mathematics, Quarter 3, Unit 3.6 Designing an Investigation (5 days) Final, July 2011
Cumberland, Lincoln, and Woonsocket Public Schools C-59 in collaboration with the Charles A. Dana Center at the University of Texas at Austin
The content at this level is at the developmental and reinforcement levels. Students were introduced to some of this GLE beginning in grade 2. Students develop more skills as they progress, learning specifically to ask questions and make connections to the real world.
Daily routines continue throughout this unit. Students continue to add and subtract whole numbers through 20, multiply numbers to 100, and calculate related division facts mentally with developing and continuing numerical fluency. Students also continue to make estimates where appropriate.
This is a comprehensive unit in which students are called upon to use multiple skills and strategies as well as multiple methods for thinking in order to complete the unit and the tasks included within it.
Future Learning
In fifth grade, students will continue to develop the skills learned in grade four. By the end of middle school, students will continue to respond to a teacher- or student-generated question or hypothesis. Students will determine the most effective method to collect data; collect, organize, and display data; analyze data to draw conclusions while considering limitations that could affect interpretations; make predictions when appropriate; ask new questions, and make connections to real-world situations.
Additional Research Findings
According to A Research Companion to Principles and Standards for School Mathematics, at a practical level, knowledge of statistics is a fundamental tool in many careers, and without an understanding of how samples are taken and how data are analyzed and communicated, one cannot effectively participate in most of today’s important political debates including those about health care, quality of education, etc. (p. 193).
There is a need for students to work with real data throughout the elementary and middle grades. Understanding data representation and analysis involves many complex issues, such as sorting through what different numbers on a graph mean, choosing appropriate measures to summarize and compare groups, and identifying relationships between variables. Through multiple experiences with a variety of data sets, students begin to develop the tools and concepts they need to use data themselves and to interpret the data they will encounter throughout life (p. 213).
Grade 4 Mathematics, Quarter 3, Unit 3.6 Designing an Investigation (5 days) Final, July 2011
Cumberland, Lincoln, and Woonsocket Public Schools C-60 in collaboration with the Charles A. Dana Center at the University of Texas at Austin
Notes About Resources and Materials
Resources will vary by district (i.e., Everyday Mathematics, Investigations, and/or Pearson Scott Foresman).