Embed Size (px)
Citation preview

GRADE 4 SUPPLEMENTSet E2 Data Analysis: Line Plots
Includes H Activity 1: Tile Toss Distances E2.1
H Activity 2: Endurance Run Results E2.13
H Activity 3: Water Consumption E2.19
H Independent Worksheet 1: Tile Toss Outcomes E2.27
H Independent Worksheet 2: Rope Climb Results E2.29
Skills & Concepts H Use the four operations to solve word problems involving distances, including problems
involving simple fractions, and problems that require expressing measurements given in a
larger unit in terms of a smaller unit.
H Make a line plot to display a data set of measurements in fractions of a unit (1⁄ 2, 1⁄4, 1 ⁄ 8)
H Solve problems involving addition and subtraction of fractions by using information pre-
sented in line plots.
H Add and subtract mixed numbers with like denominators, by replacing each mixed
number with an equivalent fraction, and/or by using properties of operations and the rela-
tionship between addition and subtraction
H Know relative sizes of measurement units within one system of units. Record measurement
equivalents in a table.
P201309

Bridges in Mathematics Grade 4 Supplement
Set E2 Data Analysis: Line Plots
The Math Learning Center, PO Box 12929, Salem, Oregon 97309. Tel. 1 800 575–8130.
© 2013 by The Math Learning Center
All rights reserved.
Prepared for publication on Macintosh Desktop Publishing system.
Printed in the United States of America.
P201309
The Math Learning Center grants permission to classroom teachers to reproduce blackline
masters in appropriate quantities for their classroom use.
Bridges in Mathematics is a standards-based K–5 curriculum that provides a unique blend
of concept development and skills practice in the context of problem solving. It incorpo-
rates the Number Corner, a collection of daily skill-building activities for students.
The Math Learning Center is a nonprofit organization serving the education community.
Our mission is to inspire and enable individuals to discover and develop their mathematical
confidence and ability. We offer innovative and standards-based professional development,
curriculum, materials, and resources to support learning and teaching. To find out more,
visit us at www.mathlearningcenter.org.

Set E2 Data Analysis: Line Plots
© The Math Learning Center Bridges in Mathematics Grade 4 Supplement • E2.1
Set E2 H Activity 1
ACTIVITY
Tile Toss Distances
OverviewThis is the first day of a three-part Fitness Challenge.
Today, students create a line plot from Tile Toss data.
Then, they toss tiles onto a stationary target to demon-
strate their hand-eye coordination and gather measure-
ment data, to the nearest quarter of an inch. They use the
measurement data to construct their own line plots and
analyze their results. Finally, they practice their new learn-
ing with line plot data.
Skills & Concepts H Use the four operations to solve word problems involv-
ing distances, including problems involving simple
fractions, and problems that require expressing measure-
ments given in a larger unit in terms of a smaller unit.
H Make a line plot to display a data set of measurements
in fractions of a unit (1⁄ 2, 1⁄4, 1⁄8)
H Solve problems involving addition and subtraction of
fractions by using information presented in line plots.
H Add and subtract mixed numbers with like denominators,
e.g., by replacing each mixed number with an equivalent
fraction, and/or by using properties of operations and the
relationship between addition and subtraction
You’ll need H Fitness Challenge (pages E2.4, 1 copy for display)
H Target (page E2.5, run a quarter class set and cut apart.)
H Tile Toss Distances (page E2.6, run 1 copy for display)
H Your Tile Toss Distances Record Sheet, pages E2.7 and
E2.8 run a class set, plus 1 copy for display
H Tile Challenge Results (E2.9 and E2.10, run a class set
plus 1 copy for display)
H Student Journals or Journal Grid Page (page E2.11, run
as needed, optional)
H colored tile (2 per student)
H masking tape for a starting line
H measuring tapes, yard sticks, or rulers (about a fourth
of a class set)
Note Save the Fitness Challenge master for use in
Activity 2
Instructions for Tile Toss Distances1. Open today’s lesson by displaying the Fitness Challenge master. Read the context for the next three sessions as a class. Activate students’ prior knowledge of fitness challenges by asking the following ques-tions: What does it mean to be fit? What is a challenge? What type of fitness challenges do you partici-pate in at our school? What else do you know about fitness challenges?
2. Display the Tile Toss Distances overhead revealing only the top portion. Read the introduction and invite students to think about what they notice about the results.
Teacher What do the numbers used in the picture represent?
Lilly The numbers show how far away the tiles are from the target?
Teacher How could we organize this data?
John We could use tallies to represent each toss.

E2.2 • Bridges in Mathematics Grade 4 Supplement © The Math Learning Center
Set E2 Data Analysis: Line Plots
Activity 1 Tile Toss Distances (cont.)
Derrick I agree with John, I notice that if we place the distances in order from least to greatest they would go from 0 feet to 1 1 ⁄2 feet. We are only missing the 1 1 ⁄4 foot distance. I think we should use a t-chart with tallies to represent this data.
Teacher Tallies and t-chart would work. Sometimes mathematicians display numeric data with line plots.
Shawna Would a line plot tell us the distances and how many tiles were within that distance?
3. Ask students to get their journals ready for working with Tile Toss Distances. Remind the class that today they will be recording their values not in inches, but in fractions of a foot. Your students may want to create a table with equivalent fractions of a foot.
foot inches
14 foot 3 inches
12 foot 6 inches
34 foot 9 inches
1 foot 12 inches
4. Reveal the next portion of the teacher master, dealing with the scale for the line plot. Encourage stu-dents to consider the least and greatest data points before plotting the scale. Invite a student to come up and mark the least and greatest data points on the number line and label the points. Then ask students to pair-share what the scale might be- how does each interval increase? For this example, the data is rounded to the nearest 1 ⁄4 of a foot. Once the range, from 0–1 1 ⁄2 feet, has been established, label the line plot while students do the same in their journals.
Teacher Should we be marking and labeling of a foot for this data set even though we have no data for this point?
Sammy I think we should use it to keep the spacing the same, even if we don’t have a measurement that goes there.
Teacher What kind of title could we give to this line plot?
Julie How about “Tile Toss” for the title?
NAME DATE
Set E2 Data Analysis: Line Plots Blackline Run 1 copy for display.
Tile Toss Distances
Here are the results of 4 students participating in the tile toss challenge. The measurements have been rounded to the nearest of a 1
4 foot.
1 foot
foot12
foot12
foot34
foot14
1
foot121
1 Determine a scale for the line plot by first identifying the range. What’s the closest and farthest distance? Now, divide the line into equal parts that will ac-commodate the scale. Create a line plot that has a proper title (including units), the axis labeled correctly, and the data plotted accurately.
Title ______________________________________________
____ ____ ____ ____ ____ ____ ____
____________________________________ (in __________)
2 What is the difference from the closest tile to the target and the furthest?
3 If you were to line up all of the tile distances, what would the total length be?
Tile Toss
Distance feet0 11
412
34
XX X X X X
1 14 1 1
2
XX
Set E2 Data Analysis: Line Plots
© The Math Learning Center Bridges in Mathematics Grade 4 Supplement • E2.3
5. Have students check each other’s work before you move on to the last two questions. Students should have a title, labels, and the tile toss data recorded. Identify the greatest and least distance in the toss, to determine the difference and answer question 3. Then create equivalent fractions with a denominator of 4, to add each of the distances, to find the total distance in the toss event.
6. Now, students will be participating in the tile toss challenge! Group your class, with about 4–6 stu-dents in each group and let them know they will each toss two tiles towards a stationary target. Pass out copies of Your Tile Toss Record Sheet while students tape down the paper target to the floor, and mea-sure a starting line distance from 1 yard away. Brief the students on the rules: • students must stand behind the starting line, and not lean over the line, when they make an under-
handed toss, • every student takes two turns towards the target,• no “redo’s” are allowed unless authorized by the teacher.
7. When groups of students have finished tossing their tile, ask them to measure the distances from the target and record their work on the student page. All measurements should be rounded to the nearest 1 ⁄4 of a foot and represented as a fraction. Encourage group members to work collaboratively to answer the questions on the page, including the difference and total length of the tosses. Monitor their work as needed, encouraging students to work precisely and critique the reasoning of others.
8. When most of the groups are finished, gather students and invite them to share their results. Dur-ing your discussion, focus on the scale of students used for their line plots, the range between the maxi-mum and minimum toss, and their computation, including the concept of mixed numbers and equiva-lent fractions.
9. Pass out the Tile Challenge Results student page and review the tasks together. This task asks students to work to the nearest 1 ⁄8 of a foot. Give students the option of working on this page independently, in pairs, or with their groups. You may want to choose a few students to work with you, based on their needs.
INDEPENDENT WORKSHEET
Use Set E2 Independent Worksheet 1, Tile Toss Outcomes (page E2.27) for additional practice with line plots
Activity 1 Tile Toss Distances (cont.)

E2.4 • Bridges in Mathematics Grade 4 Supplement © The Math Learning Center
Set E2 Data Analysis: Line Plots Blackline
NAME DATE
Fitness Challenge
Your school is participating in a fitness challenge. This test is usually given twice a year, once in the fall and then again in the spring. The challenge is comprised of 2 events: Tile Toss, and Endurance Run
Tile Toss
This activity measures hand-eye coordination. The athlete stands behind the starting line and tosses a tile onto a stationary target. The goal is to land on the outside ring of the target. All tossing is done underhanded. The floor surface will matter. A carpeted floor will provide more friction and slow the tile down; while a tiled floor will allow the tile to bounce and/or slide. Each student is given the opportunity to toss two tiles.
Endurance Run
This activity measures heart/lung endurance. To run the farthest distance, a runner needs to learn proper pacing. Pacing is the average speed you should run to be able to run your best or fastest time.

© The Math Learning Center Bridges in Mathematics Grade 4 Supplement • E2.5
NAME DATE
Set E2 Data Analysis: Line Plots Blackline Run a quarter class set. Cut apart
Target

E2.6 • Bridges in Mathematics Grade 4 Supplement © The Math Learning Center
NAME DATE
Set E2 Data Analysis: Line Plots Blackline Run 1 copy for display.
Tile Toss Distances
Here are the results of 4 students participating in the tile toss challenge. The measurements have been rounded to the nearest of a 1
4 foot.
1 foot
foot12
foot12
foot34
foot14
1
foot121
1 Determine a scale for the line plot by first identifying the range. What’s the closest and farthest distance? Now, divide the line into equal parts that will ac-commodate the scale. Create a line plot that has a proper title (including units), the axis labeled correctly, and the data plotted accurately.
Title ________________________________________
____ ____ ____ ____ ____ ____ ____
_____________________________ (in __________)
2 What is the difference from the closest tile to the target and the furthest?
3 If you were to line up all of the tile distances, what would the total length be?

© The Math Learning Center Bridges in Mathematics Grade 4 Supplement • E2.7
NAME DATE
Set E2 Data Analysis: Line Plots Blackline Run a class set.
Your Tile Toss Distances Record Sheet
Each group member will toss 2 tiles towards the target. The goal is to land within or on the target ring. Any tile that lands partially on the ring counts as a hit and should receive a score of 0 feet from the target.
1 Measure the tiles that land outside of the target to the nearest of a foot. Record your group data in the table below.
Student Name Toss NumberDistance from the Target
(in fractions/feet)
Toss # 1
Toss # 2
Toss # 1
Toss # 2
Toss # 1
Toss # 2
Toss # 1
Toss # 2
Toss # 1
Toss # 2
Toss # 1
Toss # 2
2 What was the tile distance in feet, closest to the target? ____________
3 What was the tile distance in feet, furthest from the target? ____________
4 What is the difference from the closest and furthest distance? Show your work.
The distance is ____________ (Continued on next page.)

E2.8 • Bridges in Mathematics Grade 4 Supplement © The Math Learning Center
NAME DATE
Set E2 Data Analysis: Line Plots Blackline Run a class set.
5 Determine a scale for the line plot. Then divide the line into equal parts that would support that scale. (Reminder the line plot needs to include the least and greatest data points).
Title ___________________________________________________________________
____ ____ ____ ____ ____ ____ ____ ____ ____ ____ ____
________________________________________________ (in ______________)
6 Plot the results of the tile toss, placing an X over the correct label for each measurement collected. If a number is repeated, place one X over the other in a vertical column.
7 Record a title for the line plot and include a unit of measurement.
8 Now use your data to answer the following questions:
a How many tile landed on and/or less than 12 of a foot from the target? _______
b How many tile landed further than 12 of a foot from the target? _______
c How many tiles are represented in the line plot? _______
d What is the combined distance of the group’s tile toss results? Label the unit and show your work.
The total distance is __________________
Your Tile Toss Distances (cont.)

© The Math Learning Center Bridges in Mathematics Grade 4 Supplement • E2.9
NAME DATE
Set E2 Data Analysis: Line Plots Blackline Run a class set, plus 1 for display.
Tile Challenge Results
This class participated in the tile toss challenge and measured to the closest 18 of a
foot. Complete the missing data and use the line plot below to answer the following questions.
Tile Challenge Results
X
X X X
X X X X X X
____18
28
38
____ ____68
78
88
________________________________________________ (in feet)
1 How many tiles are represented on this line plot? _______________
2 How many tiles landed on the target? _______________
3 Did more tiles land on 78 of a foot or 6
8 of a foot? _______________
4 What is the difference between the furthest and closest tiles to the target? Show your work.
The difference is _______________
(Continued on next page.)

E2.10 • Bridges in Mathematics Grade 4 Supplement © The Math Learning Center
NAME DATE
Set E2 Data Analysis: Line Plots Blackline Run a class set, plus 1 for display.
Tile Challange Results (cont.)
5 What is the total distance of all the tiles added together? Show your work.
The total distance is _______________
CHALLENGE
6 When you place the distances in order from least to greatest, which distance is the middle distance (median) attained by this class? Explain how you know.

© The Math Learning Center Bridges in Mathematics Grade 4 Supplement • E2.11
Set E2 Data Analysis: Line Plots Blackline
NAME DATE
Journal Page Grid

E2.12 • Bridges in Mathematics Grade 4 Supplement © The Math Learning Center

Set E2 Data Analysis: Line Plots
© The Math Learning Center Bridges in Mathematics Grade 4 Supplement • E2.13
Set E2 H Activity 2
ACTIVITY
Endurance Run Results
OverviewToday, students use color tiles to represent a scale of one-
half and one-quarter of a mile. They make a line plot, solve
problems involving addition and subtraction of fractions, and
add and subtract mixed numbers with like denominators.
Skills & Concepts H Use the four operations to solve word problems
involving distances, including problems involving
simple fractions, and problems that require express-
ing measurements given in a larger unit in terms of a
smaller unit.
H Make a line plot to display a data set of measurements
in fractions of a unit (1⁄ 2, 1⁄4, 1 ⁄ 8)
H Solve problems involving addition and subtraction of
fractions by using information presented in line plots.
H Add and subtract mixed numbers with like denomina-
tors, e.g., by replacing each mixed number with an equiv-
alent fraction, and/or by using properties of operations
and the relationship between addition and subtraction
You’ll need H Fitness Challenge (page E2.4, saved from Activity 1)
H Endurance Run Results (page E2.16, run a class set plus
1 copy for display.)
H More Endurance Run Results (pages E.2.17 and E2.18,
run a class set plus 1 copy for display.)
H color tiles (class set)
Instructions for Endurance Run Results1. Post the Endurance Run portion of the Fitness Challenge master from Activity 1 and review the description of this event. Let students know that today they will analyze the results of two different classes’ results.
2. Display only the data at the top of the Endurance Run Results master. Ask students to use tile to rep-resent each 1⁄4 of a mile the students completed. For example, if the distance was 3⁄4 of a mile, the stu-dents would make a column of 3 tiles. Have students work in groups to represent all 8 of the distances, using this scale (1 tile = 1⁄4 mile) to construct their model. Encourage students to discuss and demon-strate their understanding of fractions in their group. Work through any misconceptions as a class.
E2.14 • Bridges in Mathematics Grade 4 Supplement © The Math Learning Center
Set E2 Data Analysis: Line Plots
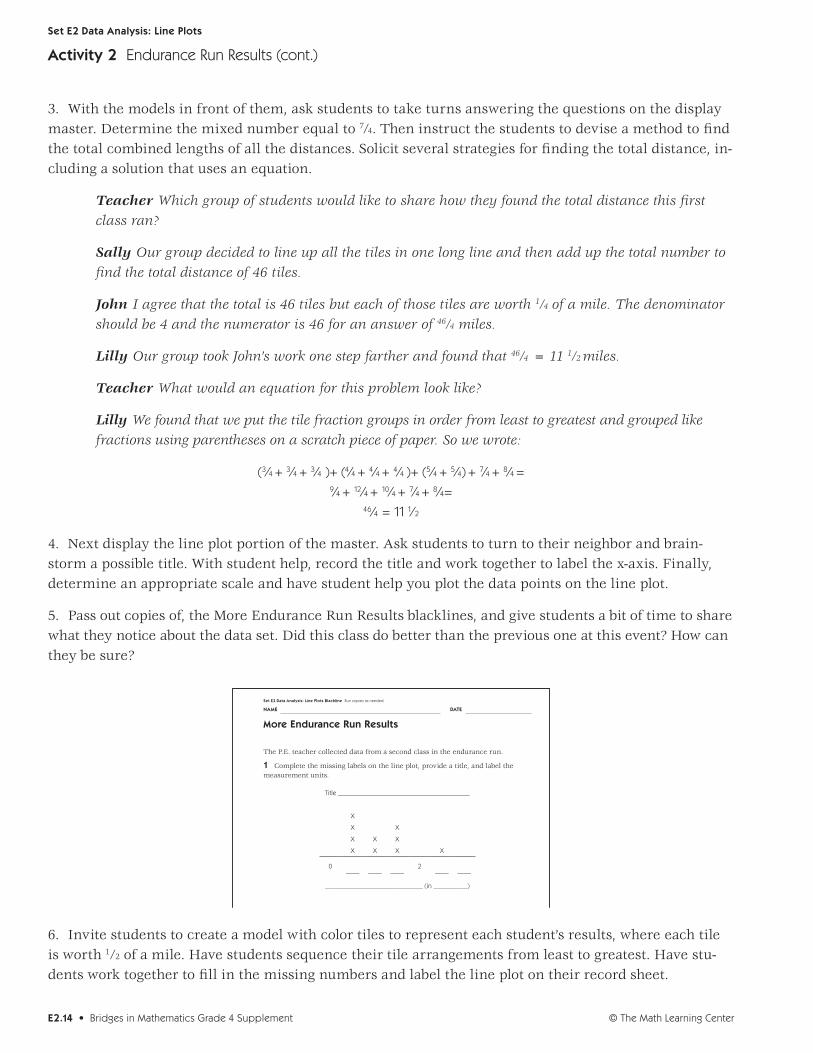
3. With the models in front of them, ask students to take turns answering the questions on the display master. Determine the mixed number equal to 7⁄4. Then instruct the students to devise a method to find the total combined lengths of all the distances. Solicit several strategies for finding the total distance, in-cluding a solution that uses an equation.
Teacher Which group of students would like to share how they found the total distance this first class ran?
Sally Our group decided to line up all the tiles in one long line and then add up the total number to find the total distance of 46 tiles.
John I agree that the total is 46 tiles but each of those tiles are worth 1⁄4 of a mile. The denominator should be 4 and the numerator is 46 for an answer of 46⁄4 miles.
Lilly Our group took John’s work one step farther and found that 46⁄4 = 11 1⁄2 miles.
Teacher What would an equation for this problem look like?
Lilly We found that we put the tile fraction groups in order from least to greatest and grouped like fractions using parentheses on a scratch piece of paper. So we wrote:
(3⁄4 + 3⁄4 + 3⁄4 )+ (4⁄4 + 4⁄4 + 4⁄4 )+ (5⁄4 + 5⁄4) + 7⁄4 + 8⁄4 = 9⁄4 + 12⁄4 + 10⁄4 + 7⁄4 + 8⁄4=
46⁄4 = 11 1⁄ 2
4. Next display the line plot portion of the master. Ask students to turn to their neighbor and brain-storm a possible title. With student help, record the title and work together to label the x-axis. Finally, determine an appropriate scale and have student help you plot the data points on the line plot.
5. Pass out copies of, the More Endurance Run Results blacklines, and give students a bit of time to share what they notice about the data set. Did this class do better than the previous one at this event? How can they be sure?
© The Math Learning Center Bridges in Mathematics Grade 4 Supplement • 71.2E
NAME DATE
Set E2 Data Analysis: Line Plots Blackline Run copies as needed.
More Endurance Run Results
The P.E. teacher collected data from a second class in the endurance run.
1 Complete the missing labels on the line plot, provide a title, and label the measurement units.
Title _______________________________________
X
X X
X X X
X X X X
0____ ____ ____
2____ ____
_____________________________ (in __________)
Use the data above to answer the following questions.
2 How many students ran 12 of a mile? _____________
3 Which distance did more students complete 32 or 1
2 of a mile? _____________
4 What is the difference between the furthest and least distance run? Show your work.
The difference is _____________
(Continued on next page.)
6. Invite students to create a model with color tiles to represent each student’s results, where each tile is worth 1⁄2 of a mile. Have students sequence their tile arrangements from least to greatest. Have stu-dents work together to fill in the missing numbers and label the line plot on their record sheet.
Activity 2 Endurance Run Results (cont.)

Set E2 Data Analysis: Line Plots
© The Math Learning Center Bridges in Mathematics Grade 4 Supplement • E2.15
Activity 2 Endurance Run Results (cont.)
7. Answer questions two and three as a class and then invite students to record an equation to match the model for question three. Review that in adding or subtracting fractions, a common denominator is useful.
8. Give students an opportunity to work with their neighbors to construct a model and/or equation to show how they would efficiently add the total distances ran by this class. If some groups complete the work quickly, you may want to invite them to take on the challenge problems while they wait for the rest of the class to finish. As students are working, look for a variety of strategies to share with the class.
9. When a majority of students are done, begin the presentations, inviting students to ask questions and compare different explanations. Ask, what is the same or different about the work?
10. If there is time, invite the students who completed the challenge questions to share their solution strategies.

E2.16 • Bridges in Mathematics Grade 4 Supplement © The Math Learning Center
NAME DATE
Set E2 Data Analysis: Line Plots Blackline Ru a class set, plus 1 for display.
Endurance Run Results
The P.E. teacher recorded the first class’ results in a fraction of a mile. The data below shows how far each of the students ran in 20 minutes.
34
74
44
54
34
44
84
54
34
44
1 What is the shortest distance a student ran? ______________
2 What is the longest distance a student ran? _______________
3 What mixed number is the same as 74 of a mile? ___________________
4 What is the total distance these students were able to run in 20 minutes? Show your work.
Students ran ______________ miles.
5 Use the data above to create a line plot that has a proper title (including units), the axis labeled correctly, and the data points plotted accurately.
Title ___________________________________________________________
____ ____ ____ ____ ____ ____ ____ ____ ____ ____
________________________________________ (in __________)

© The Math Learning Center Bridges in Mathematics Grade 4 Supplement • E2.17
NAME DATE
Set E2 Data Analysis: Line Plots Blackline Run a class set, plus 1 for display.
More Endurance Run Results
The P.E. teacher collected data from a second class in the endurance run.
1 Complete the missing labels on the line plot, provide a title, and label the measurement units.
Title _______________________________________
X
X X
X X X
X X X X
0____ ____ ____
2____ ____
_____________________________ (in __________)
Use the data above to answer the following questions.
2 How many students ran 12 of a mile? _____________
3 Which distance did more students complete 32 or 1
2 of a mile? _____________
4 What is the difference between the furthest and least distance run? Show your work.
The difference is _____________
(Continued on next page.)

E2.18 • Bridges in Mathematics Grade 4 Supplement © The Math Learning Center
Set E2 Data Analysis: Line Plots Blackline
NAME DATE
5 What is the total number of miles run by the second class? Show your work.
The total is _____________
CHALLENGE
6 The P.E. teacher and the Principal wrote what they thought was the total dis-tance run by this class. Explain why or why not you think each statement makes sense mathematically.
a P.E. Teacher I think 2 12 miles is an outlier and I am going to ignore that
number. Therefore, the numbers go from 12 to 1 1
2 and so I found the answer12 + 1
2 + 12 + 1
2 + 22 + 2
2 + 32 + 3
2 = 172 = 8 1
2 miles
Agree or Disagree? ___________________________
Why?
b Principal I calculated the following way to find the total distance.12 + 1
2 + 12 + 1
2 + 22 + 2
2 + 32 + 3
2 + 52 = 21
2 = 10 12 miles
Agree or Disagree? ___________________________
Why?
7 Convert each quarter mile into yards and feet.
Miles 14
24 = 1
234
44 = 1
Yards 440
Feet 5,280
Endurance Results Challenge (cont.)

Set E2 Data Analysis: Line Plots
© The Math Learning Center Bridges in Mathematics Grade 4 Supplement • E2.19
Set E2 H Activity 3
ACTIVITY
Water Consumption
OverviewThis is the final day of the Fitness Challenge lesson
sequence. Today, students use capacity units (cups, pints
and quarts), to create a line plot. They also add and sub-
tract fractions and mixed numbers with like denominators.
Skills & Concepts H Know relative sizes of measurement units within one
system of units. Record measurement equivalents in
a table.
H Use the four operations to solve word problems
involving distances, including problems involving
simple fractions, and problems that require express-
ing measurements given in a larger unit in terms of a
smaller unit.
H Make a line plot to display a data set of measurements
in fractions of a unit (1⁄ 2, 1⁄4, 1 ⁄ 8)
H Solve problems involving addition and subtraction of
fractions by using information presented in line plots.
H Add and subtract mixed numbers with like denomina-
tors, by replacing each mixed number with an equiva-
lent fraction, and/or by using properties of operations
and the relationship between addition and subtraction
H Solve word problems involving addition of fractions
referring to the same whole and having like denomina-
tors, using visual fraction models and equations to
represent the problem.
You’ll need H Water Consumption (page E2.22, 1 copy for display)
H Water Consumption Outcome Record Sheet (pages
E2.24 and E2.25, run a class set, plus 1 for display)
H a 1-gallon container, two 1-quart containers, two
1-pint containers, and a 1-cup container (see Advance
Preparation)
Advance Preparation Access the quart and cup con-
tainers from the Number Corner materials, and pint and
gallon containers from home.
Instructions for Water Consumption1. Display the top portion of the Water Consumption master and have a student read the introductory paragraph. Ask student pairs to share what information is given in the problem. Students will likely no-tice the fractions have common denominators and the values are written as improper fractions.
E2.20 • Bridges in Mathematics Grade 4 Supplement © The Math Learning Center
Set E2 Data Analysis: Line Plots
E2.22 • Bridges in Mathematics Grade 4 Supplement © The Math Learning Center
NAME DATE
Set E2 Data Analysis: Line Plots Blackline Run 1 copy for display
Water Consumption
Every student was given a water bottle before they participated in the run. Each water bottle contained 1 pint of water. Students were encouraged to refill their wa-ter bottles anytime. The results below show how much water the first class drank.
74
14
74
34
74
04
24
64
44
34
1 Use the data to create a line plot that has a proper title (including units), the axis labeled correctly, and the data plotted accurately.
Title ______________________________________________
____ ____ ____ ____ ____ ____ ____ ____
__________________________________ (in ____________)
2 What is the total amount of water drank by the first class in pints? Show your work.
The class drank ____________ pints(Continued on next page.)
14
24
34
44
54
64
74
04
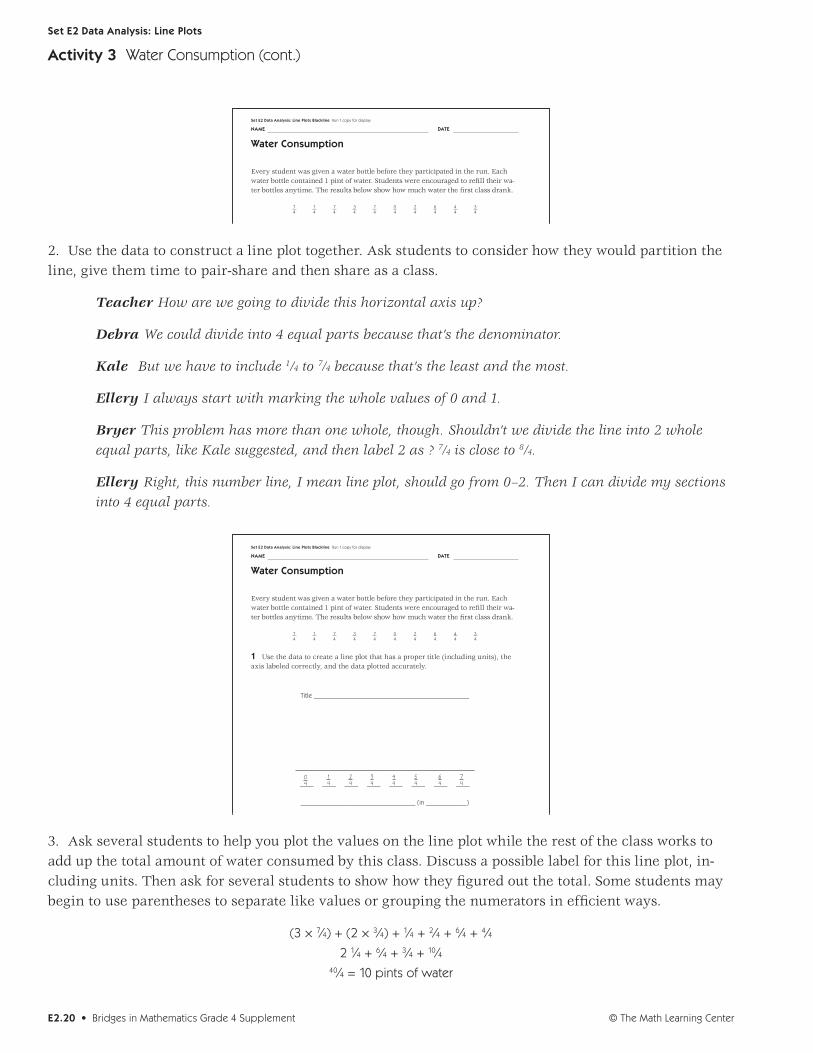
2. Use the data to construct a line plot together. Ask students to consider how they would partition the line, give them time to pair-share and then share as a class.
Teacher How are we going to divide this horizontal axis up?
Debra We could divide into 4 equal parts because that’s the denominator.
Kale But we have to include 1⁄4 to 7⁄4 because that’s the least and the most.
Ellery I always start with marking the whole values of 0 and 1.
Bryer This problem has more than one whole, though. Shouldn’t we divide the line into 2 whole equal parts, like Kale suggested, and then label 2 as ? 7⁄4 is close to 8⁄4.
Ellery Right, this number line, I mean line plot, should go from 0–2. Then I can divide my sections into 4 equal parts.
E2.22 • Bridges in Mathematics Grade 4 Supplement © The Math Learning Center
NAME DATE
Set E2 Data Analysis: Line Plots Blackline Run 1 copy for display
Water Consumption
Every student was given a water bottle before they participated in the run. Each water bottle contained 1 pint of water. Students were encouraged to refill their wa-ter bottles anytime. The results below show how much water the first class drank.
74
14
74
34
74
04
24
64
44
34
1 Use the data to create a line plot that has a proper title (including units), the axis labeled correctly, and the data plotted accurately.
Title ______________________________________________
____ ____ ____ ____ ____ ____ ____ ____
__________________________________ (in ____________)
2 What is the total amount of water drank by the first class in pints? Show your work.
The class drank ____________ pints(Continued on next page.)
14
24
34
44
54
64
74
04
3. Ask several students to help you plot the values on the line plot while the rest of the class works to add up the total amount of water consumed by this class. Discuss a possible label for this line plot, in-cluding units. Then ask for several students to show how they figured out the total. Some students may begin to use parentheses to separate like values or grouping the numerators in efficient ways.
(3 × 7⁄4) + (2 × 3⁄4) + 1⁄4 + 2⁄4 + 6⁄4 + 4⁄4
2 1⁄4 + 6⁄4 + 3⁄4 + 10⁄4 40⁄4 = 10 pints of water
Activity 3 Water Consumption (cont.)

Set E2 Data Analysis: Line Plots
© The Math Learning Center Bridges in Mathematics Grade 4 Supplement • E2.21
Student “I like to make ten, so I found all the ways I could add up the numerators to make ten…and this time it added up perfectly!”
(7⁄4 + 3⁄4) + (7⁄4 + 3⁄4) + (6⁄4 + 4⁄4) + (7⁄4 + 1⁄4 + 2⁄4) that equals 10, 20, 30 , 40, 40⁄4 ths.
4. Record the total in pints and then ask students to turn and talk to a neighbor on how they would convert pints to cups. Choose a few students to share their thinking and record the answer for question three. Ask students to identify the most and least water consumed, and determine the difference, 7⁄4 – 0⁄4 = 7⁄4.
5. Pass out copies of , Water Consumption Outcomes. Read the top half of the directions as a class. Have students turn to a partner and restate what they are being asked to do. Use the capacity containers to com-plete the equivalence table together and determine the total water consumption in quarts.
6. For question 3 solicit several student solutions for adding up the fractions of a quart.
Bryer I lined up the fractions from the least to the greatest, and then added it up.
1⁄4 + 1⁄4 + 2⁄4 + 2⁄4 + 2⁄4 + 3⁄4 + 4⁄4 + 1 1⁄4 + 1 2⁄4 + 1 2⁄4 = 3 20⁄4
Debra I agree with you Bryer, but I reduced 20⁄4 = 5 quarts. I divided 20 by 4. That gave me 5 quarts. I add 3 plus 5 quarts to get 8 quarts.
Sammy Our group had done something similar but instead we left all the fractions as fourths and came up with:
1⁄4 + 1⁄4 + 2⁄4 + 2⁄4 + 2⁄4 + 3⁄4 + 4⁄4 + 5⁄4 + 6⁄4 + 6⁄4 = 32⁄4 = 8 quarts
7. Once students determine the total number of quarts of water, have them share their thinking for converting 8 quarts to pint units—8 quarts = ? pints?
INDEPENDENT WORKSHEET
Assign Set E2 Independent Worksheet 2, Rope Climb Results (page E2.29) for more practice with line plots.
Activity 3 Water Consumption (cont.)

E2.22 • Bridges in Mathematics Grade 4 Supplement © The Math Learning Center
NAME DATE
Set E2 Data Analysis: Line Plots Blackline Run 1 copy for display
Water Consumption
Every student was given a water bottle before they participated in the run. Each water bottle contained 1 pint of water. Students were encouraged to refill their wa-ter bottles anytime. The results below show how much water the first class drank.
74
14
74
34
74
04
24
64
44
34
1 Use the data to create a line plot that has a proper title (including units), the axis labeled correctly, and the data plotted accurately.
Title ______________________________________________
____ ____ ____ ____ ____ ____ ____ ____
__________________________________ (in ____________)
2 What is the total amount of water drank by the first class in pints? Show your work.
The class drank ____________ pints(Continued on next page.)

© The Math Learning Center Bridges in Mathematics Grade 4 Supplement • E2.23
NAME DATE
Set E2 Data Analysis: Line Plots Blackline Run 1 copy for display.
3 What is the total amount of water drunk by the first class in cups? Show your work.
The class drank ____________ cups
4 The most and the least
a What is the most water a student drank? ____________
b What is the least? ____________
c What is the difference? ____________
Water Consumption (cont.)

E2.24 • Bridges in Mathematics Grade 4 Supplement © The Math Learning Center
NAME DATE
Set E2 Data Analysis: Line Plots Blackline Run a class set and 1 copy for display.
Water Consumption Outcomes
The second class received 1 quart water bottles for the run.
1 The results below show how much water the second class drank. Complete the missing labels and label the line plot and units.
Title ____________________________________________________
X
X X X
X X X X X X
04 ____ ____ ____ ____ ____ ____ ____
84
________________________________________ (in __________)
Use the data below to answer the following questions.
2 How many students received a water bottle? ____________
3 Use the containers to convert the capacity units and complete the table.
Quarts 14
24 = 1
234
44 = 1
Pints 1 1 12
Cups
(Continued on next page.)

© The Math Learning Center Bridges in Mathematics Grade 4 Supplement • E2.25
NAME DATE
Set E2 Data Analysis: Line Plots Blackline Run a class set and 1 copy for display.
4 What is the total amount of water drunk by the second class in quarts? Show your work.
The class drank ____________ quarts
5 What is the total amount of water drunk by the second class in pints? Show your work.
The class drank ____________ pints
Water Consumption Outcomes (cont)

E2.26 • Bridges in Mathematics Grade 4 Supplement © The Math Learning Center

© The Math Learning Center Bridges in Mathematics Grade 4 Supplement • E2.27
NAME DATE
Set E2 Data Analysis: Line Plots Blackline Use anytime after Set E2, Activity 3.
Set E2 H Independent Worksheet 1
INDEPENDENT WORKSHEET
Tile Toss Outcomes
Another class participated in the tile toss challenge and had the following outcomes.
1 34
14 1
14 1 3
4 1 12
1 1 14
34
14
1 Use the data above to complete the line plot, including a title and unit of measure.
Title ____________________________________________________
014
12
34 1 1 1
4 1 12 1 3
42
______________________________________ (in __________)
2 Answer the following questions.
a How many tiles were tossed in this group? ______________________
b How many tiles landed of a foot away from the target? _____________________
(Continued on next page.)

E2.28 • Bridges in Mathematics Grade 4 Supplement © The Math Learning Center
Set E2 Data Analysis: Line Plots Blackline
NAME DATE
c Did more tiles land less than 1 foot away or more than 1 foot away from the target?
How do you know?
d What is the difference between the closest tile to the target and the furthest? Show your work.
The difference is ____________________
Tile Toss Outcomes (cont.)

© The Math Learning Center Bridges in Mathematics Grade 4 Supplement • E2.29
NAME DATE
Set E2 Data Analysis: Line Plots Blackline Use anytime after Set E2, Activity 3.
Set E2 H Independent Worksheet 2
INDEPENDENT WORKSHEET
Rope Climb Results
Your P.E. teacher has challenged your class to a rope climb! There are 8 blue pieces of tape equally spaced, and wrapped around the rope to mark off the distances. The following results represent the goal levels that were touched by your class.
18
08
18
48
28
38
88
48
68
78
1 Use the data to create a line plot that has a proper title and the axis labeled correctly. Plot the data accurately.
Title ______________________________________________
____ ____ ____ ____ ____ ____ ____ ____
___________________________________ (in __________)
2 How many students stopped at the goal line 38? ____________
3 At which goal level(s) did the most students stop? ____________
4 How many students touched or even passed 38 of the rope? ____________
5 What was the total distance combined for climbing the rope? ____________

E2.30 • Bridges in Mathematics Grade 4 Supplement © The Math Learning Center


![GISS-E2.1: Configurations and Climatologyoceans.mit.edu/JohnMarshall/wp-content/uploads/2020/01/GISS_Kell… · 86 R and GISS-E2-H in CMIP5 [Schmidt et al., 2014], and GISS-E2.1-G](https://img.pdfslide.net/doc/110x75/5f165c6a8b5d166c5d052b56/giss-e21-conigurations-and-86-r-and-giss-e2-h-in-cmip5-schmidt-et-al-2014.jpg)