Embed Size (px)
Citation preview
TEKSING TOWARD STAAR © 2014
GRADE 6
Student Book
®MATHEMATICS
TEKSING TOWARD STAAR
Six Weeks 1Lesson 1
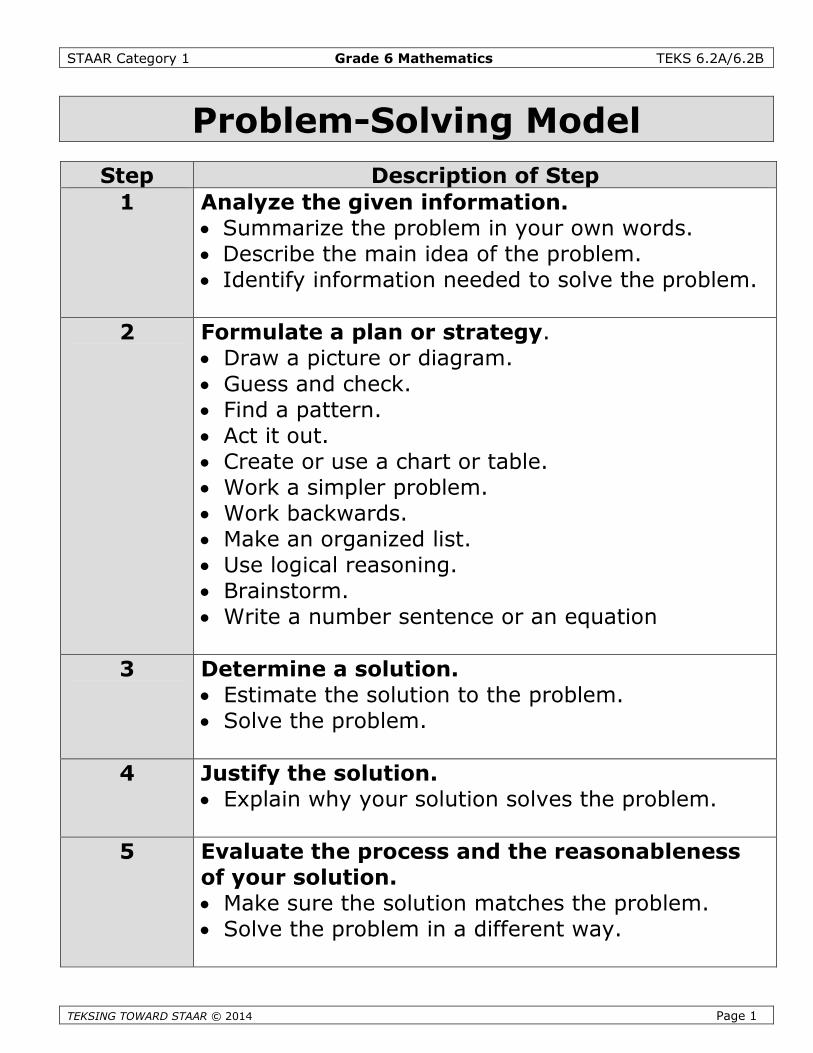
STAAR Category 1 Grade 6 Mathematics TEKS 6.2A/6.2B
TEKS
Problem-Solving Model
Step Description of Step1 Analyze the given information.
Summarize the problem in your own words. Describe the main idea of the problem. Identify information needed to solve the problem.
2 Formulate a plan or strategy. Draw a picture or diagram. Guess and check. Find a pattern. Act it out. Create or use a chart or table. Work a simpler problem. Work backwards. Make an organized list. Use logical reasoning. Brainstorm. Write a number sentence or an equation
3 Determine a solution. Estimate the solution to the problem. Solve the problem.
4 Justify the solution. Explain why your solution solves the problem.
ING TOWARD STAAR © 2014 Page 1
5 Evaluate the process and the reasonablenessof your solution. Make sure the solution matches the problem. Solve the problem in a different way.
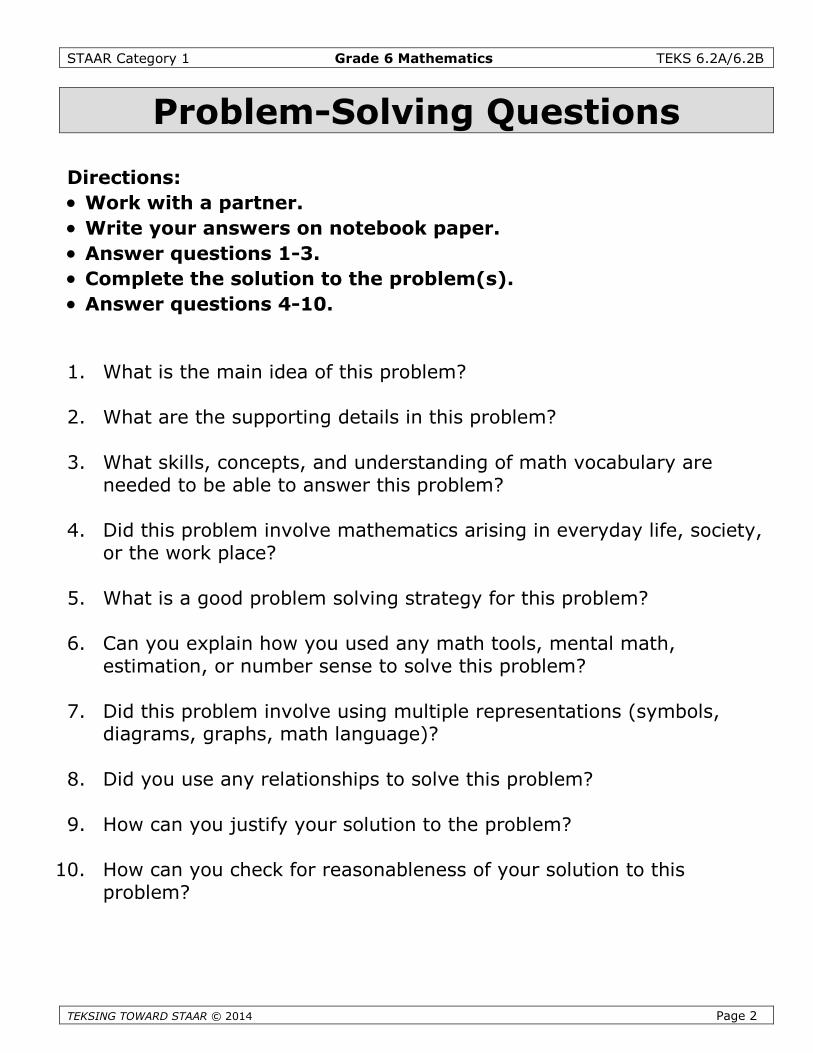
STAAR Category 1 Grade 6 Mathematics TEKS 6.2A/6.2B
TEKSING TOWARD STAAR © 2014 Page 2
Problem-Solving Questions
Directions:
Work with a partner.
Write your answers on notebook paper.
Answer questions 1-3.
Complete the solution to the problem(s).
Answer questions 4-10.
1. What is the main idea of this problem?
2. What are the supporting details in this problem?
3. What skills, concepts, and understanding of math vocabulary areneeded to be able to answer this problem?
4. Did this problem involve mathematics arising in everyday life, society,or the work place?
5. What is a good problem solving strategy for this problem?
6. Can you explain how you used any math tools, mental math,estimation, or number sense to solve this problem?
7. Did this problem involve using multiple representations (symbols,diagrams, graphs, math language)?
8. Did you use any relationships to solve this problem?
9. How can you justify your solution to the problem?
10. How can you check for reasonableness of your solution to thisproblem?
STAAR Category 1 Grade 6 Mathematics TEKS 6.2A/6.2B
TEKSING
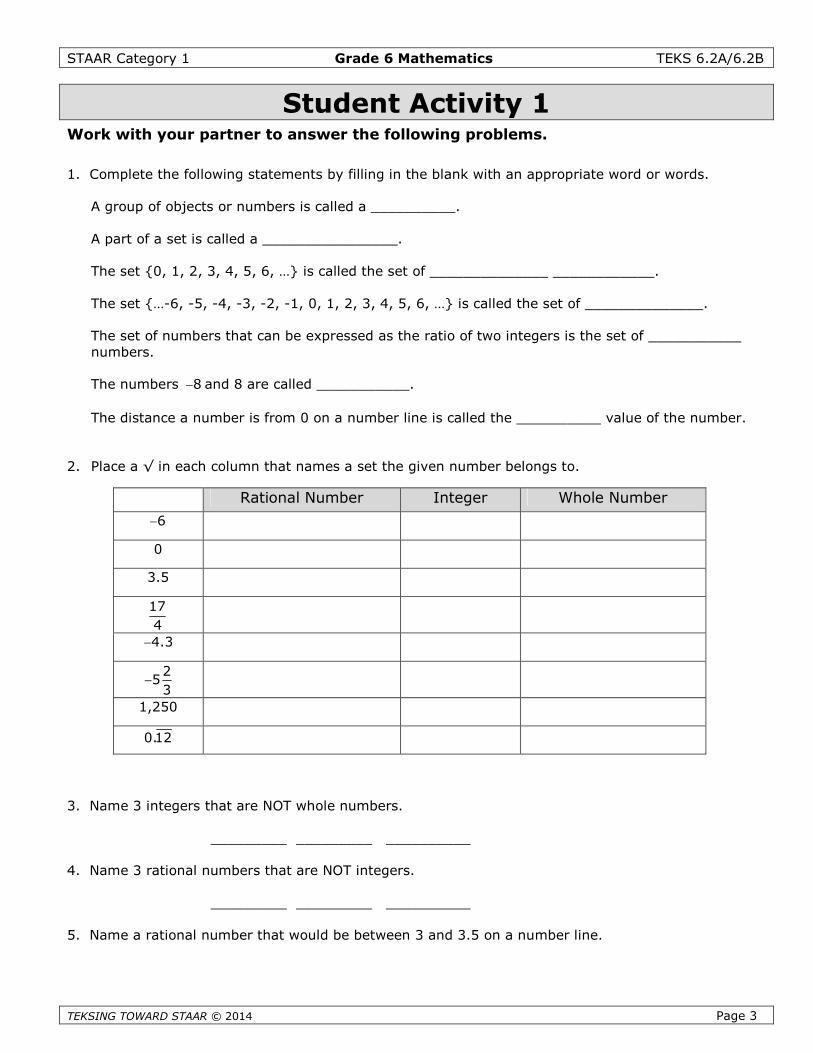
Student Activity 1Work with your partner to answer the following problems.
1. Complete the following statements by filling in the blank with an appropriate word or words.
A group of objects or numbers is called a __________.
A part of a set is called a ________________.
The set {0, 1, 2, 3, 4, 5, 6, …} is called the set of ______________ ____________.
The set {…-6, -5, -4, -3, -2, -1, 0, 1, 2, 3, 4, 5, 6, …} is called the set of ______________.
The set of numbers that can be expressed as the ratio of two integers is the set of ___________numbers.
The numbers 8 and 8 are called ___________.
The distance a number is from 0 on a number line is called the __________ value of the number.
2. Place a √ in each column that names a set the given number belongs to.
3. Nam
4. Nam
5. Nam
Rational Number Integer Whole Number
6
0
3.5
17
4
4.3
25
3
1,250
TOWARD STAAR © 2014 Page 3
e 3 integers that are NOT whole numbers.
_________ _________ __________
e 3 rational numbers that are NOT integers.
_________ _________ __________
e a rational number that would be between 3 and 3.5 on a number line.
0.12
STAAR Category 1 Grade 6 Mathematics TEKS 6.2A/6.2B
TEKSING TOWARD STAAR © 2014 Page 4
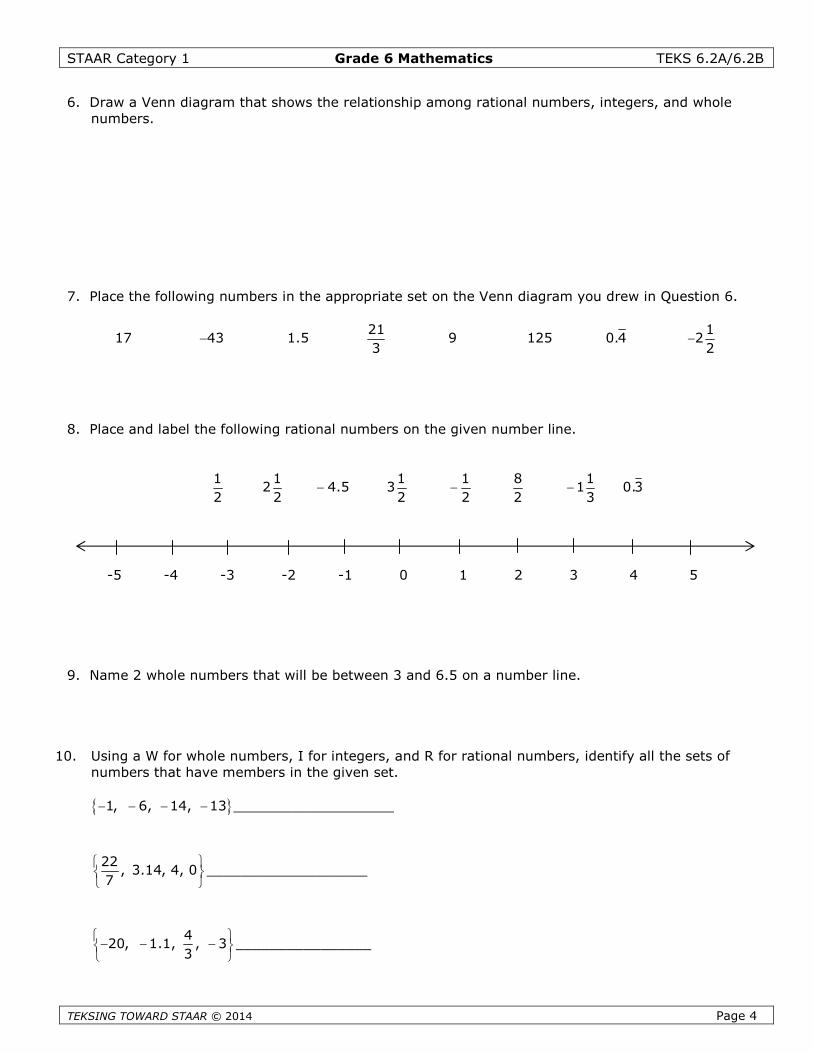
6. Draw a Venn diagram that shows the relationship among rational numbers, integers, and wholenumbers.
7. Place the following numbers in the appropriate set on the Venn diagram you drew in Question 6.
17 43 1.521
39 125 0.4
12
2
8. Place and label the following rational numbers on the given number line.
1 1 1 1 8 12 4.5 3 1
2 2 2 2 2 3 0.3
9. Name 2 whole numbers that will be between 3 and 6.5 on a number line.
10. Using a W for whole numbers, I for integers, and R for rational numbers, identify all the sets ofnumbers that have members in the given set.
1, 6, 14, 13 ___________________
22, 3.14, 4, 0
7
___________________
420, 1.1, , 3
3
________________
-5 -4 -3 -2 -1 0 1 2 3 4 5
STAAR Category 1 Grade 6 Mathematics TEKS 6.2A/6.2B
TEKSING TO
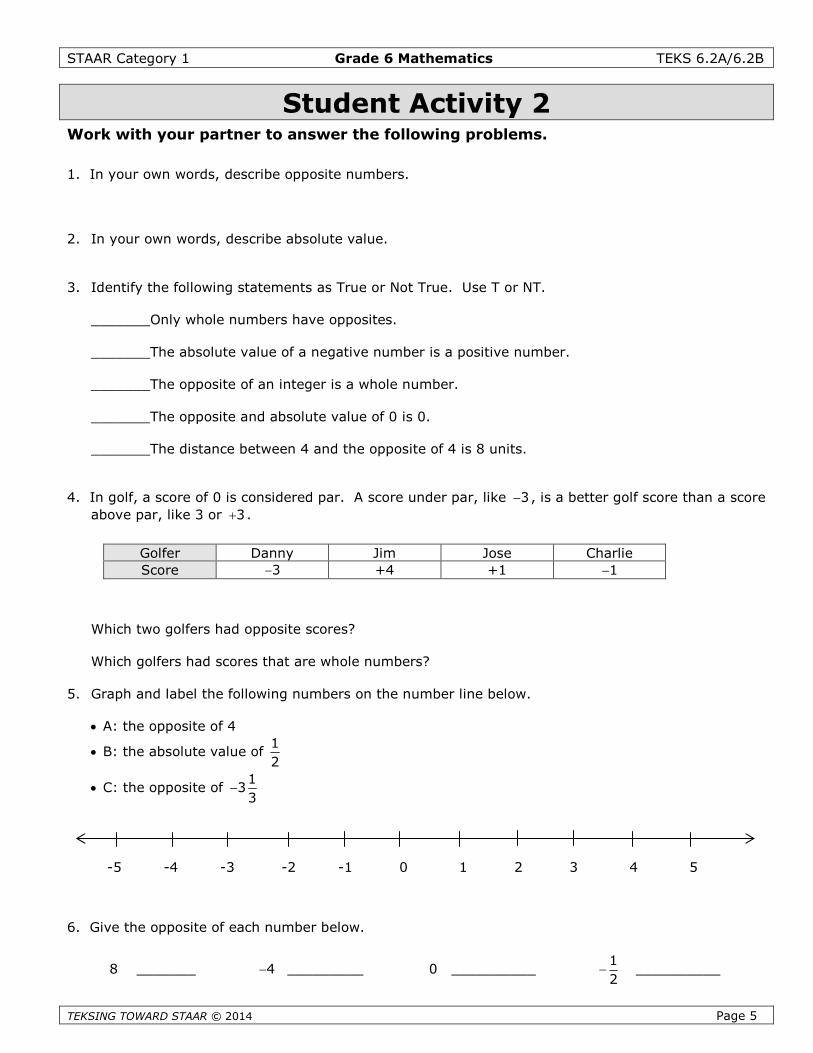
Student Activity 2Work with your partner to answer the following problems.
1. In your own words, describe opposite numbers.
2. In your own words, describe absolute value.
3. Identify the following statements as True or Not True. Use T or NT.
_______Only whole numbers have opposites.
_______The absolute value of a negative number is a positive number.
_______The opposite of an integer is a whole number.
_______The opposite and absolute value of 0 is 0.
_______The distance between 4 and the opposite of 4 is 8 units.
4. In golf, a score of 0 is considered par. A score under par, like 3 , is a better golf score than a score
above par, like 3 or 3 .
Which
Which
5. Graph
A: th
B: th
C: th
6. Give th
8
-5
Golfer Danny Jim Jose Charlie
WARD STAAR © 2014 Page 5
two golfers had opposite scores?
golfers had scores that are whole numbers?
and label the following numbers on the number line below.
e opposite of 4
e absolute value of1
2
e opposite of1
33
e opposite of each number below.
_______ 4 _________ 0 __________1
2 __________
Score 3 +4 +1 1
-4 -3 -2 -1 0 1 2 3 4 5
STAAR Category 1 Grade 6 Mathematics TEKS 6.2A/6.2B
TEKSING TOWARD STAAR © 2014 Page 6
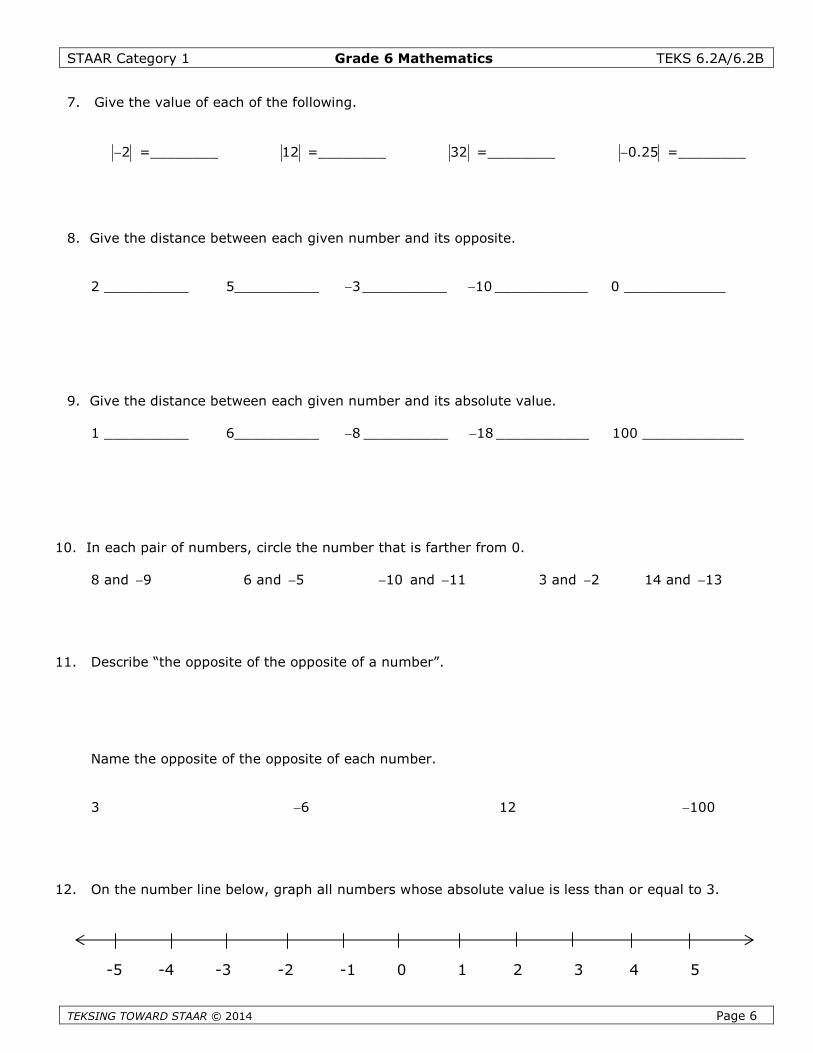
7. Give the value of each of the following.
2 =________ 12 =________ 32 =________ 0.25 =________
8. Give the distance between each given number and its opposite.
2 __________ 5__________ 3 __________ 10 ___________ 0 ____________
9. Give the distance between each given number and its absolute value.
1 __________ 6__________ 8 __________ 18 ___________ 100 ____________
10. In each pair of numbers, circle the number that is farther from 0.
8 and 9 6 and 5 10 and 11 3 and 2 14 and 13
11. Describe “the opposite of the opposite of a number”.
Name the opposite of the opposite of each number.
3 6 12 100
12. On the number line below, graph all numbers whose absolute value is less than or equal to 3.
-5 -4 -3 -2 -1 0 1 2 3 4 5
STAAR Category 1 Grade 6 Mathematics TEKS 6.2A/6.2B
TEKSING TOWARD STAAR © 2014 Page 7
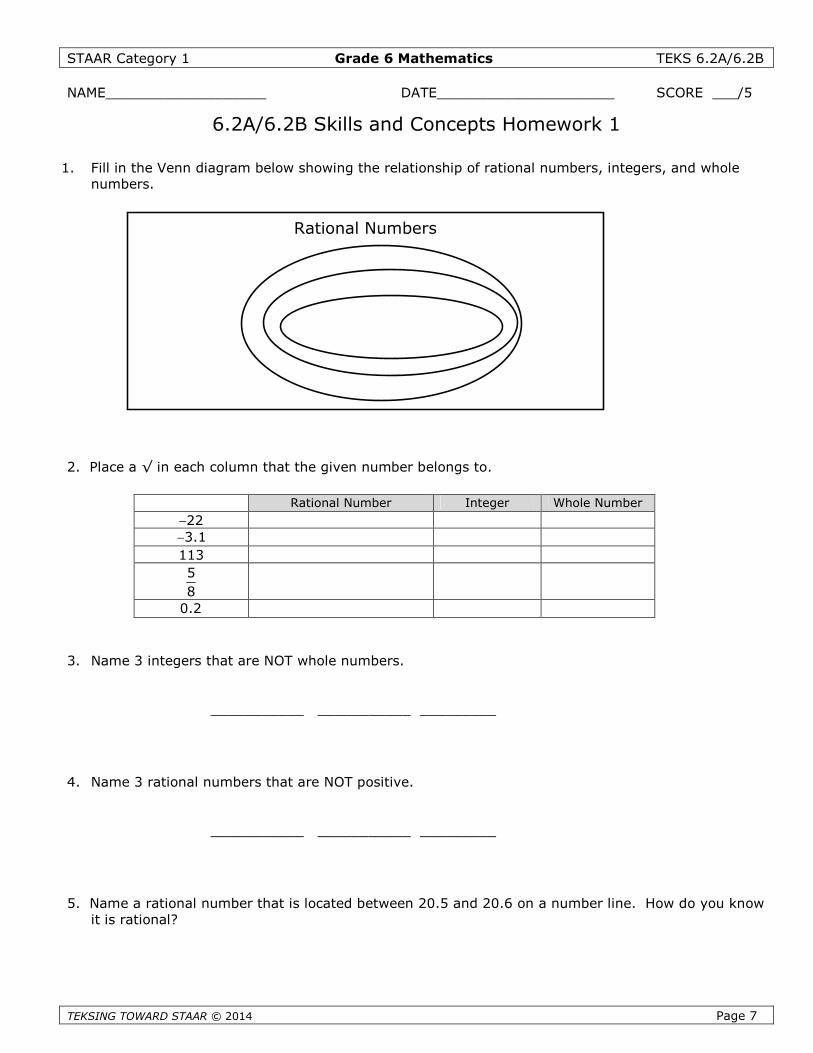
NAME___________________ DATE_____________________ SCORE ___/5
6.2A/6.2B Skills and Concepts Homework 1
1. Fill in the Venn diagram below showing the relationship of rational numbers, integers, and wholenumbers.
2. Place a √ in each column that the given number belongs to.
3. Name 3 integers that are NOT whole numbers.
___________ ___________ _________
4. Name 3 rational numbers that are NOT positive.
___________ ___________ _________
5. Name a rational number that is located between 20.5 and 20.6 on a number line. How do you knowit is rational?
Rational Numbers
Rational Number Integer Whole Number
223.1
113
5
8
0.2
STAAR Category 1 Grade 6 Mathematics TEKS 6.2A/6.2B
TEKSING TOWARD STAAR © 2014 Page 8
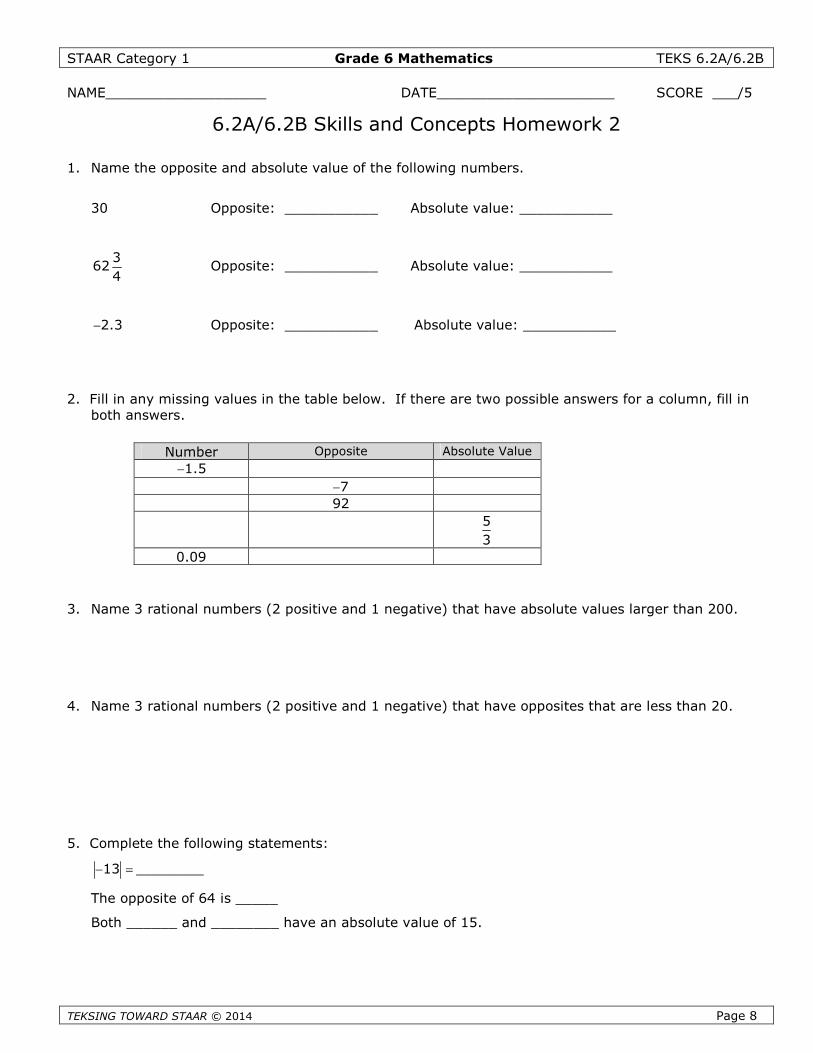
NAME___________________ DATE_____________________ SCORE ___/5
6.2A/6.2B Skills and Concepts Homework 2
1. Name the opposite and absolute value of the following numbers.
30 Opposite: ___________ Absolute value: ___________
362
4Opposite: ___________ Absolute value: ___________
2.3 Opposite: ___________ Absolute value: ___________
2. Fill in any missing values in the table below. If there are two possible answers for a column, fill inboth answers.
3. Name 3 rational numbers (2 positive and 1 negative) that have absolute values larger than 200.
4. Name 3 rational numbers (2 positive and 1 negative) that have opposites that are less than 20.
5. Complete the following statements:
13 ________
The opposite of 64 is _____
Both ______ and ________ have an absolute value of 15.
Number Opposite Absolute Value
1.5
7
92
5
3
0.09
Six Weeks 1Review
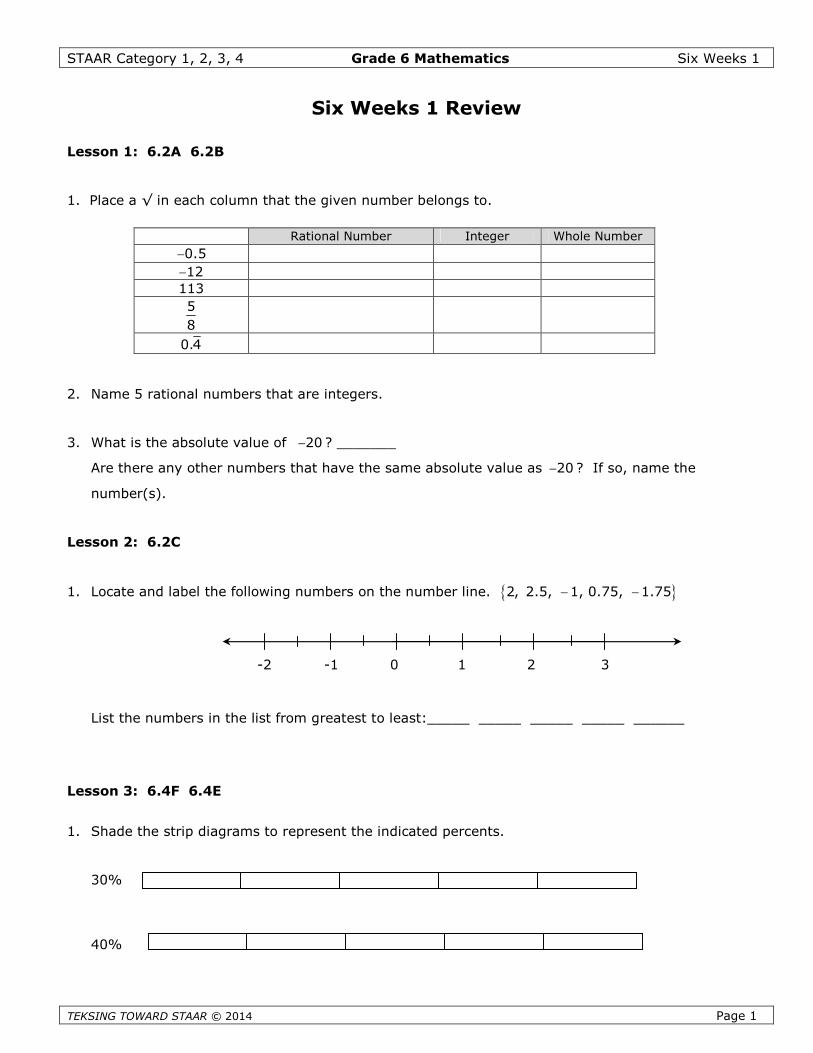
STAAR Category 1, 2, 3, 4 Grade 6 Mathematics Six Weeks 1
TEKSING TOWARD STAAR © 2014 Page 1
Six Weeks 1 Review
Lesson 1: 6.2A 6.2B
1. Place a √ in each column that the given number belongs to.
2. Name 5 rational numbers that are integers.
3. What is the absolute value of 20 ? _______
Are there any other numbers that have the same absolute value as 20 ? If so, name the
number(s).
Lesson 2: 6.2C
1. Locate and label the following numbers on the number line. 2, 2.5, 1, 0.75, 1.75
List the numbers in the list from greatest to least:_____ _____ _____ _____ ______
Lesson 3: 6.4F 6.4E
1. Shade the strip diagrams to represent the indicated percents.
30%
40%
Rational Number Integer Whole Number
0.5
12
113
5
8
0.4
-2 -1 0 1 2 3
STAAR Category 1, 2, 3, 4 Grade 6 Mathematics Six Weeks 1
TEKSING TOWARD STAAR © 2014 Page 2
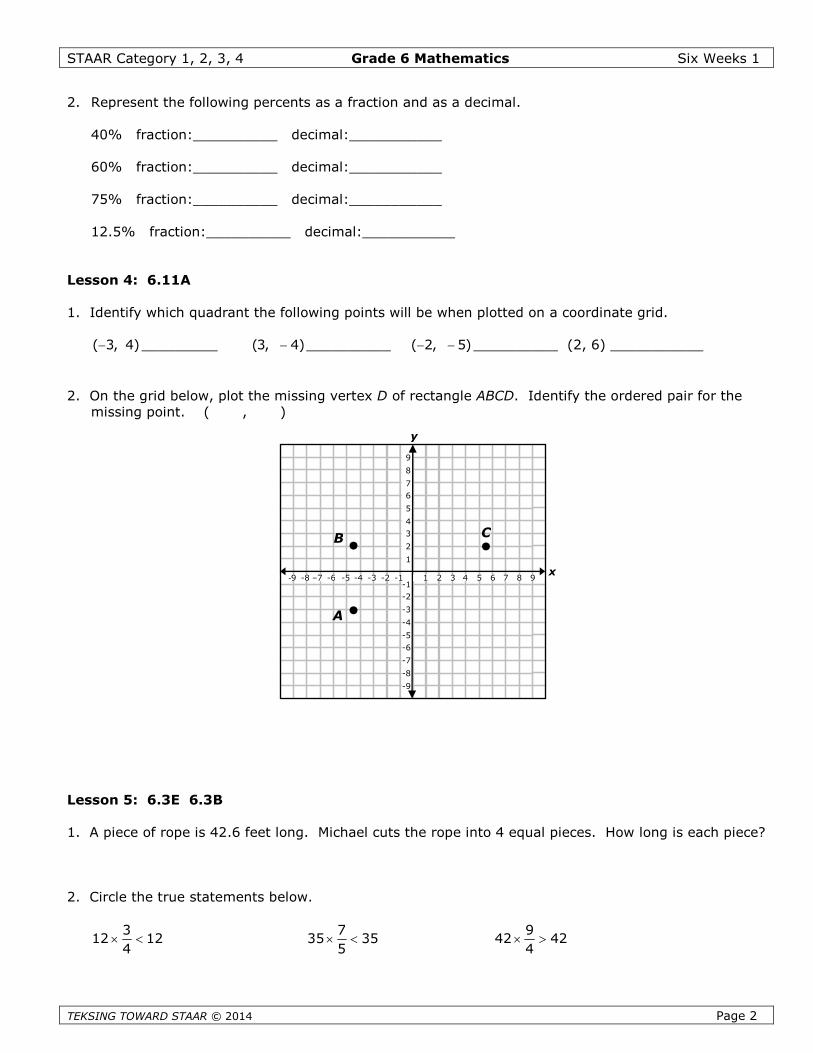
2. Represent the following percents as a fraction and as a decimal.
40% fraction:__________ decimal:___________
60% fraction:__________ decimal:___________
75% fraction:__________ decimal:___________
12.5% fraction:__________ decimal:___________
Lesson 4: 6.11A
1. Identify which quadrant the following points will be when plotted on a coordinate grid.
( 3, 4) _________ (3, 4) __________ ( 2, 5) __________ (2, 6) ___________
2. On the grid below, plot the missing vertex D of rectangle ABCD. Identify the ordered pair for themissing point. ( , )
Lesson 5: 6.3E 6.3B
1. A piece of rope is 42.6 feet long. Michael cuts the rope into 4 equal pieces. How long is each piece?
2. Circle the true statements below.
312 12
4
735 35
5
942 42
4
x
y
-9 -8 –7 -6 -5 -4 -3 -2 -1 1 2 3 4 5 6 7 8 9
9
8
7
6
5
4
3
2
1
-1
-2
-3
-4
-5
-6
-7
-8
-9
A
B C
STAAR Category 1, 2, 3, 4 Grade 6 Mathematics Six Weeks 1
TEKSING TOWARD STAAR © 2014 Page 3
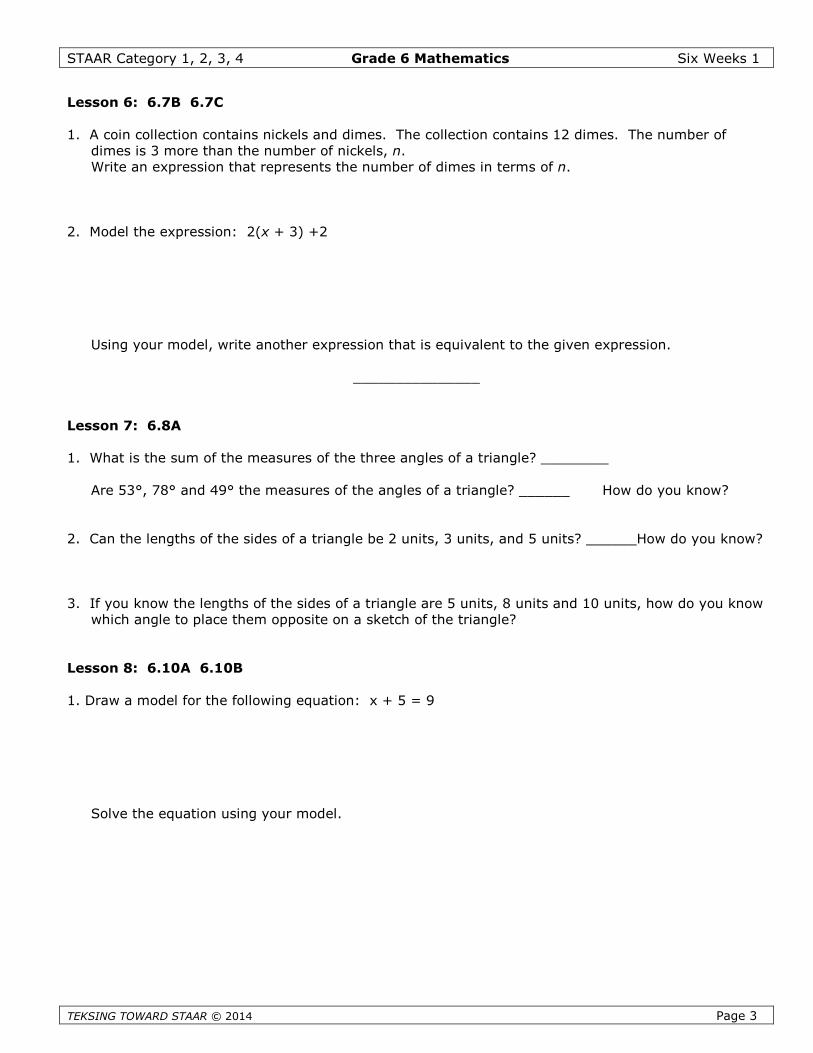
Lesson 6: 6.7B 6.7C
1. A coin collection contains nickels and dimes. The collection contains 12 dimes. The number ofdimes is 3 more than the number of nickels, n.Write an expression that represents the number of dimes in terms of n.
2. Model the expression: 2(x + 3) +2
Using your model, write another expression that is equivalent to the given expression.
_______________
Lesson 7: 6.8A
1. What is the sum of the measures of the three angles of a triangle? ________
Are 53°, 78° and 49° the measures of the angles of a triangle? ______ How do you know?
2. Can the lengths of the sides of a triangle be 2 units, 3 units, and 5 units? ______How do you know?
3. If you know the lengths of the sides of a triangle are 5 units, 8 units and 10 units, how do you knowwhich angle to place them opposite on a sketch of the triangle?
Lesson 8: 6.10A 6.10B
1. Draw a model for the following equation: x + 5 = 9
Solve the equation using your model.
STAAR Category 1, 2, 3, 4 Grade 6 Mathematics Six Weeks 1
TEKSING TOWARD STAAR © 2014 Page 4
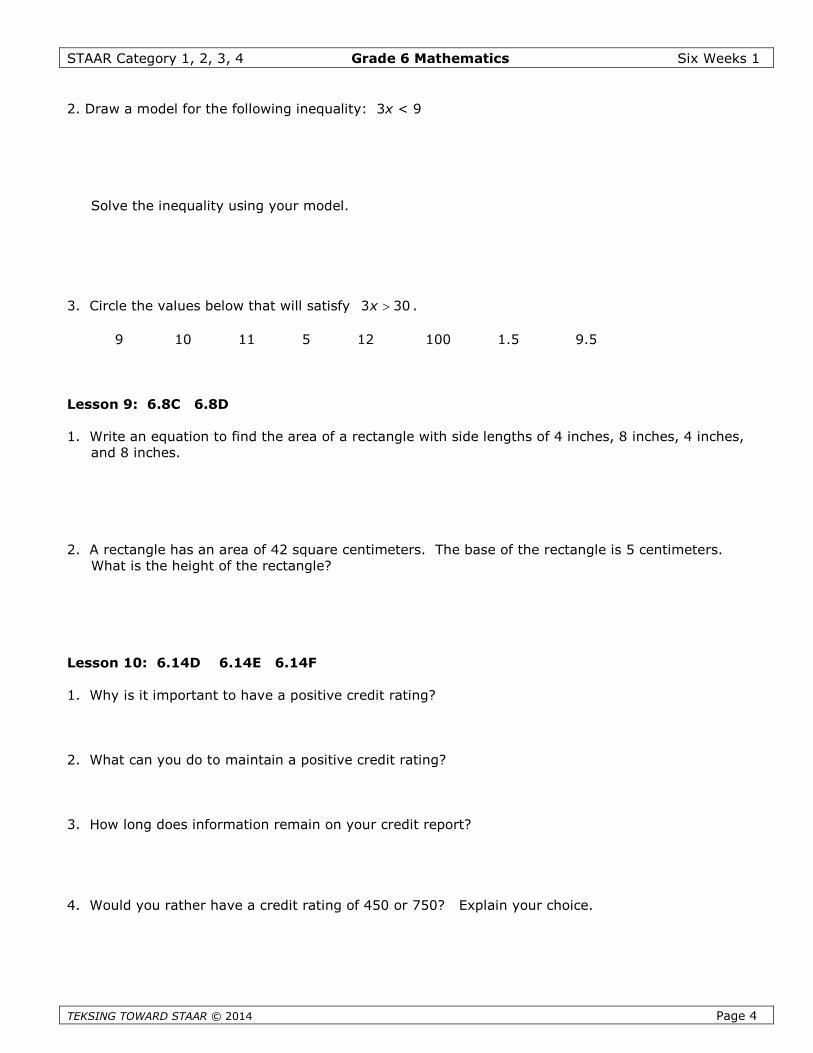
2. Draw a model for the following inequality: 3x < 9
Solve the inequality using your model.
3. Circle the values below that will satisfy 3 30x .
9 10 11 5 12 100 1.5 9.5
Lesson 9: 6.8C 6.8D
1. Write an equation to find the area of a rectangle with side lengths of 4 inches, 8 inches, 4 inches,and 8 inches.
2. A rectangle has an area of 42 square centimeters. The base of the rectangle is 5 centimeters.What is the height of the rectangle?
Lesson 10: 6.14D 6.14E 6.14F
1. Why is it important to have a positive credit rating?
2. What can you do to maintain a positive credit rating?
3. How long does information remain on your credit report?
4. Would you rather have a credit rating of 450 or 750? Explain your choice.

Six Weeks 3Lesson 2
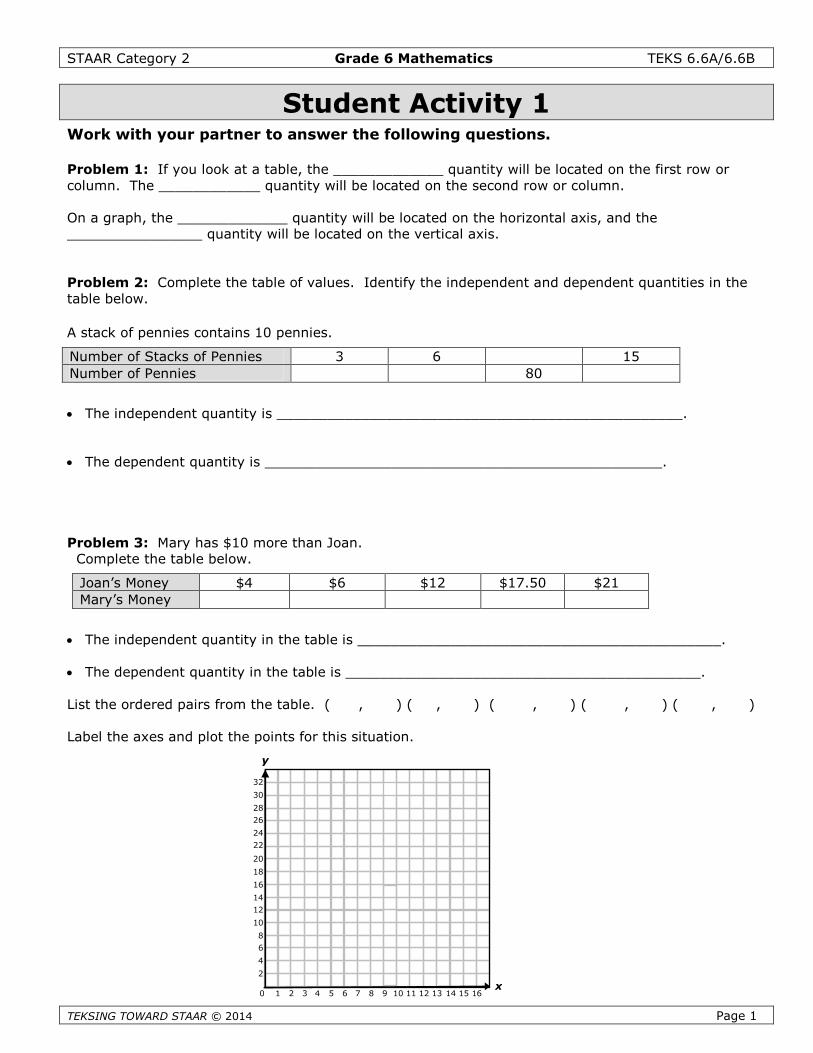
STAAR Category 2 Grade 6 Mathematics TEKS 6.6A/6.6B
Student Activity 1Work with your partner to answer the following questions.
Problem 1: If you look at a table, the _____________ quantity will be located on the first row orcolumn. The ____________ quantity will be located on the second row or column.
On a graph, the _____________ quantity will be located on the horizontal axis, and the________________ quantity will be located on the vertical axis.
Problem 2: Complete the table of values. Identify the independent and dependent quantities in thetable below.
A stack of pennies contains 10 pennies.
Number of Stacks of Pennies 3 6 15
T
The independent quantity is ________________________________________________.
The dependent quantity is _______________________________________________.
Problem 3: Mary has $10 more than Joan.Complete the table below.
L
L
Number of Pennies 80
Joan’s Money $4 $6 $12 $17.50 $21
EKSING TOWARD STAAR © 2014 Page 1
The independent quantity in the table is ___________________________________________.
The dependent quantity in the table is __________________________________________.
ist the ordered pairs from the table. ( , ) ( , ) ( , ) ( , ) ( , )
abel the axes and plot the points for this situation.
Mary’s Money
x
y
0 1 2 3 4 5 6 7 8 9 10 11 12 13 14 15 16
32
30
28
26
24
22
20
18
16
14
12
10
8
6
4
2
STAAR Category 2 Grade 6 Mathematics TEKS 6.6A/6.6B
TEKSING TOWARD STAAR © 2014
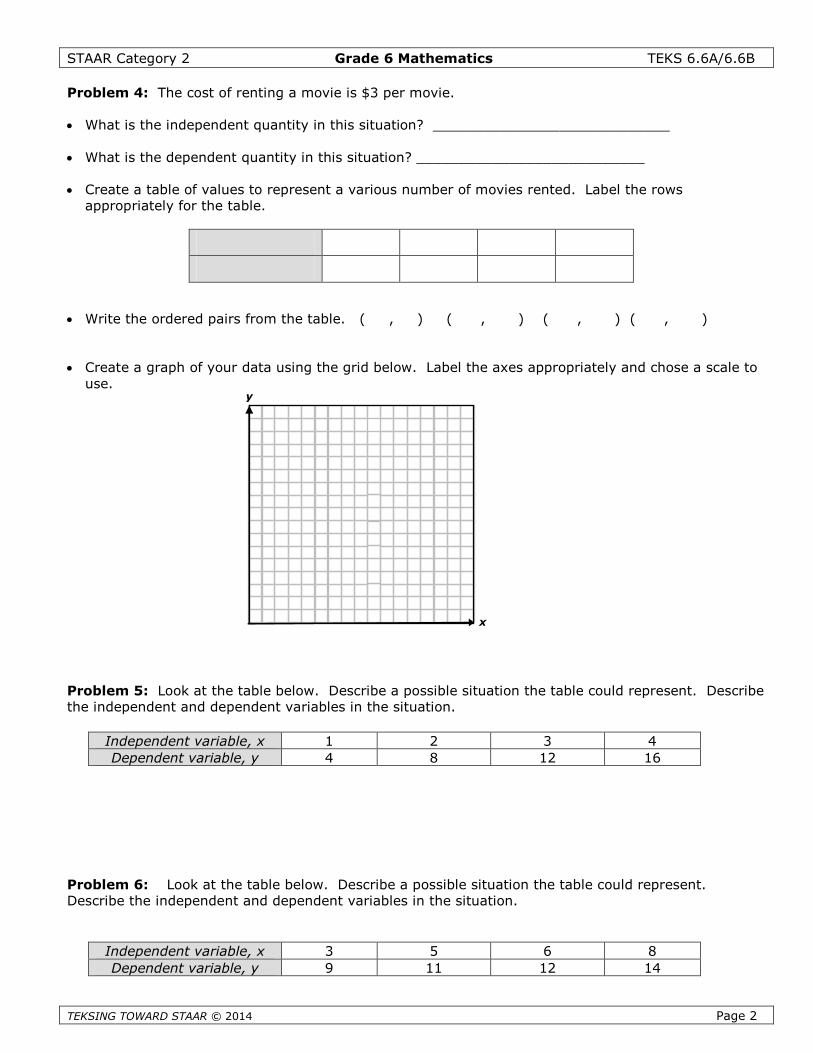
Problem 4: The cost of renting a movie is $3 per movie.
What is the independent quantity in this situation? ____________________________
What is the dependent quantity in this situation? ___________________________
Create a table of values to represent a various number of movies rented. Label the rowsappropriately for the table.
Write the ordered pairs f
Create a graph of your duse.
Problem 5: Look at the tathe independent and depen
Problem 6: Look at theDescribe the independent a
Dependent variable,
y
Dependent variable,
rom the table. ( , ) ( , ) ( , ) ( , )
ata using the grid below. Label the axes appropriately and chose a scale to
ble below. Describe a possible situation the table could represent. Describedent variables in the situation.
x
Independent variable, x 1 2 3 4
table below. Describe a possible situation the table could represent.nd dependent variables in the situation.
y 4 8 12 16
Independent variable, x 3 5 6 8
Page 2
y 9 11 12 14
STAAR Category 2 Grade 6 Mathematics TEKS 6.6A/6.6B
TEKSING TOWARD STAAR © 2014 Page 3
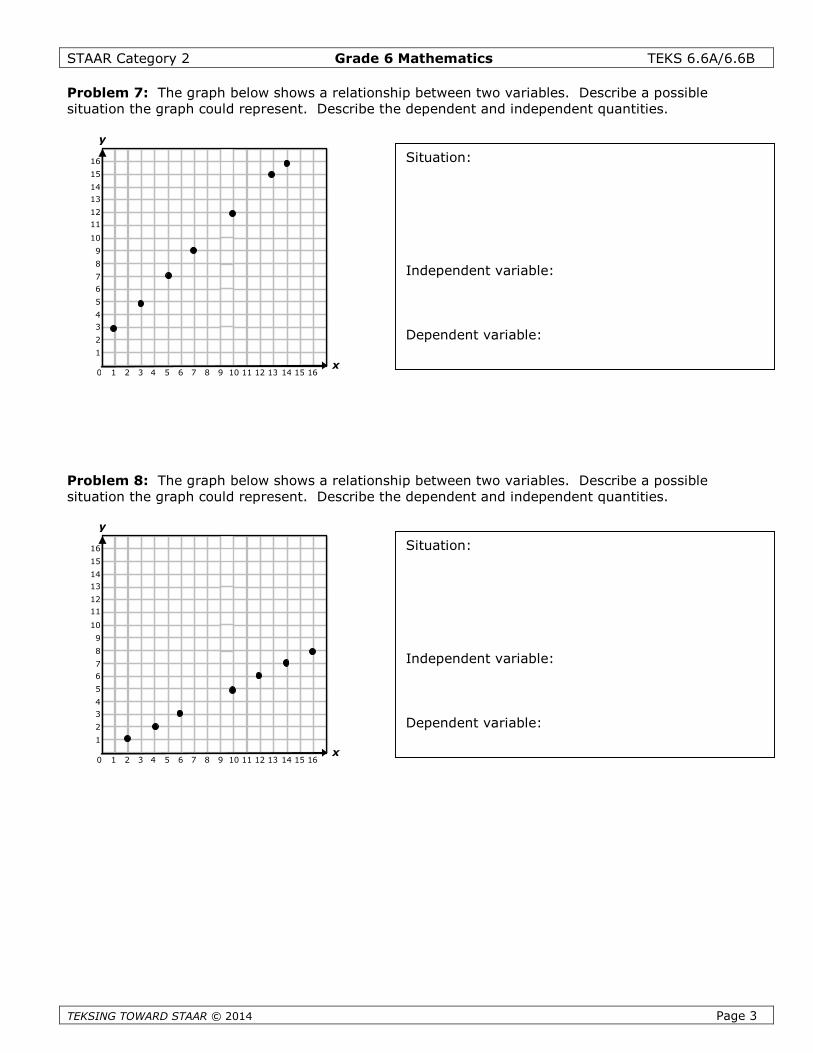
Problem 7: The graph below shows a relationship between two variables. Describe a possiblesituation the graph could represent. Describe the dependent and independent quantities.
Problem 8: The graph below shows a relationship between two variables. Describe a possiblesituation the graph could represent. Describe the dependent and independent quantities.
x
y
0 1 2 3 4 5 6 7 8 9 10 11 12 13 14 15 16
16
15
14
13
12
11
10
9
8
7
6
5
4
3
2
1
Situation:
Independent variable:
Dependent variable:
x
y
0 1 2 3 4 5 6 7 8 9 10 11 12 13 14 15 16
16
15
14
13
12
11
10
9
8
7
6
5
4
3
2
1
Situation:
Independent variable:
Dependent variable:
STAAR Category 2 Grade 6 Mathematics TEKS 6.6A/6.6B
TEKSING TOWARD STAAR © 2014 Page 4
Student Activity 2Work with your partner to answer the following problems.
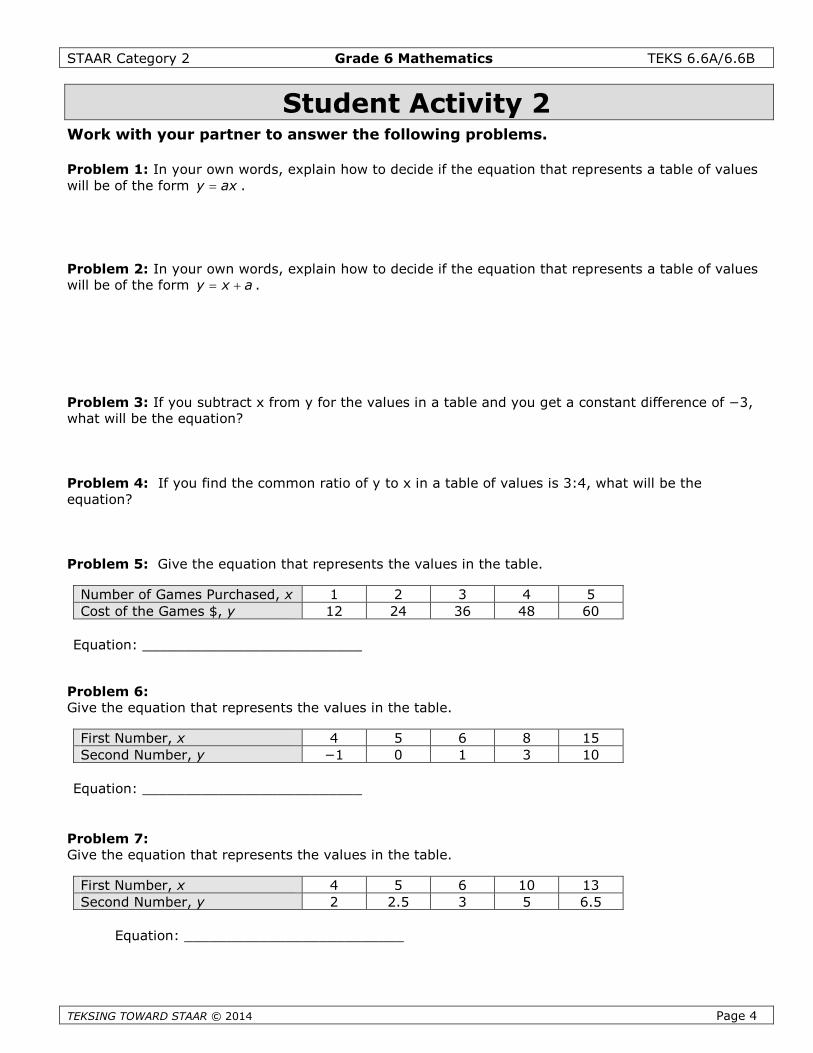
Problem 1: In your own words, explain how to decide if the equation that represents a table of valueswill be of the form y ax .
Problem 2: In your own words, explain how to decide if the equation that represents a table of valueswill be of the form y x a .
Problem 3: If you subtract x from y for the values in a table and you get a constant difference of −3, what will be the equation?
Problem 4: If you find the common ratio of y to x in a table of values is 3:4, what will be theequation?
Problem 5: Give the equation that represents the values in the table.
Equation: __________________________
Problem 6:Give the equation that represents the values in the table.
Equation: __________________________
Problem 7:Give the equation that represents the values in the table.
Equation: __________________________
Number of Games Purchased, x 1 2 3 4 5
Cost of the Games $, y 12 24 36 48 60
First Number, x 4 5 6 8 15
Second Number, y −1 0 1 3 10
First Number, x 4 5 6 10 13
Second Number, y 2 2.5 3 5 6.5
STAAR Category 2 Grade 6 Mathematics TEKS 6.6A/6.6B
TEKSING TOWARD STAAR © 2014 Page 5
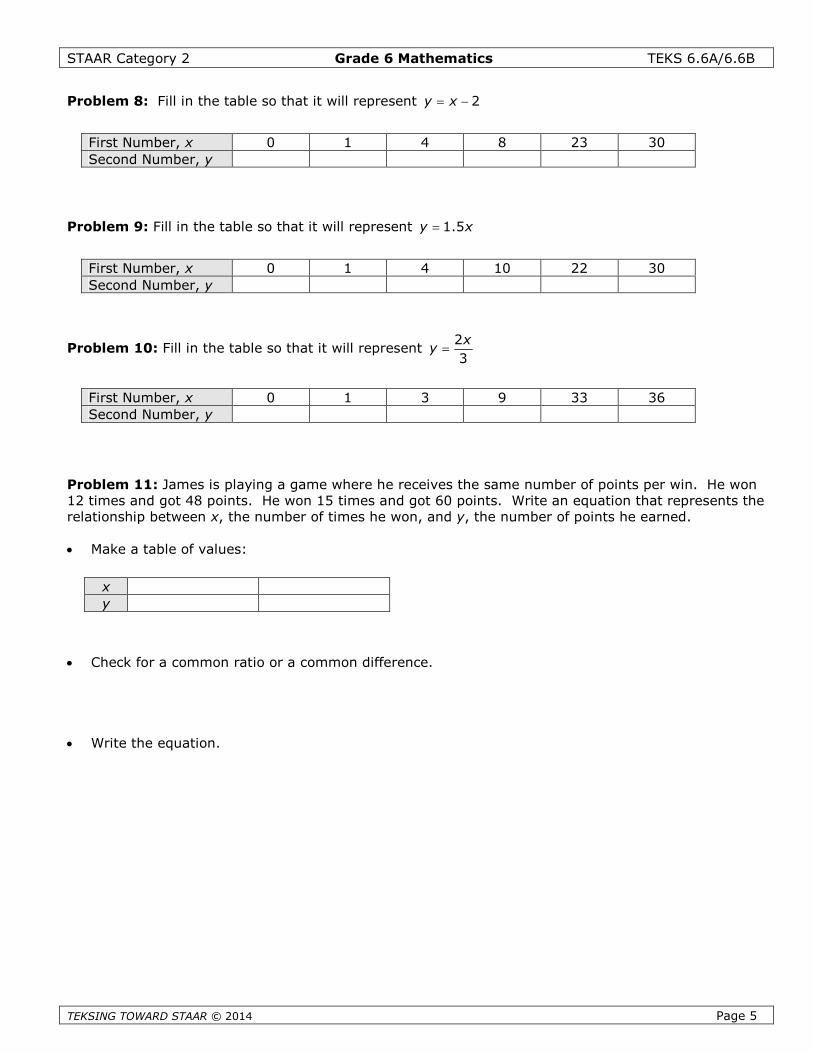
Problem 8: Fill in the table so that it will represent 2y x
Problem 9: Fill in the table so that it will represent 1.5y x
Problem 10: Fill in the table so that it will represent2
3
xy
Problem 11: James is playing a game where he receives the same number of points per win. He won12 times and got 48 points. He won 15 times and got 60 points. Write an equation that represents therelationship between x, the number of times he won, and y, the number of points he earned.
Make a table of values:
Check for a common ratio or a common difference.
Write the equation.
First Number, x 0 1 4 8 23 30
Second Number, y
First Number, x 0 1 4 10 22 30
Second Number, y
First Number, x 0 1 3 9 33 36
Second Number, y
x
y
STAAR Category 2 Grade 6 Mathematics TEKS 6.6A/6.6B
TEKSING TOWARD STAAR © 2014 Page 6
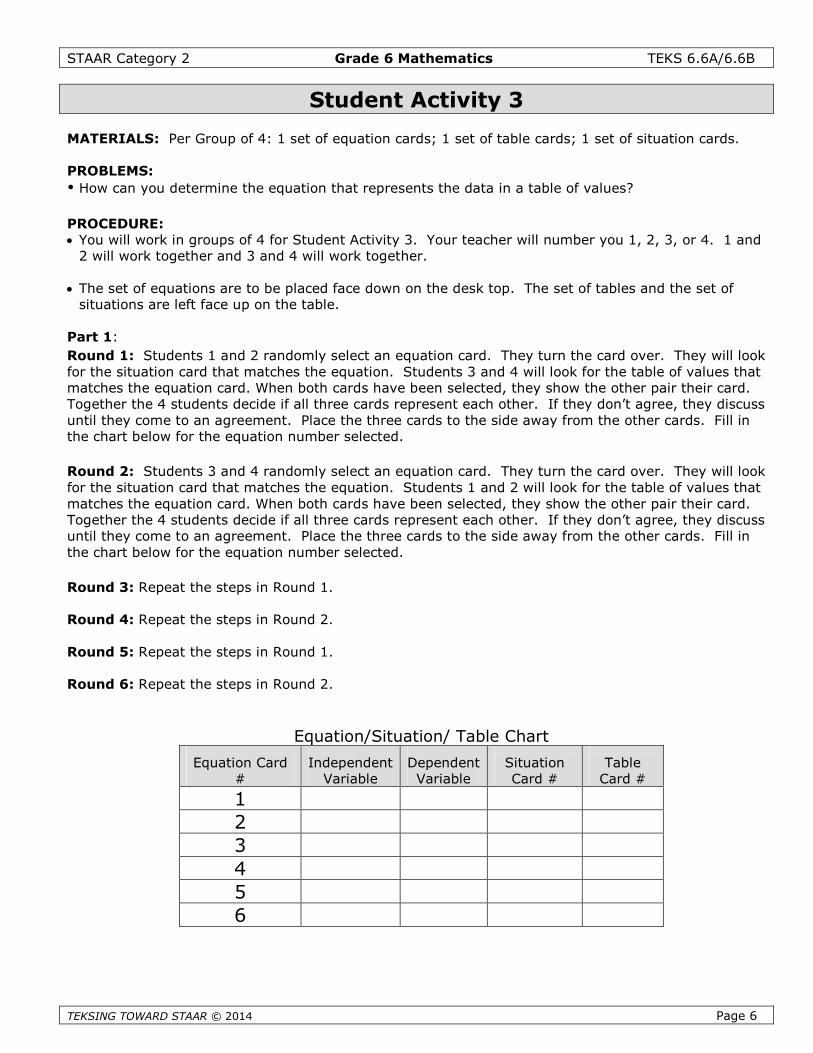
Student Activity 3
MATERIALS: Per Group of 4: 1 set of equation cards; 1 set of table cards; 1 set of situation cards.
PROBLEMS:
How can you determine the equation that represents the data in a table of values?
PROCEDURE: You will work in groups of 4 for Student Activity 3. Your teacher will number you 1, 2, 3, or 4. 1 and
2 will work together and 3 and 4 will work together.
The set of equations are to be placed face down on the desk top. The set of tables and the set ofsituations are left face up on the table.
Part 1:
Round 1: Students 1 and 2 randomly select an equation card. They turn the card over. They will lookfor the situation card that matches the equation. Students 3 and 4 will look for the table of values thatmatches the equation card. When both cards have been selected, they show the other pair their card.Together the 4 students decide if all three cards represent each other. If they don’t agree, they discussuntil they come to an agreement. Place the three cards to the side away from the other cards. Fill inthe chart below for the equation number selected.
Round 2: Students 3 and 4 randomly select an equation card. They turn the card over. They will lookfor the situation card that matches the equation. Students 1 and 2 will look for the table of values thatmatches the equation card. When both cards have been selected, they show the other pair their card.Together the 4 students decide if all three cards represent each other. If they don’t agree, they discussuntil they come to an agreement. Place the three cards to the side away from the other cards. Fill inthe chart below for the equation number selected.
Round 3: Repeat the steps in Round 1.
Round 4: Repeat the steps in Round 2.
Round 5: Repeat the steps in Round 1.
Round 6: Repeat the steps in Round 2.
Equation/Situation/ Table Chart
Equation Card#
IndependentVariable
DependentVariable
SituationCard #
TableCard #
123456
STAAR Category 2 Grade 6 Mathematics TEKS 6.6A/6.6B
TEKSING TOWARD STAAR © 2014 Page 7
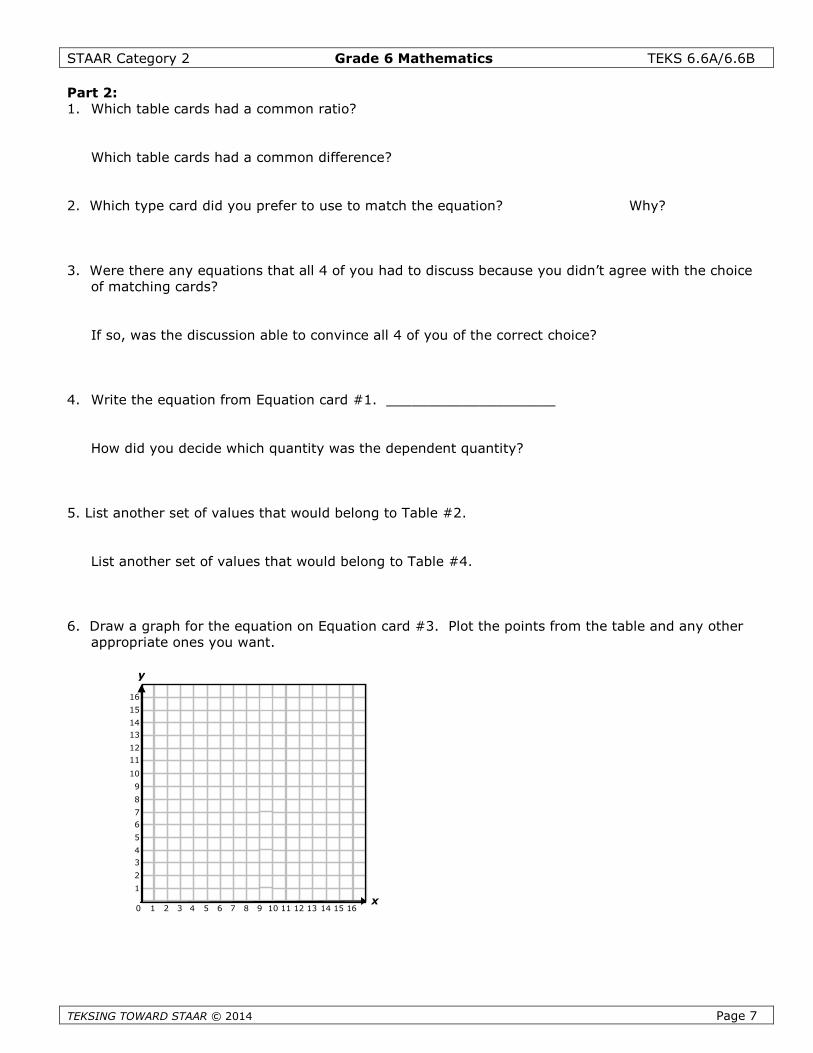
Part 2:1. Which table cards had a common ratio?
Which table cards had a common difference?
2. Which type card did you prefer to use to match the equation? Why?
3. Were there any equations that all 4 of you had to discuss because you didn’t agree with the choiceof matching cards?
If so, was the discussion able to convince all 4 of you of the correct choice?
4. Write the equation from Equation card #1. ____________________
How did you decide which quantity was the dependent quantity?
5. List another set of values that would belong to Table #2.
List another set of values that would belong to Table #4.
6. Draw a graph for the equation on Equation card #3. Plot the points from the table and any otherappropriate ones you want.
x
y
0 1 2 3 4 5 6 7 8 9 10 11 12 13 14 15 16
16
15
14
13
12
11
10
9
8
7
6
5
4
3
2
1
STAAR Category 2 Grade 6 Mathematics TEKS 6.6A/6.6B
TEKSING TOWARD STAAR © 2014 Page 8
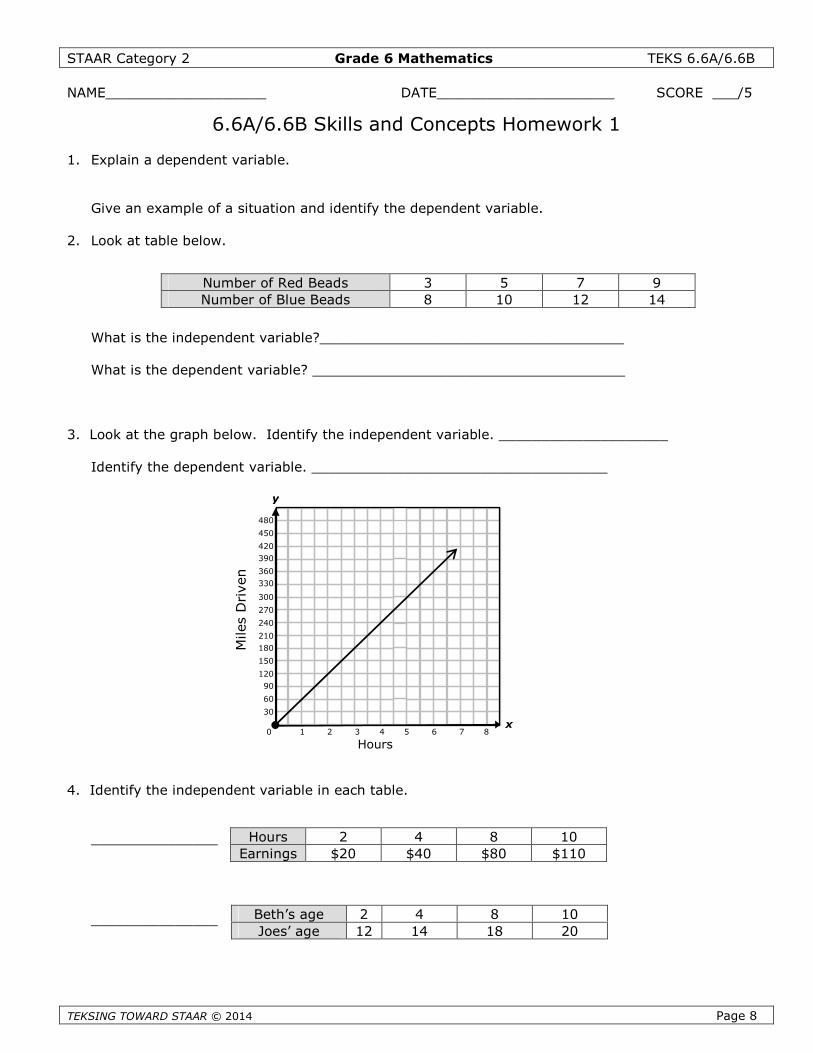
NAME___________________ DATE_____________________ SCORE ___/5
6.6A/6.6B Skills and Concepts Homework 1
1. Explain a dependent variable.
Give an example of a situation and identify the dependent variable.
2. Look at table below.
What is the independent variable?____________________________________
What is the dependent variable? _____________________________________
3. Look at the graph below. Identify the independent variable. ____________________
Identify the dependent variable. ___________________________________
4. Identify the independent variable in each table.
_______________
_______________
Number of Red Beads 3 5 7 9
Number of Blue Beads 8 10 12 14
Hours 2 4 8 10
Earnings $20 $40 $80 $110
Beth’s age 2 4 8 10
Joes’ age 12 14 18 20
x
y
0 1 2 3 4 5 6 7 8
Hours
480
450
420
390
360
330
300
270
240
210
180
150
120
90
60
30
Miles
Driven
STAAR Category 2 Grade 6 Mathematics TEKS 6.6A/6.6B
TEKSING TOWARD STAAR © 2014 Page 9
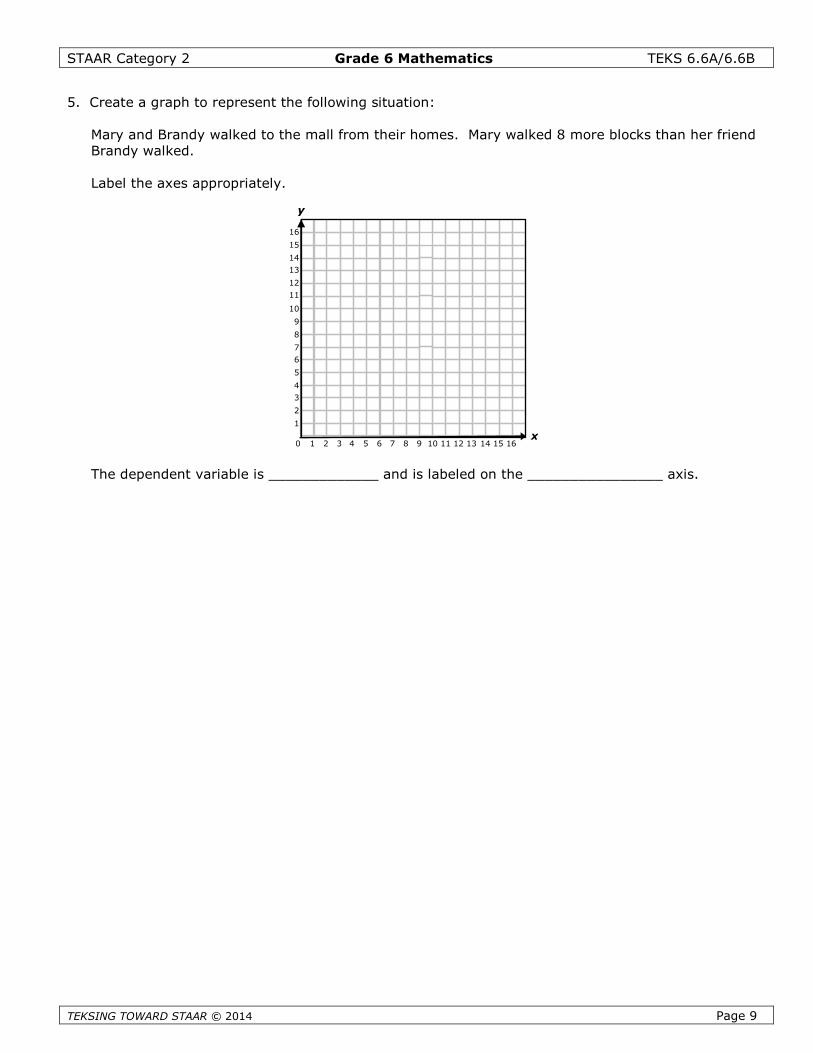
5. Create a graph to represent the following situation:
Mary and Brandy walked to the mall from their homes. Mary walked 8 more blocks than her friendBrandy walked.
Label the axes appropriately.
The dependent variable is _____________ and is labeled on the ________________ axis.
x
y
0 1 2 3 4 5 6 7 8 9 10 11 12 13 14 15 16
16
15
14
13
12
11
10
9
8
7
6
5
4
3
2
1
STAAR Category 2 Grade 6 Mathematics TEKS 6.6A/6.6B
TEKSING TOWARD STAAR © 2014 Page 10
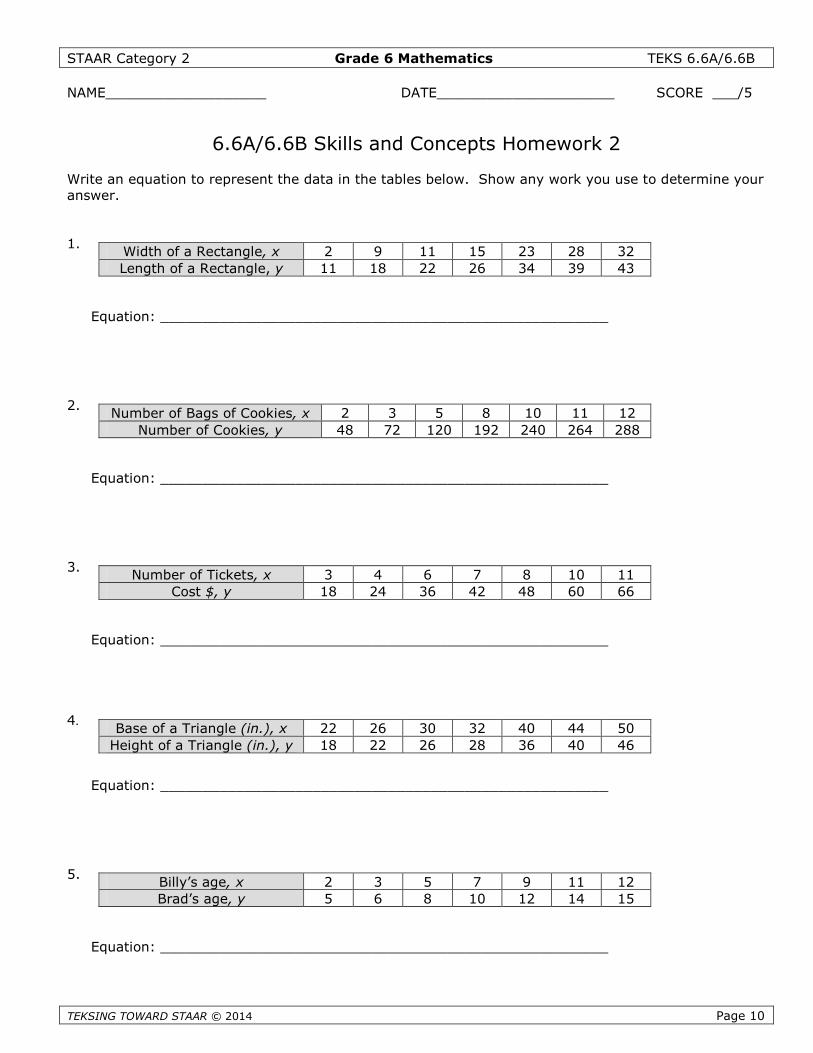
NAME___________________ DATE_____________________ SCORE ___/5
6.6A/6.6B Skills and Concepts Homework 2
Write an equation to represent the data in the tables below. Show any work you use to determine youranswer.
1.
Equation: _____________________________________________________
2.
Equation: _____________________________________________________
3.
Equation: _____________________________________________________
4.
Equation: _____________________________________________________
5.
Equation: _____________________________________________________
Width of a Rectangle, x 2 9 11 15 23 28 32
Length of a Rectangle, y 11 18 22 26 34 39 43
Number of Bags of Cookies, x 2 3 5 8 10 11 12
Number of Cookies, y 48 72 120 192 240 264 288
Number of Tickets, x 3 4 6 7 8 10 11
Cost $, y 18 24 36 42 48 60 66
Base of a Triangle (in.), x 22 26 30 32 40 44 50
Height of a Triangle (in.), y 18 22 26 28 36 40 46
Billy’s age, x 2 3 5 7 9 11 12
Brad’s age, y 5 6 8 10 12 14 15
Six Weeks 3Review
STAAR Category 2, 3, 4 Grade 6 Mathematics Six Weeks 3
TEKSING TOWARD
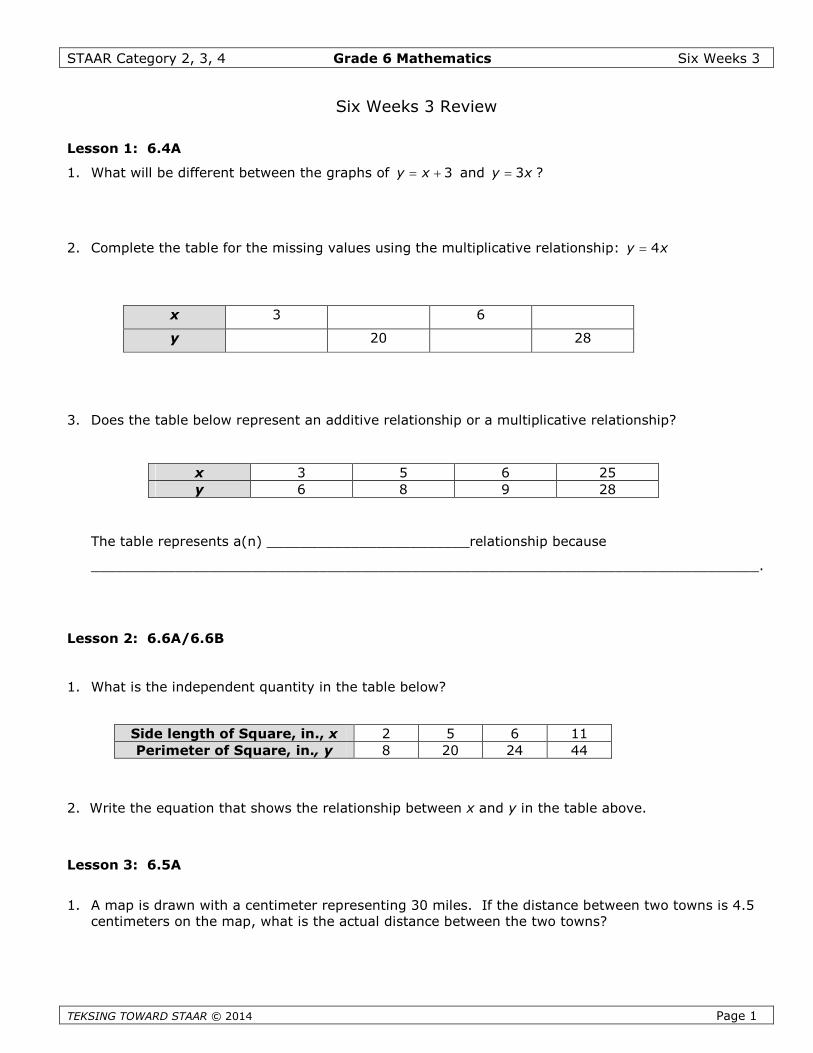
Six Weeks 3 Review
Lesson 1: 6.4A
1. What will be different between the graphs of 3y x and 3y x ?
2. Complete the table for the missing values using the multiplicative relationship: 4y x
3. Does the ta
The table r
_________
Lesson 2: 6.
1. What is the
2. Write the e
Lesson 3: 6.
1. A map is dcentimeter
Per
x 3 6
STA
ble below represent an additive relationship or a multiplicative relationship?
epre
___
6A/
ind
qua
5A
raws on
y 20 28
ime
x 3 5 6 25
sents a(n) ________________________relationship because
___________________________________________________________________.
6.6B
ependent quantity in the table below?
y 6 8 9 28
Side length of Square, in., x 2 5 6 11
AR © 2014 Page 1
tion that shows the relationship between x and y in the table above.
n with a centimeter representing 30 miles. If the distance between two towns is 4.5the map, what is the actual distance between the two towns?
ter of Square, in., y 8 20 24 44
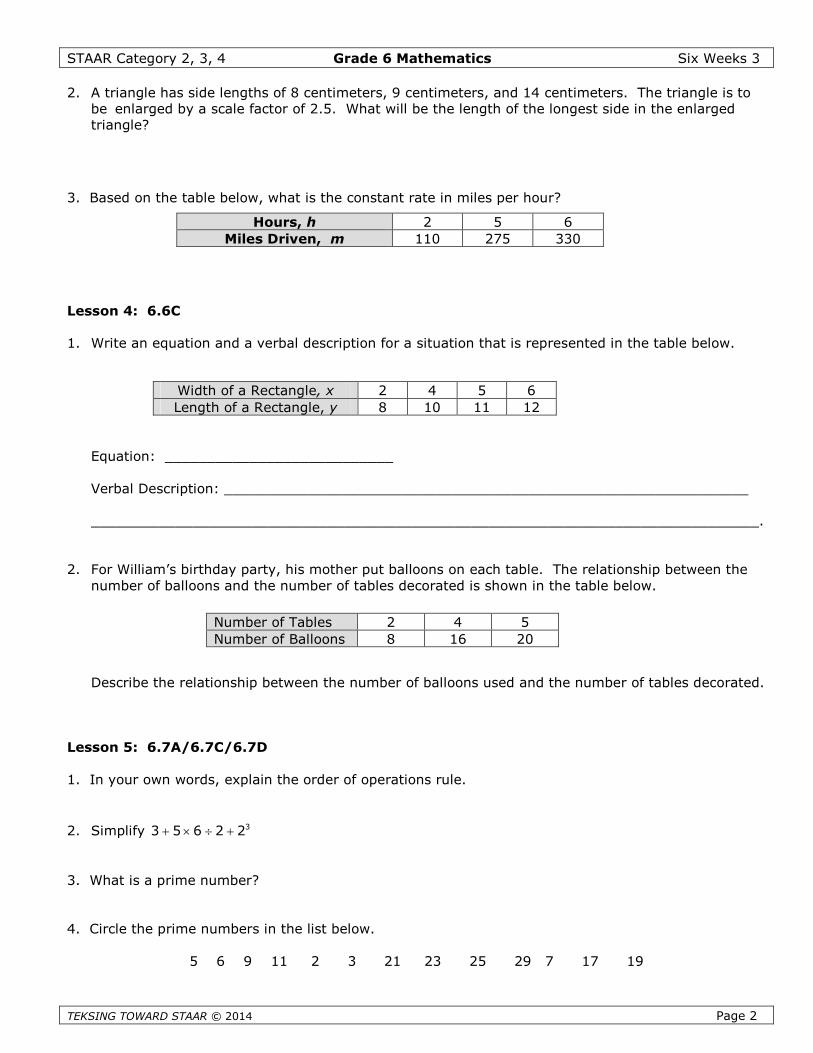
STAAR Category 2, 3, 4 Grade 6 Mathematics Six Weeks 3
TEKSING TOWARD STAAR © 201
2. A triangle has side lengths of 8 centimeters, 9 centimeters, and 14 centimeters. The triangle is tobe enlarged by a scale factor of 2.5. What will be the length of the longest side in the enlargedtriangle?
3. Based on the table below, what is the constant rate in miles per hour?
Lesson 4: 6.6C
1. Write an equation and
Equation: __________
Verbal Description: ___
___________________
2. For William’s birthday pnumber of balloons and
Describe the relationsh
Lesson 5: 6.7A/6.7C/6.
1. In your own words, exp
2. Simplify 3 5 6 2 2
3. What is a prime numbe
4. Circle the prime numbe
5 6
Mil
Length of a
Num
Hours, h 2 5 6
a verbal description for a situation that is represented in the table below.
es Driven, m 110 275 330
Width of a Rectangle, x 2 4 5 6
_________________
___________________________________________________________
____________________________________________________________.
arty, his mother put balloons on each table. The relationship between thethe number of tables decorated is shown in the table below.
Rectangle, y 8 10 11 12
Number of Tables 2 4 5
4 Page 2
ip between the number of balloons used and the number of tables decorated.
7D
lain the order of operations rule.
3
r?
rs in the list below.
9 11 2 3 21 23 25 29 7 17 19
ber of Balloons 8 16 20
STAAR Category 2, 3, 4 Grade 6 Mathematics Six Weeks 3
TEKSING TOWARD STAAR © 2014 Page 3
5. Write 100 in prime factorization.
6. 2 22 3 5 7 is the prime factorization for ________________________________________.
7. Describe the Commutative Property of Addition.
8. What is the identity number of addition?________ What is the Identity Property of Addition?
9. What is another name for multiplicative inverse? ____________________________________
10. Write an expression that is equivalent to 3(x + 6) using the:
Distributive Property. ____________
Commutative Property of Addition _________________
Lesson 6: 6.9A/6.9B
Write an equation or inequality to represent the following situations.
1. The base of a rectangle is 8 units more than the height of the rectangle. The base is 12 units.
2. There are 10 dimes in a collection. The number of dimes is 5 more than the number of nickels inthe collection.
3. In a bag, the number of blue tiles is 8 more than the number of red tiles. There are more than 20blue tiles in the bag.
Lesson 7: 6.8B/6.8C/6.8D
1. A parallelogram has a base of 20 units and a height of 8 units. What is the area of theparallelogram?
2. A trapezoid has bases of 5 inches and 9 inches. The height of the trapezoid is 6 inches. What is thearea of the trapezoid?
STAAR Category 2, 3, 4 Grade 6 Mathematics Six Weeks 3
TEKSING TOWARD STAAR © 2014 Page 4
3. A parallelogram has an area of 50 square inches. The height of the parallelogram is 12 inches.Write an equation that can be used to find the base of the parallelogram.
4. A trapezoid has an area of 300 square units. The bases of the trapezoid are 18 inches and 12inches. What is the height of the trapezoid?
Lesson 8: 6.12A/6.12B/6.13A
1. Represent the following data in a stem-and-leaf plot.
23, 26, 32, 21, 34, 42, 48, 32, 33, 27, 28, 27, 29, 20, 23
2. What is the center, spread, and shape of the data in the stem-and-leaf plot above?
3. About what percent of the data points in the stem-and-leaf plot were less than 30?
4. Write another question that can be answered using the stem-and-leaf plot.
Lesson 9: 6.12C
Using the data set 6, 8, 5, 11, 12, 8, 6, answer the following questions.
1. What is the range of the data set?
2. What is the median of the data set?
3. What is the mean of the data set?
STAAR Category 2, 3, 4 Grade 6 Mathematics Six Weeks 3
TEKSING TOWARD STAAR © 2014 Page 5
4. What is the lower quartile?
5. What is the upper quartile?
6. What is the IQR of the data set?
Lesson 10: 6.12C
1. How do you balance a check register?
2. Decide if the following amounts would be added or subtracted from the current balance of a checkregister. Write Add or Subtract in the blank.
________ Check #21 written for $42 to gas station
________ Transferred $100 from savings account into checking account
________ Used debit card at ATM to withdraw $50 cash
_________Automatic deposit of $2,512 from employer
_________Automatic payment of $343 to Ford Motor Company
3. Justin has a checking account balance of $2,100. He writes checks for $53, $25.75, and $48.What will be his checking account balance be after writing the checks?