Embed Size (px)
Citation preview

Secondary Math Grade 7 – Advanced Math
An Equal Opportunity School District School Year 2015-2016

Secondary Math 7th Grade Advanced
Summary of Revisions/Updates
All changes and updates have been added directly to the 7th Grade Advanced Math Curriculum Map.
This page serves as a summary of changes made. Changes have also been included in the Year at a
Glance document. Below is a summary of the changes:
Only one Learning Check will be given per Nine Week Quarter, with the exception of Quarter 4
in which two Learning Checks will be given (totaling 5 for the school year with the last Learning
Check given after the Mathematics FSA testing window).
Each Learning Check consists of 2 units (combined content evenly distributed):
Quarter 1 – Learning Check #1: Units 1 & 2 (September 28th – October 5th)
Quarter 2 – Learning Check #2: Units 3 & 4 (November 9th – November 16th)
Quarter 3 – Learning Check #3: Units 5 & 6 (January 18th – January 25th)
Quarter 4 – Learning Check #4: Units 7 & 8 (March 28th – April 4th)
Quarter 4 – Learning Check #5: Units 9 & 10 (May 9th – May 16th)
Units go in order of the textbook.
Question format includes Multiple Choice and Brief Constructed Response (BCR). Learning
Checks are still from the textbook. Teachers can tear out Learning Check pages prior to giving
students the book or the chapters/modules from the book. Please keep in mind (2) Unit Mixed
Review Assessment Readiness Exams will be given together as one Learning Check. Learning
Checks can be completed on Bubble Sheets. Teachers will need to hand grade and mark credit
accordingly in the BCR portions of the student bubble sheet. Please see specific grading
directions for BCR questions listed on the Learning Check Answer Keys.
Answer Keys include the math standards that correspond to each question.
The Year at a Glance document lists the Learning Check Testing Windows under the Assessment
section. Please be mindful this is only a suggested time frame in which each Learning Check
should be given in order to follow the pacing guide outlined in the curriculum map. See above for
the testing window of each Learning Check.
Mathematics Formative Assessment System (MFAS) tasks have been added to the maps. Other
tasks are available on CPALMS.
Resources for each Unit have been revised and updated.

MCPS SY 15-16
The District Secondary School Math Curriculum Documents are designed to
maximize and coordinate math instruction throughout the district. The K-12
Academic Services Team has worked with teachers to develop new Curriculum
Maps that are based around the Learning Focused Model. This model is a
planning framework that focuses on student learning. The Math Curriculum
maps include essential questions, key learning statements, items for students to
know and do, and additional teaching resources.
The Standards listed on the Math Curriculum Maps are the Florida Math
Standards (MAFS).
The curriculum documents can be viewed in the K-12 Academic Services
Portal. In addition to the maps, please check the portal for more helpful
documents and additional web links on the Content Area Pages. Be sure to take
part in the variety of Moodle Modules that will be available throughout the year.
It is the sincere wish of the teacher committee and program specialist that
this Math Curriculum Document is helpful in guiding math instruction in Marion
County and provides a useful resource for the teachers. Please feel free to
contact Bobbie Knighton ([email protected]) for questions or
feedback on the Math Curriculum Documents.
English Language Development ELD Standards Special Notes Section: Teachers are required to provide listening, speaking, reading and writing instruction that allows English
language learners (ELL) to communicate information, ideas and concepts for academic success in the
content area of Mathematics. For the given level of English language proficiency and with visual,
graphic, or interactive support, students will interact with grade level words, expressions, sentences and
discourse to process or produce language necessary for academic success. The ELD standard should
specify a relevant content area concept or topic of study chosen by curriculum developers and teachers
which maximizes an ELL’s need for communication and social skills. To access an ELL supporting
document which delineates performance definitions and descriptors, please click on the following link:
http://www.cpalms.org/uploads/docs/standards/eld/MA.pdf
For additional information on the development and implementation of the ELD standards, please contact
the Bureau of Student Achievement through Language Acquisition at [email protected].
The two standards are:
ELD.K12.ELL.SI.1 – English language learners communicate for socal and instructional
purposes within the school setting.
ELD.K12.ELL.MA.1 – English language learners communicate informations, ideas and
concepts necessary for academic success in the content area of Mathematics.
MCPS SY 15-16
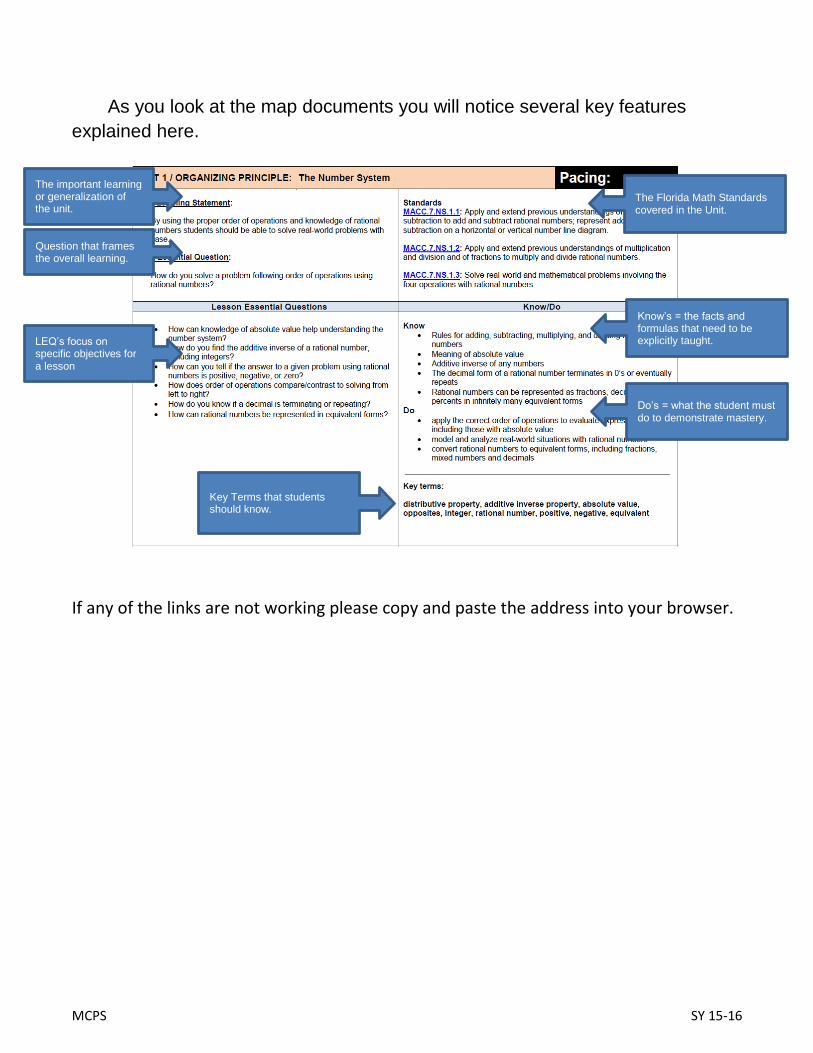
As you look at the map documents you will notice several key features
explained here.
If any of the links are not working please copy and paste the address into your browser.
The important learning or generalization of the unit.
LEQ’s focus on specific objectives for a lesson
The Florida Math Standards covered in the Unit.
Know’s = the facts and formulas that need to be explicitly taught.
Do’s = what the student must do to demonstrate mastery.
Question that frames the overall learning.
Key Terms that students should know.
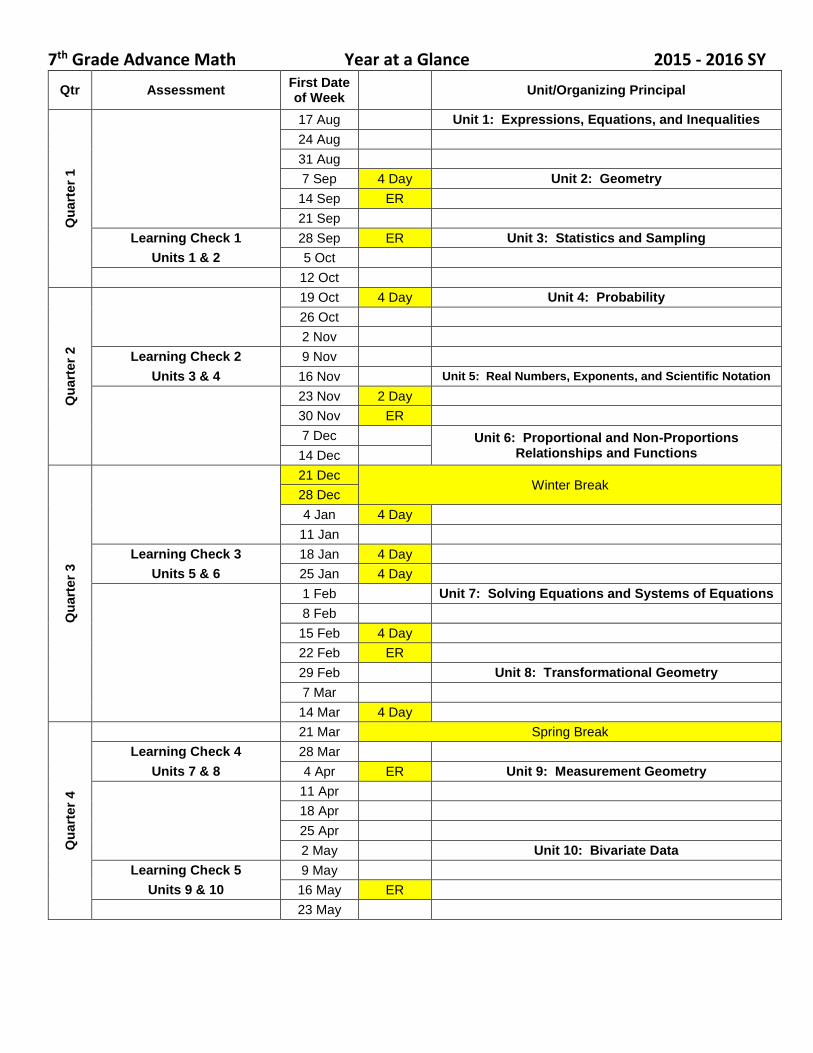
7th Grade Advance Math Year at a Glance 2015 - 2016 SY
Qtr Assessment First Date of Week
Unit/Organizing Principal
Qu
art
er
1
17 Aug Unit 1: Expressions, Equations, and Inequalities
24 Aug
31 Aug
7 Sep 4 Day Unit 2: Geometry
14 Sep ER
21 Sep
Learning Check 1 28 Sep ER Unit 3: Statistics and Sampling
Units 1 & 2 5 Oct
12 Oct
Qu
art
er
2
19 Oct 4 Day Unit 4: Probability
26 Oct
2 Nov
Learning Check 2 9 Nov
Units 3 & 4 16 Nov Unit 5: Real Numbers, Exponents, and Scientific Notation
23 Nov 2 Day
30 Nov ER
7 Dec Unit 6: Proportional and Non-Proportions Relationships and Functions 14 Dec
Qu
art
er
3
21 Dec Winter Break
28 Dec
4 Jan 4 Day
11 Jan
Learning Check 3 18 Jan 4 Day
Units 5 & 6 25 Jan 4 Day
1 Feb Unit 7: Solving Equations and Systems of Equations
8 Feb
15 Feb 4 Day
22 Feb ER
29 Feb Unit 8: Transformational Geometry
7 Mar
14 Mar 4 Day
Qu
art
er
4
21 Mar Spring Break
Learning Check 4 28 Mar
Units 7 & 8 4 Apr ER Unit 9: Measurement Geometry
11 Apr
18 Apr
25 Apr
2 May Unit 10: Bivariate Data
Learning Check 5 9 May
Units 9 & 10 16 May ER
23 May

Marion County Public Schools – Curriculum Map Grade Level: 7 Subject: Advanced Math
June 2015 Advanced Grade 7 Unit: 1
UNIT 1 / ORGANIZING PRINCIPLE: Expressions, Equations and Inequalities Pacing: 15 Days
Key Learning Statement:
Real life situations can be modeled/analyzed/solved using linear equations and inequalities.
Unit Essential Question:
How can real life situations be modeled/analyzed/solved using linear equations and inequalities?
Standards MAFS.7.EE.1.1 Apply properties of operations as strategies to add, subtract, factor, and expand linear expressions with rational coefficients. MAFS.7.EE.1.2 Understand that rewriting an expression in different forms in a problem context can shed light on the problem and how the quantities in it are related. For example, a + 0.05a = 1.05a means that “increase by 5%” is the same as “multiply by 1.05.” MAFS.7.EE.2.3 Solve multi-step real-life and mathematical problems posed with positive and negative rational numbers in any form (whole numbers, fractions, and decimals), using tools strategically. Apply properties of operations to calculate with numbers in any form; convert between forms as appropriate; and assess the reasonableness of answers using mental computation and estimation strategies. For example: If a woman making $25 an hour gets a 10% raise, she will make an additional 1/10 of her salary an hour, or $2.50, for a new salary of $27.50. If you want to place a towel bar 9 3/4 inches long in the center of a door that is 27 1/2 inches wide, you will need to place the bar about 9 inches from each edge; this estimate can be used as a check on the exact computation. MAFS.7.EE.2.4 Use variables to represent quantities in a real-world or mathematical problem, and construct simple equations and inequalities to solve problems by reasoning about the quantities.
a. Solve word problems leading to equations of the form px + q = r and p(x + q) = r, where p, q, and r are specific rational numbers. Solve equations of these forms fluently. Compare an algebraic solution to an arithmetic solution, identifying the sequence of the operations used in each approach. For example, the perimeter of a rectangle is 54 cm. Its length is 6 cm. What is its width?
b. b. Solve word problems leading to inequalities of the form px + q > r or px + q < r, where p, q, and r are specific rational numbers. Graph the solution set of the inequality and interpret it in the context of the problem. For example: As a salesperson, you are paid $50 per week plus $3 per sale. This week you want your pay to be at least $100. Write an inequality for the number of sales you need to make, and describe the solutions.
MAFS.8.EE.3.7: Solve linear equations in one variable. a. Give examples of linear equations in one variable with one solution, infinitely many
solutions, or no solutions. Show which of these possibilities is the case by successively transforming the given equation into simpler forms, until an equivalent equation of the form x = a, a = a, or a = b results (where a and b are different numbers).
b. Solve linear equations with rational number coefficients, including equations whose solutions require expanding expressions using the distributive property and collecting like terms.

Marion County Public Schools – Curriculum Map Grade Level: 7 Subject: Advanced Math
June 2015 Advanced Grade 7 Unit: 1
Lesson Essential Questions Know/Do
How are inverse operations applied to solve equations?
How are equations simplified by combining like terms?
How are equations simplified by applying the distributive property?
What steps are required to solve linear equations?
How are verbal situations translated into mathematical representations?
Know
Inverse Operations
Combining Like Terms
Distributive Property
Steps to solving linear equations
Common words and phrases that translate into mathematical representations
Equivalent Expressions Do
Apply inverse operations to solve equations
Simplify by combining like terms on same/opposite sides of the equation
Simplify equations by applying the distributive property
Apply steps to solve linear equations
Translate verbal situations into mathematical representations
Marion County Public Schools – Curriculum Map Grade Level: 7 Subject: Advanced Math
June 2015 Advanced Grade 7 Unit: 1
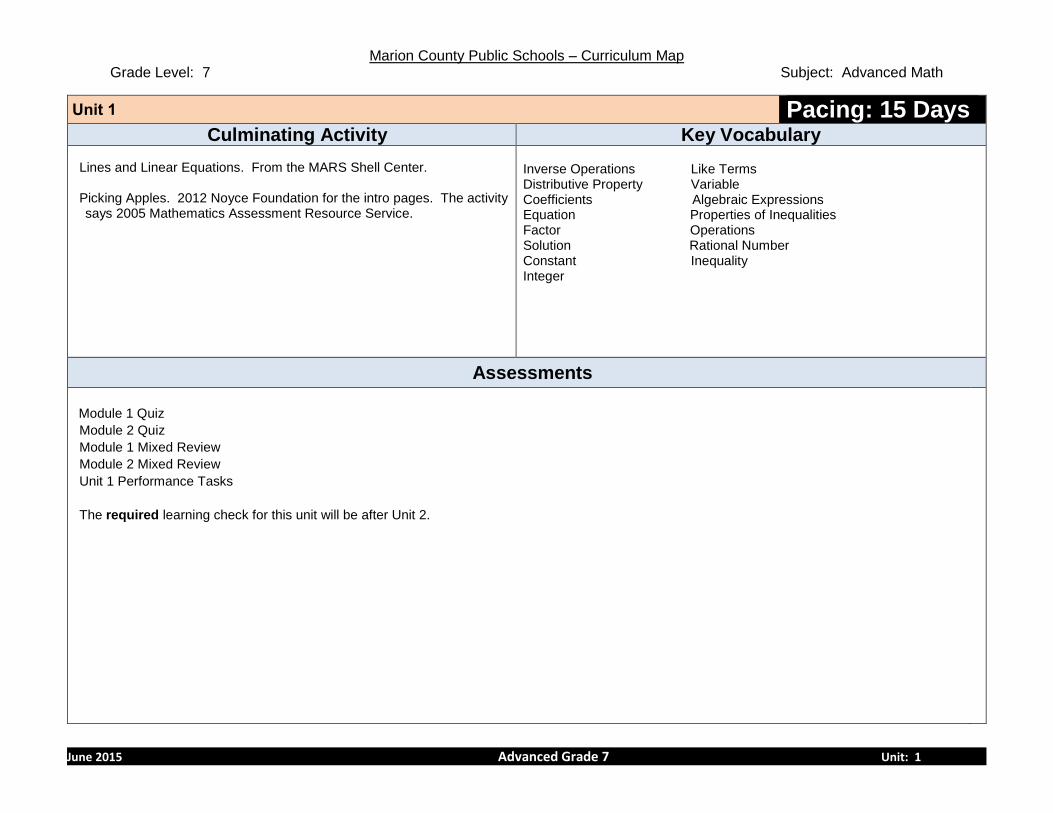
Unit 1 Pacing: 15 Days
Culminating Activity Key Vocabulary
Lines and Linear Equations. From the MARS Shell Center. Picking Apples. 2012 Noyce Foundation for the intro pages. The activity says 2005 Mathematics Assessment Resource Service.
Inverse Operations Like Terms Distributive Property Variable Coefficients Algebraic Expressions Equation Properties of Inequalities Factor Operations Solution Rational Number Constant Inequality Integer
Assessments
Module 1 Quiz
Module 2 Quiz
Module 1 Mixed Review
Module 2 Mixed Review
Unit 1 Performance Tasks
The required learning check for this unit will be after Unit 2.
Marion County Public Schools – Curriculum Map Grade Level: 7 Subject: Advanced Math
June 2015 Advanced Grade 7 Unit: 1
Unit 1 Pacing: 15 Days
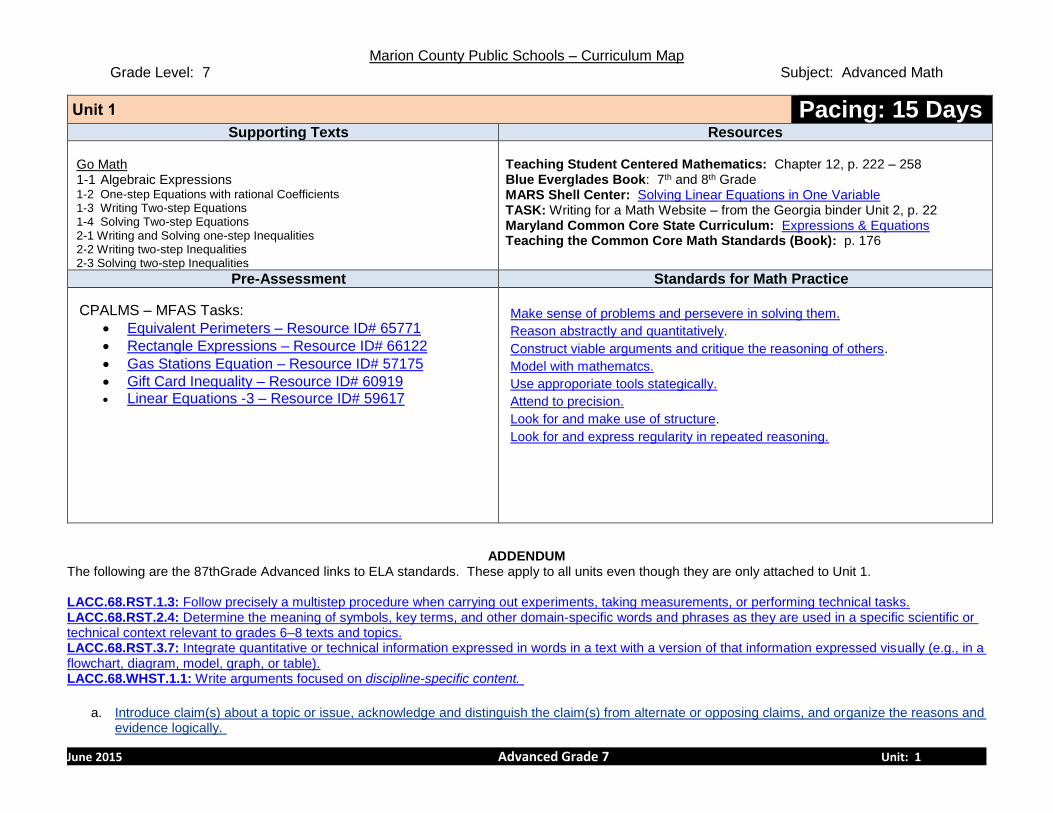
Supporting Texts Resources
Go Math 1-1 Algebraic Expressions 1-2 One-step Equations with rational Coefficients 1-3 Writing Two-step Equations 1-4 Solving Two-step Equations 2-1 Writing and Solving one-step Inequalities 2-2 Writing two-step Inequalities 2-3 Solving two-step Inequalities
Teaching Student Centered Mathematics: Chapter 12, p. 222 – 258 Blue Everglades Book: 7th and 8th Grade MARS Shell Center: Solving Linear Equations in One Variable TASK: Writing for a Math Website – from the Georgia binder Unit 2, p. 22 Maryland Common Core State Curriculum: Expressions & Equations Teaching the Common Core Math Standards (Book): p. 176
Pre-Assessment Standards for Math Practice
CPALMS – MFAS Tasks:
Equivalent Perimeters – Resource ID# 65771
Rectangle Expressions – Resource ID# 66122
Gas Stations Equation – Resource ID# 57175
Gift Card Inequality – Resource ID# 60919 Linear Equations -3 – Resource ID# 59617
Make sense of problems and persevere in solving them.
Reason abstractly and quantitatively.
Construct viable arguments and critique the reasoning of others.
Model with mathematcs.
Use approporiate tools stategically.
Attend to precision.
Look for and make use of structure.
Look for and express regularity in repeated reasoning.
ADDENDUM
The following are the 87thGrade Advanced links to ELA standards. These apply to all units even though they are only attached to Unit 1. LACC.68.RST.1.3: Follow precisely a multistep procedure when carrying out experiments, taking measurements, or performing technical tasks. LACC.68.RST.2.4: Determine the meaning of symbols, key terms, and other domain-specific words and phrases as they are used in a specific scientific or technical context relevant to grades 6–8 texts and topics. LACC.68.RST.3.7: Integrate quantitative or technical information expressed in words in a text with a version of that information expressed visually (e.g., in a flowchart, diagram, model, graph, or table). LACC.68.WHST.1.1: Write arguments focused on discipline-specific content.
a. Introduce claim(s) about a topic or issue, acknowledge and distinguish the claim(s) from alternate or opposing claims, and organize the reasons and evidence logically.
Marion County Public Schools – Curriculum Map Grade Level: 7 Subject: Advanced Math
June 2015 Advanced Grade 7 Unit: 1
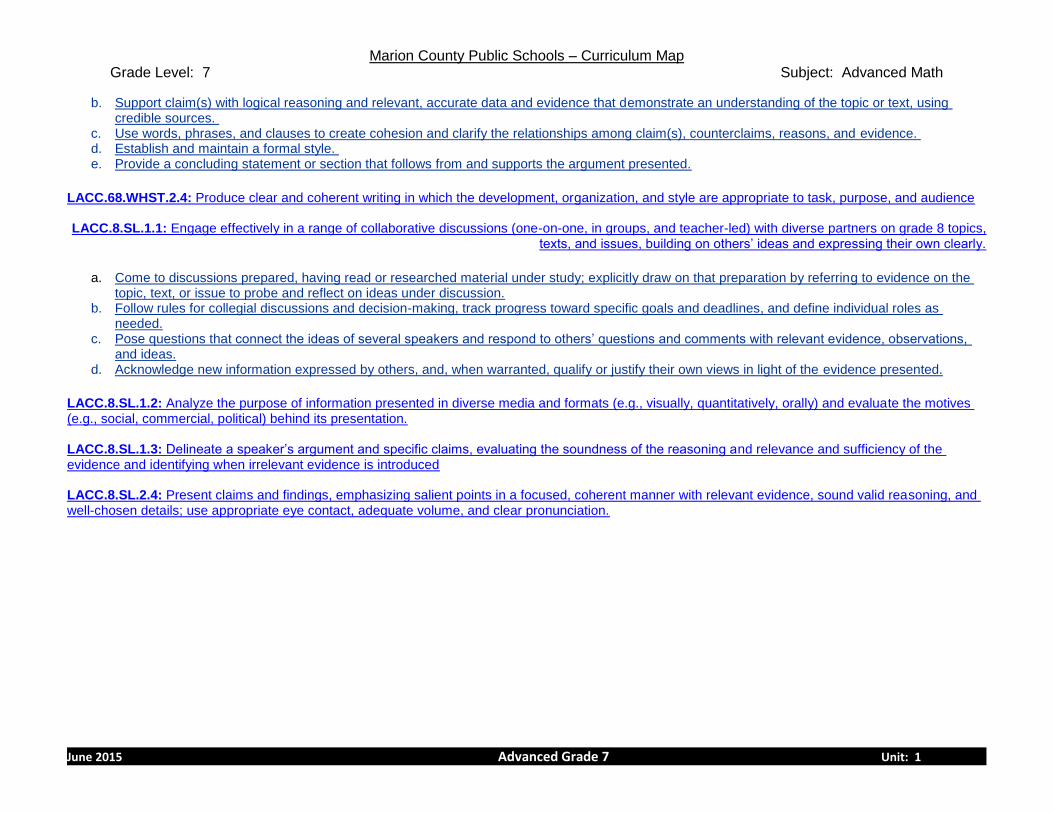
b. Support claim(s) with logical reasoning and relevant, accurate data and evidence that demonstrate an understanding of the topic or text, using credible sources.
c. Use words, phrases, and clauses to create cohesion and clarify the relationships among claim(s), counterclaims, reasons, and evidence. d. Establish and maintain a formal style. e. Provide a concluding statement or section that follows from and supports the argument presented.
LACC.68.WHST.2.4: Produce clear and coherent writing in which the development, organization, and style are appropriate to task, purpose, and audience LACC.8.SL.1.1: Engage effectively in a range of collaborative discussions (one-on-one, in groups, and teacher-led) with diverse partners on grade 8 topics,
texts, and issues, building on others’ ideas and expressing their own clearly.
a. Come to discussions prepared, having read or researched material under study; explicitly draw on that preparation by referring to evidence on the topic, text, or issue to probe and reflect on ideas under discussion.
b. Follow rules for collegial discussions and decision-making, track progress toward specific goals and deadlines, and define individual roles as needed.
c. Pose questions that connect the ideas of several speakers and respond to others’ questions and comments with relevant evidence, observations, and ideas.
d. Acknowledge new information expressed by others, and, when warranted, qualify or justify their own views in light of the evidence presented.
LACC.8.SL.1.2: Analyze the purpose of information presented in diverse media and formats (e.g., visually, quantitatively, orally) and evaluate the motives (e.g., social, commercial, political) behind its presentation. LACC.8.SL.1.3: Delineate a speaker’s argument and specific claims, evaluating the soundness of the reasoning and relevance and sufficiency of the evidence and identifying when irrelevant evidence is introduced LACC.8.SL.2.4: Present claims and findings, emphasizing salient points in a focused, coherent manner with relevant evidence, sound valid reasoning, and well-chosen details; use appropriate eye contact, adequate volume, and clear pronunciation.
Marion County Public Schools – Curriculum Map Grade Level: 7 Subject: Advanced Math
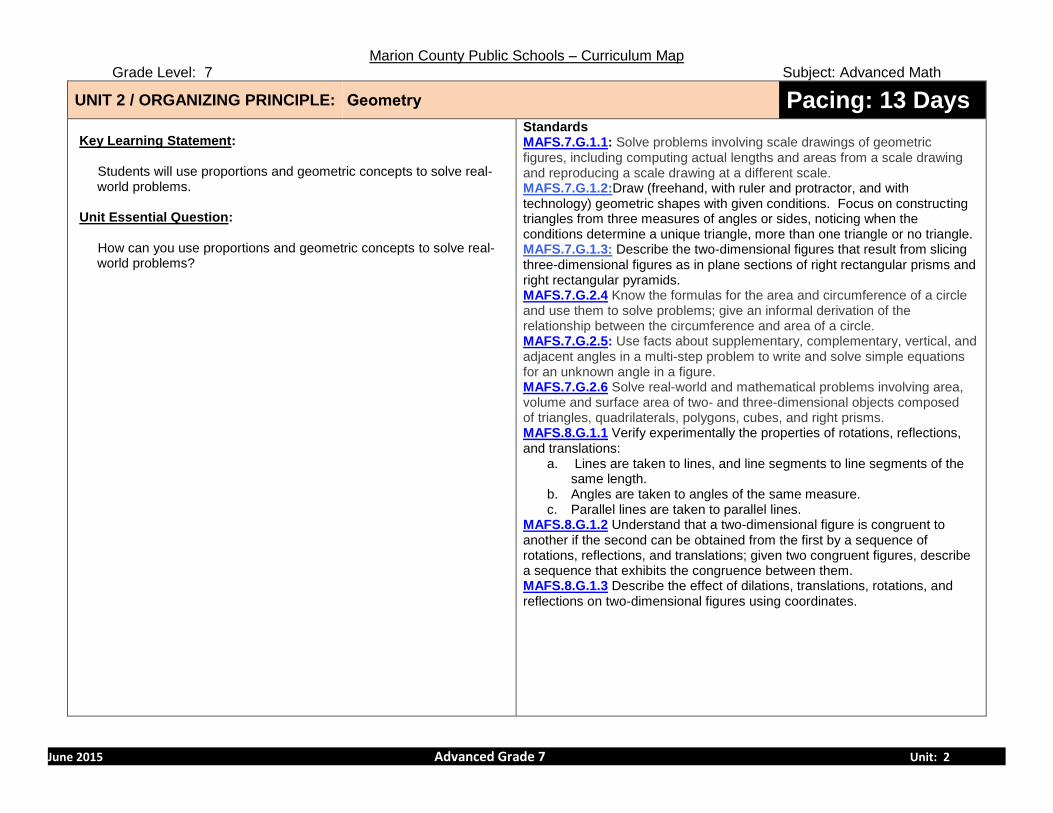
June 2015 Advanced Grade 7 Unit: 2
UNIT 2 / ORGANIZING PRINCIPLE: Geometry Pacing: 13 Days
Key Learning Statement: Students will use proportions and geometric concepts to solve real-
world problems. Unit Essential Question: How can you use proportions and geometric concepts to solve real-
world problems?
Standards MAFS.7.G.1.1: Solve problems involving scale drawings of geometric figures, including computing actual lengths and areas from a scale drawing and reproducing a scale drawing at a different scale. MAFS.7.G.1.2:Draw (freehand, with ruler and protractor, and with technology) geometric shapes with given conditions. Focus on constructing triangles from three measures of angles or sides, noticing when the conditions determine a unique triangle, more than one triangle or no triangle. MAFS.7.G.1.3: Describe the two-dimensional figures that result from slicing three-dimensional figures as in plane sections of right rectangular prisms and right rectangular pyramids. MAFS.7.G.2.4 Know the formulas for the area and circumference of a circle and use them to solve problems; give an informal derivation of the relationship between the circumference and area of a circle. MAFS.7.G.2.5: Use facts about supplementary, complementary, vertical, and adjacent angles in a multi-step problem to write and solve simple equations for an unknown angle in a figure. MAFS.7.G.2.6 Solve real-world and mathematical problems involving area, volume and surface area of two- and three-dimensional objects composed of triangles, quadrilaterals, polygons, cubes, and right prisms. MAFS.8.G.1.1 Verify experimentally the properties of rotations, reflections, and translations:
a. Lines are taken to lines, and line segments to line segments of the same length.
b. Angles are taken to angles of the same measure. c. Parallel lines are taken to parallel lines.
MAFS.8.G.1.2 Understand that a two-dimensional figure is congruent to another if the second can be obtained from the first by a sequence of rotations, reflections, and translations; given two congruent figures, describe a sequence that exhibits the congruence between them. MAFS.8.G.1.3 Describe the effect of dilations, translations, rotations, and reflections on two-dimensional figures using coordinates.

Marion County Public Schools – Curriculum Map Grade Level: 7 Subject: Advanced Math
June 2015 Advanced Grade 7 Unit: 2
Lesson Essential Questions Know/Do
How can you use scale drawing to solve problems?
How can you draw shapes that satisfy given conditions?
How can you identify cross-sections of 3-dimensional figures?
How can you use angle relationships to solve problems?
How do you find and use the circumference of a circle?
How do you find the area of a circle?
How do you find the area of composite figures?
How can you find the surface area of a figure made up of cubes and prisms?
How can you find the volume of a figure made up of cubes and prisms?
Know
Scale drawings
Similar shaptes
Angle relationshsips
Circumference
Area
Surface Area
Volume
Composite figures Do
Solve problems involving scale drawings of geometric figures.
Draw geometric shapes with given conditions.
Identify cross-sections of 3-D figures
Use angle relationshsips to solve problems.
Know and use formulas for area and circumference of circles.
Find the area of composite figures.
Find the surface area and volume using cubes and prisms.

Marion County Public Schools – Curriculum Map Grade Level: 7 Subject: Advanced Math
June 2015 Advanced Grade 7 Unit: 2
Unit 2 Pacing: 13 Days
Culminating Activity Key Vocabulary
Window “Pain” Activity from the Georgia Binder. This was their Unit 1 section (the last activity here)
Angle Degree Congruent Dimension Length Interior Angle Exterior Angle Proportion Angle Sum Theorem Vertical Angles Polygon Alternate Interior Angles Alternate Exterior Angles Adjacent Angle Corresponding Angles Supplementary Angles Congruent Complementary Angles Cross-section Intersection Scale Drawing Scale
Assessments
Module 3 Quiz
Module 4 Quiz
Module 3 Mixed Review
Module 4 Mixed Review
Unit 2 Performance Tasks
Listed below is the required learning check for Performance Matters:
Learning Check 1: Units 1 & 2 Mixed Review Assessment Readiness
(GoMath Advanced Math 2 p. 63 – 64) AND
(GoMath Advanced Math 2 p.137 – 138)

Marion County Public Schools – Curriculum Map Grade Level: 7 Subject: Advanced Math
June 2015 Advanced Grade 7 Unit: 2
Unit 2 Pacing: 13 Days
Supporting Texts Resources
Go Math 3.1 Similar Shapes and Scale Drawing 3.2 Geometric Drawings 3.3 Cross Sections 3.4 Angle Relationships 4.1 Circumference 4.2 Area of Circles 4.3 Area of Composite Figures 4.4 Solving Surface Area Problems 4.5 Solving Volume Problems
Teaching Student Centered Mathematics: Chapter 13, p. 260 – 296 Teaching Student Centered Mathematics: Chapter 14, p. 298 – 323 Blue Everglades Book: 7th and 8th Grade Mathematics Station Activities for Common Core State Standards:
Similarity and Scale
Constructing Plane Figures Portal:
Keyword: Geometry – Block Party
Keyword: Geometry – Candle Box
Keyword: Geometry – Designing Candy Cartons
Keyword: Circumference – Historic Bicycle
Keyword: Geometry – Smoothie Box Illuminations:
Tree Talk
Area Contractor
Square Circles CPalms:
Adding It All Up
Pinwheel Georgia DOE:
Lunch Lines
Pre-Assessments Standards for Math Practice
CPALMS – MFAS Tasks:
Garden Design – Resource ID# 65819
Center Circle Area – Resource ID# 70721
Solve for the Angle – Resource ID# 63041
Cube Volume & Surface Area – Resource ID# 65192
Angle Transformations – Resource ID# 66721
Multistep Congruence – Resource ID# 66741 Reflection Coordinates – Resource ID# 64656
Make sense of problems and persevere in solving them.
Reason abstractly and quantitatively.
Construct viable arguments and critique the reasoning of others.
Model with mathematcs.
Use approporiate tools stategically.
Attend to precision.
Look for and make use of structure.
Look for and express regularity in repeated reasoning.
Marion County Public Schools – Curriculum Map Grade Level: 7 Subject: Advanced Math
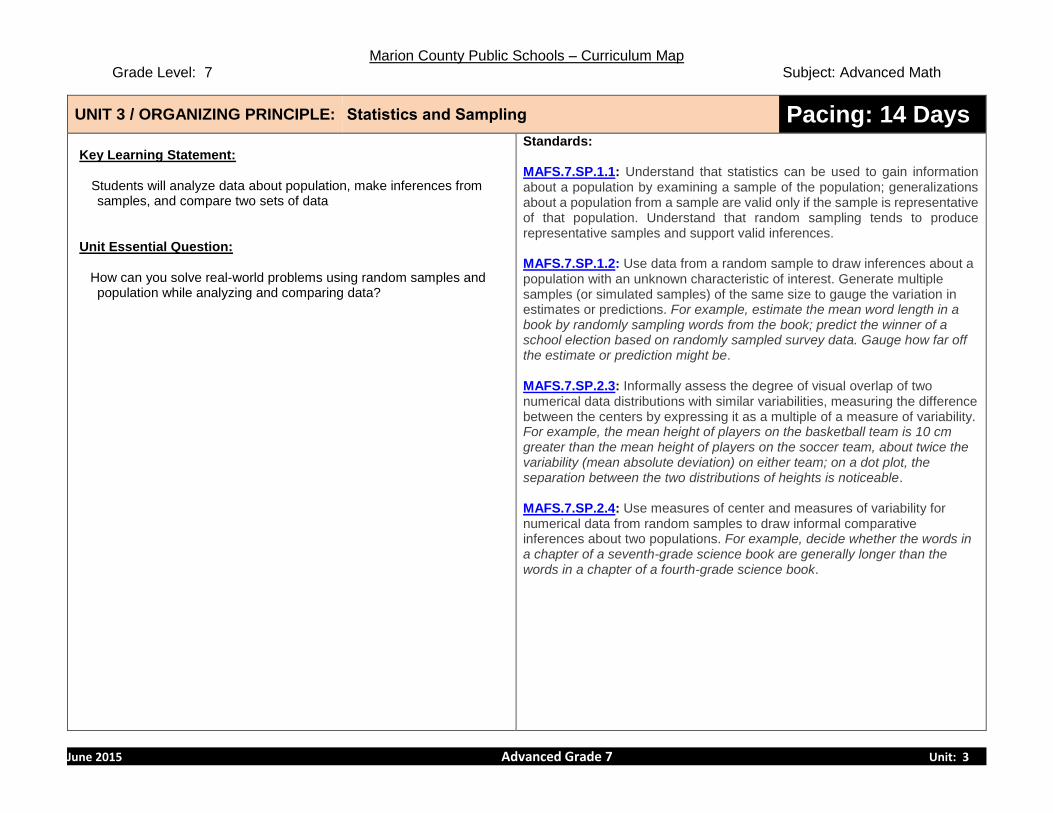
June 2015 Advanced Grade 7 Unit: 3
UNIT 3 / ORGANIZING PRINCIPLE: Statistics and Sampling Pacing: 14 Days
Key Learning Statement:
Students will analyze data about population, make inferences from samples, and compare two sets of data
Unit Essential Question: How can you solve real-world problems using random samples and
population while analyzing and comparing data?
Standards: MAFS.7.SP.1.1: Understand that statistics can be used to gain information about a population by examining a sample of the population; generalizations about a population from a sample are valid only if the sample is representative of that population. Understand that random sampling tends to produce representative samples and support valid inferences. MAFS.7.SP.1.2: Use data from a random sample to draw inferences about a population with an unknown characteristic of interest. Generate multiple samples (or simulated samples) of the same size to gauge the variation in estimates or predictions. For example, estimate the mean word length in a book by randomly sampling words from the book; predict the winner of a school election based on randomly sampled survey data. Gauge how far off the estimate or prediction might be. MAFS.7.SP.2.3: Informally assess the degree of visual overlap of two numerical data distributions with similar variabilities, measuring the difference between the centers by expressing it as a multiple of a measure of variability. For example, the mean height of players on the basketball team is 10 cm greater than the mean height of players on the soccer team, about twice the variability (mean absolute deviation) on either team; on a dot plot, the separation between the two distributions of heights is noticeable. MAFS.7.SP.2.4: Use measures of center and measures of variability for numerical data from random samples to draw informal comparative inferences about two populations. For example, decide whether the words in a chapter of a seventh-grade science book are generally longer than the words in a chapter of a fourth-grade science book.

Marion County Public Schools – Curriculum Map Grade Level: 7 Subject: Advanced Math
June 2015 Advanced Grade 7 Unit: 3
Lesson Essential Questions Know/Do
How can you use a sample to gain information about a population?
How can you generate and use random samples to represent a population?
How do you compare two sets of data displayed in dot plots?
How do you compare two sets of data displayed in box plots?
How can you use statistical measures to compare populations?
Know:
Box plots
Stem-and-leaf plots
Histograms
Dot plots
Summarizing numeric data
Mean
Median
Do:
Use random and nonrandom sampling
Make inferences from dot plots and box plots
Use data to make inferences or predictions about a population
Compare two sets of data

Marion County Public Schools – Curriculum Map Grade Level: 7 Subject: Advanced Math
June 2015 Advanced Grade 7 Unit: 3
Unit 3 Pacing: 14 Days
Culminating Activity Key Vocabulary
box plot biased sample data population dot plot random sample interquartile range sample lower quartile mean median measure of center spread measure of spread survey mean absolute deviation upper quartile
Assessments
Module 5 Quiz
Module 6 Quiz
Module 5 Mixed Review
Module 6 Mixed Review
Unit 3 Mixed review
Performance Tasks
The required learning check for this unit will be after Unit 4.

Marion County Public Schools – Curriculum Map Grade Level: 7 Subject: Advanced Math
June 2015 Advanced Grade 7 Unit: 3
Unit 3 Pacing: 14 Days
Supporting Texts Resources
Go Math 5.1 Populations and Samples 5.2 Making inferences from a random Sample 5.3 Generating Random Samples 6.1 Comparing Data Displayed in Dot Plots 6.2 Comparing Data Displayed in Box Plots 6.3 Using Statistical Measures to Compare Populations
Teaching Student Centered Mathematics: Chapter 12, p. 222 – 259 Teaching Student Centered Mathematics: Chapter 15, p. 325 – 353 Blue Everglades Book: 7th and 8th Grade Illuminations:
Using NBS Statistics for Box and Whisker Plots
Bears in a Boat
The Celebrated Jumping Frog Portal:
Keyword: Statistics and Probability – Candy Bars Cpalms:
Pick Me! Pick Me!
And the Survey Says
Pre-Assessments Standards for Math Practice
CPALMS – MFAS Tasks:
Ice Cream Survey – Resource ID# 65207
Movie Genre – Resource ID# 65787
TV Ages -1 – Resource ID# 70682 Word Length – Resource ID# 66146
Make sense of problems and persevere in solving them.
Reason abstractly and quantitatively.
Construct viable arguments and critique the reasoning of others.
Model with mathematcs.
Use approporiate tools stategically.
Attend to precision.
Look for and make use of structure.
Look for and express regularity in repeated reasoning.
Marion County Public Schools – Curriculum Map Grade Level: 7 Subject: Advanced Math
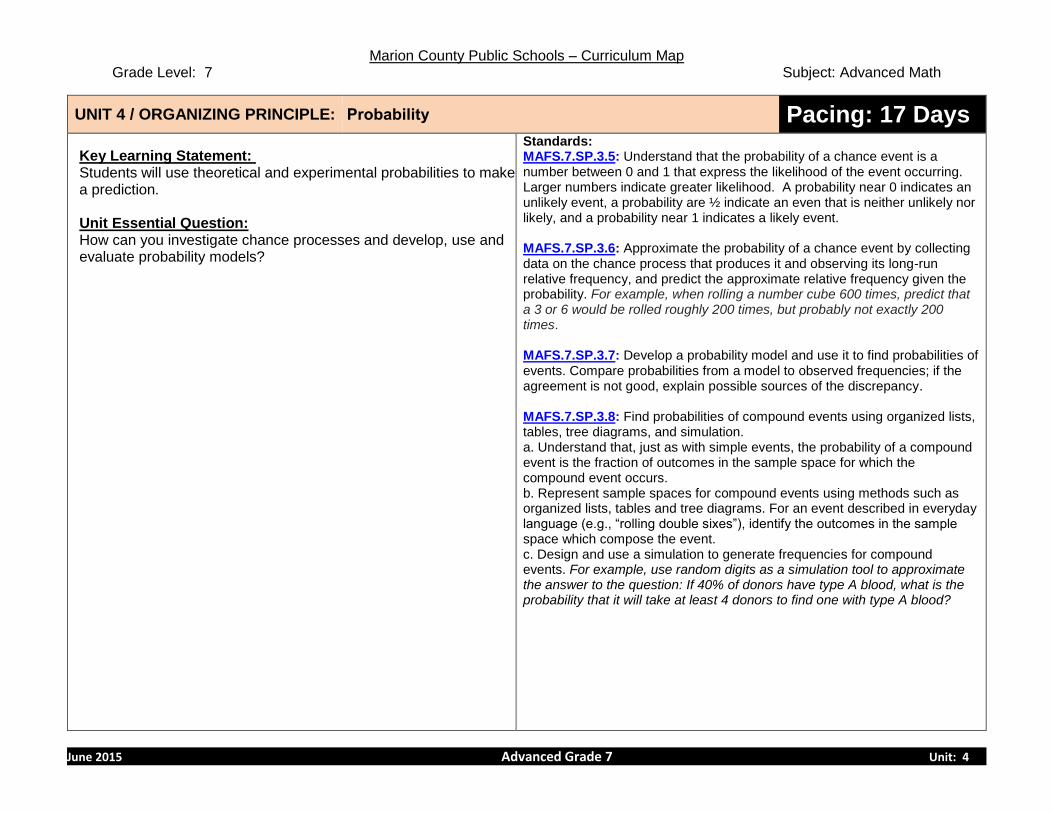
June 2015 Advanced Grade 7 Unit: 4
UNIT 4 / ORGANIZING PRINCIPLE: Probability Pacing: 17 Days
Key Learning Statement: Students will use theoretical and experimental probabilities to make a prediction. Unit Essential Question: How can you investigate chance processes and develop, use and evaluate probability models?
Standards: MAFS.7.SP.3.5: Understand that the probability of a chance event is a number between 0 and 1 that express the likelihood of the event occurring. Larger numbers indicate greater likelihood. A probability near 0 indicates an unlikely event, a probability are ½ indicate an even that is neither unlikely nor likely, and a probability near 1 indicates a likely event. MAFS.7.SP.3.6: Approximate the probability of a chance event by collecting data on the chance process that produces it and observing its long-run relative frequency, and predict the approximate relative frequency given the probability. For example, when rolling a number cube 600 times, predict that a 3 or 6 would be rolled roughly 200 times, but probably not exactly 200 times. MAFS.7.SP.3.7: Develop a probability model and use it to find probabilities of events. Compare probabilities from a model to observed frequencies; if the agreement is not good, explain possible sources of the discrepancy. MAFS.7.SP.3.8: Find probabilities of compound events using organized lists, tables, tree diagrams, and simulation. a. Understand that, just as with simple events, the probability of a compound event is the fraction of outcomes in the sample space for which the compound event occurs. b. Represent sample spaces for compound events using methods such as organized lists, tables and tree diagrams. For an event described in everyday language (e.g., “rolling double sixes”), identify the outcomes in the sample space which compose the event. c. Design and use a simulation to generate frequencies for compound events. For example, use random digits as a simulation tool to approximate the answer to the question: If 40% of donors have type A blood, what is the probability that it will take at least 4 donors to find one with type A blood?
Marion County Public Schools – Curriculum Map Grade Level: 7 Subject: Advanced Math
June 2015 Advanced Grade 7 Unit: 4
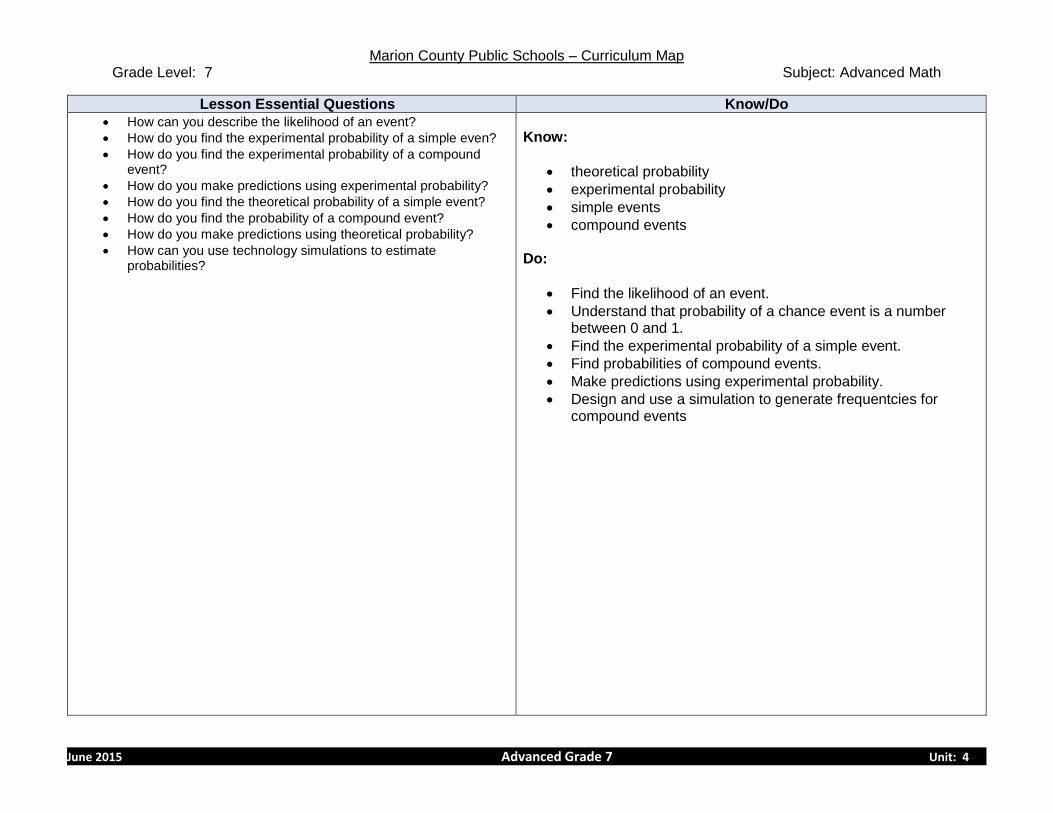
Lesson Essential Questions Know/Do
How can you describe the likelihood of an event?
How do you find the experimental probability of a simple even?
How do you find the experimental probability of a compound event?
How do you make predictions using experimental probability?
How do you find the theoretical probability of a simple event?
How do you find the probability of a compound event?
How do you make predictions using theoretical probability?
How can you use technology simulations to estimate probabilities?
Know:
theoretical probability
experimental probability
simple events
compound events
Do:
Find the likelihood of an event.
Understand that probability of a chance event is a number between 0 and 1.
Find the experimental probability of a simple event.
Find probabilities of compound events.
Make predictions using experimental probability.
Design and use a simulation to generate frequentcies for compound events
Marion County Public Schools – Curriculum Map Grade Level: 7 Subject: Advanced Math
June 2015 Advanced Grade 7 Unit: 4
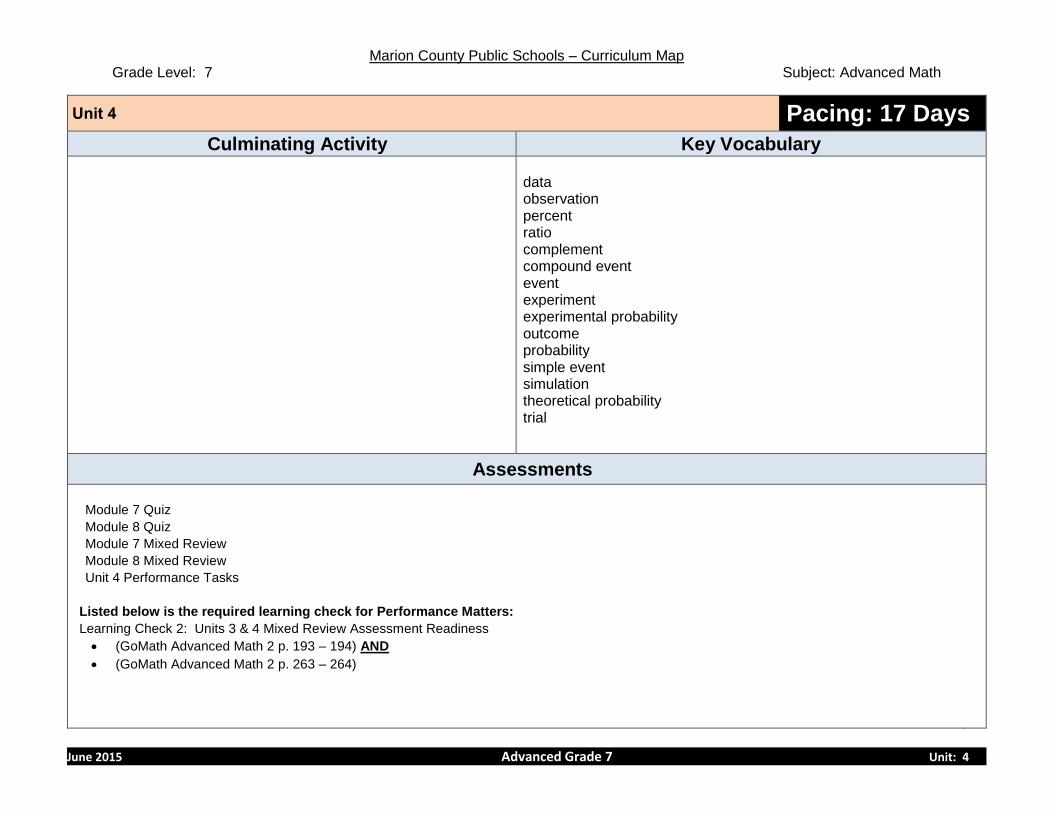
Unit 4 Pacing: 17 Days
Culminating Activity Key Vocabulary
data observation percent ratio complement compound event event experiment experimental probability outcome probability simple event simulation theoretical probability trial
Assessments
Module 7 Quiz
Module 8 Quiz
Module 7 Mixed Review
Module 8 Mixed Review
Unit 4 Performance Tasks
Listed below is the required learning check for Performance Matters:
Learning Check 2: Units 3 & 4 Mixed Review Assessment Readiness
(GoMath Advanced Math 2 p. 193 – 194) AND
(GoMath Advanced Math 2 p. 263 – 264)
Marion County Public Schools – Curriculum Map Grade Level: 7 Subject: Advanced Math
June 2015 Advanced Grade 7 Unit: 4
Unit 4 Pacing: 17 Days
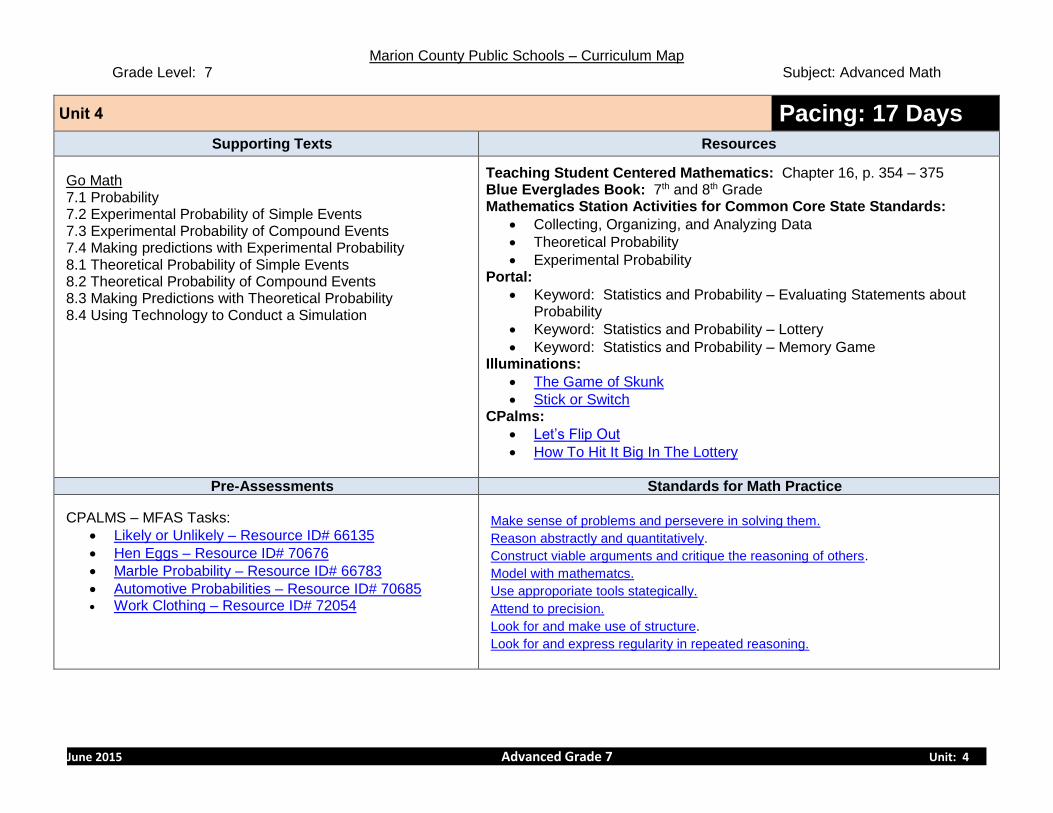
Supporting Texts Resources
Go Math 7.1 Probability 7.2 Experimental Probability of Simple Events 7.3 Experimental Probability of Compound Events 7.4 Making predictions with Experimental Probability 8.1 Theoretical Probability of Simple Events 8.2 Theoretical Probability of Compound Events 8.3 Making Predictions with Theoretical Probability 8.4 Using Technology to Conduct a Simulation
Teaching Student Centered Mathematics: Chapter 16, p. 354 – 375 Blue Everglades Book: 7th and 8th Grade Mathematics Station Activities for Common Core State Standards:
Collecting, Organizing, and Analyzing Data
Theoretical Probability
Experimental Probability Portal:
Keyword: Statistics and Probability – Evaluating Statements about Probability
Keyword: Statistics and Probability – Lottery
Keyword: Statistics and Probability – Memory Game Illuminations:
The Game of Skunk
Stick or Switch CPalms:
Let’s Flip Out
How To Hit It Big In The Lottery
Pre-Assessments Standards for Math Practice
CPALMS – MFAS Tasks:
Likely or Unlikely – Resource ID# 66135
Hen Eggs – Resource ID# 70676
Marble Probability – Resource ID# 66783
Automotive Probabilities – Resource ID# 70685 Work Clothing – Resource ID# 72054
Make sense of problems and persevere in solving them.
Reason abstractly and quantitatively.
Construct viable arguments and critique the reasoning of others.
Model with mathematcs.
Use approporiate tools stategically.
Attend to precision.
Look for and make use of structure.
Look for and express regularity in repeated reasoning.

Marion County Public Schools – Curriculum Map Grade Level: 7 Subject: Advanced Math
June 2015 Advanced Grade 7 Unit: 5
UNIT 5 / ORGANIZING PRINCIPLE: Real Numbers, Exponents, and Scientific Notation Pacing: 12 days
Key Learning Statement: Students will use real numbers and scientific notation to solve real world problems.
Unit Essential Question: How can you use real numbers and/or scientific notation to solve real world problems?
Standards MAFS.8.EE.1.1: Know and apply the properties of integer exponents to generate equivalent numerical expressions. For example, 32 × 3–5 = 3–3 = 1/33 = 1/27. MAFS.8.EE.1.2: Use square root and cube root symbols to represent solutions to equations of the form x2 = p and x3 = p, where p is a positive rational number. Evaluate square roots of small perfect squares and cube roots of small perfect cubes. Know that √2 is irrational. MAFS.8.EE.1.3: Use numbers expressed in the form of a single digit times an integer power of 10 to estimate very large or very small quantities, and to express how many times as much one is than the other. MAFS.8.EE.1.4: Perform operations with numbers expressed in scientific notation, including problems where both decimal and scientific notation are used. Use scientific notation and choose units of appropriate size for measurements of very large or very small quantities (e.g., use millimeters per year for seafloor spreading). Interpret scientific notation that has been generated by technology. MAFS.8.NS.1.1: Know that numbers that are not rational are called irrational. Understand informally that every number has a decimal expansion; for rational numbers show that the decimal expansion repeats eventually, and convert a decimal expansion which repeats eventually into a rational number. MAFS.8.NS.1.2: Use rational approximations of irrational numbers to compare the size of irrational numbers, locate them approximately on a number line diagram, and estimate the value of expressions (e.g., π2).

Marion County Public Schools – Curriculum Map Grade Level: 7 Subject: Advanced Math
June 2015 Advanced Grade 7 Unit: 5
Lesson Essential Questions Know/Do
How do you rewrite rational numbers and decimals, take square roots and cube roots, and approximate irrational numbers?
How can you describe relationships between sets of real numbers?
How do you order a set of real numbers?
How do you add, subtract, multiply and divide using scientific notation?
How can you develop and use the properties of integer exponents?
How can you use scientific notation to express very large quantities?
How can you use scientific notation to express very small quantities?
Know
Properties of integer exponents
Exponents
Radicals
Scientific Notation
The Square Root of 2 is irrational
Rational Numbers
Decimals Do
Apply properties of integer exponents to simplify expressions
Simplify square and cube roots
Evaluate and recognize perfect squares and perfect cubes
Solve simple equations involving exponents and radicals
Express values in scientific notation
Perform operations with scientifc notation
Interpret values written in scienticic notation
Use technology to generate and interpret data involving exponents and radicals
Order rational and irrational numbers.
Marion County Public Schools – Curriculum Map Grade Level: 7 Subject: Advanced Math
June 2015 Advanced Grade 7 Unit: 5
Unit 5 Pacing: 12 Days
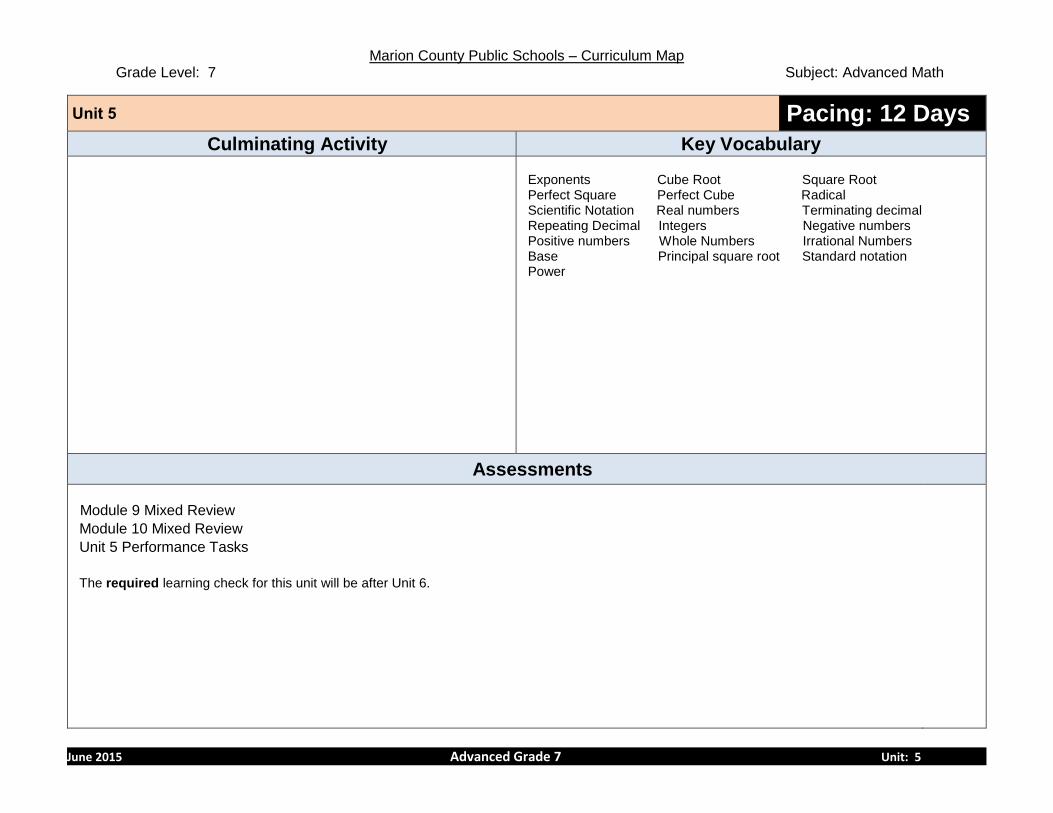
Culminating Activity Key Vocabulary
Exponents Cube Root Square Root Perfect Square Perfect Cube Radical Scientific Notation Real numbers Terminating decimal Repeating Decimal Integers Negative numbers Positive numbers Whole Numbers Irrational Numbers Base Principal square root Standard notation Power
Assessments
Module 9 Mixed Review
Module 10 Mixed Review
Unit 5 Performance Tasks
The required learning check for this unit will be after Unit 6.
Marion County Public Schools – Curriculum Map Grade Level: 7 Subject: Advanced Math
June 2015 Advanced Grade 7 Unit: 5
Unit 5 Pacing: 12 Days
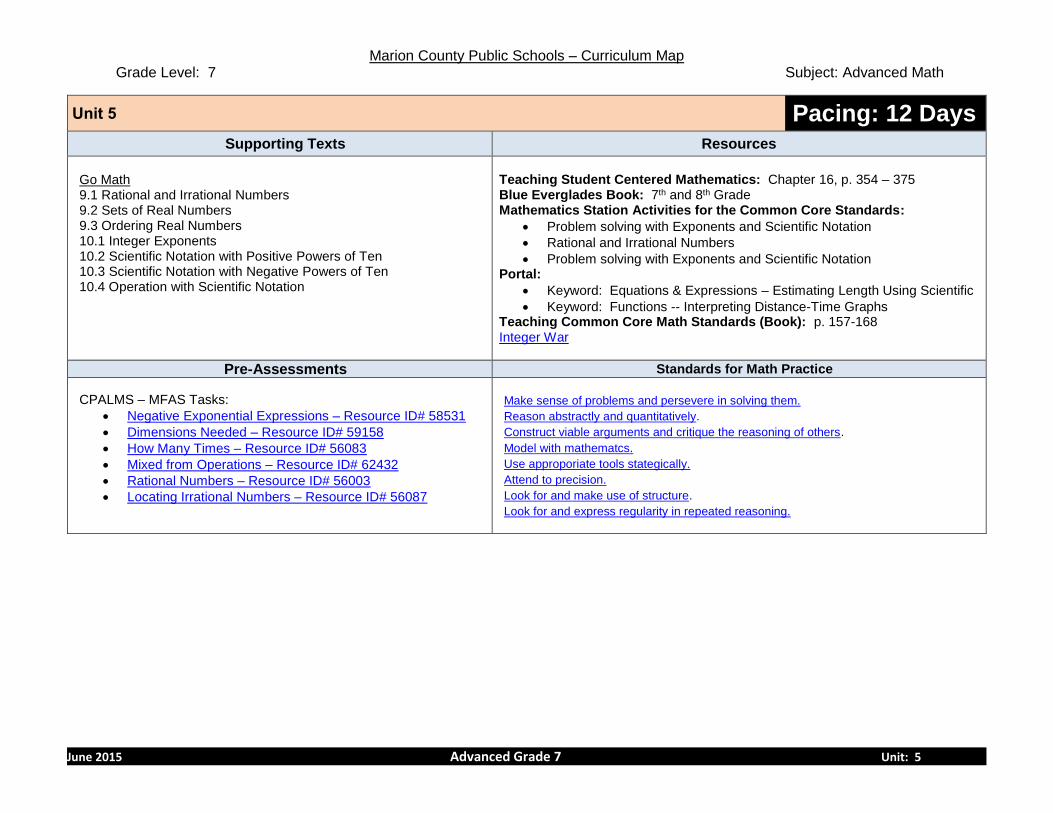
Supporting Texts Resources
Go Math 9.1 Rational and Irrational Numbers 9.2 Sets of Real Numbers 9.3 Ordering Real Numbers 10.1 Integer Exponents 10.2 Scientific Notation with Positive Powers of Ten 10.3 Scientific Notation with Negative Powers of Ten 10.4 Operation with Scientific Notation
Teaching Student Centered Mathematics: Chapter 16, p. 354 – 375 Blue Everglades Book: 7th and 8th Grade Mathematics Station Activities for the Common Core Standards:
Problem solving with Exponents and Scientific Notation
Rational and Irrational Numbers
Problem solving with Exponents and Scientific Notation Portal:
Keyword: Equations & Expressions – Estimating Length Using Scientific
Keyword: Functions -- Interpreting Distance-Time Graphs Teaching Common Core Math Standards (Book): p. 157-168 Integer War
Pre-Assessments Standards for Math Practice
CPALMS – MFAS Tasks:
Negative Exponential Expressions – Resource ID# 58531
Dimensions Needed – Resource ID# 59158
How Many Times – Resource ID# 56083
Mixed from Operations – Resource ID# 62432
Rational Numbers – Resource ID# 56003
Locating Irrational Numbers – Resource ID# 56087
Make sense of problems and persevere in solving them.
Reason abstractly and quantitatively.
Construct viable arguments and critique the reasoning of others.
Model with mathematcs.
Use approporiate tools stategically.
Attend to precision.
Look for and make use of structure.
Look for and express regularity in repeated reasoning.
Marion County Public Schools – Curriculum Map Grade Level: 7 Subject: Advanced Math
June 2015 Advanced Grade 7 Unit: 6
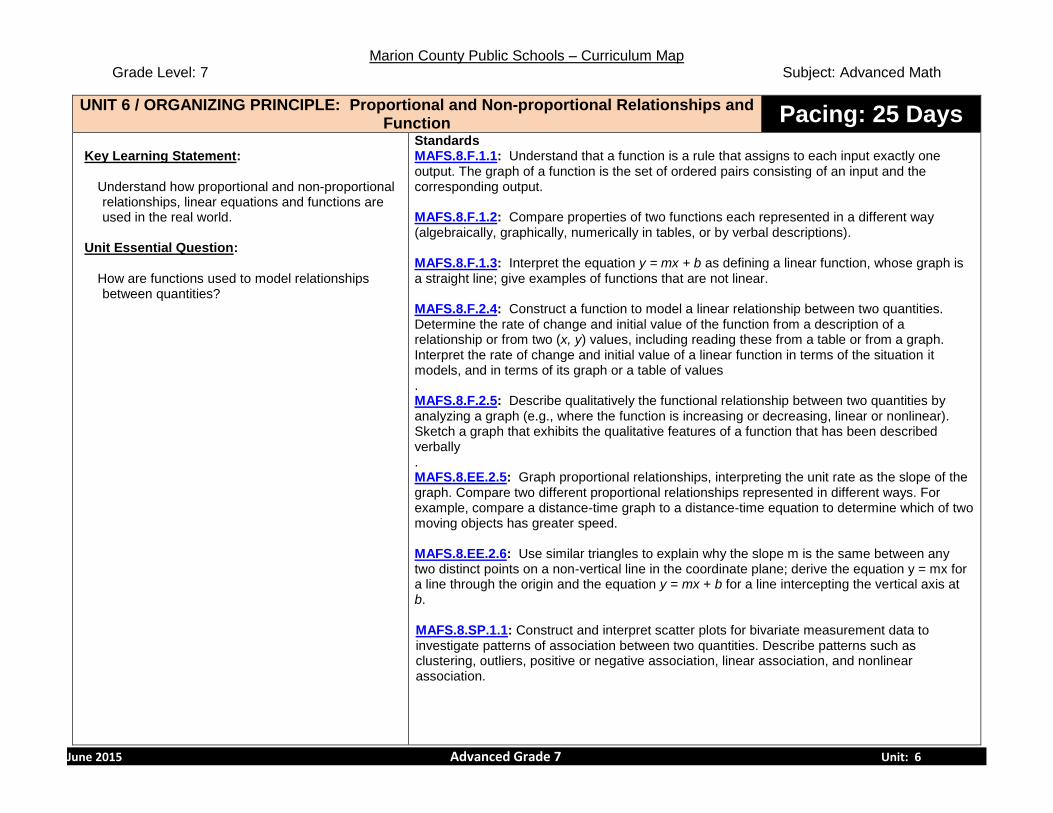
UNIT 6 / ORGANIZING PRINCIPLE: Proportional and Non-proportional Relationships and Function Pacing: 25 Days
Key Learning Statement:
Understand how proportional and non-proportional relationships, linear equations and functions are used in the real world.
Unit Essential Question:
How are functions used to model relationships between quantities?
Standards MAFS.8.F.1.1: Understand that a function is a rule that assigns to each input exactly one output. The graph of a function is the set of ordered pairs consisting of an input and the corresponding output. MAFS.8.F.1.2: Compare properties of two functions each represented in a different way (algebraically, graphically, numerically in tables, or by verbal descriptions). MAFS.8.F.1.3: Interpret the equation y = mx + b as defining a linear function, whose graph is a straight line; give examples of functions that are not linear. MAFS.8.F.2.4: Construct a function to model a linear relationship between two quantities. Determine the rate of change and initial value of the function from a description of a relationship or from two (x, y) values, including reading these from a table or from a graph. Interpret the rate of change and initial value of a linear function in terms of the situation it models, and in terms of its graph or a table of values . MAFS.8.F.2.5: Describe qualitatively the functional relationship between two quantities by analyzing a graph (e.g., where the function is increasing or decreasing, linear or nonlinear). Sketch a graph that exhibits the qualitative features of a function that has been described verbally . MAFS.8.EE.2.5: Graph proportional relationships, interpreting the unit rate as the slope of the graph. Compare two different proportional relationships represented in different ways. For example, compare a distance-time graph to a distance-time equation to determine which of two moving objects has greater speed. MAFS.8.EE.2.6: Use similar triangles to explain why the slope m is the same between any two distinct points on a non-vertical line in the coordinate plane; derive the equation y = mx for a line through the origin and the equation y = mx + b for a line intercepting the vertical axis at b. MAFS.8.SP.1.1: Construct and interpret scatter plots for bivariate measurement data to investigate patterns of association between two quantities. Describe patterns such as clustering, outliers, positive or negative association, linear association, and nonlinear association.
Marion County Public Schools – Curriculum Map Grade Level: 7 Subject: Advanced Math
June 2015 Advanced Grade 7 Unit: 6
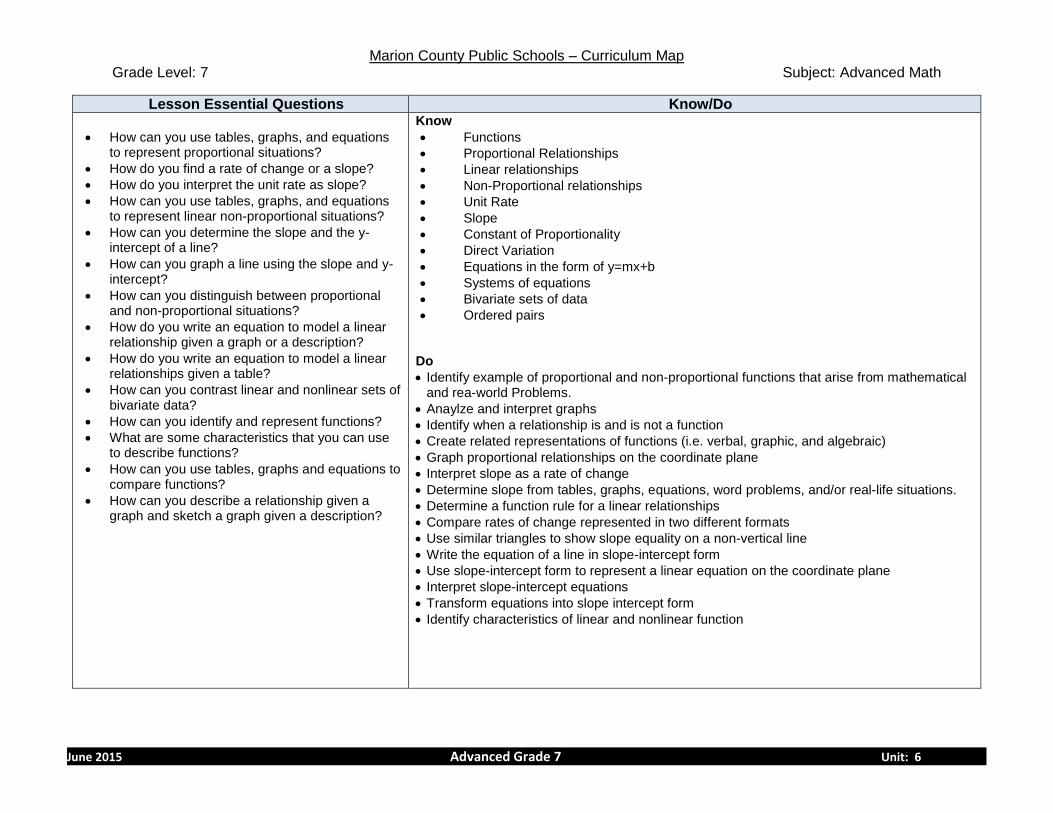
Lesson Essential Questions Know/Do
How can you use tables, graphs, and equations to represent proportional situations?
How do you find a rate of change or a slope?
How do you interpret the unit rate as slope?
How can you use tables, graphs, and equations to represent linear non-proportional situations?
How can you determine the slope and the y-intercept of a line?
How can you graph a line using the slope and y-intercept?
How can you distinguish between proportional and non-proportional situations?
How do you write an equation to model a linear relationship given a graph or a description?
How do you write an equation to model a linear relationships given a table?
How can you contrast linear and nonlinear sets of bivariate data?
How can you identify and represent functions?
What are some characteristics that you can use to describe functions?
How can you use tables, graphs and equations to compare functions?
How can you describe a relationship given a graph and sketch a graph given a description?
Know
Functions
Proportional Relationships
Linear relationships
Non-Proportional relationships
Unit Rate
Slope
Constant of Proportionality
Direct Variation
Equations in the form of y=mx+b
Systems of equations
Bivariate sets of data
Ordered pairs Do
Identify example of proportional and non-proportional functions that arise from mathematical and rea-world Problems.
Anaylze and interpret graphs
Identify when a relationship is and is not a function
Create related representations of functions (i.e. verbal, graphic, and algebraic)
Graph proportional relationships on the coordinate plane
Interpret slope as a rate of change
Determine slope from tables, graphs, equations, word problems, and/or real-life situations.
Determine a function rule for a linear relationships
Compare rates of change represented in two different formats
Use similar triangles to show slope equality on a non-vertical line
Write the equation of a line in slope-intercept form
Use slope-intercept form to represent a linear equation on the coordinate plane
Interpret slope-intercept equations
Transform equations into slope intercept form
Identify characteristics of linear and nonlinear function
Marion County Public Schools – Curriculum Map Grade Level: 7 Subject: Advanced Math
June 2015 Advanced Grade 7 Unit: 6
Unit 6 Pacing: 25 Days
Culminating Activity Key Vocabulary
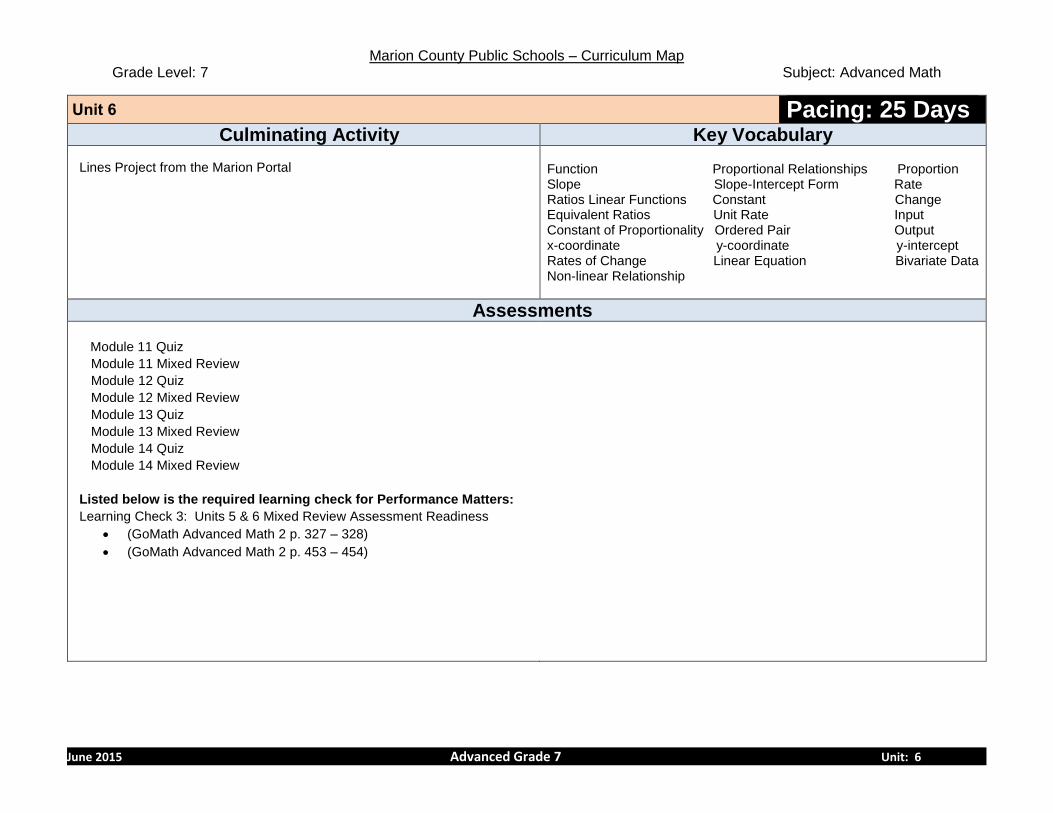
Lines Project from the Marion Portal
Function Proportional Relationships Proportion Slope Slope-Intercept Form Rate Ratios Linear Functions Constant Change Equivalent Ratios Unit Rate Input Constant of Proportionality Ordered Pair Output x-coordinate y-coordinate y-intercept Rates of Change Linear Equation Bivariate Data Non-linear Relationship
Assessments
Module 11 Quiz
Module 11 Mixed Review
Module 12 Quiz
Module 12 Mixed Review
Module 13 Quiz
Module 13 Mixed Review
Module 14 Quiz
Module 14 Mixed Review
Listed below is the required learning check for Performance Matters:
Learning Check 3: Units 5 & 6 Mixed Review Assessment Readiness
(GoMath Advanced Math 2 p. 327 – 328)
(GoMath Advanced Math 2 p. 453 – 454)

Marion County Public Schools – Curriculum Map Grade Level: 7 Subject: Advanced Math
June 2015 Advanced Grade 7 Unit: 6
Unit 6 Pacing: 25 Days
Supporting Texts Resources
Go Math 11.1 Representing Proportional Relationships 11.2 Rate of Change and Slope 11.3 Interpreting the Unite Rate as Slope 12.1 Representing Linear Non-Proportional Relationships 12.2 Determining Slope and y-intercept 12.3 Graphing Linear Non-proportional Relationships using slope and
y-intercept 12.4 Proportional and Non-Proportional Situations 13.1 Writing Linear Equations from Situations and Graphs 13.2 Writing Line Equations from a Table 13.3 Linear relationships and Bivariate Data 14.1 Identifying and Representing Functions 14.2 Describing Functions 14.3 Comparing Functions 14.4 Analyzing Graphs
Teaching Student Centered Mathematics: Chapter 11, p. 201 – 216 Teaching Student Centered Mathematics: Chapter 12, p. 242 – 254 Teaching Student Centered Mathematics: Chapter 15, p. 340 – 342 Blue Everglades Book: 7th and 8th Grade Mathematics Station Activities for the Common Core State Standards:
Slope and Slope Intercept Form
Relations vs. Functions and Linear vs. Nonlinear
Real-World Situation Graphs Teaching Common Core Math Standards (Book): p. 169-172 & 182-200 AIMS Book:
Looking at Lines Illustrative Mathematics:
Battery Charging Internet 4 Classrooms:
Identifying x- & y-intercepts Georgia DOE:
Vending Machines
Secret Codes and Number Rules
Heartbeats
Forget the Formula WNET
Pre-Assessments Standards for Math Practice
CPALMS – MFAS Tasks:
Identifying Algebraic Functions – Resource ID# 57845
This House is Mine! – Resource ID# 57921
What Am I? – Resource ID# 60546
Smart TV – Resource ID# 64596
Jet Fuel – Resource ID# 64660
Proportional Paint – Resource ID# 58625
Deriving Lines -2 – Resource ID# 66710
Bungee Cord Data – Resource ID# 68337
Make sense of problems and persevere in solving them.
Reason abstractly and quantitatively.
Construct viable arguments and critique the reasoning of others.
Model with mathematcs.
Use approporiate tools stategically.
Attend to precision.
Look for and make use of structure.
Look for and express regularity in repeated reasoning.
Marion County Public Schools – Curriculum Map Grade Level: 7 Subject: Advanced Math
June 2015 Advanced Grade 7 Unit: 6
Marion County Public Schools – Curriculum Map Grade Level: 7 Subject: Advanced Math
June 2015 Advanced Grade 7 Unit: 7
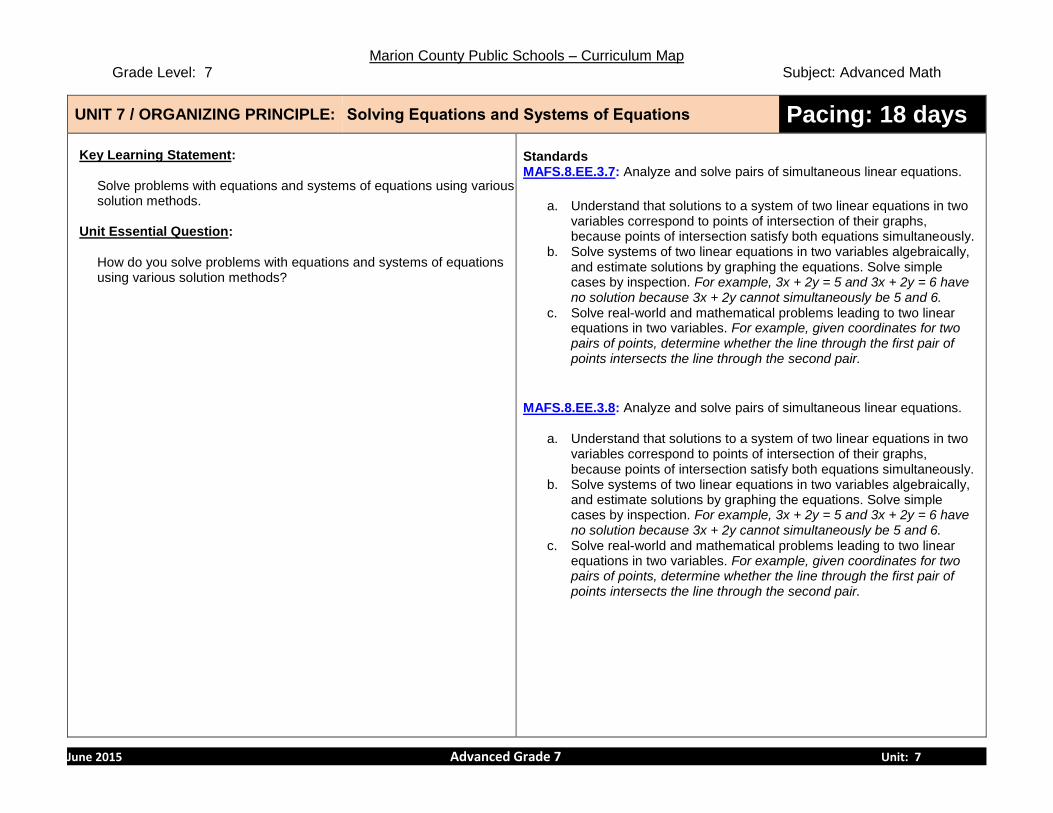
UNIT 7 / ORGANIZING PRINCIPLE: Solving Equations and Systems of Equations Pacing: 18 days
Key Learning Statement:
Solve problems with equations and systems of equations using various solution methods.
Unit Essential Question:
How do you solve problems with equations and systems of equations using various solution methods?
Standards MAFS.8.EE.3.7: Analyze and solve pairs of simultaneous linear equations.
a. Understand that solutions to a system of two linear equations in two variables correspond to points of intersection of their graphs, because points of intersection satisfy both equations simultaneously.
b. Solve systems of two linear equations in two variables algebraically, and estimate solutions by graphing the equations. Solve simple cases by inspection. For example, 3x + 2y = 5 and 3x + 2y = 6 have no solution because 3x + 2y cannot simultaneously be 5 and 6.
c. Solve real-world and mathematical problems leading to two linear equations in two variables. For example, given coordinates for two pairs of points, determine whether the line through the first pair of points intersects the line through the second pair.
MAFS.8.EE.3.8: Analyze and solve pairs of simultaneous linear equations.
a. Understand that solutions to a system of two linear equations in two variables correspond to points of intersection of their graphs, because points of intersection satisfy both equations simultaneously.
b. Solve systems of two linear equations in two variables algebraically, and estimate solutions by graphing the equations. Solve simple cases by inspection. For example, 3x + 2y = 5 and 3x + 2y = 6 have no solution because 3x + 2y cannot simultaneously be 5 and 6.
c. Solve real-world and mathematical problems leading to two linear equations in two variables. For example, given coordinates for two pairs of points, determine whether the line through the first pair of points intersects the line through the second pair.
Marion County Public Schools – Curriculum Map Grade Level: 7 Subject: Advanced Math
June 2015 Advanced Grade 7 Unit: 7
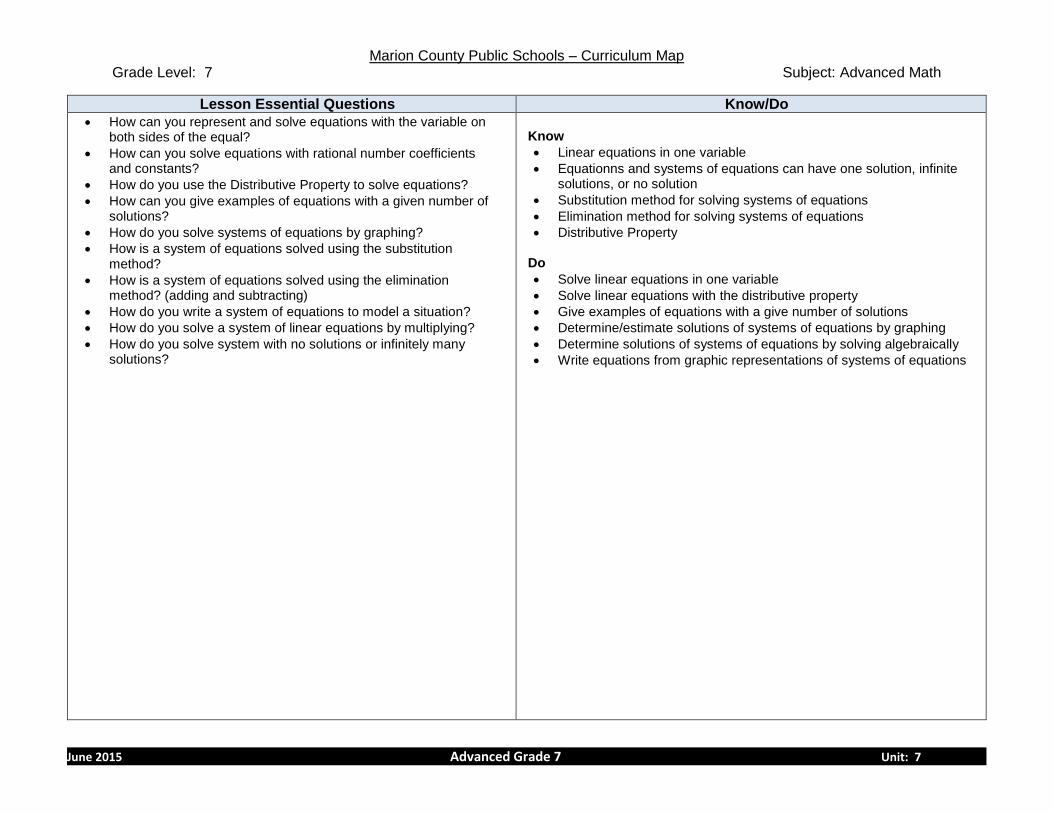
Lesson Essential Questions Know/Do
How can you represent and solve equations with the variable on both sides of the equal?
How can you solve equations with rational number coefficients and constants?
How do you use the Distributive Property to solve equations?
How can you give examples of equations with a given number of solutions?
How do you solve systems of equations by graphing?
How is a system of equations solved using the substitution method?
How is a system of equations solved using the elimination method? (adding and subtracting)
How do you write a system of equations to model a situation?
How do you solve a system of linear equations by multiplying?
How do you solve system with no solutions or infinitely many solutions?
Know
Linear equations in one variable
Equationns and systems of equations can have one solution, infinite solutions, or no solution
Substitution method for solving systems of equations
Elimination method for solving systems of equations
Distributive Property
Do
Solve linear equations in one variable
Solve linear equations with the distributive property
Give examples of equations with a give number of solutions
Determine/estimate solutions of systems of equations by graphing
Determine solutions of systems of equations by solving algebraically
Write equations from graphic representations of systems of equations
Marion County Public Schools – Curriculum Map Grade Level: 7 Subject: Advanced Math
June 2015 Advanced Grade 7 Unit: 7
Unit 7 Pacing: 18 Days
Culminating Activity Key Vocabulary
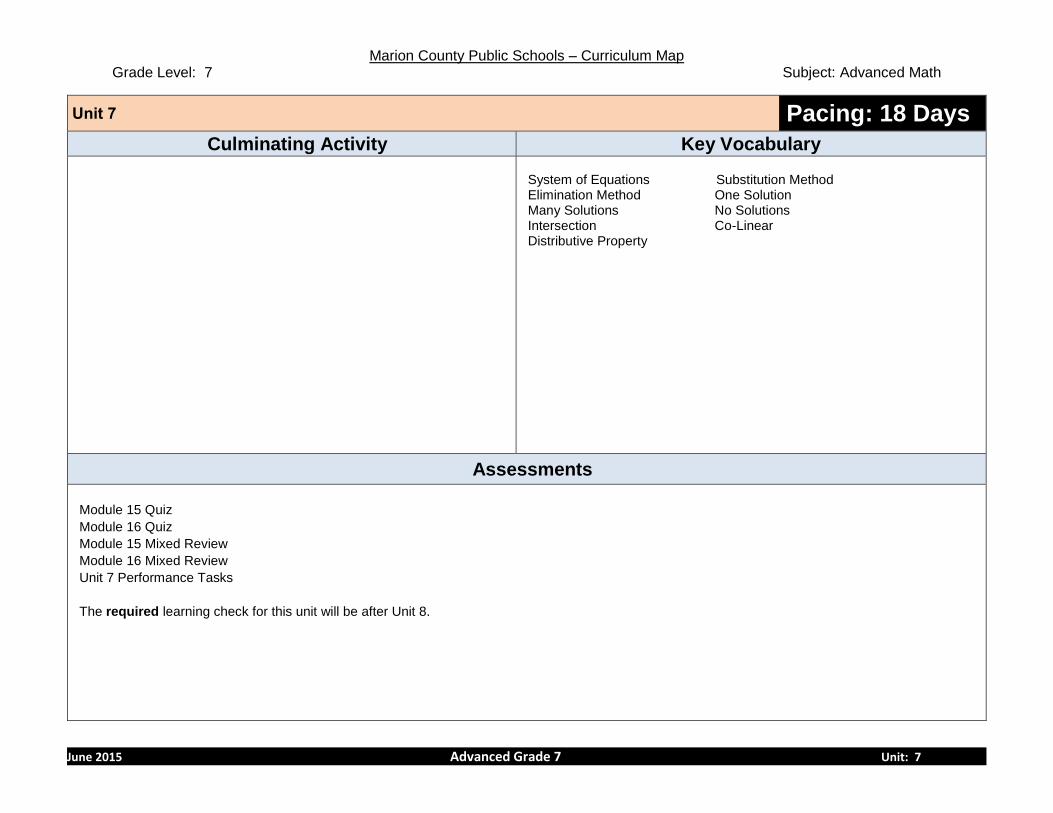
System of Equations Substitution Method Elimination Method One Solution Many Solutions No Solutions Intersection Co-Linear Distributive Property
Assessments
Module 15 Quiz
Module 16 Quiz
Module 15 Mixed Review
Module 16 Mixed Review
Unit 7 Performance Tasks
The required learning check for this unit will be after Unit 8.
Marion County Public Schools – Curriculum Map Grade Level: 7 Subject: Advanced Math
June 2015 Advanced Grade 7 Unit: 7
Unit 7 Pacing: 18 Days
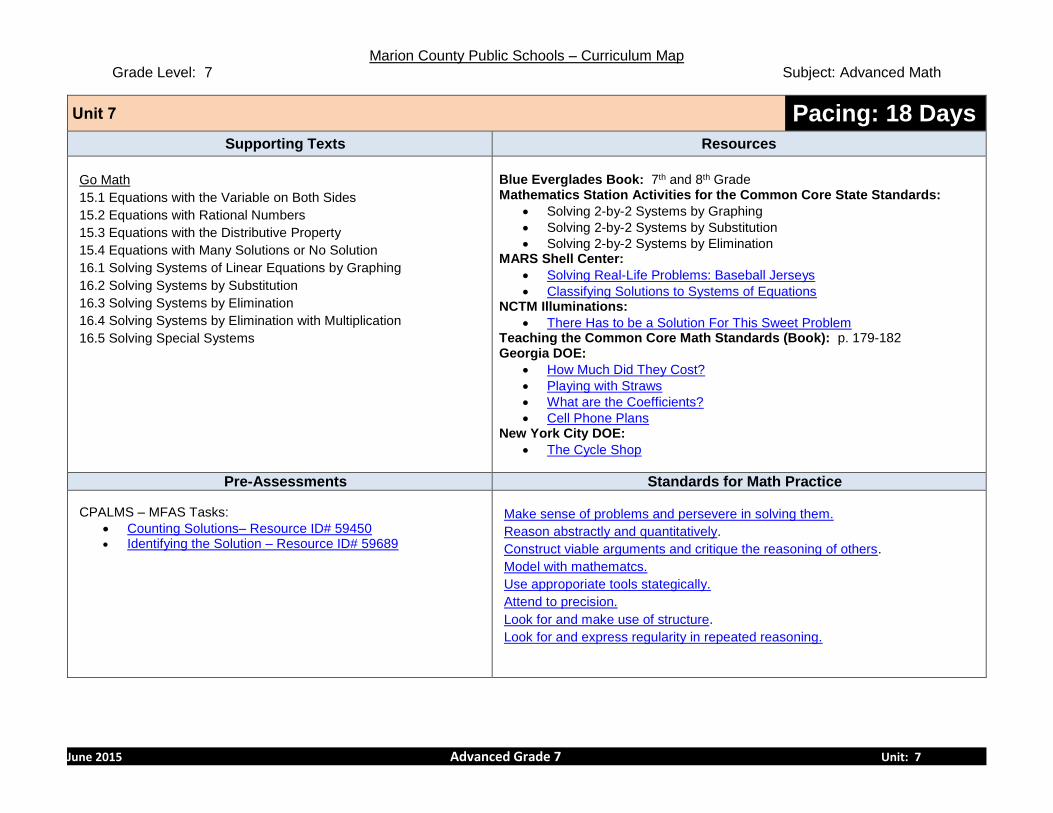
Supporting Texts Resources
Go Math
15.1 Equations with the Variable on Both Sides
15.2 Equations with Rational Numbers
15.3 Equations with the Distributive Property
15.4 Equations with Many Solutions or No Solution
16.1 Solving Systems of Linear Equations by Graphing
16.2 Solving Systems by Substitution
16.3 Solving Systems by Elimination
16.4 Solving Systems by Elimination with Multiplication
16.5 Solving Special Systems
Blue Everglades Book: 7th and 8th Grade Mathematics Station Activities for the Common Core State Standards:
Solving 2-by-2 Systems by Graphing
Solving 2-by-2 Systems by Substitution
Solving 2-by-2 Systems by Elimination MARS Shell Center:
Solving Real-Life Problems: Baseball Jerseys
Classifying Solutions to Systems of Equations NCTM Illuminations:
There Has to be a Solution For This Sweet Problem Teaching the Common Core Math Standards (Book): p. 179-182 Georgia DOE:
How Much Did They Cost?
Playing with Straws
What are the Coefficients?
Cell Phone Plans New York City DOE:
The Cycle Shop
Pre-Assessments Standards for Math Practice
CPALMS – MFAS Tasks:
Counting Solutions– Resource ID# 59450 Identifying the Solution – Resource ID# 59689
Make sense of problems and persevere in solving them.
Reason abstractly and quantitatively.
Construct viable arguments and critique the reasoning of others.
Model with mathematcs.
Use approporiate tools stategically.
Attend to precision.
Look for and make use of structure.
Look for and express regularity in repeated reasoning.
Marion County Public Schools – Curriculum Map Grade Level: 7 Subject: Advanced Math
June 2015 Advanced Grade 7 Unit: 8
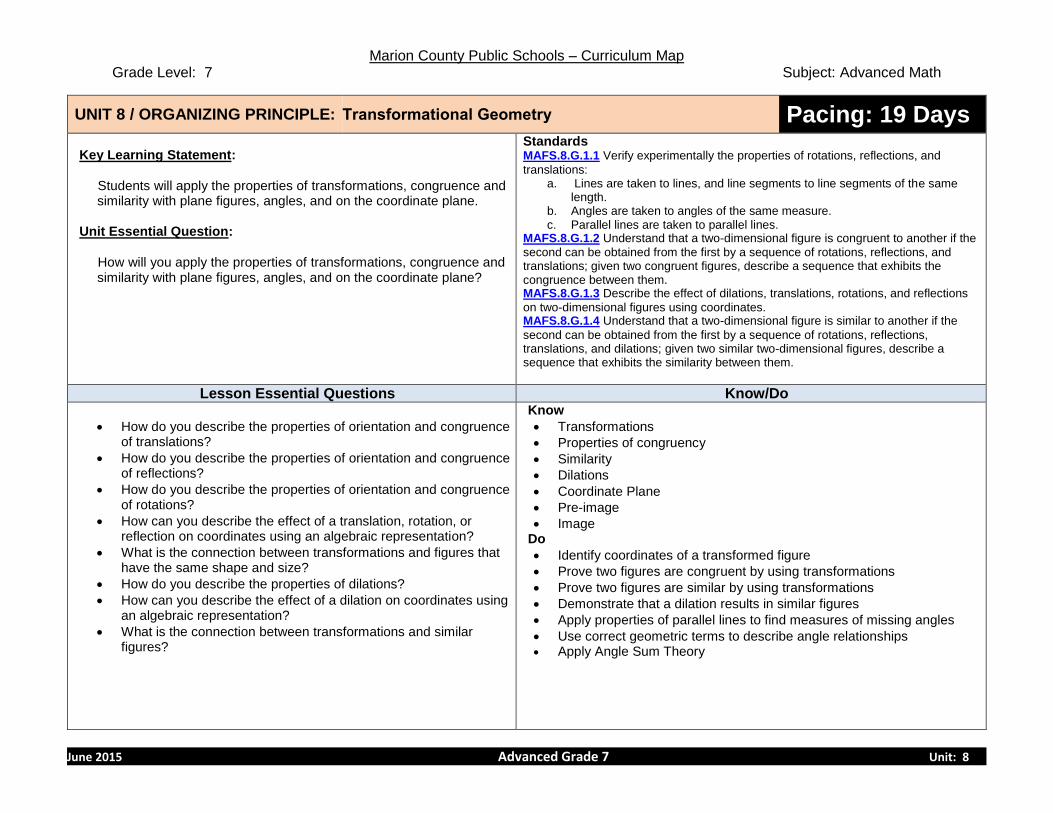
UNIT 8 / ORGANIZING PRINCIPLE: Transformational Geometry Pacing: 19 Days
Key Learning Statement: Students will apply the properties of transformations, congruence and
similarity with plane figures, angles, and on the coordinate plane. Unit Essential Question: How will you apply the properties of transformations, congruence and
similarity with plane figures, angles, and on the coordinate plane?
Standards MAFS.8.G.1.1 Verify experimentally the properties of rotations, reflections, and
translations: a. Lines are taken to lines, and line segments to line segments of the same
length. b. Angles are taken to angles of the same measure. c. Parallel lines are taken to parallel lines.
MAFS.8.G.1.2 Understand that a two-dimensional figure is congruent to another if the
second can be obtained from the first by a sequence of rotations, reflections, and translations; given two congruent figures, describe a sequence that exhibits the congruence between them. MAFS.8.G.1.3 Describe the effect of dilations, translations, rotations, and reflections
on two-dimensional figures using coordinates. MAFS.8.G.1.4 Understand that a two-dimensional figure is similar to another if the
second can be obtained from the first by a sequence of rotations, reflections, translations, and dilations; given two similar two-dimensional figures, describe a sequence that exhibits the similarity between them.
Lesson Essential Questions Know/Do
How do you describe the properties of orientation and congruence of translations?
How do you describe the properties of orientation and congruence of reflections?
How do you describe the properties of orientation and congruence of rotations?
How can you describe the effect of a translation, rotation, or reflection on coordinates using an algebraic representation?
What is the connection between transformations and figures that have the same shape and size?
How do you describe the properties of dilations?
How can you describe the effect of a dilation on coordinates using an algebraic representation?
What is the connection between transformations and similar figures?
Know
Transformations
Properties of congruency
Similarity
Dilations
Coordinate Plane
Pre-image
Image Do
Identify coordinates of a transformed figure
Prove two figures are congruent by using transformations
Prove two figures are similar by using transformations
Demonstrate that a dilation results in similar figures
Apply properties of parallel lines to find measures of missing angles
Use correct geometric terms to describe angle relationships Apply Angle Sum Theory
Marion County Public Schools – Curriculum Map Grade Level: 7 Subject: Advanced Math
June 2015 Advanced Grade 7 Unit: 8
Unit 8 Pacing: 19 Days
Culminating Activity Key Vocabulary
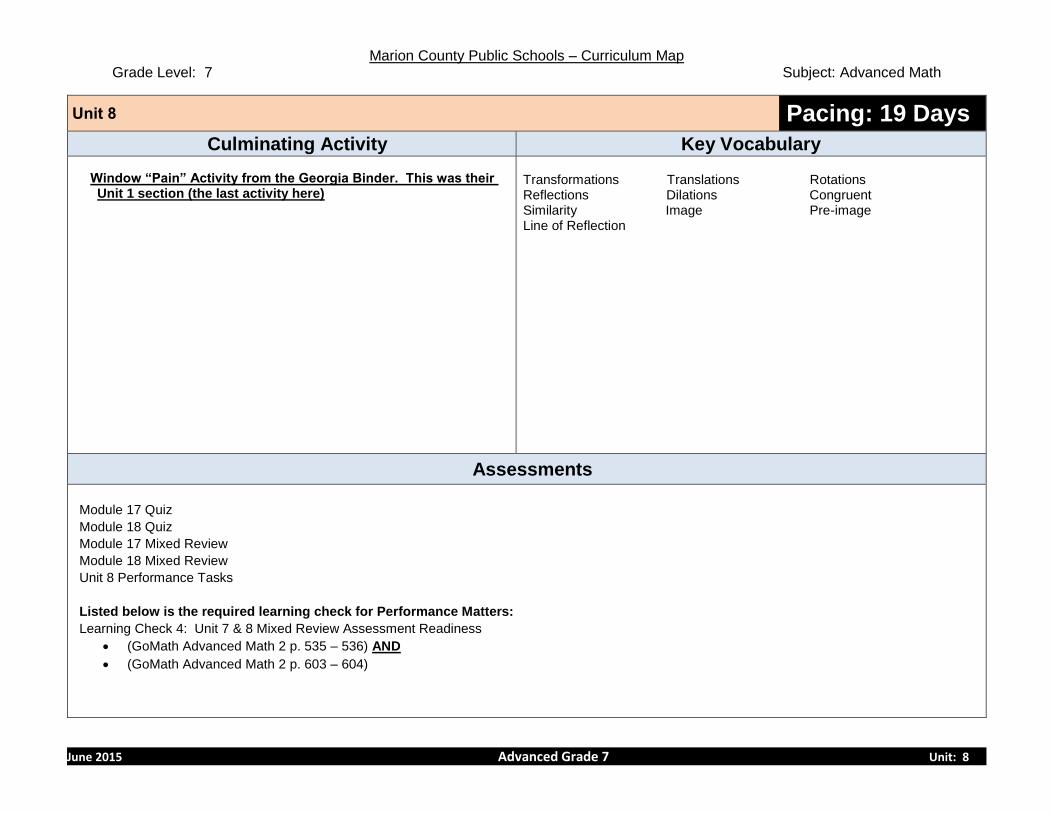
Window “Pain” Activity from the Georgia Binder. This was their Unit 1 section (the last activity here)
Transformations Translations Rotations Reflections Dilations Congruent Similarity Image Pre-image Line of Reflection
Assessments
Module 17 Quiz
Module 18 Quiz
Module 17 Mixed Review
Module 18 Mixed Review
Unit 8 Performance Tasks
Listed below is the required learning check for Performance Matters:
Learning Check 4: Unit 7 & 8 Mixed Review Assessment Readiness
(GoMath Advanced Math 2 p. 535 – 536) AND
(GoMath Advanced Math 2 p. 603 – 604)

Marion County Public Schools – Curriculum Map Grade Level: 7 Subject: Advanced Math
June 2015 Advanced Grade 7 Unit: 8
Unit 8 Pacing: 19 Days
Supporting Texts Resources
Go Math 17.1 Properties of Translations 17.2 Properties of Reflections 17.3 Properties of Rotations 17.4 Algebraic Representations of Transformations 17.5 Congruent Figures 18.1 Properties of Dilations 18.2 Algebraic Representations of Dilations 18.3 Similar Figures
Teaching Student Centered Mathematics: Chapter 13, p. 283 – 290 Blue Everglades Book: 7th and 8th Grade Mathematics Station Activities for Common Core Standards:
Transformations, Translations and Rotations
Properties of Angle Pairs
Properties of Lines cut by Transversals Portal:
Keyword: Geometry – Identifying Similar Triangles CPalms:
Paper Quilts – Exploring Flips and Slides Kagan:
Geometry 8-12 (Chapter 2: Angles & Lines) Teaching Common Core Math Standards (Book): p. 201-226 The Gatsby Charitable Foundation:
Transformations
Pre-Assessments Standards for Math Practice
CPALMS – MFAS Tasks:
Angle Transformations – Resource ID# 66721
Multistep Congruence – Resource ID# 66741
Dilation Coordinates – Resource ID# 64604
Similarity -3 – Resource ID# 69920
Make sense of problems and persevere in solving them.
Reason abstractly and quantitatively.
Construct viable arguments and critique the reasoning of others.
Model with mathematcs.
Use approporiate tools stategically.
Attend to precision.
Look for and make use of structure.
Look for and express regularity in repeated reasoning.
Marion County Public Schools – Curriculum Map Grade Level: 7 Subject: Advanced Math
June 2015 Advanced Grade 7 Unit: 9
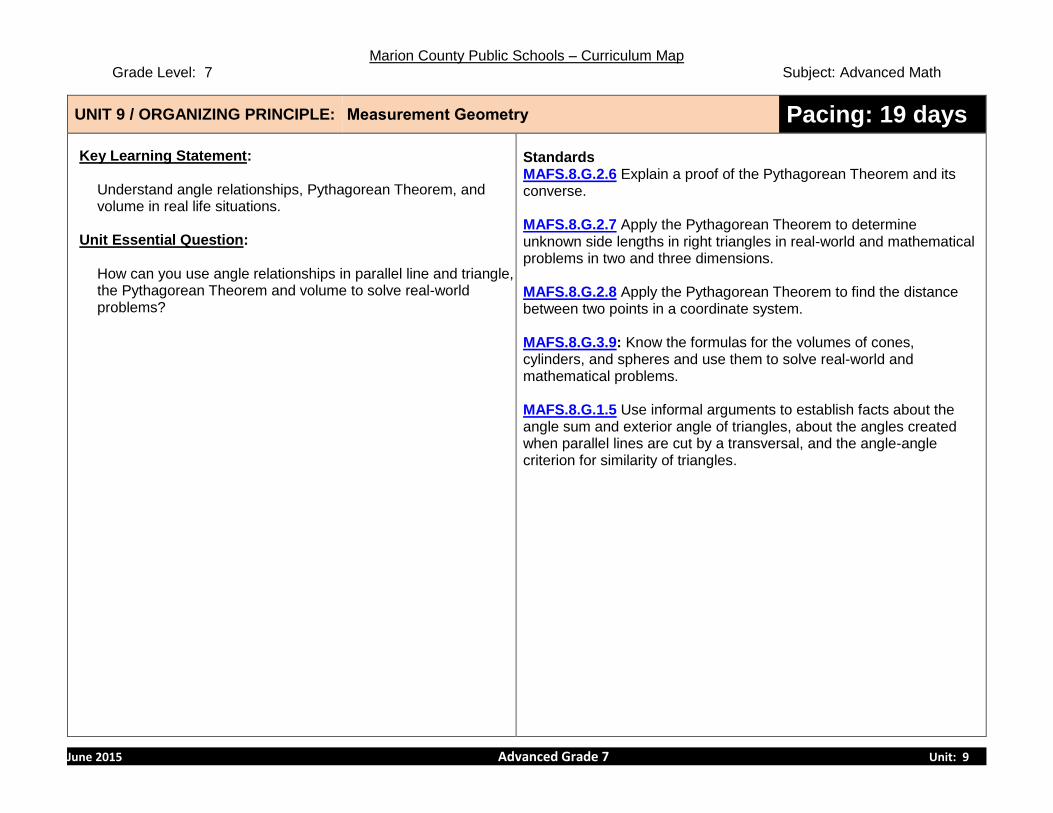
UNIT 9 / ORGANIZING PRINCIPLE: Measurement Geometry Pacing: 19 days
Key Learning Statement:
Understand angle relationships, Pythagorean Theorem, and volume in real life situations.
Unit Essential Question:
How can you use angle relationships in parallel line and triangle, the Pythagorean Theorem and volume to solve real-world problems?
Standards MAFS.8.G.2.6 Explain a proof of the Pythagorean Theorem and its converse. MAFS.8.G.2.7 Apply the Pythagorean Theorem to determine unknown side lengths in right triangles in real-world and mathematical problems in two and three dimensions. MAFS.8.G.2.8 Apply the Pythagorean Theorem to find the distance between two points in a coordinate system. MAFS.8.G.3.9: Know the formulas for the volumes of cones, cylinders, and spheres and use them to solve real-world and mathematical problems. MAFS.8.G.1.5 Use informal arguments to establish facts about the angle sum and exterior angle of triangles, about the angles created when parallel lines are cut by a transversal, and the angle-angle criterion for similarity of triangles.
Marion County Public Schools – Curriculum Map Grade Level: 7 Subject: Advanced Math
June 2015 Advanced Grade 7 Unit: 9
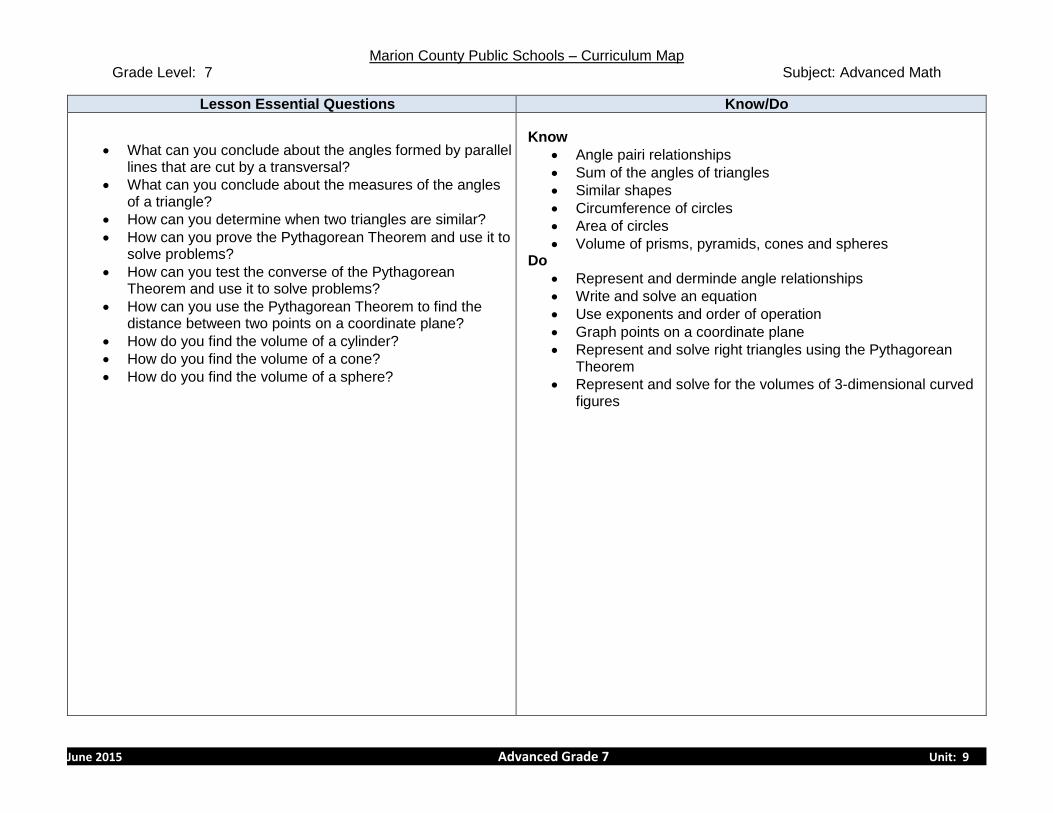
Lesson Essential Questions Know/Do
What can you conclude about the angles formed by parallel lines that are cut by a transversal?
What can you conclude about the measures of the angles of a triangle?
How can you determine when two triangles are similar?
How can you prove the Pythagorean Theorem and use it to solve problems?
How can you test the converse of the Pythagorean Theorem and use it to solve problems?
How can you use the Pythagorean Theorem to find the distance between two points on a coordinate plane?
How do you find the volume of a cylinder?
How do you find the volume of a cone?
How do you find the volume of a sphere?
Know
Angle pairi relationships
Sum of the angles of triangles
Similar shapes
Circumference of circles
Area of circles
Volume of prisms, pyramids, cones and spheres Do
Represent and derminde angle relationships
Write and solve an equation
Use exponents and order of operation
Graph points on a coordinate plane
Represent and solve right triangles using the Pythagorean Theorem
Represent and solve for the volumes of 3-dimensional curved figures

Marion County Public Schools – Curriculum Map Grade Level: 7 Subject: Advanced Math
June 2015 Advanced Grade 7 Unit: 9
Unit 9 Pacing: 19 Days
Culminating Activity Key Vocabulary
Real World Pythagorean Theorem Project. This was from Seminole County Public Schools. The front page is a rubric. First line of the text is Calling all Pythagoreans!
TASK: How Full Is Your Glass? Georgia Binder – Unit 3 pg 28
Pythagorean Theorem square root legs Pythagorean triples right triangle x-coordinate y-coordinate width Theorem base circumference height length perimeter transversal corresponding angles exterior angle interior angle remote interior angle similar acute angle same-side interior angles angle congruent obtuse angle parallel lines vertex ordered pair alternate exterior angles right angle volume alternate interior angles capacity cone cylinder spheres radius diameter area
Assessments
Module 19 Quiz
Module 19 Mixed Review
Module 20 Quiz
Module 20 Mixed Review
Module 21 Quiz
Module 21 Mixed Review
Unit 9 Performance Tasks
The required learning check for this unit will be after Unit 10.
Marion County Public Schools – Curriculum Map Grade Level: 7 Subject: Advanced Math
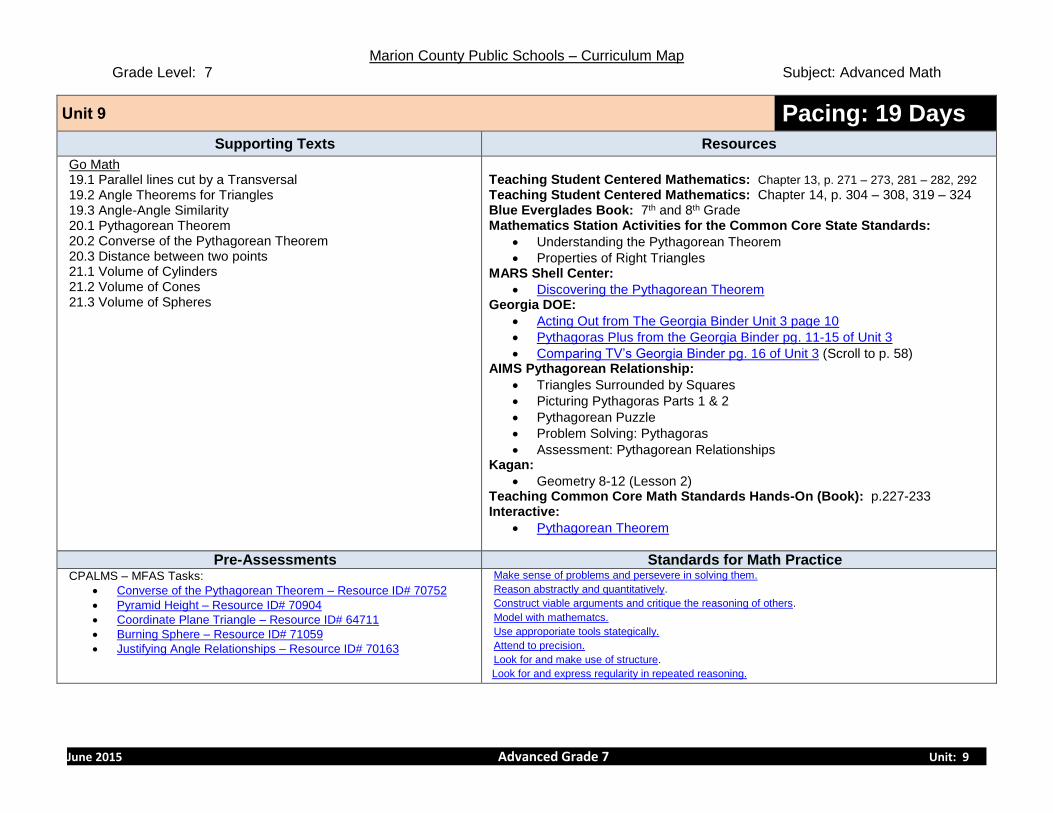
June 2015 Advanced Grade 7 Unit: 9
Unit 9 Pacing: 19 Days
Supporting Texts Resources
Go Math 19.1 Parallel lines cut by a Transversal 19.2 Angle Theorems for Triangles 19.3 Angle-Angle Similarity 20.1 Pythagorean Theorem 20.2 Converse of the Pythagorean Theorem 20.3 Distance between two points 21.1 Volume of Cylinders 21.2 Volume of Cones 21.3 Volume of Spheres
Teaching Student Centered Mathematics: Chapter 13, p. 271 – 273, 281 – 282, 292 Teaching Student Centered Mathematics: Chapter 14, p. 304 – 308, 319 – 324 Blue Everglades Book: 7th and 8th Grade Mathematics Station Activities for the Common Core State Standards:
Understanding the Pythagorean Theorem
Properties of Right Triangles MARS Shell Center:
Discovering the Pythagorean Theorem Georgia DOE:
Acting Out from The Georgia Binder Unit 3 page 10
Pythagoras Plus from the Georgia Binder pg. 11-15 of Unit 3
Comparing TV’s Georgia Binder pg. 16 of Unit 3 (Scroll to p. 58) AIMS Pythagorean Relationship:
Triangles Surrounded by Squares
Picturing Pythagoras Parts 1 & 2
Pythagorean Puzzle
Problem Solving: Pythagoras
Assessment: Pythagorean Relationships Kagan:
Geometry 8-12 (Lesson 2) Teaching Common Core Math Standards Hands-On (Book): p.227-233 Interactive:
Pythagorean Theorem
Pre-Assessments Standards for Math Practice CPALMS – MFAS Tasks:
Converse of the Pythagorean Theorem – Resource ID# 70752
Pyramid Height – Resource ID# 70904
Coordinate Plane Triangle – Resource ID# 64711
Burning Sphere – Resource ID# 71059
Justifying Angle Relationships – Resource ID# 70163
Make sense of problems and persevere in solving them.
Reason abstractly and quantitatively.
Construct viable arguments and critique the reasoning of others.
Model with mathematcs.
Use approporiate tools stategically.
Attend to precision.
Look for and make use of structure.
Look for and express regularity in repeated reasoning.

Marion County Public Schools – Curriculum Map Grade Level: 7 Subject: Advanced Math
May 2014 Advanced Grade 7 Unit: 10
UNIT 10 / ORGANIZING PRINCIPLE: Statistics: Bivariate Data Pacing: 15 days
Key Learning Statement:
Use scatterplots and frequency table to solve real world problems. Unit Essential Question:
How do you use scatterplots and frequency table to solve real world problems?
Standards MAFS.8.SP.1.1: Construct and interpret scatter plots for bivariate measurement data to investigate patterns of association between two quantities. Describe patterns such as clustering, outliers, positive or negative association, linear association, and nonlinear association. MAFS.8.SP.1.2: Know that straight lines are widely used to model relationships between two quantitative variables. For scatter plots that suggest a linear association, informally fit a straight line, and informally assess the model fit by judging the closeness of the data points to the line. MAFS.8.SP.1.3: Use the equation of a linear model to solve problems in the context of bivariate measurement data, interpreting the slope and intercept. MAFS.8.SP.1.4: Understand that patterns of association can also be seen in bivariate categorical data by displaying frequencies and relative frequencies in a two-way table. Construct and interpret a two-way table summarizing data on two categorical variables collected from the same subjects. Use relative frequencies calculated for rows or columns to describe possible association between the two variables .
Lesson Essential Questions Know/Do
How can you construct and interpret scatter plots?
How can you use a trend line to make a prediction from a scatter plot?
How do you construct and interpret two-way frequency tables?
How can categorical data be organized and displayed.
Know
Scatter Plots
Outliers
Bivariate Data
Types of Correlation
Cluster
Trend line (line of best fit)
Two-way tables Do
Construct and Interpret Scatter Plots
Find a trend line from a scatter plot
Interpret the slope and intercept of the line of best fit
Construct and interepret tables that represent bivariate data
Anaylze the effects of outliers

Marion County Public Schools – Curriculum Map Grade Level: 7 Subject: Advanced Math
May 2014 Advanced Grade 7 Unit: 10
Unit 10 Pacing: 15 Days
Culminating Activity Key Vocabulary
http://education.ti.com/calculators/timathnspired/US/Activities/Detail?sa=1008&t=1135&id=17258
Bivariate Data joint relative frequency Scatter Plots marginal relative frequency Correlation two-way table Positive Correlation relative frequency Negative Correlation conditional relative frequency No Correlation interpolation Clustering extrapolation Outliers Frequency Trend line
Assessments
Module 22 Quiz
Module 23 Quiz
Module 22 Mixed Review
Module 23 Mixed Review
Unit 10 Performance Tasks
Listed below is the required learning check for Performance Matters:
Learning Check 5: Unit 9 & 10 Mixed Review Assessment Readiness
(GoMath Advanced Math 2 p. 689 – 690) AND
(GoMath Advanced Math 2 p. 735 – 736)
Marion County Public Schools – Curriculum Map Grade Level: 7 Subject: Advanced Math
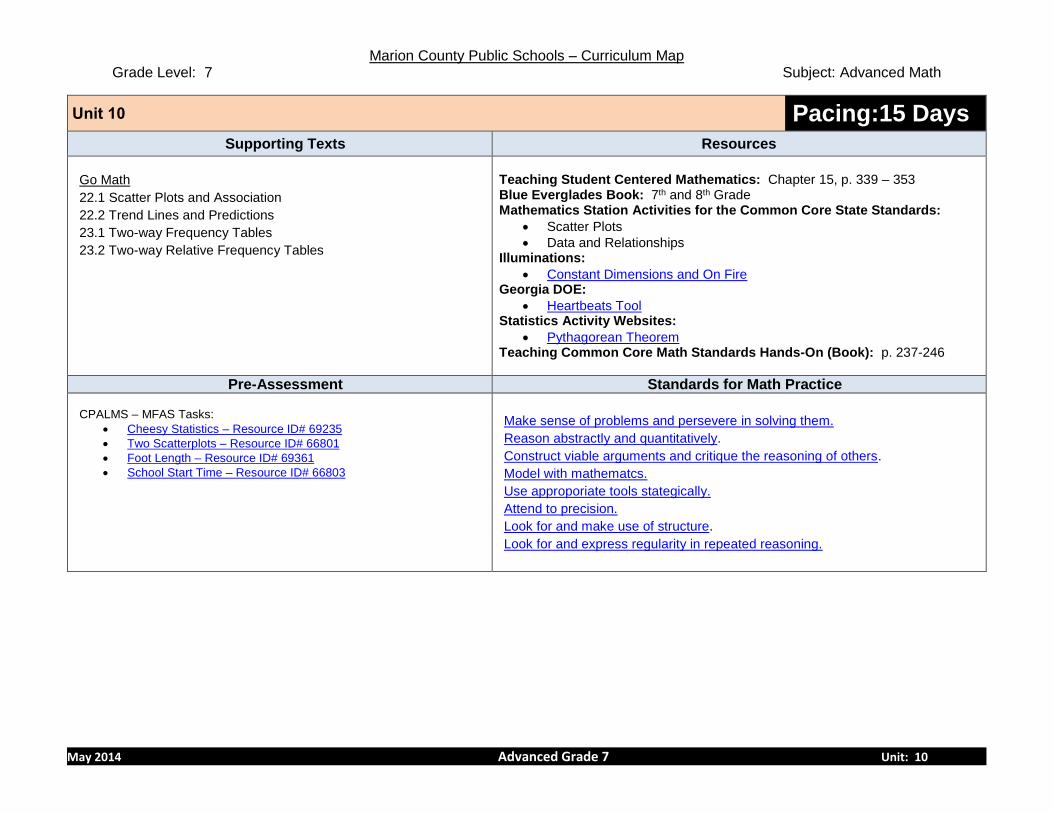
May 2014 Advanced Grade 7 Unit: 10
Unit 10 Pacing:15 Days
Supporting Texts Resources
Go Math
22.1 Scatter Plots and Association
22.2 Trend Lines and Predictions
23.1 Two-way Frequency Tables
23.2 Two-way Relative Frequency Tables
Teaching Student Centered Mathematics: Chapter 15, p. 339 – 353 Blue Everglades Book: 7th and 8th Grade Mathematics Station Activities for the Common Core State Standards:
Scatter Plots
Data and Relationships Illuminations:
Constant Dimensions and On Fire Georgia DOE:
Heartbeats Tool Statistics Activity Websites:
Pythagorean Theorem Teaching Common Core Math Standards Hands-On (Book): p. 237-246
Pre-Assessment Standards for Math Practice CPALMS – MFAS Tasks:
Cheesy Statistics – Resource ID# 69235
Two Scatterplots – Resource ID# 66801
Foot Length – Resource ID# 69361
School Start Time – Resource ID# 66803
Make sense of problems and persevere in solving them.
Reason abstractly and quantitatively.
Construct viable arguments and critique the reasoning of others.
Model with mathematcs.
Use approporiate tools stategically.
Attend to precision.
Look for and make use of structure.
Look for and express regularity in repeated reasoning.