Embed Size (px)
Citation preview
GRADUATE EXPECTATIONS AND EXPERIENCES AS OUTCOMES OF A JOINT-DELIVERY BUSINESS DEGREE PATHWAY
SIEC Krakow Conference 2015
Peter Richardson
Introduction
• Location and demographics
• Background/ history
• Delivery model
• Research aims
• Methodology
• Findings/ results
• More questions
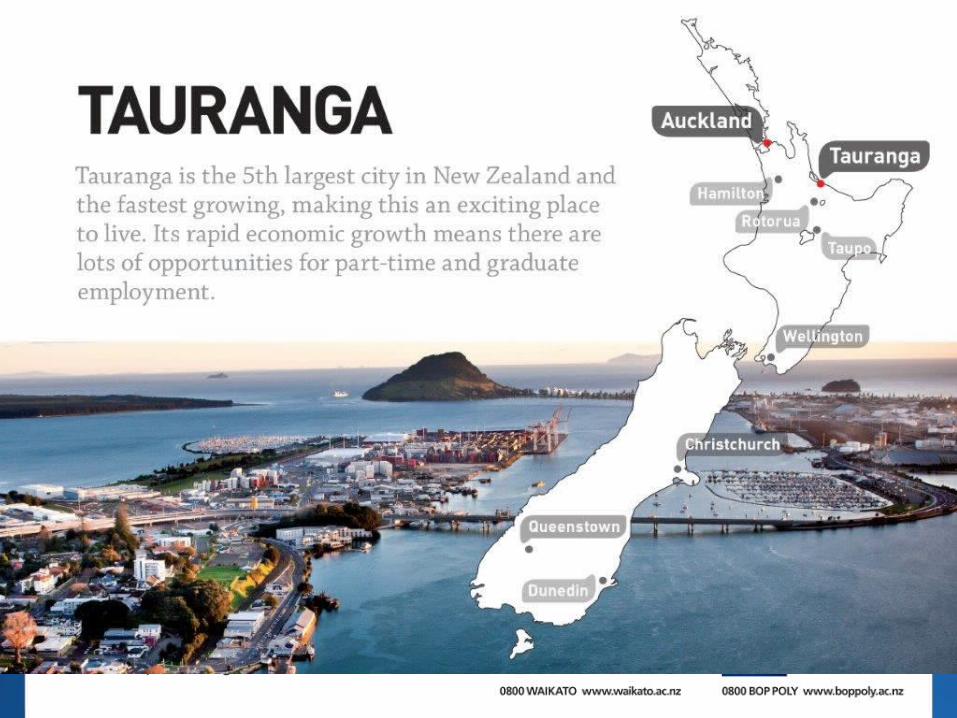
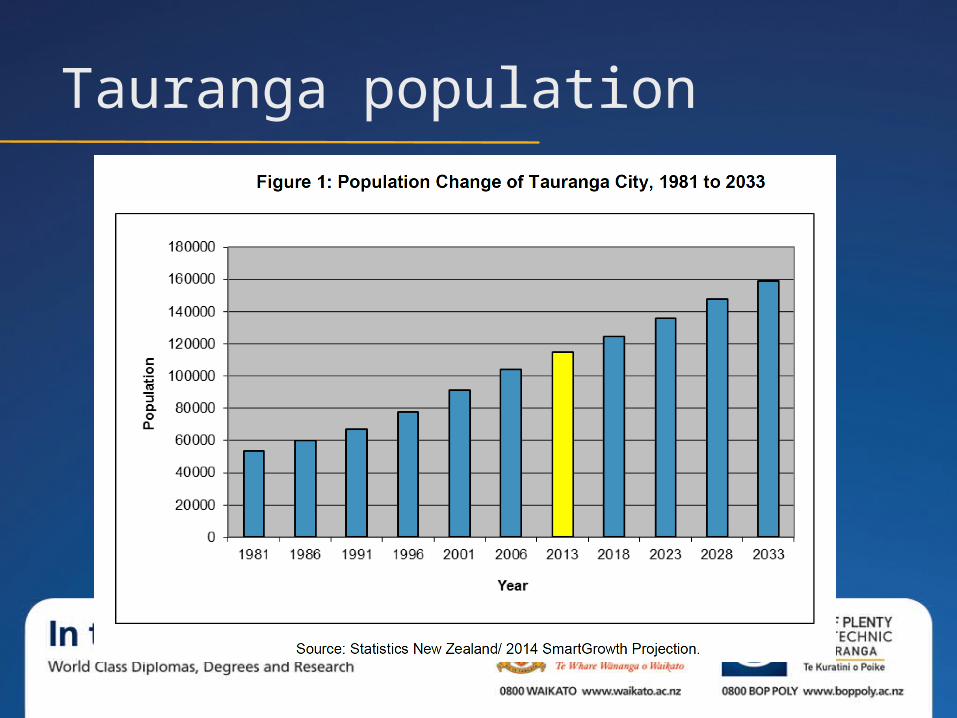
Tauranga population
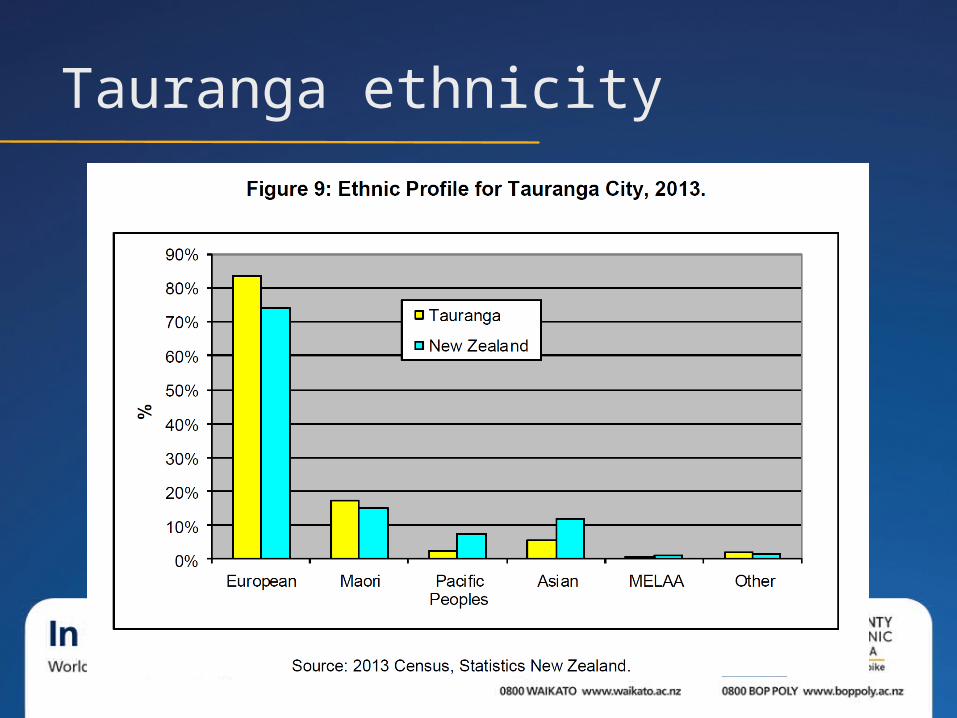
Tauranga ethnicity
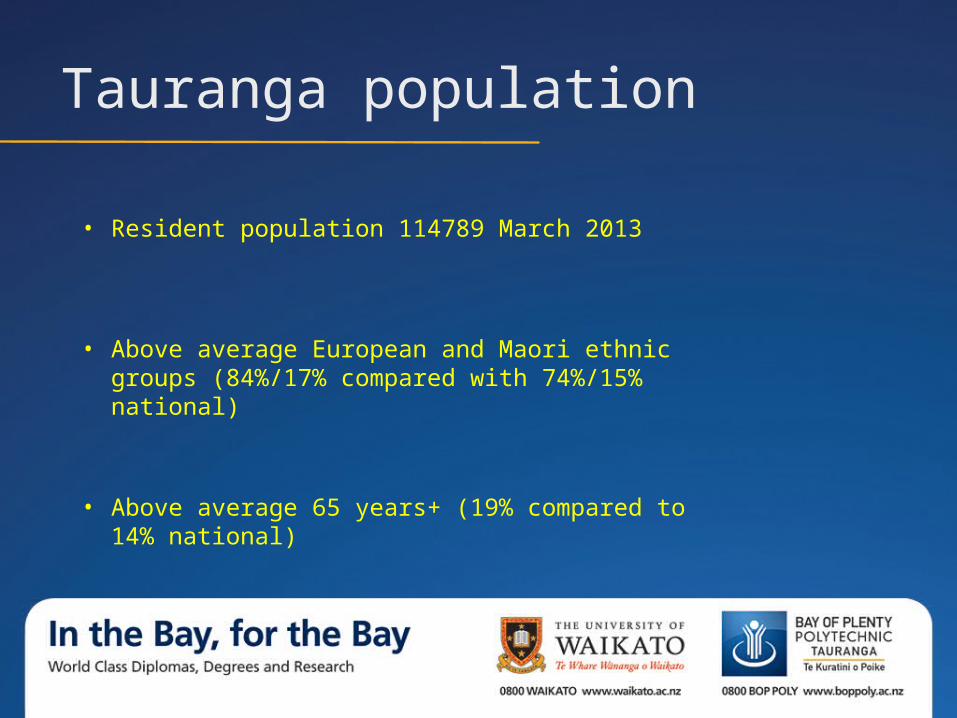
Tauranga population
• Resident population 114789 March 2013
• Above average European and Maori ethnic groups (84%/17% compared with 74%/15% national)
• Above average 65 years+ (19% compared to 14% national)
Education Background
• University business degrees not available
• Secondary school graduates leaving the city
• Two institutions agree on a delivery model
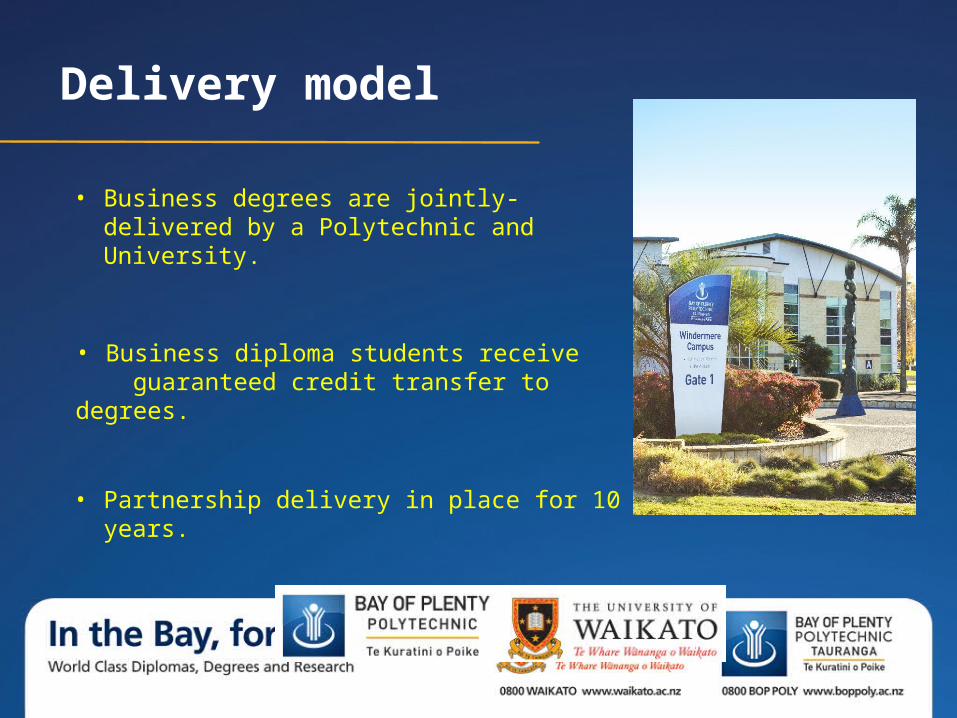
Delivery model
• Business degrees are jointly-delivered by a Polytechnic and University.
• Business diploma students receive guaranteed credit transfer to degrees.
• Partnership delivery in place for 10 years.
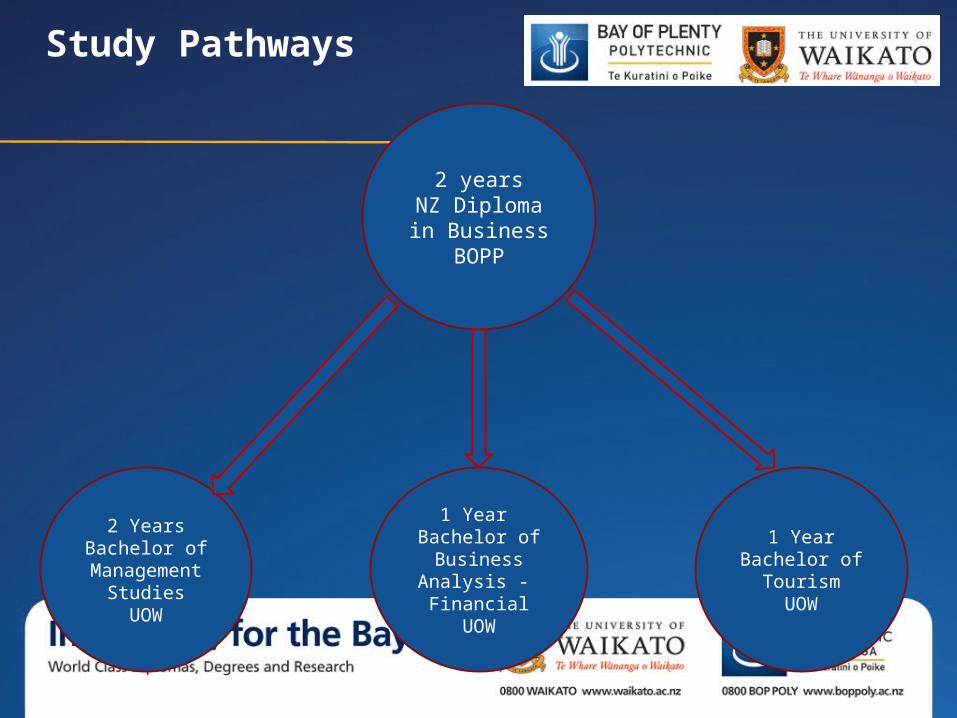
Study Pathways
2 yearsNZ Diploma in Business
BOPP
2 YearsBachelor of
Management StudiesUOW
1 YearBachelor of
TourismUOW
1 Year Bachelor of
Business Analysis - Financial
UOW
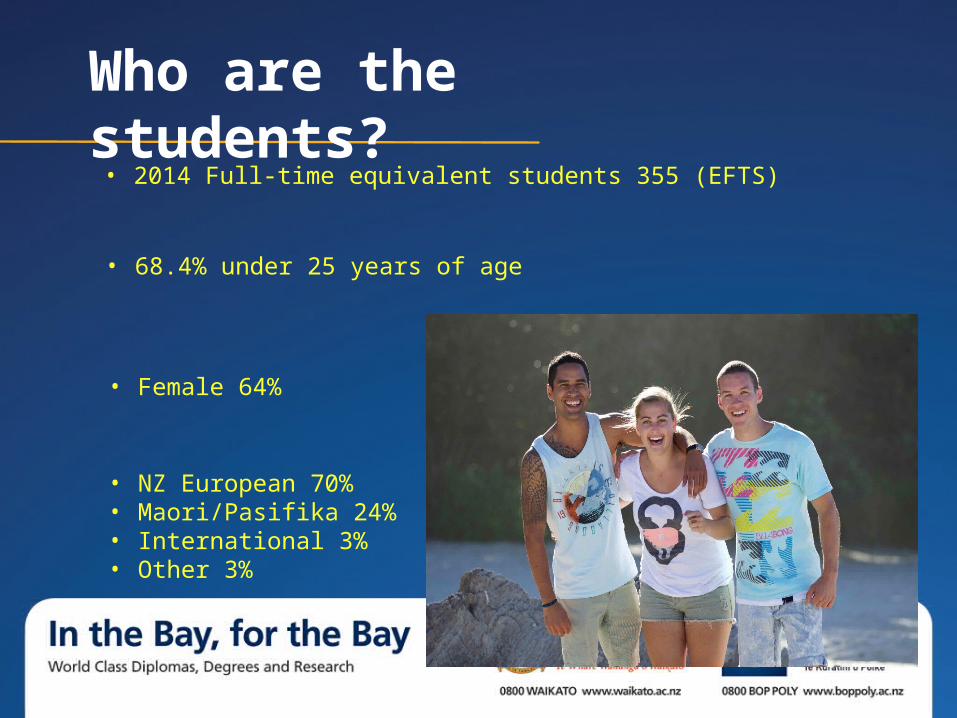
Who are the students?• 2014 Full-time equivalent students 355 (EFTS)
• 68.4% under 25 years of age
• NZ European 70% • Maori/Pasifika 24% • International 3% • Other 3%
• Female 64%
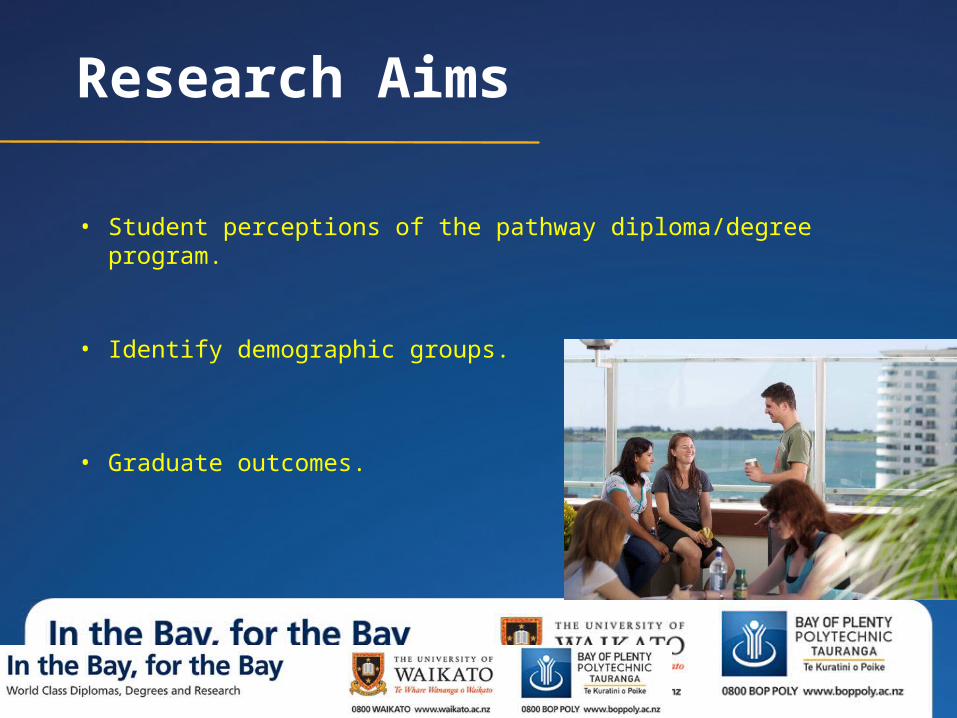
Research Aims
• Student perceptions of the pathway diploma/degree program.
• Identify demographic groups.
• Graduate outcomes.
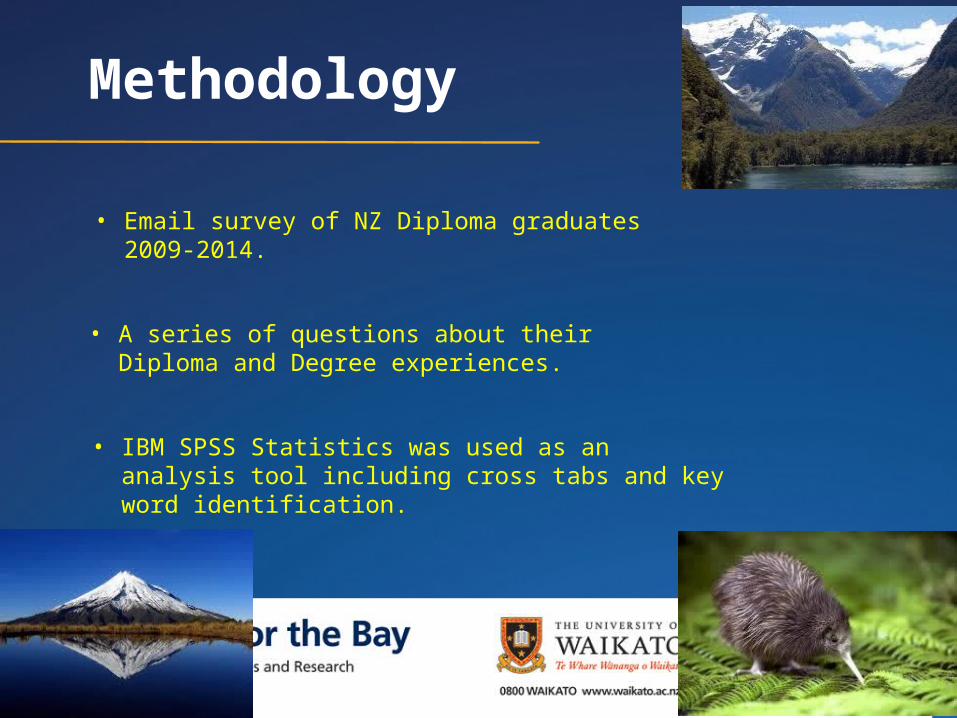
Methodology
• Email survey of NZ Diploma graduates 2009-2014.
• A series of questions about their Diploma and Degree experiences.
• IBM SPSS Statistics was used as an analysis tool including cross tabs and key word identification.
Email Survey
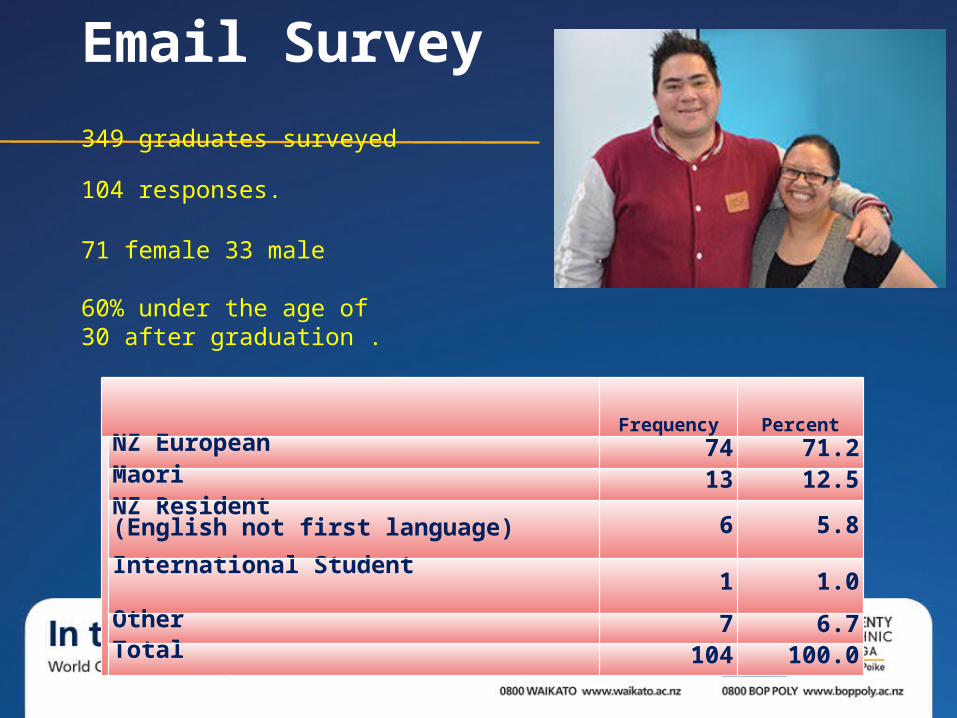
349 graduates surveyed
Frequency Percent NZ European 74 71.2Maori 13 12.5NZ Resident (English not first language) 6 5.8
International Student1 1.0
Other 7 6.7Total 104 100.0
71 female 33 male
60% under the age of 30 after graduation .
104 responses.
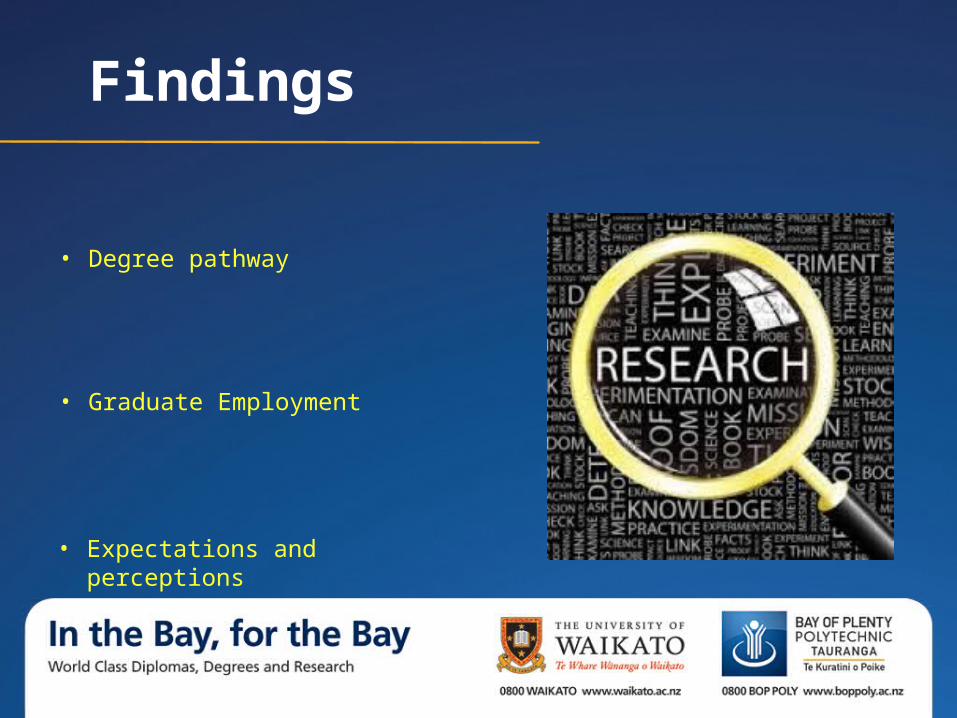
Findings
• Degree pathway
• Graduate Employment
• Expectations and perceptions
Degree pathway
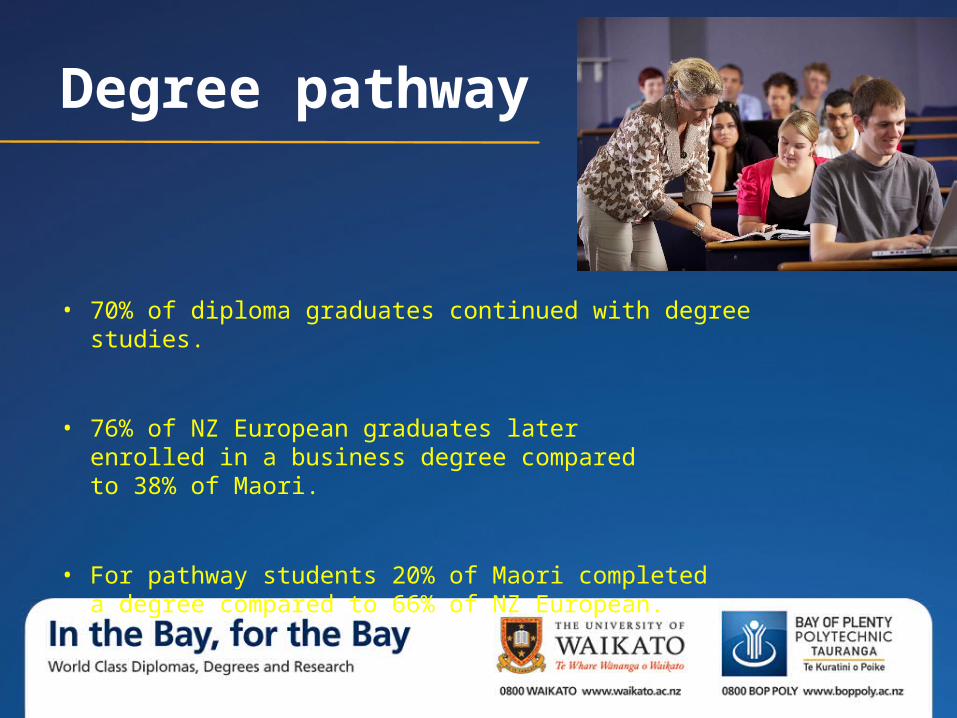
• 70% of diploma graduates continued with degree studies.
• 76% of NZ European graduates later enrolled in a business degree compared to 38% of Maori.
• For pathway students 20% of Maori completed a degree compared to 66% of NZ European.
Employment
Team
wor
k
Repo
rtin
g
Com
mun
icat
ion
Pres
enta
tions
Rese
arch
Acco
untin
g
Com
pute
r
Mar
ketin
g
Prob
lem
Solving
0
5
10
15
20
25
30
2825
1916 15 14 14
74
Key employment skills
Skill
Nu
mb
er
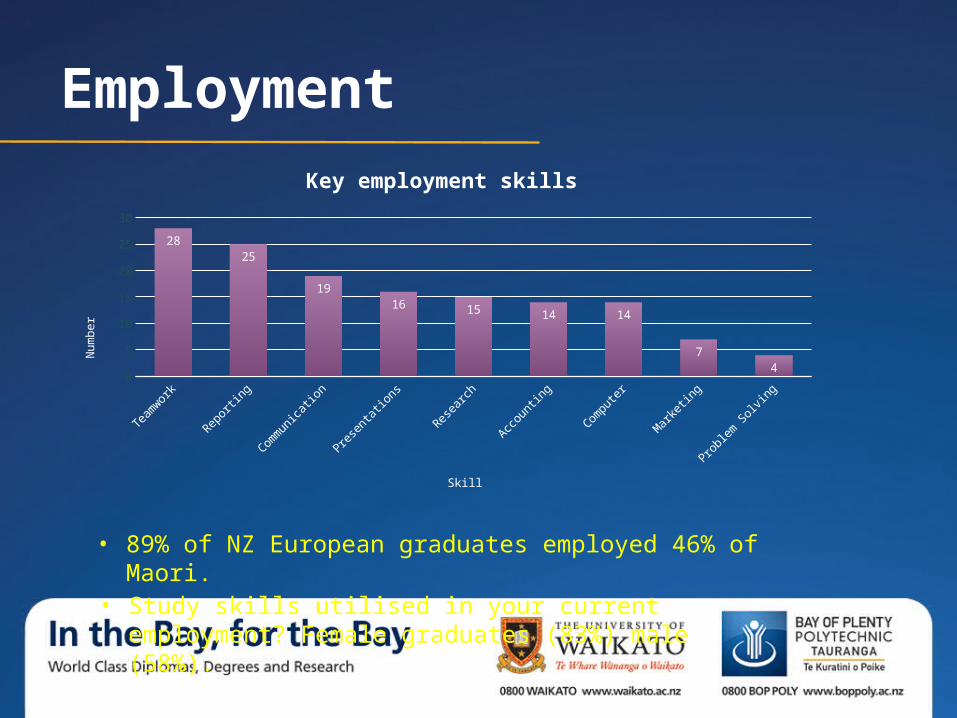
• 89% of NZ European graduates employed 46% of Maori.
• Study skills utilised in your current employment? Female graduates (83%) male (58%).
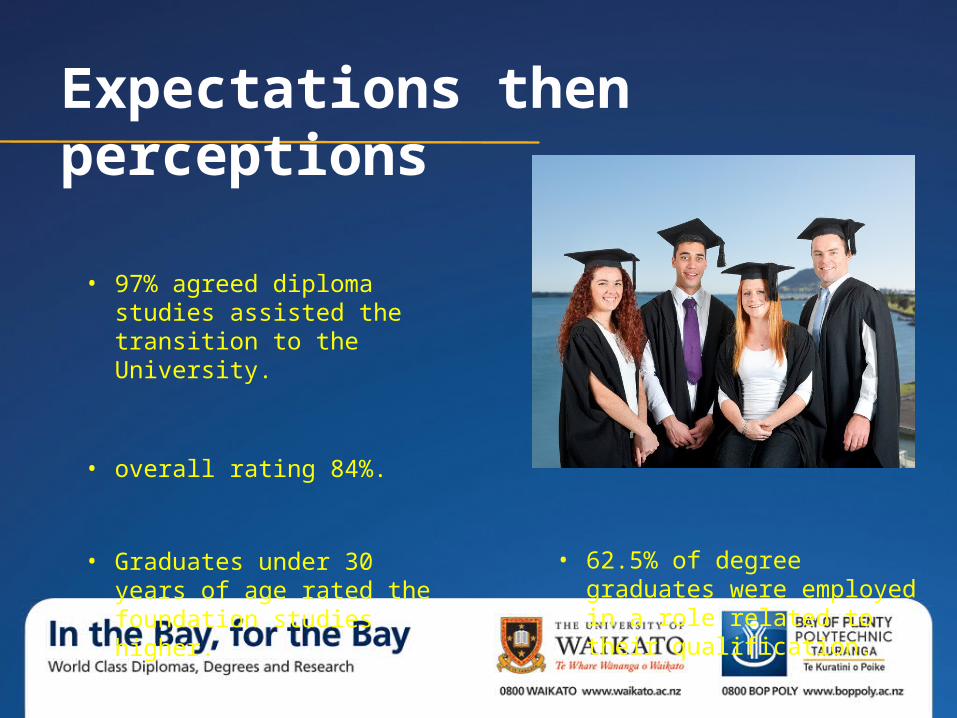
Expectations then perceptions
• 97% agreed diploma studies assisted the transition to the University.
• Graduates under 30 years of age rated the foundation studies higher.
• 62.5% of degree graduates were employed in a role related to their qualification.
• overall rating 84%.
Conclusions
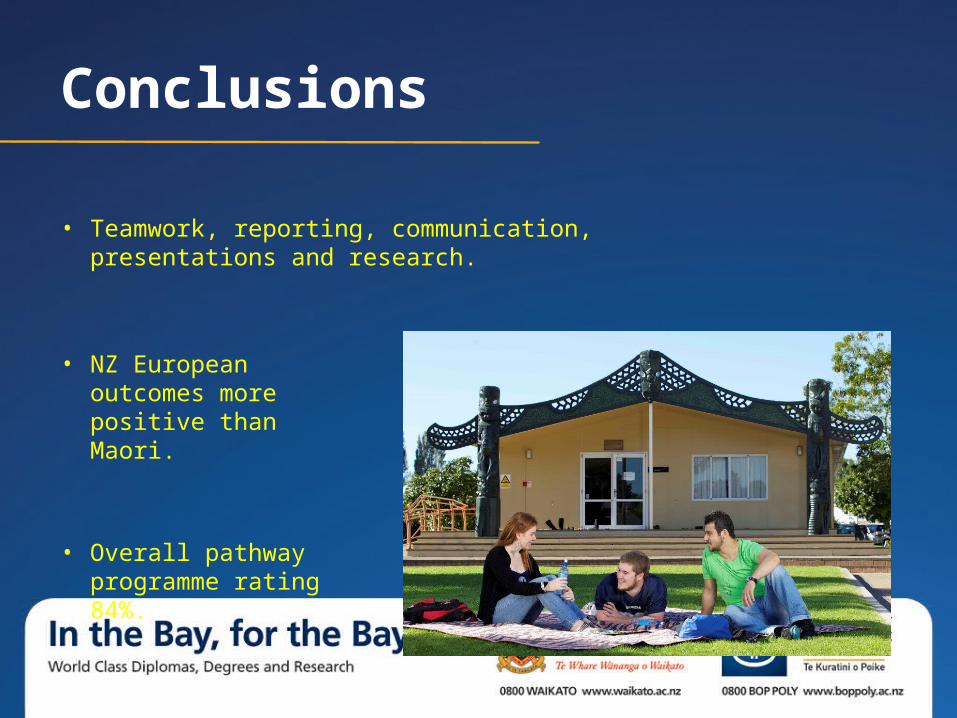
• Teamwork, reporting, communication, presentations and research.
• NZ European outcomes more positive than Maori.
• Overall pathway programme rating 84%.
More questions
Why are low numbers of Maori students continuing with degree studies after the diploma?
Why are less Maori students compared to other ethnic groups not gaining employment after graduating?
Why are less male graduates obtaining employment in the field of their qualification major?
Change and challenges
• NZ Education qualifications review
• Institutional merger
Any questions?