Embed Size (px)
Citation preview
1
Lab report- Dr. Robert C. Speth’s lab
Graduate Research Lab Rotation Report - 2
Md. Rezaul Karim
Lab – Dr. Robert C. Speth
Duration- 1/07/13 - 2/01/13
Laboratory Research area:
During my lab rotation, I observed the experiments of research study on 125I-SI Ang II radioligand
binding assay and angiotensin II receptor subtype quantification. Applying different ligand-receptor
binding assay techniques on the membrane preparations from rat/mouse brain/adrenal
glands/pancreas/kidney and Ang II receptor autoradiography, this lab finds out the subtype of Ang II
receptors present there and their binding affinity as well as specificity.
Ongoing experiments and learned techniques:
During my rotation in the lab I observed and learned the micropipette calibration, lab swipe and
minimization of radioactivity in working lab, buffer solution preparation, preparation of AM5 solution,
125I-SI Ang II radioligand binding assay, tissue sectioning, dissection of rat and application of graph-pad
Prism software in ligand-receptor binding assay.
Buffer solution: The recipe for the 0.5L assay buffer (Assay Medium or AM) is:
NaCl 4.38g
Na2EDTA 930mg
Bacitracin 70.5mg
500mM dibasic NaPO4 50ml
Distilled deionized water 450ml
pH is adjusted to 7.1-7.2 with HCl
Hypotonic buffer solution: The recipe for the 0.5L hypotonic buffer solution is:
500mM NaH2PO4 12ml
200mM Na2HPO4 70ml
Distilled deionized water 918ml
pH was checked to be 7.15

2
Lab report- Dr. Robert C. Speth’s lab
125I-SI Ang II radioligand binding assay:
The radioligand was prepared in Georgetown University and in my first observation I wanted to see
whether it gets bound to mouse pancreas. After that, binding assay was planned to be done with adrenal,
brain & mouse pancreas membrane preparation for (0.2-2nM) six different gradual concentration of
radioligand.
Principle:
Radioligand binding assays have greatly facilitated the characterization of receptors and the ligands
(substrates) that interact with them. Radioligand binding is used to: (1) characterize receptors in their
natural environment as well as those transfected into cell lines; (2) study receptor dynamics and
localization; (3) identify novel chemical structures that interact with receptors; and (4) define ligand
activity and selectivity in normal and diseased tissues.(McKinney & Raddatz, 2006) The most frequently
used assay based on this technique is the membrane filtration receptor assay. A variation on the
membrane assay, the intact cell radioligand binding assay has specific advantages in some circumstances
such as screening large numbers of small cell samples and studies of receptor internalization(Bylund &
Toews, 1993). For many binding assays, a suitable radioligand and a crude homogenate of a tissue known
to contain the receptor are required. The homogenate and the radioligand are mixed, and at an appropriate
time (empirically determined), the unbound radioligand (L*, or free) is rapidly separated from the ligand
bound to the receptor (L*R, or bound), usually by filtration. Tissue sources for radioligand binding
include tissue slices, subcellular fractions, or intact cellular preparations including native, immortalized,
or transfected cells (McKinney & Raddatz, 2006).
The criteria established for validating a binding assay are as follows (Cuatrecasas and Hollenberg, 1976):
1. Specific binding must be saturable, indicating a finite number of receptor sites, although in some
instances, nonspecific binding can appear saturable as well.
2. The binding affinity, defined as the dissociation constant (KD), should be consistent with
physiological values established for the receptors (e.g., 100 pM to 10 nM).
3. Binding should be reversible, consistent with a physiological mechanism for terminating the
effect of a ligand at the receptor.
4. The tissue and subcellular distribution of the specific binding should be consistent with what is
known about the proposed physiological effects of the endogenous ligand, and with what is
known about the localization of the receptor.
3
Lab report- Dr. Robert C. Speth’s lab
5. The substrate selectivity of binding for both agonists and antagonists should be consistent with
the pharmacology of the natural ligand in functional and whole-animal tests. Conversely, ligands
known to be inactive at the targeted receptor should not affect radioligand binding.
6. There should be a correlation between the binding and concentration-response data in identical
tissue preparations.
7. Activity in a binding assay should be predictive of activity in an established animal model of
receptor function.
Radioligand binding assays only measure the affinity and density of a ligand binding site. The
efficacy, pharmacodynamic, and pharmacokinetic properties of the ligand are not revealed in a
binding assay, but rather, must be assessed using functional in vivo and in vitro analyses(McKinney
& Raddatz, 2006).
The parameters measured in radioligand binding assay are KD and Bmax derived from the bimolecular
reaction according to the law of mass action.
1
1
[ *] [ ]
[ * ]D
k L RK
k L R
max [ ]TOTB R
The KD is expressed in molar units of concentration (e.g., nanomolar or picomolar). The binding
affinity of a receptor for a ligand is a molecular consequence of its structure, with the KD used to
identify and classify receptors based on this affinity. Therefore, the determination of KD is a primary
goal in developing a binding assay once the optimal conditions for specific binding are established.
In the assay, the species measured is the bound ligand (i.e., the L*R complex). The receptor-ligand
complex, which is embedded in the plasma membrane, is readily isolated from the aqueous reaction
mixture by filtration. By quantifying the radioactivity recovered on the filter, the amount of
radioligand bound to the tissue is measured. The radioligand attached to the receptor is considered the
specific binding component. Some radioligand will be nonspecifically trapped with the lipid
membrane or other constituents of the assay mixture. Nonspecific binding is defined as radioactivity
detected in the tissue sample that is not bound to the receptor of interest and is quantified by
measuring the amount of radioligand associated with the tissue in the presence of very high
concentrations of an unlabeled ligand, whereas specific binding is the radioactivity displaced by
saturating concentrations of an unlabeled ligand selective for the receptor being studied. In
equilibrium binding assays, unbound and bound ligands are separated from each other after the
4
Lab report- Dr. Robert C. Speth’s lab
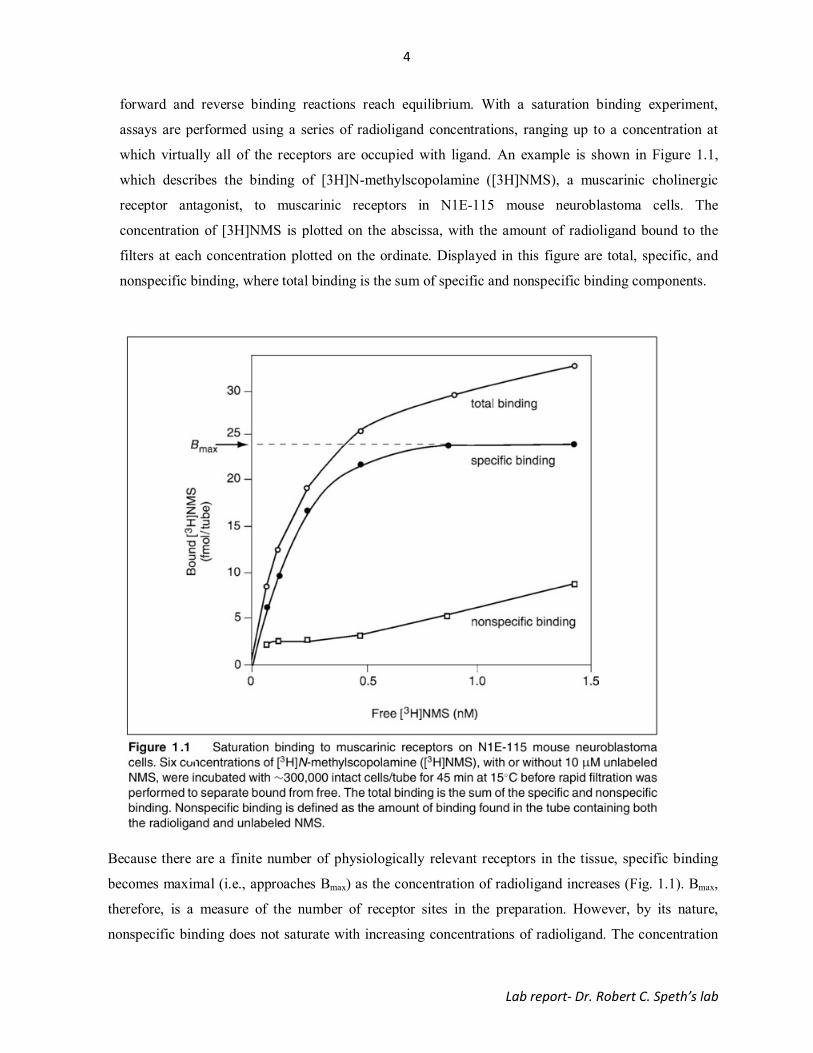
forward and reverse binding reactions reach equilibrium. With a saturation binding experiment,
assays are performed using a series of radioligand concentrations, ranging up to a concentration at
which virtually all of the receptors are occupied with ligand. An example is shown in Figure 1.1,
which describes the binding of [3H]N-methylscopolamine ([3H]NMS), a muscarinic cholinergic
receptor antagonist, to muscarinic receptors in N1E-115 mouse neuroblastoma cells. The
concentration of [3H]NMS is plotted on the abscissa, with the amount of radioligand bound to the
filters at each concentration plotted on the ordinate. Displayed in this figure are total, specific, and
nonspecific binding, where total binding is the sum of specific and nonspecific binding components.
Because there are a finite number of physiologically relevant receptors in the tissue, specific binding
becomes maximal (i.e., approaches Bmax) as the concentration of radioligand increases (Fig. 1.1). Bmax,
therefore, is a measure of the number of receptor sites in the preparation. However, by its nature,
nonspecific binding does not saturate with increasing concentrations of radioligand. The concentration
5
Lab report- Dr. Robert C. Speth’s lab
of radioligand at which the amount of specific binding is one half Bmax approximates the equilibrium
binding dissociation constant (KD). However, to obtain the KD and Bmax from a plot it is preferable to fit
the specific binding data with a mathematical model in a computer program to determine KD and Bmax
(McKinney & Raddatz, 2006).
Radioligand:
Antagonist radioligand is preferred because it is known to interact selectively with the target site as it
will usually bind with a high affinity whether the receptor is coupled to membrane-associated signal
transduction elements (e.g., G proteins) or is in a desensitized state. In general, antagonists tend to bind
to receptors with much higher affinity than agonists. Additionally, agonists induce conformational
changes in receptor-effector complexes that can cause ligand-receptor complexes to exist in multiple
states with different binding characteristics. Another advantage of antagonist radioligands is that they
do not activate the receptor which, in the case of binding with metabolically active cells, can result in
the desensitization, and reduction in affinity, of the site. Moreover, agonists tend to label only a portion
of the actual receptor present and, as most receptors are present at concentrations of <10 pmol/mg
protein, specific binding for agonists can be quite low relative to antagonists. For these reasons,
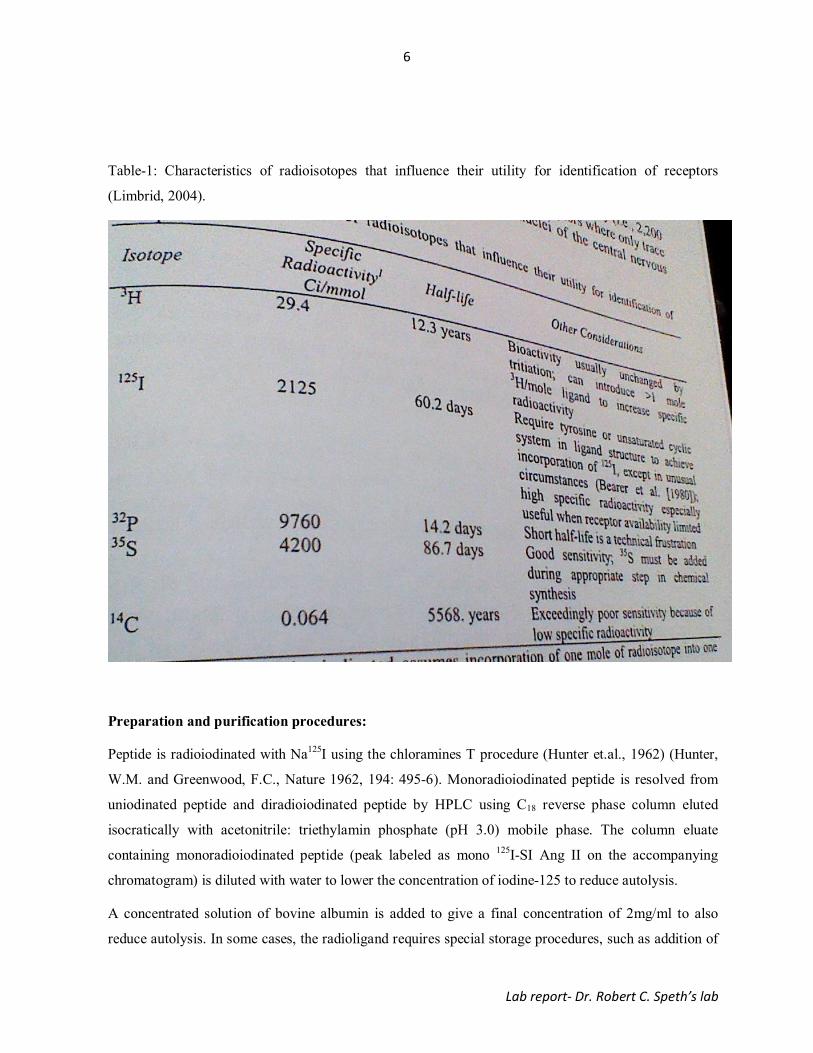
radiolabeled antagonists are the preferred ligands for most binding assays. In general, compounds with
a specific activity <20 Ci/mmol do not make good radioligands (McKinney & Raddatz, 2006). Table-1
outlines the characteristics of the radioisotopes commonly employed for receptor identification.
The radioligand we used in the lab experiment was 125I-SI Ang II. The reference data and purification
process is as follows:
Reference Date: 1/10/2013 (Preparation date)
Amount: 512 µCi (2*256 µCi)
Volume: 1.0 ml (2*0.5ml) in 1.5ml microcentrifuge tubes
Concentration: 512 µCi/ml 235nM
Specific activity: 2175 Ci/mmol (theoretical specific activity of monoradioiodinated ligand)
Solvent: 1 part (18% acetonitrile: 82% Triethylamine phosphate, pH 3.0) 1 part distilled water
Stabilizers: contains 2mg/ml bovine albumin
Lot number: 130110B
Prepared by Robert Speth, Ph.D. FAAAAS at Georgetown University
6
Lab report- Dr. Robert C. Speth’s lab
Table-1: Characteristics of radioisotopes that influence their utility for identification of receptors
(Limbrid, 2004).
Preparation and purification procedures:
Peptide is radioiodinated with Na125I using the chloramines T procedure (Hunter et.al., 1962) (Hunter,
W.M. and Greenwood, F.C., Nature 1962, 194: 495-6). Monoradioiodinated peptide is resolved from
uniodinated peptide and diradioiodinated peptide by HPLC using C18 reverse phase column eluted
isocratically with acetonitrile: triethylamin phosphate (pH 3.0) mobile phase. The column eluate
containing monoradioiodinated peptide (peak labeled as mono 125I-SI Ang II on the accompanying
chromatogram) is diluted with water to lower the concentration of iodine-125 to reduce autolysis.
A concentrated solution of bovine albumin is added to give a final concentration of 2mg/ml to also
reduce autolysis. In some cases, the radioligand requires special storage procedures, such as addition of
7
Lab report- Dr. Robert C. Speth’s lab
antioxidants or protease inhibitors in the case of a peptide radioligand, to slow or prevent degradation.
Similar preservation procedures maybe needed to prevent the degradation of receptors in the tissue
preparation(McKinney & Raddatz, 2006).
Based upon the decay catastrophe hypothesis, disintegration of an iodine-125 molecule destroys the
peptide to which it is bound (Catt & Baukal, 1973). Based upon this concept, the specific activity of the
radioligand does not change. However, the concentration of 125I-Sar1,Ile8 Angiotensin II will decrease
with a half-life of 60.14 days. Radioiodinated ligand is frozen at -200C in a lead container.
Affinity and pharmacological selectivity of radioligand: A high affinity radioligand is desirable because
it allows for separation of bound from free ligand by filtration since the rate of dissociation is directly
related to affinity. The primary consideration in selecting a radioligand is its selectivity for the receptor
of interest (McKinney & Raddatz, 2006).
Nonspecific binding: The physicochemical properties of a ligand determine its level of nonspecific
binding due to interactions with lipid membranes and/or filter or scintillation bead material in the assay
(McKinney & Raddatz, 2006).
Tissue preparation:
The tissue (rat kidney, liver and pancreas) to be analyzed was disrupted to increase access of the
radioligand to the receptor population. A tissue homogenizer was employed to disrupt tissue for use in a
binding assay. Typically, the tissue is kept cold in ice bucket until it is disrupted in the homogenizing
vessel and buffer. The temperature was not to rise, or homogenizer was not run for too long, because
this can result in significant loss of receptor binding because of heat denaturation or because of
proteolytic activity.
The standard procedure is to homogenize the tissue or cells of interest in a hypotonic buffer using either
Polytron (Brinkman) or a Tissumizer (Tekmar). Remarkably, most receptors are reasonably stable
(generally for hours) following death, although it is wise to remove the tissue to ice reasonably quickly
(Bylund & Toews, 1993).
After that the tissue is centrifuged at high speed (20,000rpm) carried out at 40C. Following
centrifugation the supernatant is decanted and the pellet is re-homogenized after suspending it into 25ml
AM5 solution. Inhibitors (o-phenathroline & PMSF) can be used (500:1 proportion) before
recentrifugation. O-phenanthroline is a chelating agent ptotease inhibitor which prevents the peptide
degradation of radioligand (Karamyan, Gadepalli, Rimoldi, & Speth, 2009) and PMSF is a pure serine
8
Lab report- Dr. Robert C. Speth’s lab
protease inhibitor which protects the receptors and ligands from proteolytic degradation (Wangler et al.,
2012). Both o-phenanthroline and PMSF increases the specific binding of 125I-Ang II (Karamyan et al.,
2009). The purpose of two centrifugation steps is to remove any soluble interfering substances, such as
endogenous neurotransmitters and guanine nucleotides, which may interfere with the radioligand
binding assay (Bylund & Toews, 1993).
Endogenous ligands for the targeted receptor can interfere with radioligand binding. This is minimized
by using a series of washing steps and incubations, with or without degradative enzymes, to remove or
destroy the endogenous ligand. Extensive washing entails repeated pelleting by centrifugation followed
by resuspension in fresh buffer. For example, incubation of monoamines at 37◦C allows endogenous
enzymes to degrade the natural ligand, such as norepinephrine or dopamine(McKinney & Raddatz,
2006).
Buffer selection:
In most cases, a homogenization/assay buffer is selected that yields the highest ratio of specific versus
nonspecific binding (McKinney & Raddatz, 2006). In the lab experiments we used the hypotonic buffer
solution of pH around 7.15.
Binding assay conditions
Equations used to analyze binding data are based on two assumptions: that the receptor concentration is
low and that the free radioligand concentration (F) does not change during the assay. If the receptor
concentration is increased such that F changes significantly because a significant amount of ligand is
receptor bound, affinity will be underestimated. To avoid this, the receptor concentration should be
<10% of the radioligand KD (McKinney & Raddatz, 2006).
Binding assays can be performed at a variety of temperatures, depending on the requirements of the
experiment. Room temperature (25◦C) is convenient, but it must be tightly controlled to obtain
reproducible results. The choice of assay temperature and the duration of incubation must be
determined empirically to identify the conditions that yield the best signal-to- noise ratio for the
particular receptor and ligand combination (Bylund & Toews, 1993),(McKinney & Raddatz, 2006).
9
Lab report- Dr. Robert C. Speth’s lab
Separation of the Receptor-Ligand Complex (L*R) from Unbound (Free) Ligand:
Once the tissue-bound radioligand has been separated from the free radioligand in the assay mixture,
usually by vacuum filtration, the former is quantified using liquid scintillation spectroscopy. The
radioactivity thus determined is considered total binding, from which specific binding (defined as the
binding displaced in the presence of a saturating concentration of unlabeled ligand) and nonspecific
binding, the amount of total binding that remains associated with the tissue in the presence of the
saturating concentration of unlabeled ligand can be determined (McKinney & Raddatz, 2006). Filtration
is the most efficient and convenient method of separating free from bound radioligand because it
requires minimal handling of samples as compared to centrifugation. (Limbird, 2004) After incubation
of the radioligand with the tissue preparation, the contents of the assay tubes are aspirated onto filters
where the tissue and bound radioligand are trapped, while the unbound radioligand passes into the
effluent. For the vacuum filtration, in lab, we used cell harvester with BSA solution-wet filter and
buffer as rinsing solution. The filter was labeled at right hand side and circular wet portion containing
membrane and radioligand was collected in 12*75mm tube and appropriately labeled for gamma
counter. Gamma counter (Cobra gamma counter) counts filter circles for 1 minute each.
Analysis of Saturation Binding Curves:
Using nonlinear regression to determine Bmax and KD these steps were followed to analyze the data with
nonlinear regression:
1. Specific binding was calculated at each concentration of ligand (from total binding-nonspecific
binding).
2. The specific binding data was converted from counts per minute to more useful units such as
fmol/mg protein or sites per cell.
3. x was defined as the radioligand concentrations in nM. y is the specific binding in fmol/mg or sites
per cell.
4. Data was fitted to the non linear one site saturation binding assay to Graph pad Prism software.
5. KD and Bmax were found from result data in Prism file.
10
Lab report- Dr. Robert C. Speth’s lab
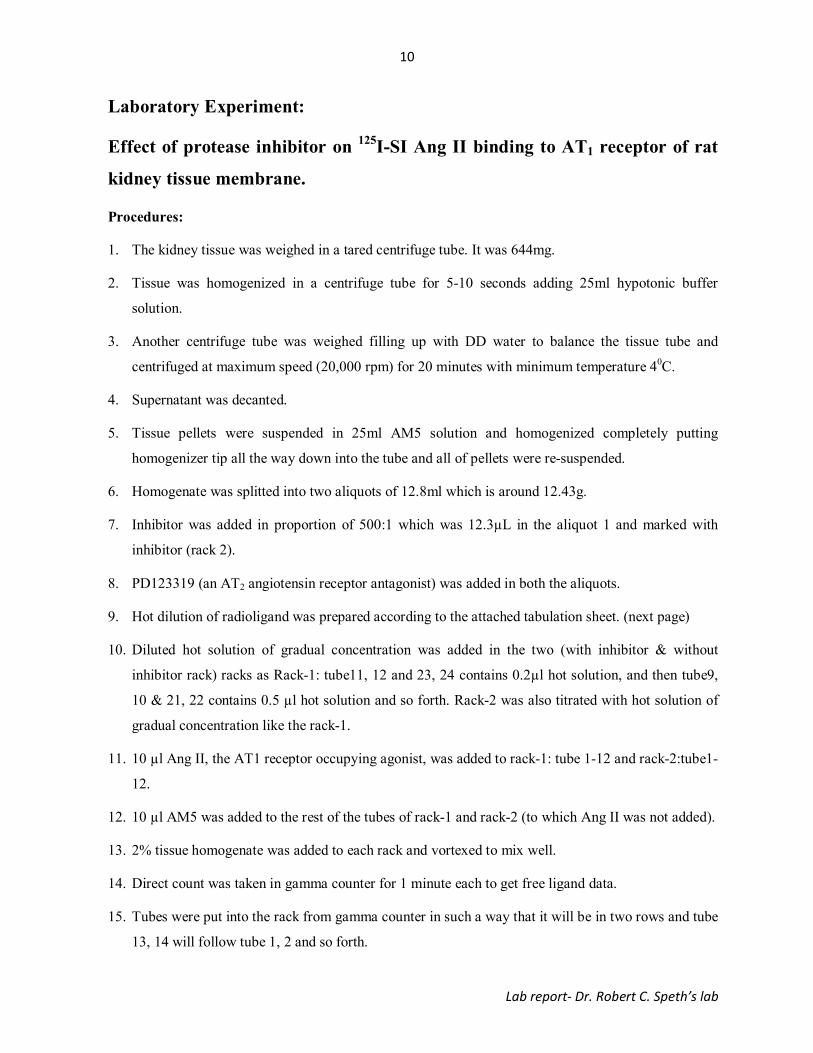
Laboratory Experiment:
Effect of protease inhibitor on 125I-SI Ang II binding to AT1 receptor of rat
kidney tissue membrane.
Procedures:
1. The kidney tissue was weighed in a tared centrifuge tube. It was 644mg.
2. Tissue was homogenized in a centrifuge tube for 5-10 seconds adding 25ml hypotonic buffer
solution.
3. Another centrifuge tube was weighed filling up with DD water to balance the tissue tube and
centrifuged at maximum speed (20,000 rpm) for 20 minutes with minimum temperature 40C.
4. Supernatant was decanted.
5. Tissue pellets were suspended in 25ml AM5 solution and homogenized completely putting
homogenizer tip all the way down into the tube and all of pellets were re-suspended.
6. Homogenate was splitted into two aliquots of 12.8ml which is around 12.43g.
7. Inhibitor was added in proportion of 500:1 which was 12.3µL in the aliquot 1 and marked with
inhibitor (rack 2).
8. PD123319 (an AT2 angiotensin receptor antagonist) was added in both the aliquots.
9. Hot dilution of radioligand was prepared according to the attached tabulation sheet. (next page)
10. Diluted hot solution of gradual concentration was added in the two (with inhibitor & without
inhibitor rack) racks as Rack-1: tube11, 12 and 23, 24 contains 0.2µl hot solution, and then tube9,
10 & 21, 22 contains 0.5 µl hot solution and so forth. Rack-2 was also titrated with hot solution of
gradual concentration like the rack-1.
11. 10 µl Ang II, the AT1 receptor occupying agonist, was added to rack-1: tube 1-12 and rack-2:tube1-
12.
12. 10 µl AM5 was added to the rest of the tubes of rack-1 and rack-2 (to which Ang II was not added).
13. 2% tissue homogenate was added to each rack and vortexed to mix well.
14. Direct count was taken in gamma counter for 1 minute each to get free ligand data.
15. Tubes were put into the rack from gamma counter in such a way that it will be in two rows and tube
13, 14 will follow tube 1, 2 and so forth.
11
Lab report- Dr. Robert C. Speth’s lab
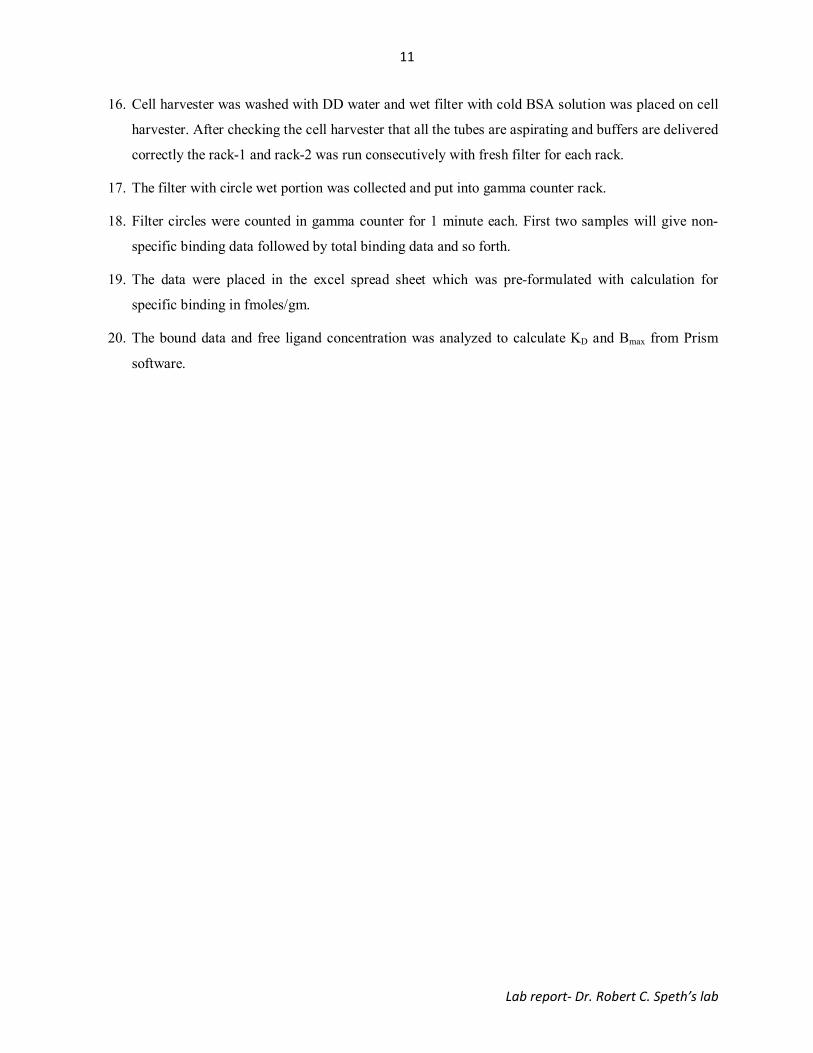
16. Cell harvester was washed with DD water and wet filter with cold BSA solution was placed on cell
harvester. After checking the cell harvester that all the tubes are aspirating and buffers are delivered
correctly the rack-1 and rack-2 was run consecutively with fresh filter for each rack.
17. The filter with circle wet portion was collected and put into gamma counter rack.
18. Filter circles were counted in gamma counter for 1 minute each. First two samples will give non-
specific binding data followed by total binding data and so forth.
19. The data were placed in the excel spread sheet which was pre-formulated with calculation for
specific binding in fmoles/gm.
20. The bound data and free ligand concentration was analyzed to calculate KD and Bmax from Prism
software.
12
Lab report- Dr. Robert C. Speth’s lab
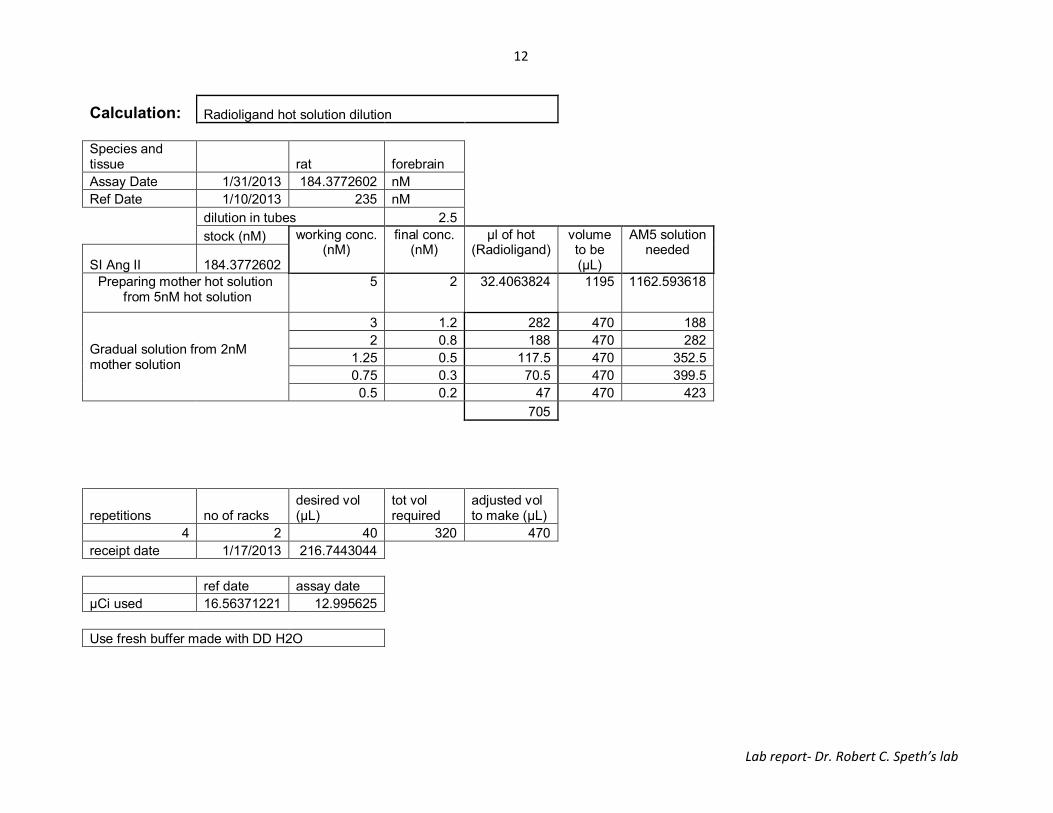
Calculation: Radioligand hot solution dilution
Species and tissue rat forebrain
Assay Date 1/31/2013 184.3772602 nM
Ref Date 1/10/2013 235 nM
dilution in tubes 2.5
stock (nM) working conc. (nM)
final conc. (nM)
µl of hot (Radioligand)
volume to be (µL)
AM5 solution needed
SI Ang II 184.3772602 Preparing mother hot solution
from 5nM hot solution 5 2 32.4063824 1195 1162.593618
Gradual solution from 2nM mother solution
3 1.2 282 470 188
2 0.8 188 470 282
1.25 0.5 117.5 470 352.5
0.75 0.3 70.5 470 399.5
0.5 0.2 47 470 423
705
repetitions no of racks desired vol (µL)
tot vol required
adjusted vol to make (µL)
4 2 40 320 470
receipt date 1/17/2013 216.7443044
ref date assay date
µCi used 16.56371221 12.995625
Use fresh buffer made with DD H2O
13
Lab report- Dr. Robert C. Speth’s lab
Rac
kDC Free DC cpm
DC
fmolDC nM
DC
Bound
Spec
fmol
Free
nM
Boun
d/free
uL
Nsp
/Free
Free
nM
Spec
fmol
Total
Bound
fmol
TBd/F
ree
NSP
boun
d
fmol
NSBd/
Free
spec/ns
p
831990.3 7581.4
829494.3 25 100 7419.5 2.472 2.4069 3.303 1.336 0.8965 0.2714 2.6848
825095.1 27067.3 1.446 1.6759 2.198 1.52 0.5222 0.2376 3.2092
838658.8 831310 253.2 2.532 26865.6 6.017 2.472 2.434 0.087 1.017 1.1268 8.259 1.512 1.487 2.241 0.3857 0.255 2.9214
483811.5 4190.8 0.622 0.7105 0.949 1.525 0.2384 0.2512 2.9804
494929.2 4256.1 0.328 0.3823 0.509 1.551 0.1262 0.2482 3.029
486111.5 17035.5 0.262 0.302 0.399 1.522 0.0971 0.2434 3.1088
489374.8 488557 148.8 1.488 18518.8 4.19 1.446 2.897 0.081 5.495 1.306
352379.1 3190.2
341658.4 3048.3
337418.4 11880.7
341393.6 343212 104.5 1.045 12583.1 2.817 1.017 2.769 0.084 3.781 0.964
210510.9 1864
211414.7 1992
208387.9 7510.9
210115.6 210107 63.99 0.64 7837.5 1.776 0.622 2.855 0.08 2.372 0.596
110826.3 1006.5
111721.7 1035
110061 4228.6
110611.7 110805 33.74 0.337 3996.7 0.956 0.328 2.915 0.07 1.271 0.316
88227 778.8
88142.2 792.3
89430.3 3097.5
88600.9 88600.1 26.98 0.27 3357.8 0.755 0.262 2.879 0.06 0.998 0.243
#
1
w
i
t
h
o
u
t
i
n
h
i
b
i
t
o
r
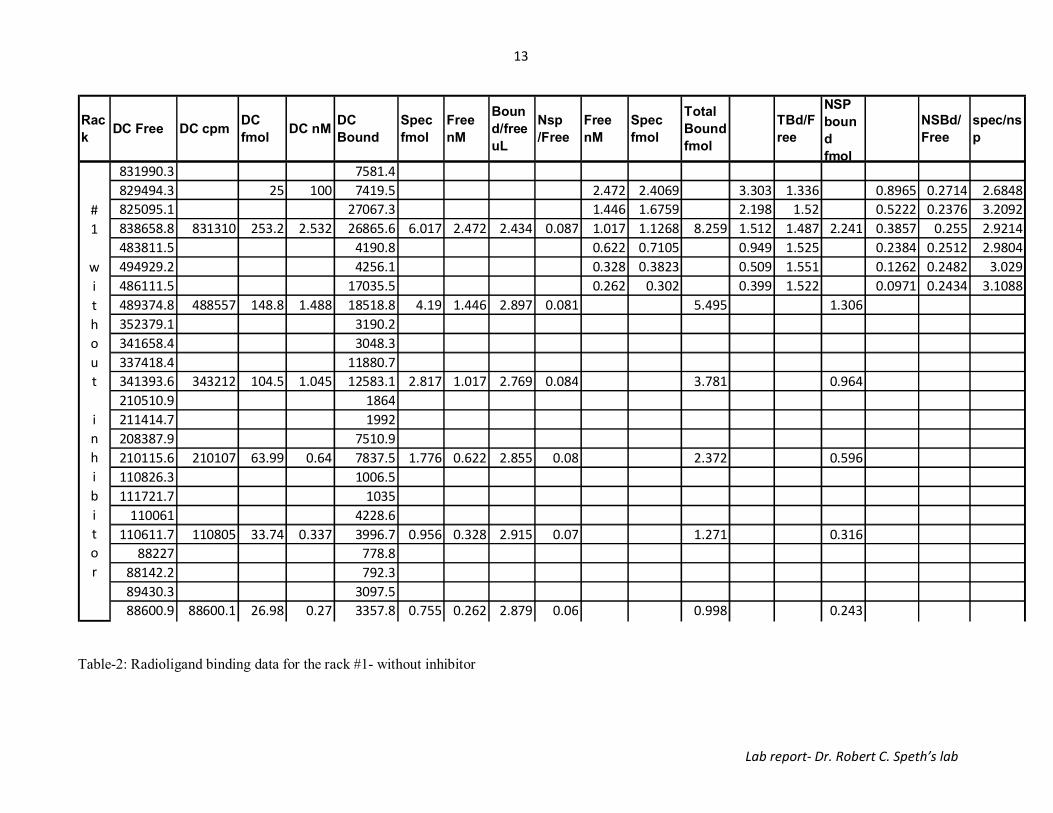
Table-2: Radioligand binding data for the rack #1- without inhibitor
14
Lab report- Dr. Robert C. Speth’s lab
Rac
kDC Free DC cpm
DC
fmol
DC
nM
DC
Bound
Spec
fmol
Free
nM
Boun
d/free
uL
Nsp/
Free
Free
nM
Spec
fmol
Total
Bound
fmol
TBd/F
ree
NSP
bound
fmol
NSBd/
Free
spec/n
sp
834273.4 5299.4
833339.7 5963.7 2.375 7.318 8.014 3.375 0.6963 0.0869 10.509
840714.3 60795.2 1.362 5.116 5.544 4.072 0.4282 0.0772 11.948
850501.6 839707.3 255.77 2.56 68837.4 18.295 2.375 7.704 0.06 0.923 4.164 20.036 4.521 4.897 1.741 0.3567 0.0789 11.675
492403.6 3233.7 0.564 3.014 3.219 5.712 0.2055 0.0638 14.667
491733.4 3692.7 0.292 1.905 2.025 6.928 0.1198 0.0591 15.908
488363.3 45076.2 0.236 1.392 1.475 6.246 0.0834 0.0566 16.676
483558 489014.6 148.95 1.49 44604.4 12.79 1.362 9.394 0.07 13.861 1.071
338390.8 2684.6
341394.8 3084.3
332224.3 36207
337131.1 337285.3 102.73 1.03 36914.6 10.41 0.923 11.28 0.08 11.302 0.892
207549.7 1612.9
211820.8 1710.8
208895.3 26276.4
210946.5 209803.1 63.898 0.64 25797.4 7.5348 0.564 13.37 0.07 8.0485 0.514
112145.6 999
113051.1 938.3
111151.7 17261.7
110148 111624.1 33.993 0.34 15494.6 4.7634 0.292 16.3 0.06 5.0628 0.299
89161.4 693.3
89245.2 656.5
88862.9 12178.4
88656 88981.38 27.096 0.27 11681 3.4791 0.236 14.73 0.05 3.6877 0.209
#
2
w
i
t
h
i
n
h
i
b
i
t
o
r
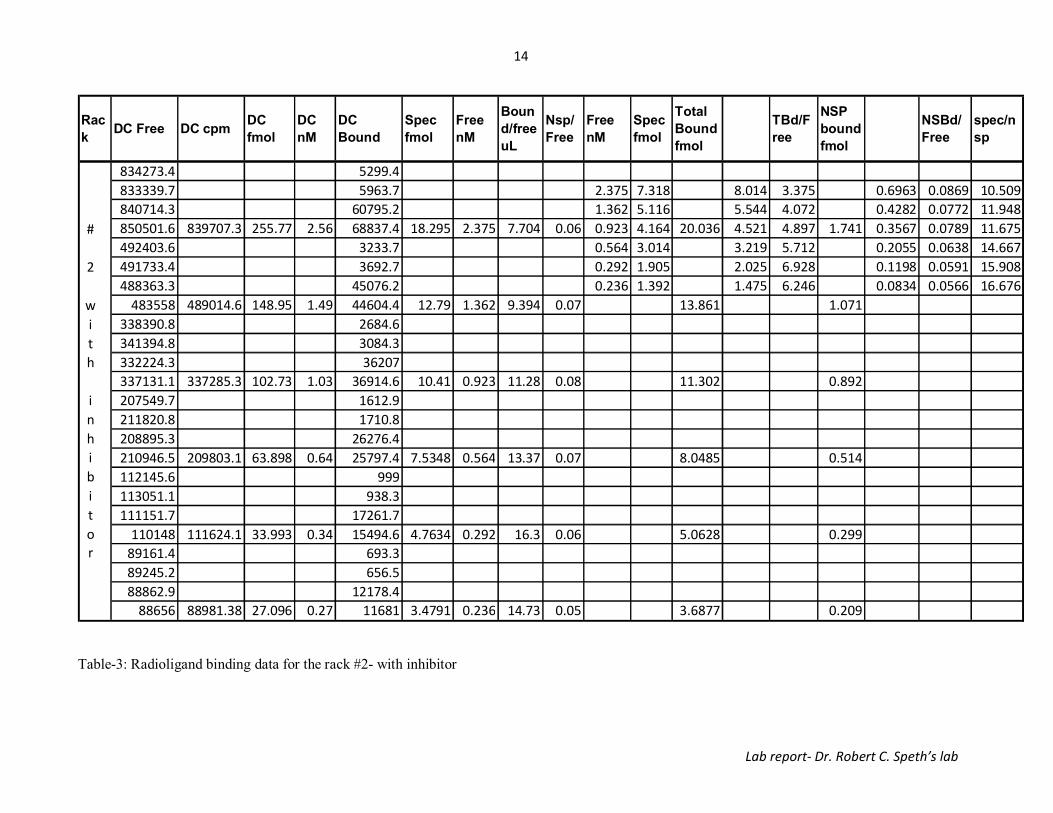
Table-3: Radioligand binding data for the rack #2- with inhibitor

15
Lab report- Dr. Robert C. Speth’s lab
Fig 1: Total and nonspecific binding without inhibitor. For total binding, KD = 7.096 and Bmax = 9.372
Fig 2: Total and nonspecific binding with inhibitor. For total binding, KD = 2.01 and Bmax = 13.29
16
Lab report- Dr. Robert C. Speth’s lab
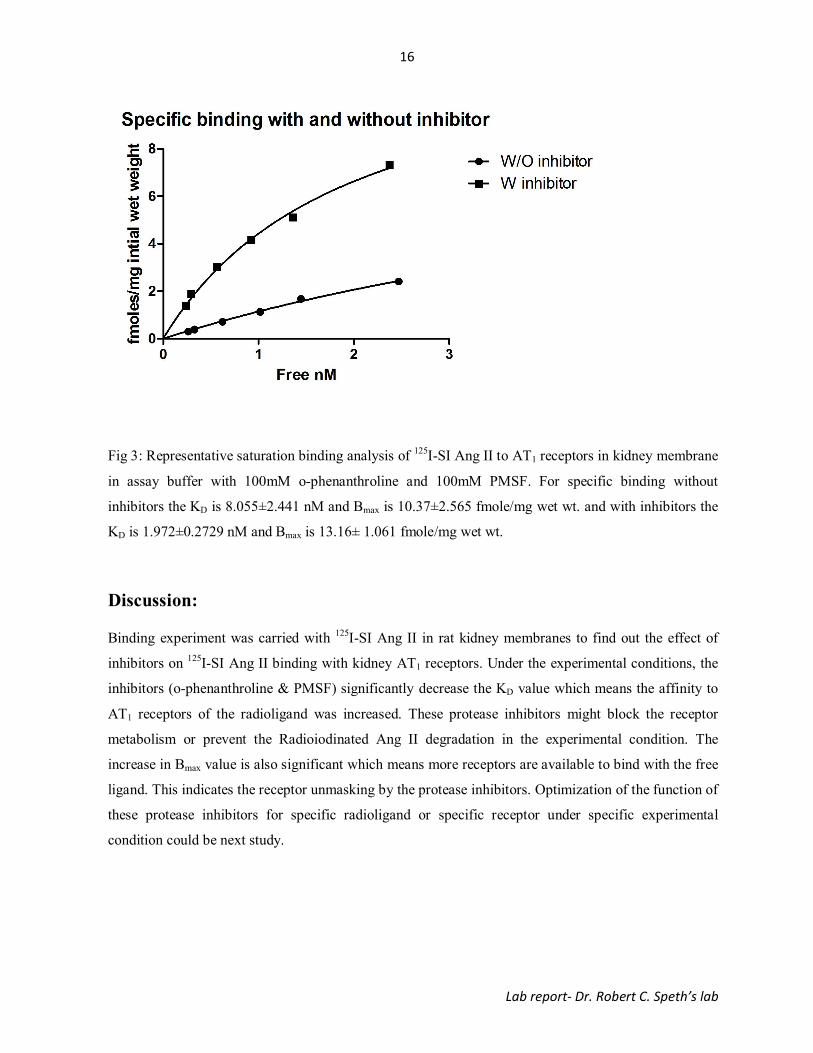
Fig 3: Representative saturation binding analysis of 125I-SI Ang II to AT1 receptors in kidney membrane
in assay buffer with 100mM o-phenanthroline and 100mM PMSF. For specific binding without
inhibitors the KD is 8.055±2.441 nM and Bmax is 10.37±2.565 fmole/mg wet wt. and with inhibitors the
KD is 1.972±0.2729 nM and Bmax is 13.16± 1.061 fmole/mg wet wt.
Discussion:
Binding experiment was carried with 125I-SI Ang II in rat kidney membranes to find out the effect of
inhibitors on 125I-SI Ang II binding with kidney AT1 receptors. Under the experimental conditions, the
inhibitors (o-phenanthroline & PMSF) significantly decrease the KD value which means the affinity to
AT1 receptors of the radioligand was increased. These protease inhibitors might block the receptor
metabolism or prevent the Radioiodinated Ang II degradation in the experimental condition. The
increase in Bmax value is also significant which means more receptors are available to bind with the free
ligand. This indicates the receptor unmasking by the protease inhibitors. Optimization of the function of
these protease inhibitors for specific radioligand or specific receptor under specific experimental
condition could be next study.
17
Lab report- Dr. Robert C. Speth’s lab
Cryocut sectioning of rat kidney & adrenal:
During the lab rotation in this lab I learned to section the rat kidney & adrenal gland by cryocut
machine. The section I cut was 20µ. The section was cut and examined whether it’s getting proper
shape to mount on the slides. It the temp is warm the section get coiled and cannot be mounted on
slides. So temperature was reduced to an optimized level. After attaching the tissue on the tip of coiled
surface of holder through some gum adhesion the blade was ran through the tissue and first few sections
were not uniform thickness. After a while the section was getting uniform thickness. The section was
thaw mounted onto the slides. The slides were numbered as 1-1, 1-2, 1-3, 1-4 and date was written over
it with pencil. The sequence of mounting the sections on the slides were 1-1, 1-2, 1-3, 1-4 and cyclically
again 1-1, 1-2, 1-3, 1-4. For kidney I got 6 sections per slide and adrenal I got 11 sections per slide.
The knife blade is very sharp. So, I had to be extra careful handling and cleaning the blade if needed.
And mounting the small thin sections on the slides was done carefully so that the section doesn’t get
squeezed.
Dissecting rat forebrain and collecting internal organ:
I have observed the sacrificing of rat for dissecting its forebrain and collecting internal organs. The rat’s
cage and required information for approval was noted. Then the rat was put into CO2 jar and kept until
it became unconscious. After that the unconscious rat was decapitated.
The scissor’s sharp edge was entered into upper crevices and cut through the joint of skull. The lobes of
forebrain and pituitary glands were collected carefully. The collected brain and pituitary was placed on
aluminum foil and kept refrigerated.
For the collection of internal organs the body of the rat was lay flat on napkin and the skin was cut to
get internal organs. The heart and lungs was separated first and collected on aluminum foil. Then the
liver and lymph system was separated carefully and collected. After that reproductive system of the
female rats were collected including the ovary and uterine.

18
Lab report- Dr. Robert C. Speth’s lab
Lab Swipe:
The radioactive materials were constrained within one room of the lab. After the radioligand binding
assay the working surface was examined with survey meter every day. If there is any hot surface it was
swiped with wet tissue and examined again. The predefined places those are suspected to be radioactive
within the radioactive lab are swiped once in a week. The tissue paper cut in around 2.5 by 2.5 inches
was used for lab swipe. The 15 different places were swiped and the swiped tissue paper was pressed to
make bead size to put inside tube to count in gamma counter. To have a background radioactivity count
an unswiped tissue is taken. If any surface/ place is more than 100count compared to background count
it is swiped very well with clean wet napkin and after that the surface is swiped again to check the
radioactivity.
Experimental precautions:
1. The experiments and laboratory materials may contain radioactivity which are hazardous to health.
Care should be taken according to radioactive safety plan to avoid contamination.
2. The radioactive materials should be disposed of with utmost care and caution.
Conclusion:
Lab rotation at Dr. Robert Speth’s laboratory was an interesting and learning experience for me. Getting
the opportunity to have experiments on radioligand binding assay, some partial procedures of
autoradiography and rat organ sectioning greatly enhanced my laboratory experiences and learning. The
ongoing experiments and techniques gave me a very good idea about the research of the lab.
Acknowledgment
I would like to thank Dr. Robert Speth for his instructive and caring guidance.