Embed Size (px)
Citation preview

Graduation Coaching in
High-Need Urban, High Schools
A paper presentation during the
2010 Annual Conference of the American Educational Research Association
on
May 1, 2010 Denver, Colorado
by
Warren E. Lacefield and
Pamela J. Zeller and
Nancy Van Kannel-Ray
Western Michigan University Kalamazoo, Michigan

AERA 2010 1
Graduation Coaching in High-Need Urban, High Schools
May 1, 2010
Warren E. Lacefield, Pamela J. Zeller, and Nancy Van Kannel-Ray Western Michigan University
ABSTRACT
This study documents the impact of placing graduation coaches as a GEAR UP intervention in urban high schools. The overall goal was improvement of students’ academic performance, particularly for students not passing core courses. This longitudinal study began with data collection in feeder middle schools where results indicated improved student achievement. The middle school model was revised to incorporate strategies appropriate to the developmental needs of high school students. Preliminary results indicate that the graduation coach model is a promising practice in high-need urban high schools.
OBJECTIVES OR PURPOSES OF STUDY
This study documents the impact of placing graduation coaches as a GEAR UP (Gaining Early Awareness and Readiness for Undergraduate Programs) intervention in urban high schools. The overall goal of this intervention is improvement of students’ academic performance, particularly for students not passing core courses. Nationally, graduation rates for students in large urban high schools are at 53 percent. In the class of 2008, for example, more than one-quarter of a million students did not receive a diploma (Swanson, 2003, 2008). Moreover, studies show that the retention problems may begin in middle school (Jackson & Davis, 2000). Therefore, this longitudinal study began with data collection in feeder middle schools. Prior studies began with three cohorts in four middle schools (7th and 8th grade) who participated in an innovative academic case management program. Since this program was effective at retarding or reversing the downward trajectory of at-risk children on track for failure in middle schools (Van Kannel-Ray, Lacefield, & Zeller, 2008, 2009), the middle school model was revised to incorporate strategies appropriate to the developmental needs of students as they progress into high school.
The current study followed students into high schools and half-way through 10th grade for the 2008-2009 and 2009-2010 cohorts to demonstrate the effectiveness of a graduation coaching intervention designed for at-risk students. The goal was increased academic performance and improved retention rate. Matriculating high school students identified as at-risk received graduation coaching services similar to the middle school academic case management program but developmentally adapted for older students. Preliminary results indicated that at-risk students

AERA 2010 2
receiving graduation coaching performed somewhat better than predicted academically and appeared more likely to remain in school. More detailed analyses examine when and with what groups of students, graduation coaching as implemented appears to have had effects and how this intervention strategy can be improved by more careful student selection, administrative support for coaches, formative use of data, and other strategies in urban high schools.
PERSPECTIVES, THEORETICAL FRAMEWORK, AND CONNECTIONS TO LITERATURE
Graduation coaching is an intervention in multicultural, urban high schools for students who are not passing core courses and who are at-risk for dropping out of school. Such structural supports are a step toward overcoming not only the difficult adjustments necessary from the middle to high school environments, but also the social and behavioral challenges that adolescents face as they transition to adulthood. Providing a positive learning environment within which students can cope with the challenges and barriers in their lives so that they can succeed academically (Lee, 2005) is particularly important for children who live in low-income, urban settings. In this case, the graduation coaches, who are the structural supports, deliberately facilitate academic success for at-risk students.
Building on the academic case management model in middle schools, graduation coaches serve as a clearinghouse, connecting students to the supports they need as they face the challenges presented in their high school careers. These challenges include earning credits towards graduation as the center piece issue and working with other key issues in their lives such as teen pregnancy, neighborhood violence, substance abuse, etc. Bess (2003) posits that “we are deeply wired…to form concepts about our surroundings, and then to take action, making tangible adjustments to the reality that confronts us out there, until it conforms more closely with our ideas” (p. 282). Since many of the social issues surrounding students in high school become more complicated than the issues of middle school, it is important to connect students with adult mentors who can help students adjust to the new realities of the high school environment.
Thus, the overriding function of the graduation coaches is to improve student capacities to interact with the school environment and engage actively in their own academic success as Vygotsky (1935, 1978) has suggested. Students do not leave their lives outside the classroom door. Rather their life experiences are brought and should be invited into the school environment (Grumet & Pinar, 1993). The graduation coach is the catalyst encouraging the student to learn how to navigate this new educational context. It was Piaget, (1967, 1971) who stated that “knowledge is essentially construction” (p. 362). In Biology and Knowledge, he theorized that human intelligence is actually a “bursting” of the kind of instinct that animals demonstrate as they interact with their environments. Piaget believed that learners acquire knowledge by interacting with and adapting to the environment. The graduation coaching model helps students navigate the connections between their lives and the school environment in order to make learning personally meaningful and to create individual paths toward academic success. (Brundett & Silcox, 2000).

AERA 2010 3
BACKGROUND AND METHODOLOGY
The current study is part of a five-year longitudinal project that is focusing on multiple factors including academic performance and student behavior as a result of academic case manager (in middle school) and graduation coach (in high school) interventions. The partnership district involved in this study was one of six project sites in the GEAR UP study funded in part by the U.S. Department of Education. The district is located in southwest Michigan. There are 7,364 students enrolled in fifteen elementary schools, three middle schools, one high school, and an alternative 6-12 building. More than 63 percent of the students in this district qualify for free/reduced lunch, about 50 percent are from minority groups, and the population with limited English proficiency is increasing. Baseline data for students in each of the project schools has been collected since fall, 2005, the first year of the project, for 6th and 7th grade students. In fall, 2006, as these students entered 7th and 8th grade, a third cohort of 6th grade students was included in the study. In fall, 2007, a first cohort of 9th grade students (N=407) entered the particular high school which is the site of this study and graduation coaching services commenced with mixed pilot results. The program was revised. This current study examines the 9th grade student cohorts entering in 2008-2009 who have now completed all of 9th grade and first semester of 10th grade (N=344) and entering in 2009-2010 who have completed first semester of 9th grade (N=293).
During this two-year study, several key issues were examined. Student grade changes in core courses (Core GPA) from one marking period or semester to the next over the course of each academic school year were of particular interest. Core courses include English/language arts, science, math, and history/social studies. Likewise, validation of tools for early identification of students and groups at-risk of academic failure and potential drop-out was a second area of interest. Finally, this study looks at ways to assess, in real time and for formative evaluation purposes, coaching effects and processes with various kinds of students in coach caseloads.
Part A: Specific Objectives:
We anticipate that students who demonstrate a consistent pattern of diminishing academic performance prior to 9th grade which otherwise might lead to failure and drop-out can be identified and targeted for intensive graduation coach intervention and assistance. A favorable outcome would be a leveling and/or increase in marking period GPA and other measures and a return to the academic mainstream of the class and peer cohort.
• First, we look at preliminary analytical results comparing students who were selected by coaches and teachers and received graduation coaching services with their peer classmates who did not receive such services.
• Next, we develop an identification/selection method based on previous long term trends in academic performance in core coursework to classify students in categories of risk. A post-hoc validation study was conducted in another high school to demonstrate that this empirical process based upon available school data is both replicable in other school settings and can clearly identify students who appear on a track headed toward academic failure in high school.

AERA 2010 4
• We apply this data-driven selection method, again retroactively, to the 9th grade student cohorts in 2008-2009 and 2009-2010 in the target high school where graduation coaching is being studied. The result was classification of all 637 students into a) successful, b) at-risk declining, c) at-risk rising, and d) consistently failing student groups.
• We examine the relative performance of all four groups, for the first cohort through 9th grade and semester 1 of 10th grade and for the second cohort through semester 1 of 9th grade. Current graduation coach caseloads consisted of some of the students classified in each of the four groups. A separate reporting system provided data on students who received episodic or relatively frequent coaching attention. Thus, we can report preliminary findings in this on-going study by type of student at-risk and consumption of coaching resources.
• Finally, we discuss how timely available data can be and is being used formatively to guide and focus graduation coach efforts and to improve the overall and individual effectiveness of the intervention.
Part B: Sample and Sampling Plan:
For the preliminary and current studies, we include N=344 students in the 9th grade cohort entering in 2008-2009 who have now completed all of 9th grade and first semester of 10th grade and N=293 students entering in 2009-2010 who have completed first semester of 9th grade. Of these, N=112 students in cohort 1 and N=70 students in cohort 2 were chosen by coaches, teachers, and other school personnel (using their own guidelines) to receive graduation coaching services as part of the coaches' caseloads. This is obviously not a random sample and thus these studies are designed to be causal-comparative in nature. Graduation coaching is an intervention designed to help students who appear at risk of failure. Coach guidelines suggested that caseloads consist primarily of students who appear at-risk of academic failure, based on diminishing longitudinal performance as well as other indicators. Coaching is not often appropriate for students who have been failing chronically for years and who need extensive remediation. Some of these students, however, may have recently begun to improve, e.g., during 8th grade. Very likely, such academically rising students have already found the equivalent of a good coach. These, students, however, are also on the "at-risk bubble" and are candidates for coaching, continued observation, and support if necessary.
For the identification/selection method validation study, data was available for a historical comparison cohort of N=98 students in a different, rural high school, who were in 8th grade in 2007-2008 and entered 9th grade in 2008-2009, but none of whom received coaching services. Applying the same selection standards (described below), this cohort could be divided into two groups: the first consisting of N~20 students who appeared at risk of failure prior to the beginning of their 9th grade year and another N~10 students who encountered academic difficulty early in transition; the remaining N~70 students then formed an appropriate peer comparison group. Since none of these students were coached and all included received marking period grades throughout 9th grade, this historical cohort can provide a baseline comparison to the current study, demonstrating what happens without the coaching intervention. The results (reported below) validate the selection method.

AERA 2010 5
Part C: Study Design
The preliminary study, the historical comparison study, and the current study share a similar overall research design. Repeated measures, generalized linear models are employed to examine differences due to main effects and interactions. The criterion for statistical significance for this study is alpha = .05. The dependent variable of primary interest is grading period GPA. This is the average of grades in core coursework (4 or 5 courses) posted at the end of each grading period.
Part D: Measures and Data Collection
This causal-comparative research design will follow individual students within each group in each cohort from 6th grade into and through 9th grade. The primary data source will be building and school district student information system records. The primary longitudinal quantitative data stream will be marking period/semester academic performance in core subjects (English/language arts, science, math, and history/social studies). Similar secondary data streams such as attendance records and behavioral incident rates are also available for formative evaluation and subsequent studies. Other secondary and tertiary data sources include graduation coach records and activity reports; GEAR UP student, teacher, and parent surveys; and student focus groups.
PRELIMINARY STUDY
The preliminary study examined the overall effect of graduation coaching. Two levels of the factor COHORT appear in the analytical model and represent students in 9th grade in 2008-2009 and in 2009-2010 respectively. A second factor is TREATMENT with two levels representing the students who received relatively frequent graduation coaching and their comparison peer groups of classmates who received little or no such service. A 2B1W repeated measures, generalized linear model was used to examine differences between student cohort classes, between coached and comparison peer groups, and across TIME – i.e., 4 full school years (12 marking periods - grades 6, 7, and 8 in middle school - followed by 3 semesters of high school). Of particular interest are hypotheses concerning interactions involving TREATMENT and TIME. The criterion for statistical significance for this study is alpha = .05. The dependent variable of primary interest is grading period GPA. This is the average of grades in core coursework (4 or 5 courses) posted at the end of each grading period.
Examination of Figure 1 shows a promising and highly significant (p < .0001) interaction. The first thing of interest is a general middle-to-high school transition drop in grading period core GPA for the peer comparison group. The effect size is almost one-half letter grade. Students identified at-risk by school personnel did demonstrate a steep decline in average academic performance beginning in 7th grade and accelerating in 8th grade, widening the performance gap between the two groups by almost two letter grades by the end of 8th grade. Graduation coaching began in 9th grade and the coached group appears to have held its own and even gained slightly during semester 1 of 9th grade for both cohorts averaged together, an effect that continues through 9th grade and through semester 1 of 10th grade for students in the 2008-2009 cohort. With the peer comparison group falling and the graduation coached group holding steady, even rising a bit, the performance gap between the two groups narrowed. Perhaps more important than this is that the graduation coached students appear unlikely to drop-out of school soon for academic reasons.

AERA 2010 6
Table 1: Research Design and Summary Statistics for the Preliminary Study.
10th Grade
Cohort Treatment MP1 MP2 MP3 MP4 MP1 MP2 MP3 MP4 MP1 MP2 MP3 MP4 S1 S2 S1
Mean 2.94 2.86 2.82 2.59 2.71 2.85 2.70 2.75 2.95 2.89 2.88 2.91 2.35 2.27 1.88Std 0.78 0.74 0.85 0.86 0.86 0.78 0.81 0.85 0.7 0.76 0.67 0.75 0.75 0.81 0.86
N 121 121 119 120 127 128 132 132 138 138 138 138 138 131 120Mean 2.53 2.58 2.55 1.84 2.1 1.99 1.52 1.4 1.81 1.55 1.14 0.91 1.26 1.18 1.04Std 0.96 0.77 0.74 0.91 0.83 0.96 0.94 0.87 0.87 0.73 0.68 0.53 0.78 1.02 0.89N 18 18 18 18 20 19 20 20 22 22 22 22 22 20 17
Mean 2.86 2.81 2.87 2.65 2.92 2.92 2.97 2.97 2.9 2.76 2.8 2.73 2.07 . .Std 0.9 0.82 0.76 0.81 0.8 0.81 0.75 0.8 0.78 0.77 0.77 0.79 1.02 . .N 136 135 139 141 146 147 152 152 161 161 161 161 161 . .
Mean 2.54 2.26 2.42 2.26 2.46 2.41 2.46 2.26 2.19 1.64 1.46 1.09 1.05 . .Std 0.78 0.78 0.89 0.9 0.98 0.97 0.71 0.9 1.03 0.88 0.82 0.61 1.01 . .N 19 19 19 19 19 19 19 19 19 19 19 19 19 . .
Preliminary Study
Longitudinal Observation Period Observed Study Period
6th Grade 7th Grade 8th Grade 9th Grade
2009-2010
peer comparison
graduation coached
2008-2009
peer comparison
graduation coached
Figure 1: TREATMENT x TIME Interaction Means Plot for the Preliminary Study.
NOTE: All data points through 9th grade, semester 1, represent the average of both cohorts. Data points for 9th grade, semester 2, and 10th grade, semester 1, represent only cohort 1 students.
At the time, we felt that this happy result provided some evidence that the graduation coaching program was working to some extent, despite many serious implementation problems. These included unclear selection criteria, other evidence that many similar students who were also academically at-risk were not being selected for coaching for a variety of reasons, myriad demands for coaches time to be spent on other school issues besides academic coaching, heavy caseloads diluting the time available for coaches to spend with individual students, etc. We decided to focus attention on data-driven procedures for early identification of students who may be at-risk of academic failure so as to be able to provide coaches with a pool of coaching-eligible students to consider for their caseloads prior to the beginning of the school year.

AERA 2010 7
DATA-DRIVEN STUDENT IDENTIFICATION AND SELECTION: A HISTORICAL COMPARISON AND VALIDATION STUDY
To illustrate how the student identification and selection process works, grading period GPA in core academic coursework will be the dependent variable of interest below. What GPA means and how valid and reliable such measures are can be argued indefinitely. We understand GPA here as a measure of the degree to which a student has satisfied his or her teacher regarding mastery of a particular content studied within a particular period of time. We will first examine the rural school environment where we first developed and tested the selection method. Then we will apply that method to the population of students in the current study.
Historically, the population of students transitioning from 8th to 9th grade in the rural school district selected for the validation study is approximately 120 students. Of these, approximately 40 percent will very likely drop out of school before graduating, usually before 11th grade. To promote student retention, success, and perseverance to graduation, the goal of the selection process was to identify those students who would likely benefit from additional academic support and coaching services. Most rural schools, including this district, have adequate electronic student records to provide a longitudinal comparative data analysis of individual student academic and social performance through middle school grades and into high school. Demonstrating how this information can be used to make data-driven decisions regarding which students might benefit from additional resource allocation is a specific objective of this paper.
We began the identification process with the longitudinal data base of individual student academic performance as measured by average grading period GPA in core coursework from 6th grade through 8th grade. One property of longitudinal research designs is that individual subjects and intervention groups can serve as their own controls. In fact, the intercorrelation matrix of grading period GPA across 12 middle school marking periods followed a typical AR1 autoregressive pattern with an average correlation of about .73. However, our focus here is on individual classification. Initially for that purpose, we produced and analyzed longitudinal "spaghetti" plots of spline-smoothed individual student GPA trajectories over time. BY individually examining those plots, we selected students exhibiting a characteristic downward arching trajectory which, if extrapolated into 9th grade and beyond would predict prompt and total academic failure.
We applied this method to data available for a historical cohort of N=85 students in the rural high school who were in 8th grade in 2007-2008 and entered 9th grade in 2008-2009, none of whom had or later received coaching services. Figure 2A illustrates the results of this selection process applied to these students' grading period GPA data in core courses from 6th grade through 8th grade. Two groups of students are identified: (1) a group of N=22 students (red lines in the figure) who appear to be on a clear downward trajectory and very much at-risk of academic failure and (2) a peer comparison group of N=66 other students who appear to be relatively well prepared for high school.
Having established our two groups based only on data available after the end of 8th grade, we can then "go forward" in time to see what actually happened to these students in the 9th grade in the absence of coaching. Figure 2B presents the dismal picture of exactly what happened. Now most of the grade trajectories of the students previously identified as at-risk have continued to plummet,

AERA 2010 8
well beyond the GPA < 1.0 point (less than a "D" average in core courses) which we choose to use here as an indicator of academic failure and very likely eventual drop-out. This is a convincing validation of this methodology. One purpose of this study is to prevent this sort of outcome from happening in the future with similar groups of students.
Figure 2A: 2007-2008 Baseline Figure 2B: 2008-2009 Baseline Study Student Predictions Study Student Outcomes
Table 2: Historical Baseline Study: 2007-2008 8th Grade Student Performance in 9th Grade in 2008-2009 Without Coaching
Students Students Who Actually: Row
Predicted to: Failed 9th grade Passed 9th Grade Totals
Fail in 9th Grade
N = 17 77%
N = 5 23%
N = 22
25%
Pass in 9th Grade
N = 9 14%
N = 57 86%
N = 66
75%
Column Totals N = 2630%
N = 6270%
N = 88 100%
McNemar's S1 = 21.6216 p < .0001
Odds ratio for passing is approx. 22:1 for peer students compared to at‐risk students.
Taking this baseline study a step further, we compute an "end-of-8th grade" GPA based on the average of the last two 8th grade marking periods and an "end-of-9th grade" GPA based on the average of the last two trimesters. Next we dichotomize these scores as "below 1.0" (Fail) and "1.0 or better" (Pass) and organize these data into the paired contingency table shown in Table 2.
AERA 2010 9
Notice that 77 percent of the 8th students identified as at-risk of failure did, in fact, fail in the 9th grade. Likewise, 86 percent of the students expected to pass, in fact, did so. This result, when tested using McNemar's S test for paired 2x2 tables, statistically is highly significant (S1 = 21.6216, p < .0001). This quite clearly validates the selection method as an appropriate tool for identifying at-risk students. This result also has practical significance, revealing that the odds ratio for passing is more than 22:1 in favor of students who are NOT identified as at-risk.
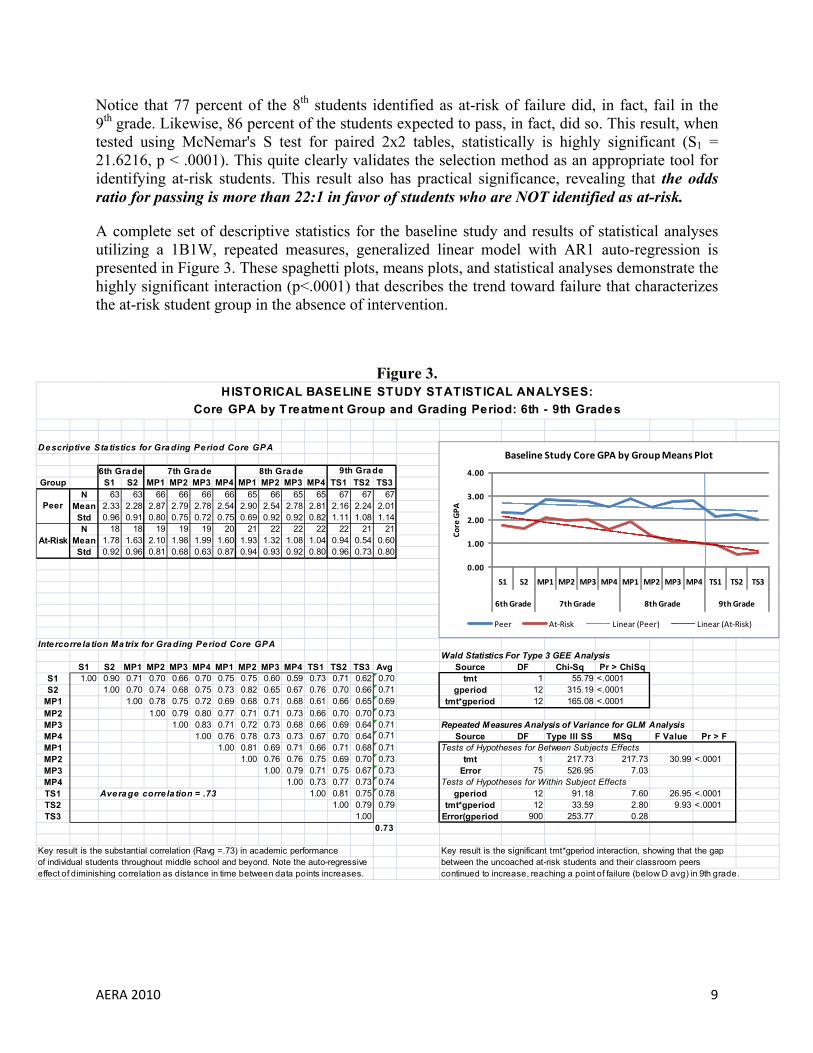
A complete set of descriptive statistics for the baseline study and results of statistical analyses utilizing a 1B1W, repeated measures, generalized linear model with AR1 auto-regression is presented in Figure 3. These spaghetti plots, means plots, and statistical analyses demonstrate the highly significant interaction (p<.0001) that describes the trend toward failure that characterizes the at-risk student group in the absence of intervention.
Figure 3.
Descriptive Sta tistics for Grading Period Core GPA
Group S1 S2 MP1 MP2 MP3 MP4 MP1 MP2 MP3 MP4 TS1 TS2 TS3N 63 63 66 66 66 66 65 66 65 65 67 67 67
Mean 2.33 2.28 2.87 2.79 2.78 2.54 2.90 2.54 2.78 2.81 2.16 2.24 2.01Std 0.96 0.91 0.80 0.75 0.72 0.75 0.69 0.92 0.92 0.82 1.11 1.08 1.14N 18 18 19 19 19 20 21 22 22 22 22 21 21
Mean 1.78 1.63 2.10 1.98 1.99 1.60 1.93 1.32 1.08 1.04 0.94 0.54 0.60Std 0.92 0.96 0.81 0.68 0.63 0.87 0.94 0.93 0.92 0.80 0.96 0.73 0.80
Inte rcorre la tion Matrix for Grading Period Core GPA
S1 S2 MP1 MP2 MP3 MP4 MP1 MP2 MP3 MP4 TS1 TS2 TS3 Avg Source DF Chi-Sq Pr > ChiSqS1 1.00 0.90 0.71 0.70 0.66 0.70 0.75 0.75 0.60 0.59 0.73 0.71 0.62 0.70 tmt 1 55.79 <.0001S2 1.00 0.70 0.74 0.68 0.75 0.73 0.82 0.65 0.67 0.76 0.70 0.66 0.71 gperiod 12 315.19 <.0001
MP1 1.00 0.78 0.75 0.72 0.69 0.68 0.71 0.68 0.61 0.66 0.65 0.69 tmt*gperiod 12 165.08 <.0001MP2 1.00 0.79 0.80 0.77 0.71 0.71 0.73 0.66 0.70 0.70 0.73MP3 1.00 0.83 0.71 0.72 0.73 0.68 0.66 0.69 0.64 0.71 Repeated Measures Analysis of Variance for GLM AnalysisMP4 1.00 0.76 0.78 0.73 0.73 0.67 0.70 0.64 0.71 Source DF Type III SS MSq F Value Pr > FMP1 1.00 0.81 0.69 0.71 0.66 0.71 0.68 0.71 Tests of Hypotheses for Between Subjects EffectsMP2 1.00 0.76 0.76 0.75 0.69 0.70 0.73 tmt 1 217.73 217.73 30.99 <.0001MP3 1.00 0.79 0.71 0.75 0.67 0.73 Error 75 526.95 7.03MP4 1.00 0.73 0.77 0.73 0.74 Tests of Hypotheses for Within Subject EffectsTS1 Average corre la tion = .73 1.00 0.81 0.75 0.78 gperiod 12 91.18 7.60 26.95 <.0001TS2 1.00 0.79 0.79 tmt*gperiod 12 33.59 2.80 9.93 <.0001TS3 1.00 Error(gperiod 900 253.77 0.28
0.73
Key result is the substantial correlation (Ravg =.73) in academic performance Key result is the significant tmt*gperiod interaction, showing that the gapof individual students throughout middle school and beyond. Note the auto-regressive between the uncoached at-risk students and their classroom peerseffect of diminishing correlation as distance in time between data points increases. continued to increase, reaching a point of failure (below D avg) in 9th grade.
At-Risk
9th Grade
Wald Statistics For Type 3 GEE Analysis
HISTORICAL BASELINE STUDY STATISTICAL ANALYSES:Core GPA by Treatment Group and Grading Period: 6th - 9th Grades
6th Grade 7th Gra de 8th Grade
Peer
0.00
1.00
2.00
3.00
4.00
S1 S2 MP1 MP2 MP3 MP4 MP1 MP2 MP3 MP4 TS1 TS2 TS3
6th Grade 7th Grade 8th Grade 9th Grade
Core GPA
Baseline Study Core GPA by Group Means Plot
Peer At‐Risk Linear (Peer) Linear (At‐Risk)
AERA 2010 10
CURRENT STUDY
The current study is actually an extension and re-analysis of the preliminary study data since both cohorts are still in the middle of an academic year, 10th grade for cohort 1 and 9th grade for cohort 2. Its purpose is to provide a more fine-grained analysis of graduation coaching effects. For this purpose, we refined our student identification and selection system to further classify "at-risk" students into three types:
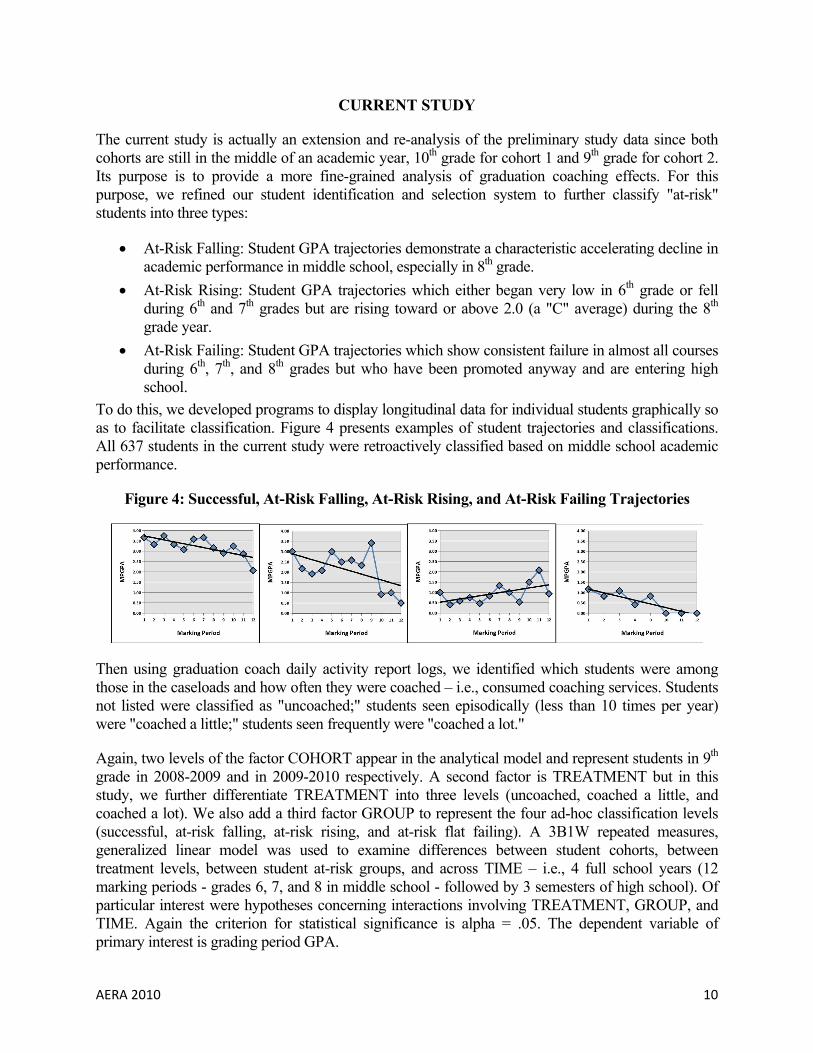
• At-Risk Falling: Student GPA trajectories demonstrate a characteristic accelerating decline in academic performance in middle school, especially in 8th grade.
• At-Risk Rising: Student GPA trajectories which either began very low in 6th grade or fell during 6th and 7th grades but are rising toward or above 2.0 (a "C" average) during the 8th grade year.
• At-Risk Failing: Student GPA trajectories which show consistent failure in almost all courses during 6th, 7th, and 8th grades but who have been promoted anyway and are entering high school.
To do this, we developed programs to display longitudinal data for individual students graphically so as to facilitate classification. Figure 4 presents examples of student trajectories and classifications. All 637 students in the current study were retroactively classified based on middle school academic performance.
Figure 4: Successful, At-Risk Falling, At-Risk Rising, and At-Risk Failing Trajectories
Then using graduation coach daily activity report logs, we identified which students were among those in the caseloads and how often they were coached – i.e., consumed coaching services. Students not listed were classified as "uncoached;" students seen episodically (less than 10 times per year) were "coached a little;" students seen frequently were "coached a lot."
Again, two levels of the factor COHORT appear in the analytical model and represent students in 9th grade in 2008-2009 and in 2009-2010 respectively. A second factor is TREATMENT but in this study, we further differentiate TREATMENT into three levels (uncoached, coached a little, and coached a lot). We also add a third factor GROUP to represent the four ad-hoc classification levels (successful, at-risk falling, at-risk rising, and at-risk flat failing). A 3B1W repeated measures, generalized linear model was used to examine differences between student cohorts, between treatment levels, between student at-risk groups, and across TIME – i.e., 4 full school years (12 marking periods - grades 6, 7, and 8 in middle school - followed by 3 semesters of high school). Of particular interest were hypotheses concerning interactions involving TREATMENT, GROUP, and TIME. Again the criterion for statistical significance is alpha = .05. The dependent variable of primary interest is grading period GPA.

AERA 2010 11
The results of this current analysis were less satisfactory than the preliminary analysis had lead us to believe. Much of the problem appears to concern student selection into coaching caseloads. Roughly half of the current graduation coach caseloads appear comprised of students that the retroactive identification system classified as likely to be "successful." This may have consumed coaching resources unnecessarily. The remainder of the caseloads consisted of roughly equal parts at-risk falling, at-risk rising, and at-risk failing students. Coaches appeared to be doing their jobs earnestly, monitoring students at least weekly and devoting most of their available time and resources to students who continued on a downward trajectory of poorer and poorer academic performance. In general, the students in the "successful" group who were coached performed consistently less well (but still at successful levels) than did those who were not coached. But the trajectories were similar through the middle of 10th grade and the small gap did not close. More seriously, no statistically significant interactions (i.e., closing the gap) were apparent for students classified as at-risk falling or at-risk failing and the trajectories for students in these classifications who were uncoached or coached, either a little or a lot, were almost identical.
For the at-risk rising students on the bubble of success, the statistical picture is somewhat different. Figure 5 presents what has happened so far for this student group. The blue line in the figure is the academic performance trajectory of students retroactively identified as likely to be "successful" and indeed they have been successful so far, in spite of a serious transition drop. The red line represents the trajectory of at-risk rising students who were not selected for coaching. They are not doing well at all. The purple line represents the at-risk rising students who are consuming most of the coach's time and resources. They are not doing well either. But the group of students in cohort 1 who were coached only a little (in other words who responded well to coaching – were very "coachable") did in fact hold their own very well throughout 9th grade and so far through semester 1 of 10th grade. Moreover, they did not show or overcame a hard transition from middle school to high school that is more typical of this group than of the others. This interaction was statistically significant.
Figure 5.
NOTE: All data points through 9th grade, semester 1, represent the average of both cohorts. Data points for 9th grade, semester 2, and 10th grade, semester 1, represent only cohort 1 students.
AERA 2010 12
RESULTS, CONCLUSIONS, AND POINTS OF VIEW
These results require further exploration and explanation. As timely formative evaluation feedback to coaches, they offer an opportunity to redirect coaching efforts during the on-going second semester toward the needs of students who still appear to have a chance to maintain or improve their academic performance records. As a source of information, especially when academic year-end data becomes available, these results will be used to guide strategic planning and coach training activities during the summer, implement and utilize the new identification and selection system to plan initial caseloads, emphasize "coachability" as a consideration for continued coaching support services, shield coaches from conflicting administrative or supervisory school obligations, and help focus available resources to maximize potential outcome effects.
Although this paper has emphasized academic performance, retaining students - particularly urban, multicultural students - in high school and facilitating their graduation encompasses more than an academic approach. As Cobb (1996) has discussed, the microcosm of the school influences student learning within a socio-cultural context. Therefore, interventions that focus on understanding and working within such a framework are especially important. Graduation coaches help students come to grips with changing cognitive structures within a social context, some of which, as Lewin (1995) argues, are culturally embedded. Utilizing that socio-cultural contextual information, graduation coaches help students focus on co-constructing environments in which they understand how their personal worlds and their educational worlds intersect and how they can succeed both socially and academically.
Borrowed from and built upon best practices proven in the health care and social services professions, graduation coaching is relatively new to the educational sector. This study shows that this intervention can be implemented in urban high-needs high schools. Further, this study helps to move the graduation coach approach into the realm of best practices in education as well. Over the next two years of this study, we hope to replicate, document, and further focus on the effects of graduation coaches as an intervention to increase student retention in urban schools.
AERA 2010 13
References:
Bess, M. (2003). The light-green society: Ecology and technological modernity in France, 1960-2000. Chicago: University of Chicago Press.
Brundett, M., Silcox, P. (2002). Achieving competence, success and excellence in teaching. London: Routledge/Farmer.
Cobb, P. (1996) Where is the mind? A coordination of socio-cultural and cognitive constructivist perspectives. In Fosnot (ed.) Constructivism: Theory, perspectives and practice. New York: Teachers College Press, 34-52.
Grumet, M.R., Pinar, W.F. (1993). The curriculum: What are the basics and are we teaching them? In Castenell & Pinar (eds.) Understanding curriculum as a racial text: Representations of identify and difference in education, 23-37. New York: University of New York Press.
Jackson, A., Davis, G. (2000). Turning points 2000: Educating adolescents in the 21st century. New York: Teachers College Press.
Lee, C. (2005). Intervention research based on current views of cognition and learning. In Joyce E. King, (Ed.) Black education: A transformative research and action agenda for the new century Mahwah, New Jersey: Lawrence Erlbaum Associates, Inc.
Lewin, P. (1995). The social already inhabits the epistemic: A discussion of Driver, Wood, Cobb, Yackel, von Glasersfeld. In Steffe & Gale (eds.) Constructivism in Education. Hillsdale, New Jersy: Lawrence Erlbaum Associates, Inc., 423-432.
Piaget, J. (1971). Biology and knowledge. (B. Walsh, Trans.) Chicago, IL: The University of Chicago Press. (Original work published in 1967).
Swanson, C.B., (2003) Keeping count and losing count: Calculating graduation rates for all students under NCLB accountability. The Urban Institute Education Policy Center, 2100 M Street NW, Washington DC 20037.
Swanson, C.B. (2008) Cities in crisis: A special analytic report on high school graduation. Editorial Projects in Education Inc. Research Center. 6935 Arlington Road, Suite 100, Bethesda, MD 20814-5233
Van Kannel-Ray, N., Lacefield, W.E., & Zeller, P (2008) Academic case managers: Evaluating a middle school intervention for children at-risk. Journal of Multidisciplinary Evaluation, 5[10], 21-29.
Van Kannel-Ray, N., Zeller, P., & Lacefield, W.E. (2009) Academic case management: Promising interventions for closing achievement gaps in multicultural urban settings. ERS Spectrum, 27[3], 19-30.
Van Kannel-Ray, N., Zeller, P., & Lacefield, W.E. (Nov 12, 2009) The evolution of academic case management in multicultural urban schools. A paper presentation during the 2009 Annual Meeting of the American Evaluation Association, Orlando, FL.
Vygotsky, L.S. (1978). Interaction between learning and development. In Cole, John-Stein, Scribner, & Souberman (eds.) Mind in society: The development of higher psychological processes, 79-104. Cambridge: Harvard University Press. (Original work published in 1935)