Embed Size (px)
Citation preview
i
University of Ottawa
Faculty of Graduate and Post-Doctoral Studies
Master of Science in Management
Graduation Thesis
Status consumption in high tech products upgrading purchase: a study of the extended
theory of planned behaviour model.
Prepared by
Cheng Gu
Thesis supervised by Dr. Leila Hamzaoui Essoussi
Telfer School of Management
University of Ottawa
February 2017
© Cheng Gu, Ottawa, Canada, 2017

ii
TABLE OF CONTENTS
1. Introduction ............................................................................................................................................... 1
2. Literature review ....................................................................................................................................... 5
2.1 Upgrading behavior ............................................................................................................................ 5
2.1.1 Drivers of upgrading .................................................................................................................... 6
2.1.2 From functional value to symbolic value ..................................................................................... 8
2.1.3 Time of upgrading ........................................................................................................................ 8
2.2 Consumer behavior theories and upgrading behavior ....................................................................... 10
2.3 Self-concept ...................................................................................................................................... 14
2.3.1 The construct of self-concept ..................................................................................................... 14
2.3.2 Enhancing self-concept .............................................................................................................. 15
2.3.3 Conspicuous consumption and status consumption ................................................................... 16
3. The proposed research model ................................................................................................................. 17
3.1 Model constructs ............................................................................................................................... 17
3.2 Research hypotheses ......................................................................................................................... 18
3.2.1 Attitude ...................................................................................................................................... 18
3.2.2 Subjective norms ........................................................................................................................ 19
3.2.3 Perceived behavioral control ...................................................................................................... 19
3.3 The moderating effect of status consumption ................................................................................... 19
3.3.1 Status consumption and attitude ................................................................................................ 19
3.3.2 Status consumption and subjective norm ................................................................................... 21
3.3.3 Status consumption and perceived behavioral control ............................................................... 22
4. Research methodology ............................................................................................................................ 23
4.1 Research method selection ................................................................................................................ 23
4.2 Data collection .................................................................................................................................. 24
4.2.1 Participants ................................................................................................................................. 24
4.2.2 Data collection ........................................................................................................................... 25
4.2.3 Questionnaire/Measure development ......................................................................................... 26
4.2.4 Sample size estimation ............................................................................................................... 27
5. Results ..................................................................................................................................................... 28
5.1 Profile of respondents ....................................................................................................................... 28
5.2 Measure validation ............................................................................................................................ 29
5.3 Hypothesis testing ............................................................................................................................. 32

iii
5.4 Variations across brands ................................................................................................................... 36
6. Discussion ............................................................................................................................................... 38
6.1 Findings............................................................................................................................................. 38
6.2 In terms of theory building................................................................................................................ 40
6.3 Implications for practices .................................................................................................................. 42
6.4 Limitations ........................................................................................................................................ 43
6.5 Future research .................................................................................................................................. 43
7. Conclusion .............................................................................................................................................. 44
8. Reference ................................................................................................................................................ 46
9. Appendix ................................................................................................................................................. 51

iv
Abstract
The smartphones’ market is characterized by its fast evolving environment. In such an
environment, the key concern for each company is how to continually encourage consumers to
upgrade to the latest version before their existing model expires, which also highlights the
importance of continual product enhancement. Consumers choose high-tech products not only for
their functional values, but also for their symbolic values. This phenomenon is even more prevalent
among products that tend to be conspicuously consumed. The high portability and multi-functional
capabilities of smartphones make their use highly visible to users’ social surroundings, and
consumers may choose to upgrade their existing smartphones for the perceived symbolic values
provided by newer and enhanced models. The great success of the iPhone inspired the current
research to further investigate the antecedents of upgrade intention and to uncover the symbolic
value that smartphones provide to consumers. Reference group conformity is not the only way to
fulfill symbolic values of selected products. Consumers also have the tendency to actively express
their ideal self-image through acquiring and displaying material symbols and an ideal self-image
sometimes also refers to a self-image with higher social status. Building upon the Theory of
Planned Behavior (Ajzen, 1991), the proposed research model also explores the possible
moderating effect of status consumption on the TPB model. A survey will be administered to
university students (smartphone users) to collect primary data to measure the effectiveness of the
new proposed research model. The results of this study provided a better understanding of
consumers’ upgrading purchase intentions toward smartphones. Additionally, this study finds that
status consumption is partially related to smartphone purchases, which could also be extended to
other technological products categories.

1
1. INTRODUCTION
Apple Inc. recorded 92% of the total operating income from the world’s eight top smartphone
makers in the first quarter 2015, and Samsung Electronics Co. only reached 15%, according to
Canaccord Genuity (2015), the largest independent investment dealer in Canada. Apple and
Samsung account for more than 100% of industry profits in Canaccord’s calculations, because
other makers broke even or lost money. However, Apple sells less than 20% of smartphones, in
terms of unit sales. The disparity reflects its powerful strength to command much higher prices for
its phones, but what exactly contributes to this strength remains to be explored. The market of
smartphones is characterized by its fast evolving environment. For example, the release interval
between every generation of iPhone is only approximately one year since October 2011 and even
less than a year for Samsung’s Galaxy S series since April 2011 (gsmarena, 2015).
In such an environment, the key question for each company is how to continually encourage
consumers to upgrade to the latest version of their phones before their existing model expires
(Okada, 2006), which also highlights the importance of continual product enhancement (Urban,
Hauser, & Urban, 1993). Numerous people intended to have the new iPhone as early as possible
whenever a new version was launched. The success of the iPhone can then be interpreted as
Apple’s strength in product enhancement and control of consumer’s upgrading behavior (Grewal,
Mehta, & Kardes, 2004; Kim & Srinivasan, 2009), which continually encourages consumers to
upgrade from their older smartphones to a new iPhone even with a distinctively high cost.
Consumers choose the majority of products primarily for their functional values, which is
realized by selected product attributes or features that also reflect the performance aspects of
products (Mittal, Ratchford, & Prabhakar, 1990; Sweeney & Soutar, 2001). Consumers’
upgrading decisions largely depend on improved product features (Katona, 1960; Mueller, 1958),
the cost of switching from existing models to newer models (Bayus, 1988, 1991) and their
experiences with earlier models. That is, consumers in an upgrading situation are always facing a
first question: whether it is worth it and affordable to replace the existing products in order to gain
extra functional values provided by an enhanced product. In a fast evolving context, however,
consumer’s final upgrading decisions maybe not solely based on enhanced features of the next
product generation (Shih & Schau, 2011). Additionally, the high switching cost is normal for high-

2
tech products (Kim & Srinivasan, 2009) and a recent study on the upgrading behavior of mobile
phones suggested that consumers’ satisfaction with current products did not influence consumers
upgrading intention (Tseng & Lo, 2011). Thus, apart from product features, what else may drive
consumers’ upgrade intentions in a fast technological evolving context, like the smartphones
market, is worth investigating further.
Consumers choose branded products not only for their functional values, but also for their
symbolic values (Park, Jaworski, & Maclnnis, 1986; Sirgy, 1982). Corneo (2009) define symbolic
value as “personal characteristics that determine esteem the individual received from other people
as well as their self-esteem”. Secord (1968) argues that “people see their possessions as a part of
or an extension of themselves”, so consumers may also gain symbolic values though the
consumption and possession of products that they believe reflect their personal characteristics.
Unlike the performance or functional aspects, the “personal characteristics” of products are
perceived by consumers through the image of a typical product-user (Sirgy, Grewal, &
Mangleburg, 2000; Sirgy & Su, 2000). Consumers distinguish different products not only through
their features variability, but also through the perceived typical user image difference, which is
commonly achieved through brand associations (Sirgy, 1982). However, certain products may
require to be conspicuously consumed in order for consumers to gain esteem from other people
(Heffetz, 2004).
The consumption related to symbolic values of branded products refers to conspicuous
consumption and an expensive smartphone may very likely be consumed for both its functional
and symbolic values, because its high portability and multi-functionality makes the use of
smartphones more conspicuous than other high-tech product categories, such as televisions,
desktop computers and even laptops. For this reason, the research on upgrading behavior in the
context of upgrading high-tech products would not be conclusive without the consideration of
symbolic values, especially for products that tend to be conspicuously consumed. Among existing
literature on consumers’ upgrading behavior, not much is known about whether consumers’ desires
for symbolic values for certain products will affect their intentions to upgrade and their final
upgrading choices. Thus, this research aims at providing new insights to the existing literature on

3
upgrading behavior by studying the possible role of symbolic values among other variables on
upgrade intention for enhanced high tech products.
The upgrade intention behaviour has been mainly studied for mobile phones using the
Technology Acceptance Model (Huh & Kim, 2008; Tseng & Lo, 2011), by incorporating
consumers’ post-adoption behaviour to a model of upgrade behaviour, or by using a rational model
of durables replacing decision-making model (Guiltinan, 2010). Results have not been conclusive
in explaining the upgrade intention behaviour, mainly because they were limited to the
consideration of innovative and basic functional usage of phones, within a rational consumer
decision-making perspective. Considering that the upgrade intention behaviour for smartphones
can be driven by other variables than just the functional values of the product, we choose to build
our research upon the consumer behaviour model developed by Ajzen (1991), the Theory of
Planned Behaviour (TPB) Model. The TPB model has been extensively used to explain behaviour
in very specific and various consumption contexts and allows us to consider not only attitude
towards performing a target behaviour, but also the effect of subjective norms (or perceived social
pressure from society) and perceived behavioural control (or perceived ease or difficulty of
performing a behaviour) on behavioural intention. The application of this model in the context of
highly visible technological products can provide a different insight that seems relevant for
understanding voluntary replacement or upgrade decisions that would not be solely driven by
economic or functional related variables.
Furthermore, consumers have the tendency to actively express their self-image through
acquiring and displaying material symbols (Gollwitzer, Wicklund, & Hilton, 1982; Sirgy, 1982).
Consumers’ self-expression behavior is not always raised from the tendency to show personal
preference, but also from the need to reduce the inconsistency inside their self-definition or self-
concept (Wicklund & Gollwitzer, 2013). That inconsistency is the difference between one’s actual
self-image, defined as the perception of the actual oneself (Bellenger, Steinberg, & Stanton, 1976;
Green, Maheshwari, & Rao, 1969) and the ideal self-image, defined as the perception of the ideal
oneself (Belch, 1978; Delozier & Tillman, 1972).
4
An ideal self-image sometimes also refers to a self-image with a higher social status (Sirgy et
al., 2000), because one’s tendency to improve social status by the consumption of certain goods
has also been shown as having an important influence on consumer behaviors (Goldsmith, Flynn,
& Eastman, 1996). Thus, the purchase and use of some products probably contributes to the
attainment of social status and the attempts to make oneself “feel better” (Elliott, 1994; Friese &
Koenig, 1993). The consumption for social status refers to status consumption, which is defined
by Kilsheimer (1993) as “the motivational process by which individuals strive to improve their
social standing through the conspicuous consumption of consumer products that confer and
symbolise status both for the individual and surrounding significant others”. This definition states
that status consumption has some overlap with conspicuous consumption. However, O'Cass and
McEwen (2004) argue that status consumption and conspicuous consumption are related but still
separate constructs. Consumers’ tendency to improve social status through the upgrade intention
of highly visible high tech products is worth considering among other variables that can
significantly influence upgrading behaviour, which to our knowledge has not been included in
previous research on the subject.
This study proposes that consumers in a fast evolving high-tech environment tend to make
their upgrading decision based on the perceived functional and symbolic values offered by the
enhanced product, if the product itself tends to be conspicuously consumed. More specifically, the
symbolic values in this context are related to consumers’ potential benefit through the reference
group conformity (subjective norms) and the status consumption. The adoption of an extended
Theory of Planned Behavior model will allow us to test these assumptions and provide new
insights to the existing explanations of upgrading behaviour mainly based on functional and
rational approaches. This study is believed to be helpful in further explaining Apple’s success in
continually influencing consumers to upgrade their smartphones to the latest version of their
iPhone, even at a distinctively high cost. Brands failing to benefit from consumers’ upgrading
behavior may reconsider their ability to create enough symbolic values for consumers based on
the results of this research.
In the following sections of this study, section 2 presents a literature review of relevant
research on upgrading behavior, the Theory of Planned Behavior model, and status consumption.
5
Following this, section 3 presents the proposed research model and research hypothesis. After that,
section 4 focuses on the research methodology, including data collection and analyzing process.
Finally, the model test results will be presented and then discussed in section 5, followed by a
conclusion.
2. LITERATURE REVIEW
In this section, we present an overview of the literature on (1) consumers’ upgrading behavior
by focusing on identified drivers and various time of upgrading; (2) the use of well-accepted
consumer behavior models (TAM and TPB) in explaining consumers’ upgrading intention
especially in the market of smartphones; (3) status consumption based on the understanding of
consumers’ self-concept; and (4) the possible moderating effect of status consumption among the
constructs of the TPB model.
2.1 UPGRADING BEHAVIOR
Consumers are not necessarily interested in products with longer lifetimes (Lund, 1977), and
this phenomenon is even more prevalent in the context of high-tech products, which is
characterized by their distinctively brief life cycle compared to other durable goods (Tseng & Lo,
2011). For example, older smartphone models are rapidly replaced by newer models with
improved functions. Whenever a new version is released, consumers holding an older version of
product are always facing the decision to upgrade or not. (Shih & Schau, 2011). Kim and
Srinivasan (2009) defined the term upgrade as “a consumer’s second or later time purchase of an
improved version of an owned product”.
In comparison to a new purchaser, the upgrader may be more knowledgeable about the
product category and his or her preferences may also have evolved differently over the usage of
previous generations (Tseng & Lo, 2011). Additionally, because the upgrader already has an
existing product and normally the enhanced product shares the same basic functions as the earlier
models (Tseng & Lo, 2011), the marginal benefit of the enhanced product will be greater for a new
buyer than buyers who have an existing product (Okada, 2006).From the marketing perspective,
the importance of encouraging consumers to upgrade their existing models is highlighted by the
6
commonly observed constraints of market saturation (Urban et al., 1993). Okada (2006) argued
that:
“In many industries, the market size typically does not expand to accommodate the proliferation
of increasingly sophisticated models, so the commercial success of each generation of product
enhancement depends to a large extent on current owners of the existing model who upgrade to
the new model before the useful life of the existing model expires”.
Previous literature on consumers’ upgrading behavior mainly focuses on two streams:
drivers of upgrading purchases with a strong emphasis on product features (Huh & Kim, 2008;
Okada, 2006; Shih & Schau, 2011) and time of upgrading purchases (Bayus, 1991; Kim &
Srinivasan, 2009; Kim, Srivastava, & Han, 2001). Some researchers have been using the terms
upgrading purchase and replacement purchase interchangeably without consideration of their
relationships (Bayus, 1991; Kim & Srinivasan, 2009), but we argue that upgrading purchases is a
distinctive part of all replacement purchases. This is due to the fact that replacement purchases can
be driven by both product failure and other purely voluntary motives (Antonides, 1991). In the
condition of product failure or unreliable and declining performance, consumers are granted with
two options: to replace with a new and identical product or a new but improved one. Both options
can be called replacement purchase behavior, but only the latter one can be regarded as an
upgrading behavior. In other words, replacement purchase doesn’t have to be upgrading, but
upgrading behavior is part of replacement purchase behaviors. Thus, due to the focus of this study,
we tend to define the upgrading behavior as consumer’s later time purchase of an improved version
of an owned product before the existing units wear out (Kim & Srinivasan, 2009), which is purely
voluntary.
2.1.1 Drivers of upgrading
Consumers upgrade their existing models while they are still functional for a variety of
reasons. Literature on upgrading emphasize the importance of improved product features (Huh &
Kim, 2008; Katona, 1960; Okada, 2006), which is the result of technology advances (Mueller,
1958). Okada (2006) further indicated that the more dissimilar the enhanced products are perceived
by potential upgraders, the more likely they will finally upgrade; and focused enhancement on
7
selected product features is perceived as being more dissimilar than general enhancement. Hoffer
and Reilly (1984) argue that consumers also upgrade due to changing fashion and style preference.
For high-tech products, fashion and style are commonly reached through industrial design (Gemser
& Leenders, 2001), which also depends on the technological advances in materials and
manufacturing process. For example, Samsung’s Galaxy S Edge series smartphones are perceived
as more fashionable for having a double-side curved screen. The screen itself is the result of the
advances in Organic Light-Emitting Diode (OLED) display technology, which generated a new
screen material that can be curved and still remains functional. Sales promotion is also believed to
have an impact on consumer’s upgrading intentions through introducing new or enhanced product
features to consumers (Bayus, 1991). For example, sales promotion in a retail environment is
believed to have an impact on consumers’ upgrading choices (Dawson, Bloch, & Ridgway, 2002),
especially for those who lack sufficient knowledge about technology development (Shih & Schau,
2011). Other market surveys also indicate more specific reasons for upgrading behavior, including
changed family circumstances and improved financial circumstances (Gabor & Granger, 1972;
Katona & Mueller, 1955; Pickering, 1975; Wilkie & Dickson, 1985).
Consumers’ experiences with earlier models also influence their desire to upgrade (Kim &
Srinivasan, 2009). This is mostly due to the fact that although upgraded products normally have
some innovative functions, they still share the same basic functions as older models (Tseng & Lo,
2011). For example, the evolution from mobile phones to smartphones still keeps the basic calling
and texting functions. Researchers also argue that the more satisfied a consumer is with his or her
current product, the more willing that consumer is to make future purchases (Caruana, Money, &
Berthon, 2000; Zeithaml, 1988). Huh and Kim (2008) further highlighted that consumers who have
a higher usage rate of basic functions and innovative functions of mobile phones are more likely
to form the intention to upgrade. However, a subsequent study on upgrading mobile phones failed
to establish any relationship between consumer’s use of an older generation and the intention to
purchase newer generation products (Tseng & Lo, 2011). These contradictory results indicate that:
consumers’ upgrading decision may not solely be based on the performance aspects or functional
values of products, all the more for so products that tend to be conspicuously consumed, like
mobile phones.

8
2.1.2 From functional value to symbolic value
The performance of product features will contribute directly to the functional values
(Holman, 1981) and then indirectly to symbolic values, if the product itself is to be conspicuously
consumed. That is, the high performance of some product features will lead to high functional
values and then gradually contribute to consumer’s overall quality evaluation of the corresponding
brand name, which is commonly defined as part of brand image (Dobni & Zinkhan, 1990). A
positive brand image then will in turn be perceived as a guarantee of product performance. A
highly recognizable brand name with a positive brand image will then be able to offer subsequent
products with more positive images for possible upgrading. At this stage, it might still be the
considerations of functional values that dominate consumer’s upgrading choices. However, if
products from certain brands can also be publically distinguished (not only from similar products
of other brands, but also from older generations within the same brand) the positive product and
brand images will then provide symbolic values for consumers (Heffetz, 2011). This is because
brands are also perceived as communication vehicles at this stage (Holman, 1981), which enables
consumers to communicate non-verbally to achieve the satisfaction of self-expression and benefit
from the recognition of significant others (Belk, Bahn, & Mayer, 1982; Langer, 1997). However,
other products and brands that are unable to satisfy the conditions above are more likely to be
consumed solely for their functional values.
2.1.3 Time of upgrading
Another stream of upgrading literature focuses on the time of upgrading, which is based
on an assumption that all consumer durables will end up with being replaced by newer and
enhanced models (Bayus, 1991; Shih & Schau, 2011; Venkatesh & Brown, 2001). This assumption
raises two major concerns for researchers: the difference between early adopters and late adopters
(Bayus, 1991); and possible reasons of upgrading delay (Venkatesh & Brown, 2001). Each time a
newer and enhanced product is available on the market, consumers have to choose between staying
with the current product until the next upgrade becomes available or upgrading to the latest version.
(Kim & Srinivasan, 2009).
Consumers’ upgrading behavior has also been shown to be part of the innovation adoption
process, because new and innovative product diffusion also largely relies on potential adopters
9
holding older product generations. (Peres, Muller, & Mahajan, 2010). Research from this
perspective revealed two major findings: the upgrade timing is largely based on new product’s
enhanced features and benefits relative to existing products (Danaher, Hardie, & Putsis Jr, 2001;
Moreau, Lehmann, & Markman, 2001); and early adopters of one product are more likely to adopt
the subsequent generations early as well (Rogers, 2010). However, Huh and Kim (2008) indicated
that consumers’ post-adoption usages is a better predictor than the adoption time of the previous
generation. Early upgraders are also found to be associated with younger individuals and people
who are more technology-sensitive (Burke, Conn, & Lutz, 1978). Bayus (1991) investigated
consumers’ upgrading behavior in the context of automobile purchases, the results revealed that
early adopters are more concerned with styling and image, while late upgraders concerned more
about cost. This result is even more valuable for our study, because both automobiles and
smartphones tend to be conspicuously consumed. Thus, the style and image concern of early
upgraders may due to the fact that they perceive more symbolic values than late upgraders.
Consumers’ upgrading purchase are frequently delayed by their uncertainty of future
technology development (Mick & Fournier, 1998), because consumers may fear that the new
products they buy will soon become obsolete. This kind of fear refers to the Anticipated Regret,
defined by Sandberg and Conner (2008) (IrvingJanis, 1977); Making (1977) as “the psychological
effect of various worries that beset a decision maker before any losses actually materialize”
Venkatesh and Brown (2001) also argue that consumers may delay purchases of the current best
technology in favor of future technology. This phenomenon is even more prevalent in the high-
tech market where it’s even harder for consumers to perceive the fast pace of technology changes
(Shih & Schau, 2011), due to the frequent introduction of enhanced products (Dhebar, 1996). Shih
and Schau (2011) defined this frequency as the perceived rate of innovation (PRI) and concluded
that “the effect of anticipated regret will be greater under conditions of high PRI”. Another
psychological barrier that may hinder upgrading is that consumers have to overcome “the
psychological costs associated with taking an existing product out of commission while it is still
functional (Okada, 2001; p.433)”. However, Okada (2006) further indicated that such
psychological cost will be weakened if consumers perceive that the enhanced product is dissimilar
to the current model.
10
2.2 CONSUMER BEHAVIOR THEORIES AND UPGRADING BEHAVIOR
Among the existing literature on upgrading behaviors, variables that have been suggested to
have an impact on either the decision to upgrade or the time of upgrading are scattered and specific
without showing a tendency to form a unified construct or model. One approach was to try to
understand consumers’ upgrading intention and behavior by adopting an existing well-accepted
consumer behavior model, such as the Technology Acceptance Model (Tseng and Lo, 2010), while
some studies have focused on offering a framework for conceptualizing the upgrading decision
process by integrating the potential variables suggested in previous literature with regard to
upgrading (Guiltinan, 2010; Huh and Kim, 2008).
The Technology Acceptance Model (TAM) measures the intention and behavior towards
using a system (Davis, 1989). Perceived usefulness (defined as the extent to which a person
believes that using the system will enhance his or her job performance) and perceived ease of use
(defined as the extent to which a person believes that using the system will be free of effort)
compose the two behavioral predictors in the TAM. According to the TAM, if consumers perceive
a technology as being useful and easy to use, they will adopt that technology (Davis, 1989). Based
on TAM, Tseng and Lo (2011) investigated consumer’s upgrading intention from 2G mobile
phones to 3G/4G mobile phones in Taiwan. Following the general rule of the TAM model, Tseng
and Lo (2011) proposed that if consumers perceive a newer generation (3G/4G) as being more
useful and easy to use than the current model (2G), they will have a higher intention to upgrade.
However, their test results indicated that:
“Consumers who perceived newer generation mobile phones as more useful and easier to use did
not necessarily have a greater intention to upgrade in sequence. This is probably due to the fact
that consumer’s upgrading intention may be more closely to their perceived overall value of the
product than to its ease of use or usefulness” (Tseng and Lo, 2011; p.444).
This explanation is consistent with the fact that consumers choose products for their
functional but also for their symbolic values (Park et al., 1986; Sirgy, 1982). Both ease of use and
usefulness stand only for functional values of products and the overall value of products cannot be
fully interpreted without the consideration on symbolic values. Thus, we argue that TAM’s failure

11
to explain consumers’ upgrading behavior is very likely due to its inability to address consumers’
other concerns driven by perceived symbolic values. Moreover, TAM can be regarded as a special
case of the original Theory of Reasoned Action (TRA) (Fishbein & Ajzen, 1975) without the
consideration of subjective norms (Taylor & Todd, 1995). Additionally, TAM was established in
work settings, where product’s contribution to job performance is the main concern. However,
multi-functional products like smartphones are used in much wider settings than job relevance
activities.
Huh and Kim (2008) suggested that consumers’ post-adoption behavior also has an impact
on the upgrading intention to the successive versions of innovations. In their conceptual model,
Huh and Kim (2008) identify time of adoption (early adopter or late adopters of the previous
generation), age, basic function usage and innovative function usage as the main variables that
may influence consumers’ intention to purchase next generation of products. Their model has been
tested among Korean consumers with regard to their intention to purchase the next generation of
multimedia phones. Their results suggest that consumers who are younger and have a higher usage
rate of both basic and innovative functions are more likely to upgrade to the next generation of
products. However, the adoption of early product generations is not directly linked to the purchase
intention to the next generation and the relationship between adoption duration and upgrade
intention is actually mediated by the users’ post-adoption usage of both basic and innovative
functions.
The study conducted by Guiltinan (2010) proposed another conceptual framework in
analyzing consumers’ decision making process for product replacement or upgrading. In this
framework, consumers form the concept of the net utility of product replacement by comparing
the expected future benefit from the owned product and the expected future benefit from the
replacement. In other words, if consumers perceived a higher future benefit of a new product than
continually using the current product, they are more likely to make their decision to replace.
Additionally, consumers are also believed to compare the trade-in allowance and the price of
replacement in forming the final net utility of replacement. However, this decision making
framework hasn’t been empirically tested.
12
In regards to the results and the lack of explanation provided by the above models and
studies, another approach needs to be considered in order to uncover the antecedents of consumer
upgrading intention behaviour. Within the existing and established models, the Theory of Planned
Behavior developed by Ajzen (1991) has been widely used in a variety of consumption contexts.
The prediction power of Theory of Planned Behavior (TPB) has also already been supported in
the high-tech environment. For example, Harrison, Mykytyn Jr, and Riemenschneider (1997) used
the TPB model to explain and predict small business executives’ decisions to adopt information
technology (IT). Their conclusion confirmed the influence of attitude (perceived positive and
negative consequences for the firm), subjective norms (social expectations), and perceived
behavioral control (resources to overcome obstacles) on IT adoption in the decision process of
executives. Shih and Fang (2004) adopted the TPB model to understand how an individual’s belief,
attitude, subjective norm and perceived behavioral control (PBC) can influence the intention to
use internet banking in Taiwan. Using structural equation modeling, they found that the Attitude
significantly influences the intention to adopt internet banking, however, Subjective Norm and
PBC did not. They also confirmed the influence of behavioral intention on actual use of internet
banking. Pavlou and Fygenson (2006) adopted the TPB model to study both the intention to gain
information and the intention to purchase through e-commerce. In their statistical analysis, both
attitude and perceived behavior control significantly influenced both the intention to gain
information and purchase through e-commerce. Subjective norms, however, hardly had an impact
on the intention to gain information and purchase. This is probably due to the fact that the
behaviour of purchasing through e-commerce is less conspicuous than traditional ways of
purchasing.
We choose to build our research upon the Theory of Planned Behavior (TPB) model (Ajzen,
1991) considering its predictive power of consumer intention and behaviour, and thus its potential
significant explanation of smart phones upgrade behaviour. Moreover, this model allows us to
consider the influence of subjective norm which relates to non-functional values and may provide
an additional explanation to the upgrading behavior: consumers may intend to demonstrate
membership to significant reference groups which will probably result in behaving as what the
majority of such groups expected. Thus, subjective norm may reflects consumers’ concerns for
symbolic values of upgrading through reference group conformity (Bearden & Etzel, 1982). The
13
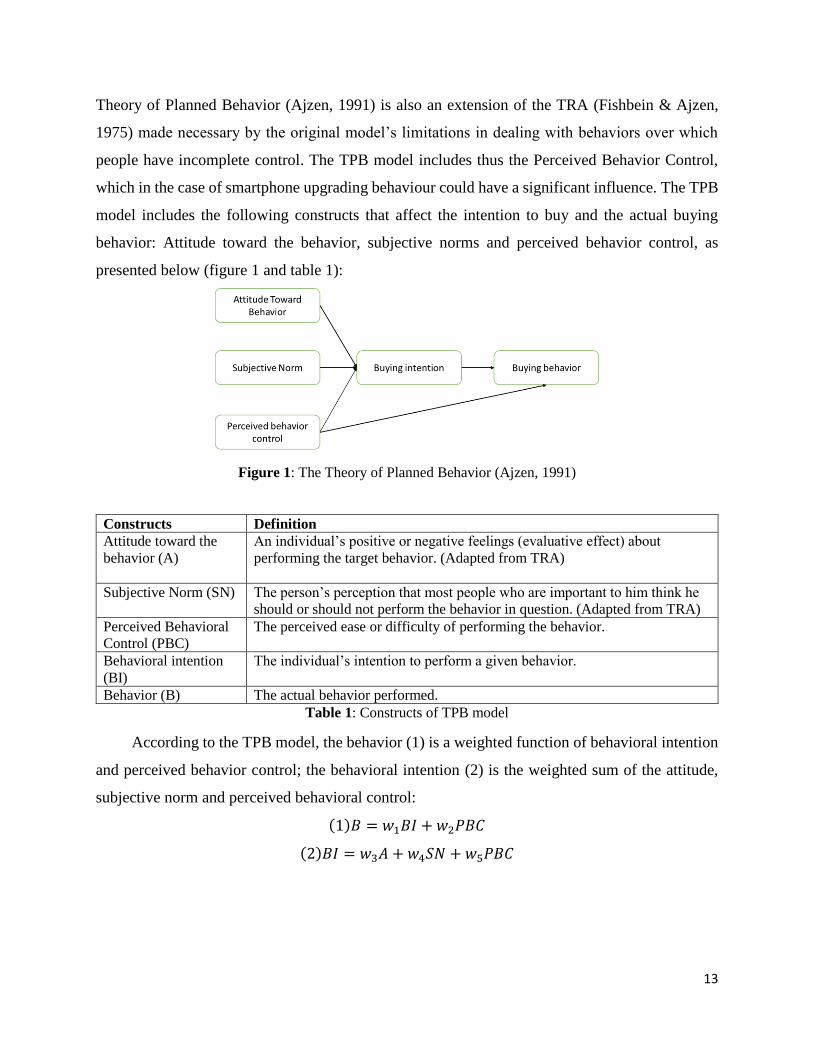
Theory of Planned Behavior (Ajzen, 1991) is also an extension of the TRA (Fishbein & Ajzen,
1975) made necessary by the original model’s limitations in dealing with behaviors over which
people have incomplete control. The TPB model includes thus the Perceived Behavior Control,
which in the case of smartphone upgrading behaviour could have a significant influence. The TPB
model includes the following constructs that affect the intention to buy and the actual buying
behavior: Attitude toward the behavior, subjective norms and perceived behavior control, as
presented below (figure 1 and table 1):
Figure 1: The Theory of Planned Behavior (Ajzen, 1991)
Constructs Definition
Attitude toward the
behavior (A)
An individual’s positive or negative feelings (evaluative effect) about
performing the target behavior. (Adapted from TRA)
Subjective Norm (SN) The person’s perception that most people who are important to him think he
should or should not perform the behavior in question. (Adapted from TRA)
Perceived Behavioral
Control (PBC)
The perceived ease or difficulty of performing the behavior.
Behavioral intention
(BI)
The individual’s intention to perform a given behavior.
Behavior (B) The actual behavior performed.
Table 1: Constructs of TPB model
According to the TPB model, the behavior (1) is a weighted function of behavioral intention
and perceived behavior control; the behavioral intention (2) is the weighted sum of the attitude,
subjective norm and perceived behavioral control:
(1)𝐵 = 𝑤1𝐵𝐼 + 𝑤2𝑃𝐵𝐶
(2)𝐵𝐼 = 𝑤3𝐴 + 𝑤4𝑆𝑁 + 𝑤5𝑃𝐵𝐶

14
Thus, by adopting the TPB model, we aim at providing a more complete and clearer
understanding of consumers’ upgrading behaviors. However, subjective norm is not the only way
to reflect symbolic values of selected products. Consumers also have the tendency to actively
express their self-image through acquiring and displaying material symbols (Gollwitzer et al., 1982;
Sirgy, 1982) and the product selected for self-expression also need to be conspicuously consumed
(Sirgy, 1982). In the next sub section, we present a brief literature review on this concept and relate
it to the TPB model in the context of smartphone upgrading behaviour.
2.3 SELF-CONCEPT
2.3.1 The construct of self-concept
Rosenberg (1986) argues that the term self-concept denotes the “totality of the individual’s
thoughts and feelings having reference to himself as an object.” Self-concept also refers to how a
person evaluate his or her own attributes (Solomon, Dahl, White, Zaichkowsky, & Polegato, 2014).
Traditionally, researchers have discussed self-concept as both a single variable and a construct of
multiple variables (Belch & Landon Jr, 1977; Bellenger et al., 1976). In the single variable vein of
self-concept, researchers treated it as the perception of the actual oneself or actual self-image
(Green et al., 1969; Grubb & Hupp, 1968). However, other investigators have argued that self-
concept has to be conceptualized as having two components, the actual self-image and the ideal
self-image. In this vein, the actual self-image is congruent with the one in the single variable self-
concept tradition, and the ideal self-image is defined as the image of oneself as one would like to
be (Belch, 1978; Belch & Landon Jr, 1977; Delozier & Tillman, 1972; Dolich, 1969). Solomon et
al. (2014) also point out that “the ideal self is a person’s conception of how he or she would like
to be, while the actual self: is our more realistic appraisal of the qualities we do and don’t have”.
Beyond this dual dimension of self-concept, a number of studies further indicate that the
formation of one’s self-concept is not only based on how one thinks of oneself, but also how other
people think of the person or the image that one believes other hold about himself, which is defined
as the social self-image (Burns, 1979; Kressmann et al., 2006). That is, the formation of our self-
concept is also significantly influenced by our social surroundings. Social self-image also refers
to the process of imaging the reactions and projecting impression of others toward us, also known
as the “looking glass self” (Cooley, 1992). However, the projected impression is not restricted to
15
the actual oneself, we also project impressions what we ideally would like others to hold, known
as the ideal social self-image (Sirgy, 1979). Thus, Sirgy (1979) and Sirgy and Samli (1985) finally
define self-concept with four components, actual self-image, ideal self-image, social self-image
and ideal social self-image.
Additionally, we tend to predict different impressions from different others, depending on
who we are predicting and the accuracy of our prediction (Schenk & Holman, 1980). This will
probably results in forming different social self-concept in different situations. As a result, we
always work hard to manage all the impressions we predicted from different others, in order to
ensure an overall positive impression in our social system (Goffman, 1978) and the most apparent
way of reaching that ideal impression is through the consumption of visible items (Heffetz, 2007).
2.3.2 Enhancing self-concept
Self-esteem refers to the degree of congruence among different self-images inside self-
concept (Sirgy, 1982). According to Onkvisit and Shaw (1987), the protection, maintenance and
enhancement of our self-concept is the basic purpose of all human activity. In other words, we
always need to compensate the discrepancies among different self-images in order to maintain or
enhance a positive self-esteem. Because people see their possessions as part of or an extension of
themselves (Secord, 1968), so one of the possible ways to maintain or enhance our self-concept is
through the consumption of certain goods (Bilkey & Tucker, 1968). However, as the formation of
self-concept is also influenced by our social surroundings (Burns, 1979), the discrepancies in our
self-concept not only exist between actual self and ideal self, but also between the social self and
ideal social self. That is, we tend to define ourselves based on what we consume and others’
impressions toward our choice of consumption (Belk et al., 1982). A positive self-esteem then can
be reached by consuming ideal products that are more close to the ideal self-image and creating
ideal impressions that are more close to the ideal social self-image.
An ideal impression can be reached through the consumption of certain products.
According to Gollwitzer et al. (1982), “people acquire and display material symbols to compensate
for perceived inadequacies in certain dimensions of their self-concept”. However, although
materials consist of all the products we consume, only a portion of product can be regarded as

16
material symbols. Products that can be conspicuously consumed and for which their brands can be
differentiated are more likely to be used as material symbols through consumers’ self-expression
behavior (Sirgy, 1982). Consumption of material symbols refers to the symbolic values of products.
According to Corneo (2009), the symbolic value is defined as the “personal characteristics that
decide the esteem individual received from other people as well as their self-esteem”. Symbolic
values perceived by consumers are also believed to have two aspects: the value of signalling to
others (display personal characteristics to obtain social prestige) and value of signalling to oneself
(display personal characteristics to enhance one’s self-concept)(Berthon, Pitt, Parent, & Berthon,
2009). Products that have a perceived association with some ideal personal characteristics then are
conspicuously consumed for their symbolic values (Heffetz, 2004).
2.3.3 Conspicuous consumption and status consumption
The term conspicuous consumption was first introduced by Veblen’s (1899) in the Theory
of the Leisure Class, defined as “the advertisement of income and wealth through lavish spending
on visible items”. Visible items refers to products that can be easily noticed during consumption
(Heffetz, 2011). The high portability of smartphones and the high volume of mobile software
provide consumers with the convenience to acquire daily information and entertainment
everywhere and thus making the use of smartphone highly noticeable and publically
distinguishable. In the discussion of conspicuous consumption, Veblen (2007) further points out
that a significant part of consumer behavior is driven by status-seeking competition and Marcoux,
Filiatrault, and Cheron (1997) also state that social status demonstration is an important dimension
of conspicuous consumption. Other researchers refer to the status aspects of conspicuous
consumption as status consumption , which is defined as “consumers strive to improve their social
standing through conspicuous consumption” (Goldsmith et al, 1996; p.310), a special case of
conspicuous consumption (Eastman, Goldsmith, & Flynn, 1999).
However, O'cass and Frost (2002) refer status consumption to the “process of gaining
status or social prestige from the acquisition and consumption of goods that the individual and
significant others perceived to be high in status”, O'Cass and McEwen (2004) further argue that
status consumption and conspicuous consumption are related but still separate constructs. The way
they distinguish status consumption from conspicuous consumption is through considering the

17
influence of consumers’ self-monitoring process. Gould (1993) defined self-monitoring as “the
degree to which an individual observes and controls their expressive behaviour and either
maintains or adapts self-presentation depending on certain social cues, triggering situationally
appropriate behaviour”.O'Cass and McEwen (2004) conclude that both status consumption and
conspicuous consumption are affected by interpersonal influence, but self-monitoring will only
have a significant positive effect on status consumption tendencies not on conspicuous
consumption; and status consumption will also have an impact on conspicuous consumption. Self-
monitoring is also a key part in the formation of one’s self-concept (Gould, 1993).
Sirgy et al. (2000) highlight the link between self-image and social status and argue that
such linkage may be activated by the consumption of a product having an image of high status. As
a result, such products often provide consumers the notion that “I am a high status person.” Then,
the purchase of certain products will probably contribute to the attainment of social status and then
making oneself feel better and closer to the ideal self (Elliott, 1994; Friese & Koenig, 1993). Thus,
an ideal (social) self-image sometimes also refers to a self-image with a higher social status in
one’s social system (Sirgy et al., 2000). In conclusion, our self-concept requires continuous
maintenance and enhancement, which can be realized through status consumption, as a result of
conspicuous consumption of symbolic values of visible items. In other words, consumers’
evaluation on symbolic values of certain products can also be interpreted as whether the product
will help in gaining social status or not.
3. THE PROPOSED RESEARCH MODEL
3.1 MODEL CONSTRUCTS
For all the considerations above, we build our research model based on the TPB model with
consideration of the possible moderating effect of status consumption. The main focus of this study
is on the upgrading intention. As premier smartphones are considered as public luxuries, which
are believed to be strongly influenced by brands (Bearden & Etzel, 1982), it’s possible that we will
also observe different levels in upgrading intention for different brands. The proposed research
model provides a unique extension to the TPB model, as to our knowledge no researchers have
included considerations on consumers’ desire for status consumption to the TPB model (Ajzen,
1991), especially in the context of upgrading technological products. Thus, this study will provide

18
new insight to the application of the TPB model in this specific context. The constructs of the
proposed research model are summarized in table 2:
Constructs Definition
Attitude toward the
behavior (A)
An individual’s positive or negative feelings (evaluative effect) about
performing the target behavior (Ajzen, 1991).
Subjective Norm (SN) The person’s perception that most people who are important to him think he
should or should not perform the behavior in question(Fishbein & Ajzen,
1975).
Perceived Behavioral
Control (PBC)
The perceived ease or difficulty of performing the behavior (Ajzen, 1991).
Behavioral intention
(BI)
The individual’s intention to perform a given behavior(Ajzen, 1991).
Status consumption The degree of gaining status or social prestige from the acquisition and
consumption of goods that the individual and significant others perceived to
be high in status (O'cass & Frost, 2002).
Table 2: Constructs of the research model
3.2 RESEARCH HYPOTHESES
According to Ajzen (1991), as a general rule, there are three kinds of considerations that
guide human action, and translate into the following influences: the more favorable the attitude
and subjective norms with respect to a behavior, and the greater the perceived behavioral control,
the stronger should be an individual’s intention to perform the behavior under consideration. In
the following sub sections, we consider the influence of the independent variables of our model on
the behavior intention in the context of smartphone upgrading behavior.
3.2.1 Attitude
Attitude has been proposed to influence behavioral intentions in the TPB model and the
TRA model Ajzen (1991). In the context of this research, we expect the individual’s favorable
evaluations of the upgrading behavior to positively influence the upgrading intention for
smartphones.
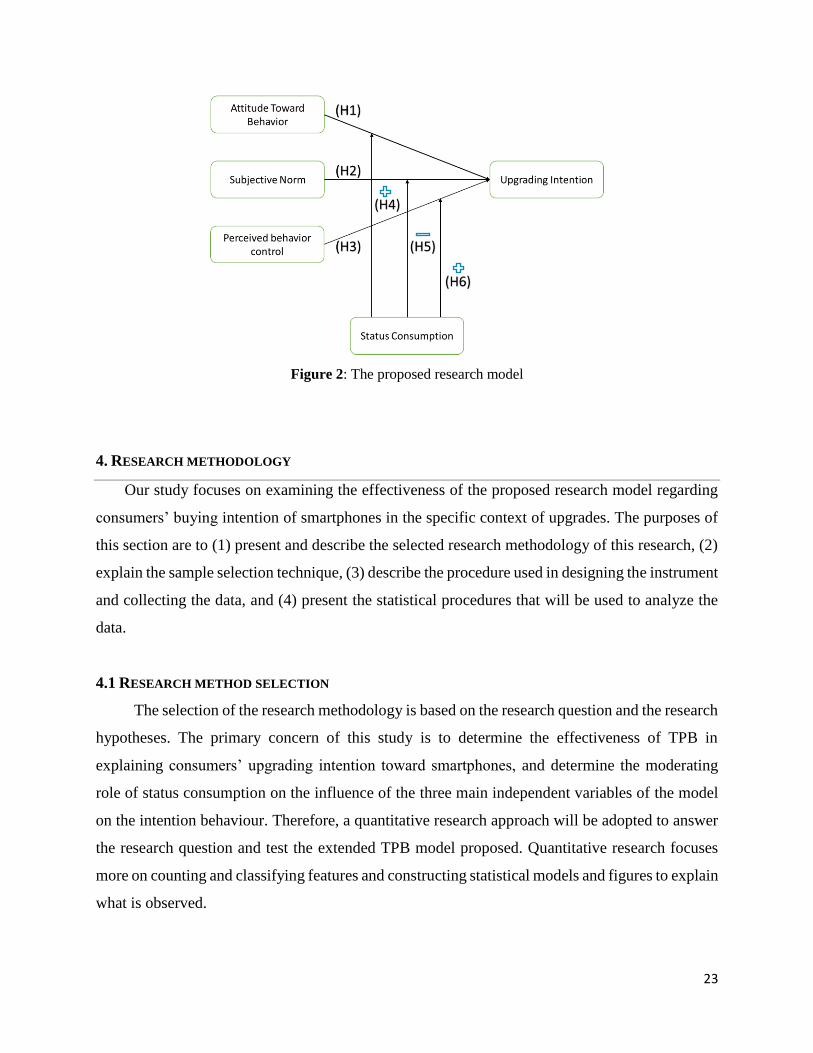
H1: Attitude toward smartphone upgrade will positively affect consumers’ intention to upgrade
smartphones.

19
3.2.2 Subjective norms
The Subjective norms refers to a consumer’s perception that most people who are important
to them think he/she should or should not adopt a specific behavior. Following the general rule of
the TPB model, and as expectations from others seem to play a role in the case of highly visible
product consumption such as smartphones, subjective norm related to upgrading a branded
smartphone is expected to positively influence the upgrading intention for smartphones.
H2: Subjective norm will positively affect consumers’ intention to upgrade smartphones.
3.2.3 Perceived behavioral control
The Perceived behavioral control is defined as the perceived ease or difficulty of buying a
considered product. In the case of smartphones, the ability as well as the degree of control an
individual might have on the upgrading behaviour can impact the intention to upgrade their
smartphone. Thus, it is expected that the greater the perceived behavior control toward buying a
smartphone, the stronger the buying intention for smartphones should be.
H3: Perceived behavior control will positively affect consumers’ intention to upgrade smartphones
3.3 THE MODERATING EFFECT OF STATUS CONSUMPTION
As stated earlier, we choose the TPB as the basic model to study consumers’ upgrading
behaviour for smartphones. Unlike previous studies dedicated to upgrade behaviour, the TPB
model allows to take into consideration social pressure (subjective norm) that we believe can
influence the upgrade behavior of highly visible products such as smartphones. Furthermore,
considering that status consumption has a role to play according to our literature review, we have
extended the TPB model and included status consumption in our proposed research model. , We
expect to observe potential moderating effects of status consumption on the effectiveness of TPB
in explaining consumers’ upgrading behaviour.
3.3.1 Status consumption and attitude
Consumers choose products through two types of congruence: the self-image congruence
and functional congruence. Self-image congruence refers to “the match between consumer’s self-
concept and the brand-user image, or product image of a given product and brand” (Sirgy et al.,
2000;p.127 ; Sirgy & Su, 2000; p.340), while functional congruence refers to the “match between
20
the perceived functional or performance characteristics and the consumer’s desired functional
characteristics” (Sirgy & Johar, 1999;p.365 ; Sirgy, Johar, Samli, & Claiborne, 1991;p.252)
Investigators have revealed that functional congruence can be biased by self-image congruence
(Mangleburg et al., 1998; Sirgy, Johar, Samli, & Claiborne, 1991), because symbolic attributes of
products and brands are easier to process than the functional features, which may require more
related knowledge (Sirgy & Johar, 1999). As a result, consumers are more likely to evaluate the
symbolic aspects of brands and products first followed by the functional aspects (Sirgy et al., 1991).
Consumers’ evaluation of symbolic aspects through self-image congruence is more likely to form
an initial favorable or unfavorable attitude toward the brand and products, then bias the process of
evaluating the performance aspects of brands and products (Kang, Hong, & Lee, 2009).
Consequently, products with higher symbolic attributes are more likely to be evaluated more on
their symbolic attributes than on their functional attributes. Consumer may evaluate the symbolic
values of certain product through the process of status consumption, so products with an image of
high status may also bias consumers’ evaluation on the functional aspects of them.
As we mentioned at the very beginning in this research proposal, Apple sold only 20% of
smartphones in their first quarter of 2015 and even a smaller portion belong to the expensive latest
version of iPhone (iPhone 6). That means, a new iPhone is not commonly owned and can be
publically distinguished (conspicuously consumed), due to its unique design and common
characteristics of smartphones. Consumers may then perceive owning an expensive new iPhone
as something with symbolic values or high status. The essential way to continually own a new
iPhone is through continual upgrading purchases. Thus, a new iPhone is more likely to be
evaluated and upgraded largely based on its symbolic (status) attributes and a consumer may form
an initial favorable attitude toward it even before evaluating its functional attributes. Therefore,
we expect a possible moderating effect of status consumption on the relationship between
consumers’ attitude and their upgrading intention for smartphones. In other words, for consumers
who perceive higher potential status, a positive attitude toward upgrading their smartphone will
have a stronger effect on and their intention toward upgrading.
H4: Status consumption will positively moderate the relationship between attitude toward upgrade
and intention to upgrade smartphones.
21
3.3.2 Status consumption and subjective norm
Subjective norm refers to the influences consumers receive from significant others.
Bearden and Etzel (1982) defined this kind of influence as the reference group influence and
proposed the well-accepted “publicly vs. privately” and “necessity vs. luxury” product
categorization. According to Bearden and Etzel (1982; p.183-194), private necessities refer to“-
products consumed out of public view and owned by everyone, which is largely governed by
product attributes” such as an ordinary refrigerator. Product attributes contribute to the functional
values of products. However, products that are commonly owned can hardly become something
ideal and products that are out of public view won’t have any social influences. Private luxuries
refer to “product consumed out of public and not commonly owned, which is more of a matter of
individual choice”, such as an expensive and highly advanced TV. Besides the functional and
symbolic values, luxury products or brands are also believed to have experiential values, which
address individuals’ unique perceptions of playfulness, aesthetics and experience that products or
brands provide them (Bourdieu, 1984). Consumers may choose products from this category as a
result of unique taste. However, as products from this category are still consumed out of public
view, consumers won’t be able to display personal characteristics related to symbolic values. As a
result, private luxuries may be consumed for both their functional and experiential values.
Public necessities refer to “product consumed publically and virtually owned by everyone”,
such as a reasonably priced car, Similar to private necessities, the product owned and used by
everyone is not something ideal. But as this kind of necessities can be publically distinguished,
consumers may also rely on this kind of products to display some personal characteristics. As a
result, public necessities may be consumed for both functional values and symbolic values. The
focus of this study is actually on public luxuries, which refers to “products consumed in public
view and not commonly owned and used”, such as a luxury car or a premium smartphone. Products
from this latter category are publically distinguishable. Public luxuries include product categories
that have the potential to realize both functional values and symbolic values. Additionally, public
luxuries also include the only product categories for which consumers may be subject to both
strong product and strong brand influences on their choices (Bearden & Etzel, 1982). Premium
smartphones, like iPhones, are more likely to fit in this category, due its high price and relative
higher product visibility.

22
Subjective norms and status consumption actually describe two opposite direction for
consumers in gaining symbolic values from certain products. Status consumption describes a
process of one’s active intention to subjectively impress his social surroundings by owing and
displaying something with higher status, as a result of status-seeking competition (O'Cass &
McEwen, 2004). In contrast, subjective norms describes a reversed process: consumers’ intention
are influenced by their social surroundings, as a result of confirming expectations of significant
others. Thus, we suspect that consumers’ desire of status consumption, as a moderating variable,
will diminish the effect of subjective norm on their upgrade intention.
H5: Status consumption will negatively moderate the relationship between subject norm and
intention to upgrade smartphones.
3.3.3 Status consumption and perceived behavioral control
Perceived behavioral control refers to buying convenience, switching cost and other ease
or difficulty toward upgrading to enhanced products. Perceived behavioral control is perceived to
be stronger in the condition of higher convenience, low cost and other eases. However, when
products are perceived to have both functional values and symbolic values, consumers may also
tend to overcome more difficulties in reaching such desired products. For example, although a new
iPhone is much more expensive than the majority of smartphones in the market, sometimes even
with limited quantities right after the launch day, numerous “Apple Fans” were still waiting in
lines in front of an Apple store for hours or even days, just in order to have the new iPhone as early
as possible. This is probably because they perceived more symbolic values in having such an ideal
product. Thus, we also suspect a moderating effect of status consumption on the relationship
between perceived behavioral control and the upgrading intention. The proposed research model
and corresponding hypotheses are shown as below (figure 2):
H6: Status consumption will positively moderate the relationship between perceived behavioral
control and intention to upgrade smartphones.
23
Figure 2: The proposed research model
4. RESEARCH METHODOLOGY
Our study focuses on examining the effectiveness of the proposed research model regarding
consumers’ buying intention of smartphones in the specific context of upgrades. The purposes of
this section are to (1) present and describe the selected research methodology of this research, (2)
explain the sample selection technique, (3) describe the procedure used in designing the instrument
and collecting the data, and (4) present the statistical procedures that will be used to analyze the
data.
4.1 RESEARCH METHOD SELECTION
The selection of the research methodology is based on the research question and the research
hypotheses. The primary concern of this study is to determine the effectiveness of TPB in
explaining consumers’ upgrading intention toward smartphones, and determine the moderating
role of status consumption on the influence of the three main independent variables of the model
on the intention behaviour. Therefore, a quantitative research approach will be adopted to answer
the research question and test the extended TPB model proposed. Quantitative research focuses
more on counting and classifying features and constructing statistical models and figures to explain
what is observed.

24
4.2 DATA COLLECTION
4.2.1 Participants
In a February 2013 survey, 74% of Ball State college students reported using a smartphone
versus 27% in 2009 (Hanley, 2013) and overall smartphone usage is still growing since then
(Lunden, 2014). College students can be regarded as a good convenience sample for this study, as
the majority of college students are smartphone users and they often have limited resources but
are still the ones looking to possess newer smartphones. Additionally, although many products are
globally available nowadays, this doesn’t necessarily means that consumers from different cultures
bought them for the same reasons or use them to serve the same social functions (Wong & Ahuvia,
1998). Researchers also claim that people from different cultures can also be distinguished through
their variation of self-concept concentrations (Markus & Kitayama, 1991).
Researchers have divided different self-images into two groups: the inner self (actual self-
image and ideal self-image) and the outer self (social self-image and ideal social self-image)
(Markus, Cross, & Wurf, 1990); and suggested that people from Eastern and Western cultures have
different concentrations on either the inner self or the outer self (Markus & Kitayama, 1991). In
Western societies, people have a rooted belief that individuals are inherently separate, so it’s the
inner self that significantly governs people’s behavior, whereas people from Eastern cultures
concentrate more on their relationships with significant others, which is the result of concentration
on the outer self.
Hofstede (2001) also concludes that individualism is dominant among Western cultures,
while Eastern culture is dominated by collectivism. In other words, people from Western cultures
may be concerned more about their actual self-image and ideal self-image, while people from
Eastern cultures may pay more attention to their social self-image and ideal social self-image. The
products we focus on in this study are premier smartphones, which are more likely to be consumed
as public luxuries and associated with a more positive social self-image for consumers. As a result,
we believe that smartphones maybe perceived as having more symbolic values in Eastern cultures
than in Western cultures. This point is also supported by Wong and Ahuvia (1998) who suggest
that Asian consumers, relative to Westerners, would place more importance on the symbolic
values of certain products. By testing the proposed research model with participants from an

25
Eastern culture, we expect to be able to highlight the relationships among the constructs of the
proposed model, especially the moderating effect of status consumption. Among different Eastern
countries, the Chinese culture has been widely accepted as an extreme of Eastern culture. (Ralston,
Gustafson, Elsass, Cheung, & Terpstra, 1992). Thus, we finally choose to test the proposed
research model in a Chinese university, where Chinese college students will be recruited as the
primary subjects for data collection.
4.2.2 Data collection
For this study, a survey was administered to a selected sample of smartphone users. A
survey is designed to collect data from a specific population or a sample of that population using
a questionnaire or an interview (Robson, 1993). Sample surveys serve as an important tool for
collecting and analyzing information from selected individuals and are widely accepted as a key
tool for conducting and applying basic social science research methodology (Rossi, Wright, &
Anderson, 2013). Marketing researchers also use surveys to study consumer preference and
shopping patterns (Baumeister & Leary, 1995).
Questionnaires and interviews are two major survey instruments, the choice between
questionnaire and interview depends on the types of research and data needed to be collected.
According to Ackroyd (1992), using a questionnaire rather than an interview method provides
several distinct advantages: large amounts of information can be collected from a large number of
people in a short period of time and in a relatively cost effective way; questionnaires can be carried
out by the researcher or by any number of people with limited effect on its validity and reliability;
the results of the questionnaires can usually be quickly and easily quantified by either a researcher
or through the use of a software package
For this study, smartphone users are the target population and the number of smartphone
users worldwide will surpass 2 billion in 2016, according to the eMarketer (2015). This large target
population needs to be represented with a relatively large sample, so using a questionnaire survey
is more plausible and affordable than conducting numerous interviews. Moreover, as we are going
to test empirically a model that has already been defined, a quantitative method and a questionnaire
as data collection tool are well suited for this purpose. For these reasons, a questionnaire survey
26
instrument will be adopted to assess the relationships between status consumption, together with
the other TPB-based constructs, and the upgrading intention of smartphones. The data collection
process has been approved by the Social Science and Humanities Research Ethical Board of
University of Ottawa in August 2016 and the official letter of ethical approval is attached in the
appendix.
4.2.3 Questionnaire/Measure development
According to Ajzen (2002), any behavior could be defined arbitrarily in terms of target,
action, context and time (TACT) elements. In the case of our study, smartphones could be
considered as the target and upgrading could be considered as the action. The context refers to
where the action would be happening. Ajzen (2002) argues that “Looking at behavior on only a
single occasion is usually too restrictive to be of much practical value”. For our study, consumers
may either upgrade their smartphones in a retail store or order new devices online, so we don’t
specify a particular context of upgrading smartphones for this study. Finally, the time element
could be considered as “in the near future” or “within a year”, because, as we mentioned at the
very beginning, the release interval between two generations of smartphones from major brands
has been approximately of one year since 2010. Ajzen (2002) also indicated that the time element
should be defined of a more general level in order to obtain enough measurements. Considering
the TACT elements, we may define the behavior of interest as “Upgrading smartphones in the near
future.”
Ajzen (2002) suggested using standard scaling procedures in assessing the predicted
variables of TPB model and the scales much to be associated with defined TACT elements.
However, in the formative stage of the final questionnaire, a pilot study is also suggested by Ajzen
(2002) in order to secure reliable and internally consistent measures. That is ,we will adopt the
items that were directly suggested by Ajzen (2002) and some other items that have been used in
previous TPB based studies for attitude, subjective norms, perceived behavioral control and
behavioral intention. Those items then will be associated with the TACT elements we defined for
this particular study. After that, those items will be tested in a pilot study with a relatively small
sample and items with high internal consistency will be selected for the final questionnaire. Ajzen
(2002) also suggested that different items assessing a given construct should be presented in non-
27
systematic order in the final questionnaire. Similar process will also be performed for scales
measuring status consumption to ensure the internal consistency. The initial items for status
consumption are adopted from Eastman et al. (1999). The initial questionnaire items are
summarized in an appendix (provided separately). Data collection will be conducted using an
online questionnaire instrument (Qualtrics). The complete questionnaire is attached in the
appendix.
4.2.4 Sample size estimation
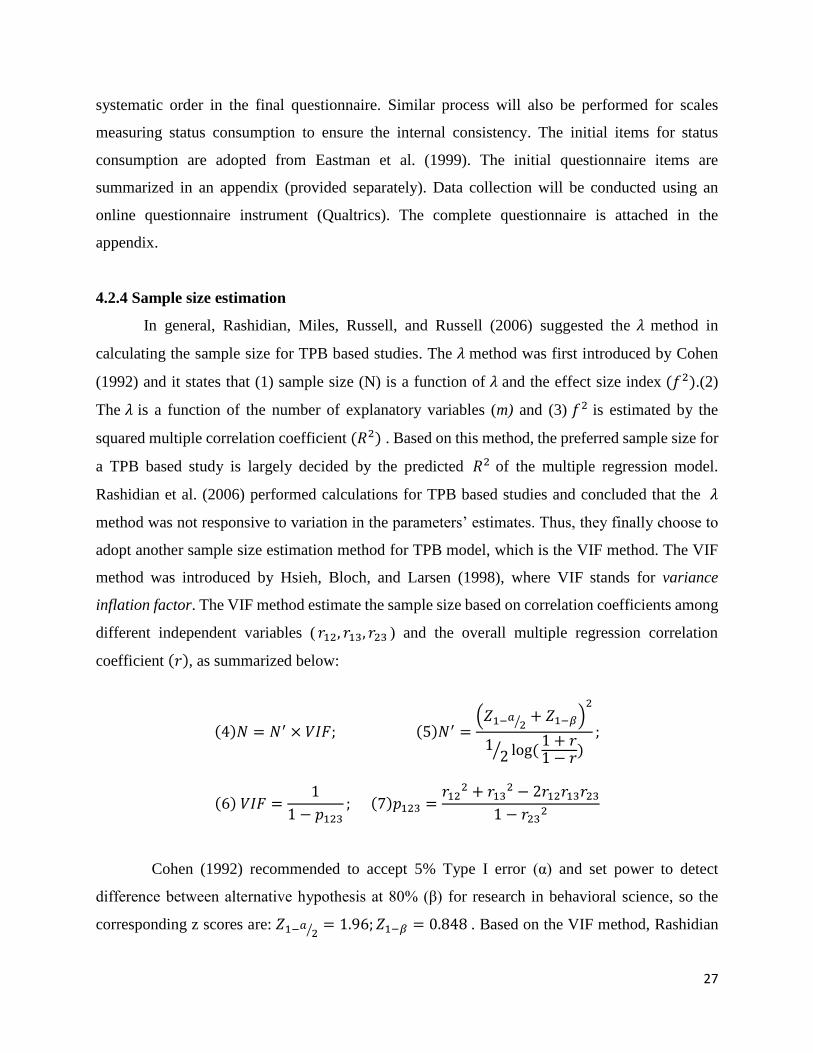
In general, Rashidian, Miles, Russell, and Russell (2006) suggested the 𝜆 method in
calculating the sample size for TPB based studies. The 𝜆 method was first introduced by Cohen
(1992) and it states that (1) sample size (N) is a function of 𝜆 and the effect size index (𝑓2).(2)
The 𝜆 is a function of the number of explanatory variables (m) and (3) 𝑓2 is estimated by the
squared multiple correlation coefficient (𝑅2) . Based on this method, the preferred sample size for
a TPB based study is largely decided by the predicted 𝑅2 of the multiple regression model.
Rashidian et al. (2006) performed calculations for TPB based studies and concluded that the 𝜆
method was not responsive to variation in the parameters’ estimates. Thus, they finally choose to
adopt another sample size estimation method for TPB model, which is the VIF method. The VIF
method was introduced by Hsieh, Bloch, and Larsen (1998), where VIF stands for variance
inflation factor. The VIF method estimate the sample size based on correlation coefficients among
different independent variables ( 𝑟12, 𝑟13, 𝑟23 ) and the overall multiple regression correlation
coefficient (𝑟), as summarized below:
(4)𝑁 = 𝑁′ × 𝑉𝐼𝐹; (5)𝑁′ =(𝑍1−𝑎
2⁄ + 𝑍1−𝛽)2
12⁄ log (
1 + 𝑟1 − 𝑟)
;
(6) 𝑉𝐼𝐹 =1
1 − 𝑝123; (7)𝑝123 =
𝑟122 + 𝑟13
2 − 2𝑟12𝑟13𝑟23
1 − 𝑟232
Cohen (1992) recommended to accept 5% Type I error (α) and set power to detect
difference between alternative hypothesis at 80% (β) for research in behavioral science, so the
corresponding z scores are: 𝑍1−𝑎2⁄ = 1.96; 𝑍1−𝛽 = 0.848 . Based on the VIF method, Rashidian
28
et al. (2006) suggested a basic sample size of 142 for TPB studies without considering inter cluster
influences and response rate. The sample size can also be determined based on one of the following
rules of thumb: (1) a minimum ratio of observations to variable of 5:1, but a preferred ratio of 15;1
or 20:1 (Hair et al., 2005), and (2) multiplying the number of items (25) by 10 (Joreskog and
Sorbom, 1982). Thus, considering the presented methods, we propose an appropriate sample size
to be ranging from 200 to 300 respondents.
5. RESULTS
In this section, we will first present (1) basic information of the respondents recruited for
this study; followed by (2) the validation process for adopted measures, finally (3) we will present
the results of hypothesis testing, including the results of basic regression analysis and moderated
regression analysis.
5.1 PROFILE OF RESPONDENTS
The online survey instrument (Qualtrics) was administered to randomly selected
smartphone users among students from a recognized Chinese University, the Jilin University in
northeast China. Invitation messages were sent to selected students though a popular mobile chat
app in China (WeChat), explaining the purpose of the study and requesting their participation.
Students were also encouraged to share the invitation with their family members who also use
smartphones and this gave more diversity in age ranges of the respondents. When students
(respondents) scanned the QR code provided in the message, they were directed to the online
survey instrument. Other students were invited to the survey during their breaks in regular class
hours, with the same QR code displayed in front of the class. A total of 263 responses were
received and 203 of all the responses were fully completed ones; the survey completion rate was
approximately 77%. Besides the questions regarding the demographic information of
respondents, questions that specially related to the use of smartphones were also administered to
the respondents, including smartphone usage, brands and upgrading choices. Table 3 shows both
the demographic and smartphone usage related information of respondents.
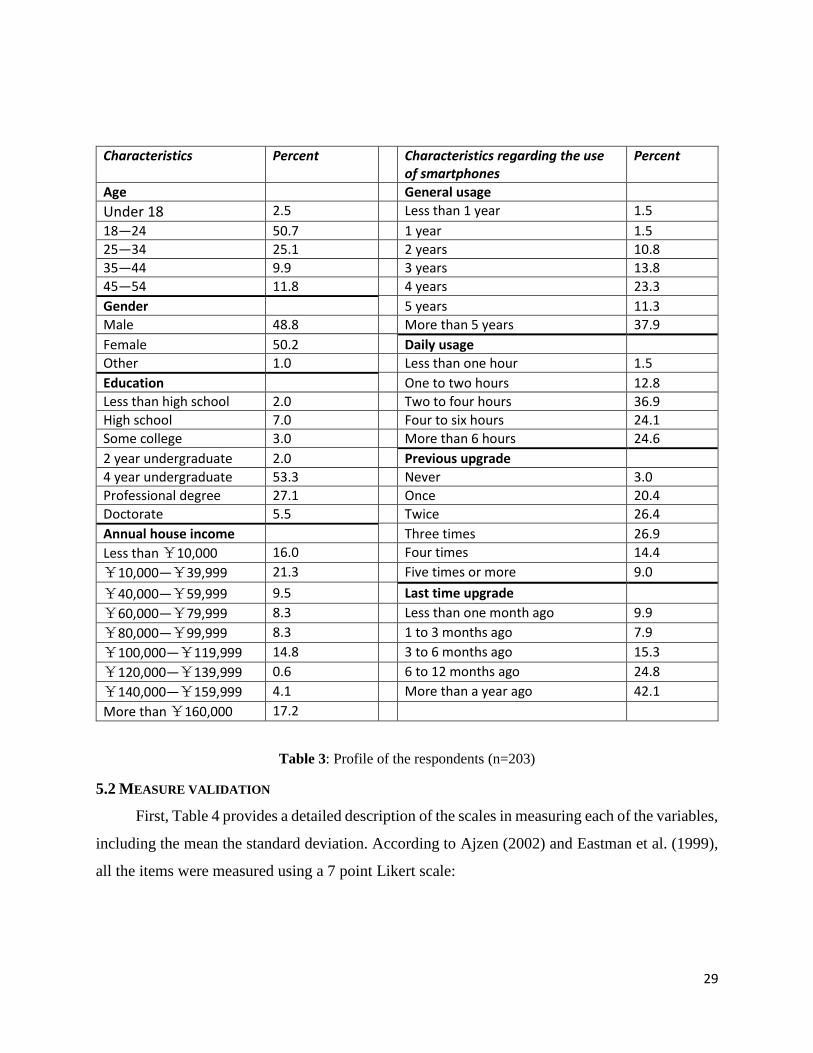
29
Characteristics Percent Characteristics regarding the use of smartphones
Percent
Age General usage
Under 18 2.5 Less than 1 year 1.5
18—24 50.7 1 year 1.5
25—34 25.1 2 years 10.8
35—44 9.9 3 years 13.8
45—54 11.8 4 years 23.3
Gender 5 years 11.3
Male 48.8 More than 5 years 37.9
Female 50.2 Daily usage
Other 1.0 Less than one hour 1.5
Education One to two hours 12.8
Less than high school 2.0 Two to four hours 36.9
High school 7.0 Four to six hours 24.1
Some college 3.0 More than 6 hours 24.6
2 year undergraduate 2.0 Previous upgrade
4 year undergraduate 53.3 Never 3.0
Professional degree 27.1 Once 20.4
Doctorate 5.5 Twice 26.4
Annual house income Three times 26.9
Less than ¥10,000 16.0 Four times 14.4
¥10,000—¥39,999 21.3 Five times or more 9.0
¥40,000—¥59,999 9.5 Last time upgrade
¥60,000—¥79,999 8.3 Less than one month ago 9.9
¥80,000—¥99,999 8.3 1 to 3 months ago 7.9
¥100,000—¥119,999 14.8 3 to 6 months ago 15.3
¥120,000—¥139,999 0.6 6 to 12 months ago 24.8
¥140,000—¥159,999 4.1 More than a year ago 42.1
More than ¥160,000 17.2
Table 3: Profile of the respondents (n=203)
5.2 MEASURE VALIDATION
First, Table 4 provides a detailed description of the scales in measuring each of the variables,
including the mean the standard deviation. According to Ajzen (2002) and Eastman et al. (1999),
all the items were measured using a 7 point Likert scale:

30
Variables Measure (7 point scale)
Mean Standard Deviation
Upgrading intention UI-1 5.17 1.672
UI-2 4.70 1.698
UI-3 5.01 1.626
Attitude AI-1 4.92 1.756
AI-2 4.88 1.766
AI-3 5.20 1.763
AI-4 5.20 1.761
AI-5 5.28 1.699
Subjective Norm SN-1 4.19 1.594
SN-2 4.25 1.548
SN-3 4.20 1.541
SN-4 4.50 1.514
SN-5 5.02 1.396
PBC PBC-1 5.19 1.512
PBC-2 5.14 1.524
PBC-3 5.28 1.408
PBC-4 5.56 1.411
PBC-5 5.21 1.537
PBC-6 4.18 1.732
Status Consumption SC-1 4.02 1.688
SC-2 4.19 1.634
SC-3 4.19 1.693
SC-4 3.55 1.522
SC-5 4.28 1.577
Table 4: Operational definition of variables
Measure validation was firstly examined for reliability by computing Cronbach’s alpha
coefficient for each construct. As shown in table 5, the Cronbach’s alpha coefficients for all the
variables are above the recommended 0.7 levels. We also conducted a confirmatory factor analysis
using SPSS to assess convergent and discriminant validity of the measurement. The results showed
that, except for one of the measures of status consumption (SI-4 with a factor loading of only
0.277 ), all the other items loaded significantly on the related constructs, with factor loadings

31
ranging from 0.597 to 0.933 and all significant at level p<0.001. Thus, the SI-4 was removed from
the measures of status consumption and the Cronbach’s alpha has improved from 0.765 to 0.869.
This high Cronbach’s alpha provides the evidence supporting the convergent validity of each
construct. Additionally, the factor correlation matrix showed, in table 6, that all the constructs are
significantly distinct from other constructs (p<0.01 or p<0.001) and then supported the
discriminant validity of the measurement.
Variables Measures Standard Loadings
Cronbach's alpha
Mean Standard deviation
Upgrading intention UI-1 0.876 0.875 4.96 1.490
UI-2 0.926
UI-3 0.881
Attitude AI-1 0.687 0.932 5.09 1.511
AI-2 0.713
AI-3 0.804
AI-4 0.871
AI-5 0.870
Subjective Norm SN-1 0.884 0.876 4.43 1.187
SN-2 0.920
SN-3 0.899
SN-4 0.747
SN-5 0.630
PBC PBC-1 0.842 0.879 5.09 1.193
PBC-2 0.912
PBC-3 0.904
PBC-4 0.763
PBC-5 0.711
PBC-6 0.597
Status Consumption SC-1 0.873 0.765 4.04 1.188
SC-2 0.882
SC-3 0.878
SC-4 0.227
SC-5 0.720
Table 5: Factor loadings and reliability tests

32
UI AI SN PBC SC
UI 1.000
AI 0.317*** 1.000
SN 0.484*** 0.274*** 1.000
PBC 0.550*** 0.344*** 0.445*** 1.000
SC 0.277*** 0.137** 0.427*** 0.340*** 1.000
*p<0.05, **p<0.01, ***p<0.001
Table 6: Correlation matrix
5.3 HYPOTHESIS TESTING
In order to test the proposed hypotheses, regression analysis was adopted for the statistical
analysis of the data collected by questionnaires, as this study focuses on examining the
relationships among different constructs (variables). Regression analysis includes techniques for
modeling and analyzing several variables with the focus on the relationship between a dependent
variable and one or more independent variables. In our research context, the dependent variable
stands for the upgrading intention for smartphones, and the independent variables represent
attitude towards behavior, subjective norms, and perceived behavior control. The proposed
research model was tested in two stages. First, we conducted multiple regression analysis on the
basic TPB model, and the results are summarized in figure 3.

33
Figure 3: Results of hypothesis tests
Results show strong support for H2 and H3, that the upgrading intention was positively related to
subjective norm and perceived behavioral control. However, we only found a mild relationship
between attitude toward upgrading and upgrading intention. Although H1 was also supported, the
impact of attitude on the upgrading intention is much weaker than the impact of subjective norm
and perceived behavioral control. This means that consumers who have a higher intention to
upgrade are only slightly different from the ones who don’t have such intention in terms of attitude
toward upgrading their smartphones. The second stage of the regression analysis includes the
possible moderating effect of status consumption.
Baron and Kenny (1986) defined moderator variables as “third variables that partition a focal
independent variable into subgroups that establish its domains of maximal effectiveness in regard
to a given dependent variable”. According to these definitions, the moderating effect of status
consumption will be tested using analysis of variance (ANOVA), because a moderate effect can
be represented as an interaction between an independent variable and a factor that specify the
conditions for its operation. In order to test the moderating effect of status consumption, the
traditional test for moderators was conducted, as shown in table 7. We compared the simple
regression model with three independent variables versus the moderated regression model that
additionally included the interaction of these variables with status consumption. To determine a
possible moderator effect, we need to test whether these interaction term are statistically significant.
If the interaction terms are statistically significant, then a moderator effect will be supported. In
table 6, however, none of the interaction terms is statistically significant, which means that we did
not find a meaningful moderating effect of status consumption to the basic TPB model. In other
words, status consumption doesn’t significantly strengthen or weaken any relationships between
the three independent variables and the upgrade intention.
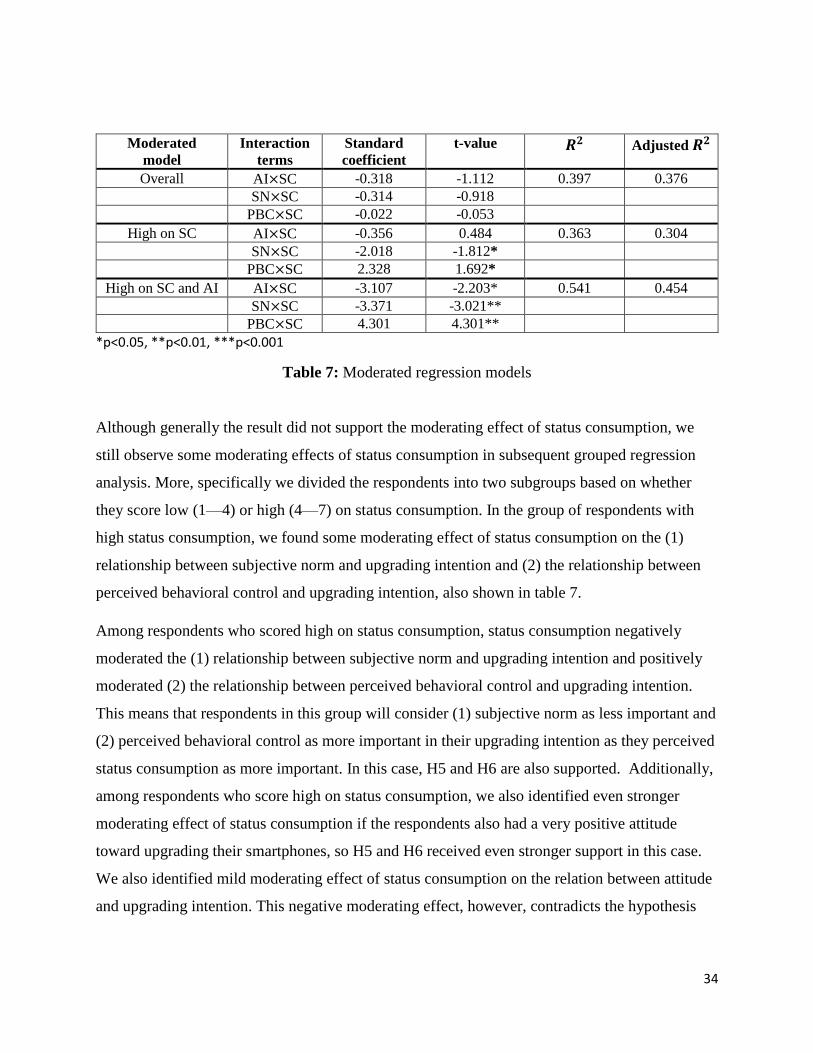
34
Moderated
model
Interaction
terms
Standard
coefficient
t-value 𝑹𝟐 Adjusted 𝑹𝟐
Overall AI×SC -0.318 -1.112 0.397 0.376
SN×SC -0.314 -0.918
PBC×SC -0.022 -0.053
High on SC AI×SC -0.356 0.484 0.363 0.304
SN×SC -2.018 -1.812*
PBC×SC 2.328 1.692*
High on SC and AI AI×SC -3.107 -2.203* 0.541 0.454
SN×SC -3.371 -3.021**
PBC×SC 4.301 4.301**
*p<0.05, **p<0.01, ***p<0.001
Table 7: Moderated regression models
Although generally the result did not support the moderating effect of status consumption, we
still observe some moderating effects of status consumption in subsequent grouped regression
analysis. More, specifically we divided the respondents into two subgroups based on whether
they score low (1—4) or high (4—7) on status consumption. In the group of respondents with
high status consumption, we found some moderating effect of status consumption on the (1)
relationship between subjective norm and upgrading intention and (2) the relationship between
perceived behavioral control and upgrading intention, also shown in table 7.
Among respondents who scored high on status consumption, status consumption negatively
moderated the (1) relationship between subjective norm and upgrading intention and positively
moderated (2) the relationship between perceived behavioral control and upgrading intention.
This means that respondents in this group will consider (1) subjective norm as less important and
(2) perceived behavioral control as more important in their upgrading intention as they perceived
status consumption as more important. In this case, H5 and H6 are also supported. Additionally,
among respondents who score high on status consumption, we also identified even stronger
moderating effect of status consumption if the respondents also had a very positive attitude
toward upgrading their smartphones, so H5 and H6 received even stronger support in this case.
We also identified mild moderating effect of status consumption on the relation between attitude
and upgrading intention. This negative moderating effect, however, contradicts the hypothesis
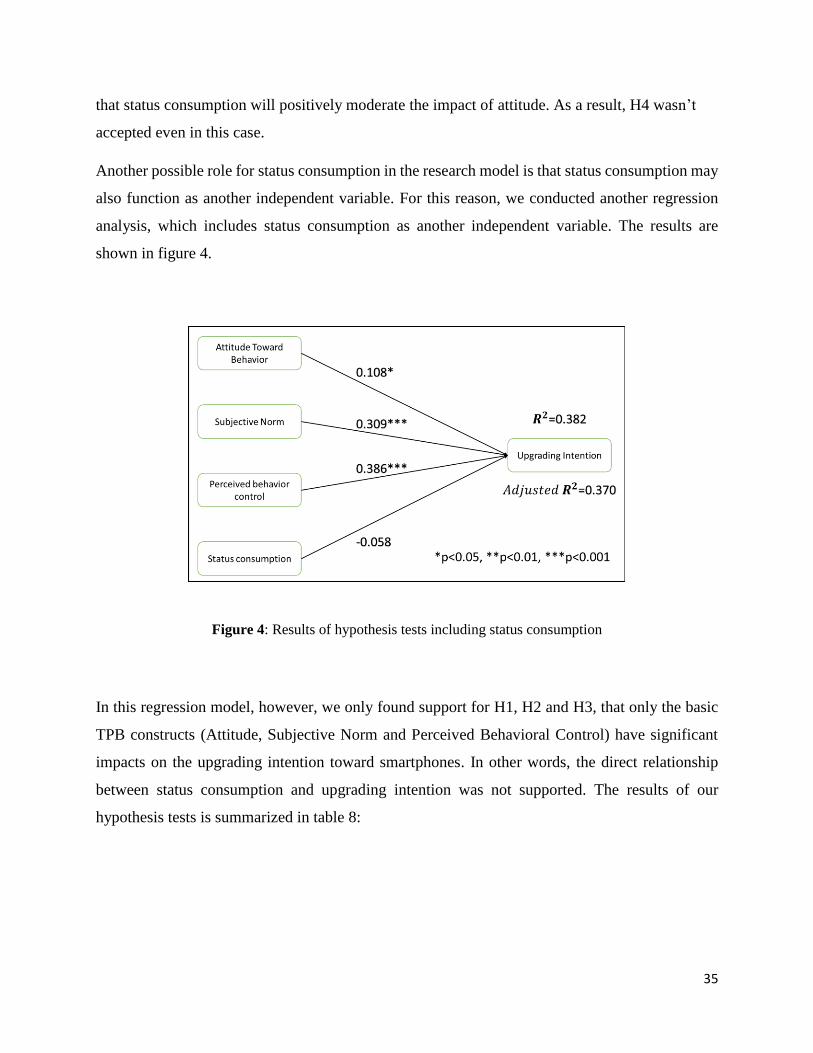
35
that status consumption will positively moderate the impact of attitude. As a result, H4 wasn’t
accepted even in this case.
Another possible role for status consumption in the research model is that status consumption may
also function as another independent variable. For this reason, we conducted another regression
analysis, which includes status consumption as another independent variable. The results are
shown in figure 4.
Figure 4: Results of hypothesis tests including status consumption
In this regression model, however, we only found support for H1, H2 and H3, that only the basic
TPB constructs (Attitude, Subjective Norm and Perceived Behavioral Control) have significant
impacts on the upgrading intention toward smartphones. In other words, the direct relationship
between status consumption and upgrading intention was not supported. The results of our
hypothesis tests is summarized in table 8:

36
Relationships Estimate Results
H1: Attitude Intention 0.109* Accepted H2: Subjective Norm Intention 0.289*** Accepted H3: Perceived Behavioral Control Intention 0.374*** Accepted H4: Status Consumption Not accepted Attitude—Intention H5: Status consumption Partially accepted Subjective Norm—Intention H6: Status consumption Partially accepted Perceived Behavioral Control—Intention
Table 8: Summary of hypothesis tests
5.4 VARIATIONS ACROSS BRANDS
The survey also revealed respondents’ choices of smartphone brands in use and for future
upgrading. Consumers may also choose different brands for different reasons, so the model testing
results may also vary according to brands choices. For this reason, we selected the three leading
brands (Apple, Samsung and Huawei) from all the brands included in the questionnaire and then
divided the respondents into different subgroups according to their brand choices. The percentage
of respondents’ brand use and upgrading intention are summarized as below (table 9):
Brands Current in use (percent) Future upgrading intention (percent)
Apple 39.9 61.1
Samsung 8.4 21.7
LG 0.5 2.0
Huawei 15.3 48.3
One plus 1.5 1.5
Xiaomi 7.9 10.8
Lenovo 0.5 0.5
Others 26.1 10.8
Table 9: Smartphone brand choices

37
As the focus of this study is on consumers’ upgrading intentions, the future upgrading choices of
respondents on the three brands is considered as grouping parameters. The table above revealed
that 61.1% of respondents chose Apple as their future upgrading choice, 21.7% for Samsung and
48.3% for Huawei. The means and standard deviations of the model constructs according to the
three leading brands are summarized in table 10.
Brands AI SN PCB SC UI
Mean(SD) Mean(SD) Mean(SD) Mean(SD) Mean(SD)
Apple 5.2919(1.4922) 4.3710(1.2888) 5.2406(1.1127) 4.2198(1.3568) 5.5105(1.4880)
Samsung 4.9727(1.5763) 4.4455(1.1819) 5.0909(1.1295) 4.3807(1.2546) 4,9394(1.4998)
Huawei 4.8796(1.5978) 4.6163(1.2053) 5.3095(1.0191) 4.2092(1.3483) 5.0646(1.4467)
Table 10: Means and SDs of branded model constructs
First of all, we tested the basic TPB model for the three brands and the results and supported the
impact of attitude, subjective norm and perceived behavioral control varied according to brands,
as shown in table 11.
Regression
model
Variable Standard
coefficient
t-value 𝑹𝟐 Adjusted 𝑹𝟐
Apple AI 0.107 1.372 0.376 0.360
SN 0.343 4.363***
PBC 0.345 4.353***
Samsung AI -0.093 -0.628 0.278 0.224
SN 0.312 1.921*
PBC 0.333 2.149*
Huawei AI 0.021 0.239 0.408 0.389
SN 0.402 4.179***
PBC 0.318 3.365***
*p<0.05, **p<0.01, ***p<0.001
Table 11: Summary of regression analysis according to brands
The result above revealed that subjective norm and perceived behavioral control are still
the two major influences on upgrading intention, but their impacts are much stronger for Apple
and Huawei than for Samsung. Interestingly, subjective norm has stronger effects on upgrade
intention for Huawei than for Apple. However, in the test of the moderating effect of status
consumption, we didn’t observe any strong impact of status consumption, as a moderator or even
38
as another independent variable. This result is contrary to our expectations, especially for Apple,
because we thought people may still reveal more status concerns for symbolic and expensive
products, such as the iPhone. The reason for this discrepancy will be discussed later in the next
section.
6. DISCUSSION
6.1 FINDINGS
The findings of this study are partly in accordance with our expectations. For the basic
TPB model, as hypothesized, all the three major constructs had positive influences on the
upgrading intention for smartphones. However, the impact of attitude was much weaker than the
impact of subjective norms and perceived behavioral control. The explanation for the lack of a
strong relation between attitude and upgrading intention could lie in the influences of the fast
evolving environment of the smartphone market. That is consumers could very well have a
positive attitude toward upgrading their smartphones, but considering the wish value left in the
product that they currently use, they have no clear intention to upgrade in the near future. Our
survey results also indicated that nearly 60% of respondents upgraded their smartphones within
the last 12 months, which is approximately equivalent to the average time interval between the
release dates of two generations of smartphones. Further grouped regression analysis also
confirmed that attitude is a strong predictor of upgrading intention among respondents whose last
smartphone upgrading was at least 12 months ago. However, the impact of attitude is much
lower among respondent who upgraded their smartphone within the last 12 months. Additionally,
as we discussed in the literature review, consumers may also delay their upgrading in favor of
future technology, as a result of anticipated regret (Sandberg & Conner, 2008), especially in a
market where the perceived rate of innovation is relatively higher (Shih & Schau, 2011).
One of the major focuses of this study is the role of status consumption in the context of
upgrading smartphones. However, we only found partial support for the moderating role of status
consumption. That is status consumption only has its moderating effect in the condition of high
level of status consumption, and even stronger moderating effect when people in this category
also have high score on attitude toward upgrading their smartphones. In other words, status
consumption will not have any significant moderating effect for consumers who scored low on
39
the measures of status consumption. However, the test results with conditions at least partially
confirmed two of our hypotheses. That is status consumption will negatively moderate the
relationship between subjective norm and upgrading intention and positively moderate the
relationship between perceived behavioral control and upgrading intention.
The reason why we did not generally observe strong effect of status consumption, as an
independent variable, could possibly lie in the specific time period of data collection. The data
collection started from September 5th 2016 and ended approximately one month later. During
that period, there were two major events in the market of smartphones. First, Apple released their
new iPhone 7 and iPhone 7 plus. Second, Samsung experienced serious safety problems (battery
explosions) on their new Galaxy Note 7. Apple and Samsung are the two leading brands in the
current smartphone market and the only two manufacturers that offered successful premier
products, such as the iPhone series of Apple and the Galaxy series of Samsung, which would
normally cost more than a thousand dollar for an unlocked version. As we discussed earlier, we
expected to observe the significance of status consumption, especially among brands like Apple
and Samsung. However, the test result did not indicate any strong influence of status
consumption, even for respondents who selected Apple or Samsung as their future upgrading
choices.
When respondents are asked to evaluate the measures of status consumption, such as “I
would purchase a new and upgraded smartphone because it has status”, they need to have a
target in their mind, in other words, have a specific brand and product in their mind. During the
period of data collection, products like the iPhone 7 and Galaxy Note 7 were advertised as the
new and best products for the two brands and then could be regarded as the most possible status
related products. However, both the iPhone 7 and the Galaxy Note 7 have their own problems
that may prevent themselves from being linked with status, as presented further here.
First of all, the iPhone 7 has received major improvement, including a faster CPU, an
enhanced fingerprint scanner and water and dust resistance. However, the basic appearance
design hasn’t been changed since two years ago. In other words, consumers can hardly
distinguish iPhone 7 from older generations and some online comments even refer the iPhone 7
as the iPhone 6ss. In addition, the iPhone 7 family has a significant lower sales comparing the
iPhone 6s family in the first months after their release dates.

40
According to Okada (2006), consumers are more willing to upgrade if they perceive the
new product as more dissimilar to the older model. This conclusion may not only work for the
functional aspects of new products, but also for the symbolic aspects of new products, especially
for highly visible products like smartphones. Consumers may also be more willing to upgrade if
they perceive the newer models are significantly different from the older ones, especially in
terms of appearance. Observing a difference in the appearance of new products is the easiest way
to distinguish them from older ones and the status builds on the possession of new and enhanced
products can also be realized more easily via the difference on appearance. As a result, the lack
of difference between the iPhone 7 and the older generations may prevent the new product from
being distinguished from older generations and then make it harder to realize the benefit on
status for having new products. At the end, consumers may decide not to upgrade because of the
difficulties in realizing symbolic values by having new products. Consumers may also have the
same difficulties for Samsung’s Galaxy Note 7, because it’s nearly impossible to build any status
by possessing something that is physically dangerous. Thus, in summary, the possible reason we
were unable to observe the impact of status consumption could be that: (1) during the data
collection period, the two leading brands in the market of smartphones, Apple and Samsung,
either didn’t provide new high-end products that can be easily distinguished or engaged in way
serious safety problems; (2) consumers then may have projected difficulties in building status by
upgrading to the corresponding products; (3) when respondents were asked to evaluate the
measures of status consumption, they may have failed to find an ideal product with status in the
current smartphone market and then had difficulties in making their judgements on the status
consumption of smartphones.
6.2 IN TERMS OF THEORY BUILDING
The TPB model has been applied to various product and service categories, including
many technological products and services enabled by advances in technologies. In comparison
with those studies, we observed that the majority of TPB-based studies in the high-tech sector
only investigated general intentions of adopting technologies and related services, without a
focus on specific products or brands. For example, Pavlou and Chai (2002) studied consumers’
general online transactions intentions without a specific focus on products or brands involved.
Morris, Venkatesh, and Ackerman (2005) investigated individual’s intention in adopting
workplace software without providing a detailed description about the software itself. Thus, in

41
terms of theory building, the variation we added to the application of the TPB model comes from
the fact that we focused on a specific product category (smartphones) and considered the
possible differences across brands in the process of data collection process.
Additionally, we also found that the impact of the three TPB constructs significantly
varied across different behavioral intention that were previously studied and our testing results
revealed a relatively lower impact of attitude and stronger impact of subjective norm and
perceived behavioral control. Some of the TPB-based studies in the high-tech sector are
summarized in table 12:
TPB based Studies Intention studied AI SN PBC
Pavlou and Chai (2002) Online transaction 0.55** 0.24** 0.23*
George (2004) Internet purchasing 0.403*** 0.020 0.192**
Shih and Fang (2004) Internet banking 0.82*** 0.11 0.05
Morris et al. (2005) Work place software 0.28*** 0.18* 0.17*
Lu, Zhou, and Wang (2009) Instant messaging software 0.29** 0.23** 0.22**
Harrison et al. (1997) Executive’s IT adoption 0.29** 0.24** 0.19*
This study Upgrading smartphones 0.109* 0.289*** 0.374***
*p<0.05, **p<0.01, ***p<0.001
Table 12: TPB based studies
In terms of consumers’ upgrading behavior for mobile devices, we then compared our test
results with the similar study on consumers’ upgrading intention toward mobile phones by Tseng
and Lo (2011). As an application of the TAM model, Tseng and Lo (2011)’s study failed to show
any strong relationships among the two major constructs of the TAM model (perceived
usefulness and perceive ease of use) and consumers’ intention to upgrade their mobile phones.
Thus, based on our test results, we can conclude that the TPB model is more capable than the
TAM model in explaining consumers’ upgrading intention toward mobile devices, such as
mobile phones or smartphones.
As we adopted the measures of status consumption from Eastman et al. (1999), we then
intended to compare our test results with similar studies concerning the measures and impact of
status consumption. In their proposition of the measures, Eastman et al. (1999) conducted
several studies separately to test the effectiveness of the measures with brands in various product

42
or service categories, including beer, restaurants, automobiles, shops, electronics and clothing. In
their study on electronics brands, several brands, including Alpine, Carver, Emerson, Kenwood,
Pioneer, and Sony, were selected to test whether status consumption had an impact on their
purchase. Their overall test results indicate that status consumption has an impact on the
purchase of the brands above, with a overall standard coefficient of 0.18 at p<0.05 level.
However, Eastman et al. (1999) didn’t examine variations across brands, nor did they
differentiate product categories among the selected brands (brands selected offer products in a
variety of categories). Thus, comparing our test results with the results from studies above can
hardly generate any meaningful results. Additionally, the measures of Eastman et al. (1999)
haven’t been systematically tested in various settings by subsequent researchers who cited the
study of Eastman et al. (1999). In fact, most of the studies only relied on the work of Eastman et
al. (1999) to define status related behaviors. Thus, this study can also be regarded as a starter of
the systematic test of such measures for future studies of status consumption, which will
probably give meaningful results.
6.3 IMPLICATIONS FOR PRACTICES
This research examined what influences the upgrading intention for smartphones, with a
special consideration on the possible role of status consumption. The test results indicated that
subjective norms and perceived behavioral control are the two major variables that influence
consumers’ upgrading intention toward smartphones and status consumption has a moderating
effect only for respondents that scored high on status consumption and attitude. We believe that
this first helps interpreting the success of some smartphone manufacturers in the past few years
when the market of smartphone dramatically expanded. For example, Apple’s success in
commanding high price for their iPhones for some consumers may probably be due to encouraging
interpersonal influences among their reference groups, which will then become positive subjective
norms influences that encourage potential consumers to upgrade to an Apple’s product.
Additionally, the strong impact of perceived behavioral control may also supports the importance
of Apple’s financing options for their products, especially for students who have limits on their
budget, and the easy access to their own retail store, which will finally give more control for
consumers to upgrade.

43
For other smartphones makers, the significant impact of subjective norm and perceived
behavioral control on upgrading intention will probably persuade them to reconsider their current
marketing strategies, such as hardware and cost performance competition, and switch to branding
strategies that emphasizes the importance of symbolic values of their products and give more
controls for consumers in choosing their products, such as easy access to products and finance
options for high- end products. Additionally, the moderating effect of status consumption indicates
that companies in the market of smartphones need to pay extra attention on the possible status
attached to their products. For example, some manufacturers may need to show much bigger
improvement on their new products, especially in the appearance design, and in the symbolic
values associated to their brands, in order to convey more status.
6.4 LIMITATIONS
The primary limitation of the chosen research methodology comes from the criticism about
convenience sampling techniques. The most obvious limitation of convenience sampling is
sampling bias, because the sample is not representative of the entire population. Upon the sampling
bias, systematic bias also exists, due to the constant difference between the results from the
convenience sample and the theoretical results from the entire population. As a result of such
sampling limitations, making inferences about the entire population will be harder, comparing to
other probability sampling techniques. This also results to a low external validity of the study. The
convenience sample for this study, however, can be regarded as a good convenience sample, as
college students and people of similar age stand for the majority of smartphone users. Additionally,
the descriptive statistics of measurements indicated that the variations on each measures are
relatively small and thus may prevent the data from generating meaningful results. Finally, this
study only considered one single product category, the smartphones, which prevent the test results
to be meaningful for other product categories.
6.5 FUTURE RESEARCH
Due to the limitations of this study, we first encourage future research on this topic to be
conducted with a more general population, instead of merely college students, in order to
improve the predicting power of the research model. Second, the data collected for this study is
from consumers of an extreme collectivistic culture, the Chinese culture, so future studies may
44
also be conducted in a different culture settings, such as Canada and the US as representatives of
western and individualistic cultures. The study of Pavlou and Chai (2002) has already confirmed
the significant difference of the impacts of attitude and subjective norm, when they applied the
TPB model separately in China and the US. They found that attitude played a more important
role in affecting the behavioral intention in the US, while subjective norms and perceived
behavioral control had stronger influences on the same intention in China. Thus, if we further
apply the proposed research model in a western culture, such as Canada and the US, it’s highly
possible that we will discover a stronger influence of attitude, but a weaker impact of subjective
norms at the same time.
Apart from sampling techniques and culture differences, whether the proposed research
model will reveal different results across different product categories is also worth further
investigating. The upgrading intention for technological products with lower product visibility,
such as television, desktop computers and other home appliances, may be less relative to
symbolic value driven constructs, such as subjective norm and status consumption. From a more
general perspective, the status consumption we examined in this study is the pure status by
possessing certain products. Status itself, however, is not merely the result of possession,
personal capabilities can also generate status within one’s social groups. In the market of high-
tech products, such personal capabilities can be interpreted as the ability to operate sophisticated
equipment, such as using some professional software or tools. Thus, future studies on status
consumption should also include consumers’ behavioral intention towards sophisticated
products.
7. CONCLUSION
Based on the TPB model, this study aims to improve our understanding of consumers’
upgrading behavior toward high-tech products by testing an extended TPB model with extra
considerations given to the role of status consumption. The proposed model adopted the measures
for status consumption from Eastman et al. (1999) and tested the possible impact of status
consumption as a moderating variable. An empirical study was conducted and results indicated
that attitude, subjective norms and perceived behavioral positively affected consumers’ upgrading
intention toward smartphones. Among the three constructs, the impact of subjective norm and

45
perceived behavioral control was much stronger than the one of attitude, which was beyond our
expectations. Status consumption has been supported to have moderating effect only for
respondents who score high on the measures of status consumption and an even stronger
moderating effect for respondents who also scored high on attitude. This study also aims to
encourage future study on further understanding consumers’ upgrading behavior, especially for
high-tech products that tend to be conspicuously consumed.

46
8. REFERENCE
Ackroyd, S. (1992). Data collection in context: Longman Group United Kingdom. Ajzen, I. (1991). The theory of planned behavior. Organizational Behavior and Human Decision
Processes, 50(2), 179-211. Ajzen, I. (2002). Constructing a TPB questionnaire: Conceptual and methodological considerations. Antonides, G. (1991). An economic-psychological model of scrapping behavior. Journal of Economic
Psychology, 12(2), 357-379. Baron, R. M., & Kenny, D. A. (1986). The moderator–mediator variable distinction in social psychological
research: Conceptual, strategic, and statistical considerations. Journal of Personality and Social Psychology, 51(6), 1173.
Baumeister, R. F., & Leary, M. R. (1995). The need to belong: desire for interpersonal attachments as a fundamental human motivation. Psychological Bulletin, 117(3), 497.
Bayus, B. L. (1988). Accelerating the durable replacement cycle with marketing mix variables. Journal of Product Innovation Management, 5(3), 216-226.
Bayus, B. L. (1991). The consumer durable replacement buyer. The Journal of Marketing, 42-51. Bearden, W. O., & Etzel, M. J. (1982). Reference group influence on product and brand purchase
decisions. Journal of Consumer Research, 183-194. Belch, G. E. (1978). Belief systems and the differential role of the self-concept. Advances in Consumer
Research, 5(1). Belch, G. E., & Landon Jr, E. L. (1977). Discriminant validity of a product-anchored self-concept measure.
Journal of Marketing Research, 252-256. Belk, R. W., Bahn, K. D., & Mayer, R. N. (1982). Developmental recognition of consumption symbolism.
Journal of Consumer Research, 9(1), 4-17. Bellenger, D. N., Steinberg, E., & Stanton, W. W. (1976). Congruence of store image and selfimages-as ot
relates to store loyalty. Journal of Retailing, 52(1), 17-32. Berthon, P., Pitt, L., Parent, M., & Berthon, J.-P. (2009). Aesthetics and ephemerality: observing and
preserving the luxury brand. California Management Review, 52(1), 45-66. Bilkey, W. J., & Tucker, W. (1968). Foundations for a Theory of Consumer Behavior: JSTOR. Bourdieu, P. (1984). Distinction: A social critique of the judgement of taste: Harvard University Press. Burke, M., Conn, W. D., & Lutz, R. J. (1978). Using psychographic variables to investigate product
disposition behaviors. Paper presented at the Proceedings, Educators Conference, American Marketing Association, Subhash Jain (ed.).
Burns, R. B. (1979). The self concept: in theory, measurement, development and behaviour: Longman London.
Caruana, A., Money, A. H., & Berthon, P. R. (2000). Service quality and satisfaction-the moderating role of value. European Journal of Marketing, 34(11/12), 1338-1353.
Cohen, J. (1992). A power primer. Psychological Bulletin, 112(1), 155. Cooley, C. H. (1992). Human nature and the social order: Transaction Publishers. Corneo, G. (2009). Symbolic values, value formation and interpersonal relations. 314. Danaher, P. J., Hardie, B. G., & Putsis Jr, W. P. (2001). Marketing-mix variables and the diffusion of
successive generations of a technological innovation. Journal of Marketing Research, 38(4), 501-514.
Davis, F. D. (1989). Perceived usefulness, perceived ease of use, and user acceptance of information technology. MIS Quarterly, 319-340.
Dawson, S., Bloch, P. H., & Ridgway, N. M. (2002). Shopping motives, emotional states, and retail outcomes. The Environments of Retailing. London: Routledge, 65-81.
47
Delozier, M. W., & Tillman, R. (1972). Self-image concepts: Can they be used to design marketing programs. Southern Journal of Business, 7(1), 9-15.
Dhebar, A. (1996). Speeding high-tech producer, meet the balking consumer. MIT Sloan Management Review, 37(2), 37.
Dobni, D., & Zinkhan, G. M. (1990). In search of brand image: A foundation analysis. Advances in Consumer Research, 17(1), 110-119.
Dolich, I. J. (1969). Congruence relationships between self images and product brands. Journal of Marketing Research, 80-84.
Eastman, J. K., Goldsmith, R. E., & Flynn, L. R. (1999). Status consumption in consumer behavior: Scale development and validation. Journal of Marketing Theory and Practice, 41-52.
Elliott, R. (1994). Addictive consumption: Function and fragmentation in postmodernity. Journal of Consumer Policy, 17(2), 159-179.
Fishbein, M., & Ajzen, I. (1975). Belief, attitude, intention and behavior: An introduction to theory and research.
Friese, S., & Koenig, H. (1993). Shopping for trouble. Advancing the Consumer Interest, 24-29. Gabor, A., & Granger, C. (1972). Ownership and acquisition of consumer durables: Report on the
Nottingham consumer durables project. European Journal of Marketing, 6(4), 234-248. Gemser, G., & Leenders, M. A. (2001). How integrating industrial design in the product development
process impacts on company performance. Journal of Product Innovation Management, 18(1), 28-38.
George, J. F. (2004). The theory of planned behavior and Internet purchasing. Internet Research, 14(3), 198-212.
Goffman, E. (1978). The presentation of self in everyday life: Harmondsworth. Goldsmith, R. E., Flynn, L. R., & Eastman, J. K. (1996). Status consumption and fashion behavior: An
exploratory study. Paper presented at the Association of Marketing Theory and Practice Proceedings.
Gollwitzer, P. M., Wicklund, R. A., & Hilton, J. L. (1982). Admission of failure and symbolic self-completion: Extending Lewinian theory. Journal of Personality and Social Psychology, 43(2), 358.
Gould, S. J. (1993). Assessing Self-Concept Discrepancy in Consumer Behavior: The Joint Effect of Private Self-Consciousness and Self-Monitoring. Advances in Consumer Research, 20(1).
Green, P. E., Maheshwari, A., & Rao, V. R. (1969). Self-concept and brand preference: an empirical application of multidimensional scaling. Journal of the Market Research Society, 11(4), 343-360.
Grewal, R., Mehta, R., & Kardes, F. R. (2004). The timing of repeat purchases of consumer durable goods: The role of functional bases of consumer attitudes. Journal of Marketing Research, 41(1), 101-115.
Grubb, E. L., & Hupp, G. (1968). Perception of self, generalized stereotypes, and brand selection. Journal of Marketing Research, 58-63.
gsmarena. (2015). Retrieved from www.gsmarena.com Guiltinan, J. (2010). Consumer durables replacement decision-making: An overview and research
agenda. Marketing Letters, 21(2), 163-174. Hanley, M. (2013). College student smartphone usage hits 74%; Tablet ownership at 30%. Harrison, D. A., Mykytyn Jr, P. P., & Riemenschneider, C. K. (1997). Executive decisions about adoption of
information technology in small business: Theory and empirical tests. Information Systems Research, 8(2), 171-195.
Heffetz, O. (2004). Conspicuous consumption and the visibility of consumer expenditures. Department of Economics, Princeton University.
Heffetz, O. (2007). Conspicuous consumption and expenditure visibility: measurement and application. Available at SSRN 1004543.

48
Heffetz, O. (2011). A test of conspicuous consumption: Visibility and income elasticities. Review of Economics and Statistics, 93(4), 1101-1117.
Hoffer, G. E., & Reilly, R. J. (1984). Automobile styling as a shift variable: An investigation by firm and by industry. Applied Economics, 16(2), 291-298.
Hofstede, G. H. (2001). Culture's consequences: Comparing values, behaviors, institutions and organizations across nations: Sage.
Holman, R. H. (1981). Product use as communication: a fresh appraisal of a venerable topic. Review of Marketing, 106, 19.
Hsieh, F. Y., Bloch, D. A., & Larsen, M. D. (1998). A simple method of sample size calculation for linear and logistic regression. Statistics in Medicine, 17(14), 1623-1634.
Huh, Y. E., & Kim, S.-H. (2008). Do early adopters upgrade early. Role of post-adoption behavior in the purchase of next-generation products Journal of Business Research, 61(1).
IrvingJanis, D.-M. (1977). a Psychological Analysis of Conflict, Choice and Commitment: New York, Free Press.
Kang, Y. S., Hong, S., & Lee, H. (2009). Exploring continued online service usage behavior: The roles of self-image congruity and regret. Computers in Human Behavior, 25(1), 111-122.
Katona, G. (1960). The powerful consumer. Katona, G., & Mueller, E. (1955). A study of purchase decisions. Consumer behavior: The Dynamics of
Consumer Reaction, 1, 30-87. Kilsheimer, J. C. (1993). Status consumption: The development and implications of a scale measuring the
motivation to consume for status: UMI.
Kim, & Srinivasan, V. (2009). A Conjoint‐Hazard Model of the Timing of Buyers' Upgrading to Improved
Versions of High‐Technology Products. Journal of Product Innovation Management, 26(3), 278-290.
Kim, Srivastava, R. K., & Han, J. K. (2001). Consumer decision-making in a multi-generational choice set context. Journal of Business Research, 53(3), 123-136.
Kressmann, F., Sirgy, M. J., Herrmann, A., Huber, F., Huber, S., & Lee, D.-J. (2006). Direct and indirect effects of self-image congruence on brand loyalty. Journal of Business Research, 59(9), 955-964.
Langer, J. (1997). What consumers wish brand managers knew. Journal of Advertising Research, 37(6), 60-66.
Lu, Y., Zhou, T., & Wang, B. (2009). Exploring Chinese users’ acceptance of instant messaging using the theory of planned behavior, the technology acceptance model, and the flow theory. Computers in Human Behavior, 25(1), 29-39.
Lund, R. T. (1977). Making products live longer. Technol. Rev.;(United States), 79(3). Lunden, I. (2014). Gartner: Device shipments break 2.4 b units in 2014, tablets to overtake PC sales in
2015. July 6th. Making, D. (1977). A Psychological Analysis of Conflict, Choice, and Commitment: New York: Free Press. Mangleburg, T. F., Sirgy, M. J., Grewal, D., Axsom, D., Hatzios, M., Claiborne, C., & Bogle, T. (1998). The
moderating effect of prior experience in consumers' use of user-image based versus utilitarian cues in brand attitude. Journal of Business and Psychology, 13(1), 101-113.
Marcoux, J.-S., Filiatrault, P., & Cheron, E. (1997). The attitudes underlying preferences of young urban educated Polish consumers towards products made in western countries. Journal of International Consumer Marketing, 9(4), 5-29.
Markus, H., Cross, S., & Wurf, E. (1990). The role of the self-system in competence. Markus, H., & Kitayama, S. (1991). Culture and the self: Implications for cognition, emotion, and
motivation. Psychological Review, 98(2), 224. Mick, D. G., & Fournier, S. (1998). Paradoxes of technology: Consumer cognizance, emotions, and coping
strategies. Journal of Consumer Research, 25(2), 123-143.
49
Mittal, B., Ratchford, B., & Prabhakar, P. (1990). Functional and expressive attributes as determinants of brand-attitude. Research in Marketing, 10(1990), 135-155.
Moreau, C. P., Lehmann, D. R., & Markman, A. B. (2001). Entrenched knowledge structures and consumer response to new products. Journal of Marketing Research, 38(1), 14-29.
Morris, M. G., Venkatesh, V., & Ackerman, P. L. (2005). Gender and age differences in employee decisions about new technology: An extension to the theory of planned behavior. Engineering Management, IEEE Transactions on, 52(1), 69-84.
Mueller, E. (1958). The desire for innovations in household goods. Consumer Behavior; Research on Consumer Reactions, 13-37.
O'cass, A., & Frost, H. (2002). Status brands: examining the effects of non-product-related brand associations on status and conspicuous consumption. Journal of Product & Brand Management, 11(2), 67-88.
O'Cass, A., & McEwen, H. (2004). Exploring consumer status and conspicuous consumption. Journal of Consumer Behaviour, 4(1), 25-39.
Okada, E. M. (2006). Upgrades and new purchases. Journal of Marketing, 70(4), 92-102. Onkvisit, S., & Shaw, J. (1987). Self-concept and image congruence: Some research and managerial
implications. Journal of Consumer Marketing, 4(1), 13-23. Park, C. W., Jaworski, B. J., & Maclnnis, D. J. (1986). Strategic brand concept-image management. The
Journal of Marketing, 135-145. Pavlou, P. A., & Chai, L. (2002). What Drives Electronic Commerce across Cultures? Across-Cultural
Empirical Investigation of the Theory of Planned Behavior. J. Electron. Commerce Res., 3(4), 240-253.
Pavlou, P. A., & Fygenson, M. (2006). Understanding and predicting electronic commerce adoption: An extension of the theory of planned behavior. MIS quarterly, 115-143.
Peres, R., Muller, E., & Mahajan, V. (2010). Innovation diffusion and new product growth models: A critical review and research directions. International Journal of Research in Marketing, 27(2), 91-106.
Pickering, J. F. (1975). Verbal explanations of consumer durable purchase decisions. Journal of the Market Research Society, 17(2), 107-113.
Ralston, D. A., Gustafson, D. J., Elsass, P. M., Cheung, F., & Terpstra, R. H. (1992). Eastern values: A comparison of managers in the United States, Hong Kong, and the People's Republic of China. Journal of Applied Psychology, 77(5), 664.
Rashidian, A., Miles, J., Russell, D., & Russell, I. (2006). Sample size for regression analyses of theory of planned behaviour studies: case of prescribing in general practice. British Journal of Health Psychology, 11(4), 581-593.
Robson, C. (1993). Real world research: A resource for social scientists and practitioners-researchers. Massachusetts: Blackwell Pushers.
Rogers, E. M. (2010). Diffusion of innovations: Simon and Schuster. Rosenberg, M. (1986). Conceiving the self: RE Krieger. Rossi, P. H., Wright, J. D., & Anderson, A. B. (2013). Handbook of Survey Research: Academic Press. Sandberg, T., & Conner, M. (2008). Anticipated regret as an additional predictor in the theory of planned
behaviour: A meta‐analysis. British Journal of Social Psychology, 47(4), 589-606. Schenk, C. T., & Holman, R. H. (1980). A sociological approach to brand choice: the concept of situational
self image. Advances in Consumer Research, 7(1). Secord, P. F. (1968). Consistency theory and self-referent behavior. Theories of Cognitive Consistency: A
Sourcebook, eds. Robert P. Ableson et al., Chicago, IL: Rand McNally, 343-347. Shih, & Schau, H. J. (2011). To justify or not to justify: the role of anticipated regret on consumers’
decisions to upgrade technological innovations. Journal of Retailing, 87(2), 242-251.

50
Shih, Y.-Y., & Fang, K. (2004). The use of a decomposed theory of planned behavior to study Internet banking in Taiwan. Internet Research, 14(3), 213-223.
Sirgy, M. J. (1979). Self-concept in consumer behavior. Sirgy, M. J. (1982). Self-concept in consumer behavior: A critical review. Journal of Consumer Research,
287-300. Sirgy, M. J., Grewal, D., & Mangleburg, T. (2000). Retail environment, self-congruity, and retail
patronage: An integrative model and a research agenda. Journal of Business Research, 49(2), 127-138.
Sirgy, M. J., & Johar, J. (1999). Toward an integrated model of self-congruity and functional congruity. European Advances in Consumer Research, 4(1), 252-256.
Sirgy, M. J., Johar, J., Samli, A. C., & Claiborne, C. (1991). Self-congruity versus functional congruity: predictors of consumer behavior. Journal of the Academy of Marketing Science, 19(4), 363-375.
Sirgy, M. J., & Samli, A. C. (1985). A path analytic model of store loyalty involving self-concept, store image, geographic loyalty, and socioeconomic status. Journal of the Academy of Marketing Science, 13(3), 265-291.
Sirgy, M. J., & Su, C. (2000). Destination image, self-congruity, and travel behavior: Toward an integrative model. Journal of Travel Research, 38(4), 340-352.
Solomon, M. R., Dahl, D. W., White, K., Zaichkowsky, J. L., & Polegato, R. (2014). Consumer behavior: buying, having, and being: Prentice Hall Upper Saddle River, NJ.
Sweeney, J. C., & Soutar, G. N. (2001). Consumer perceived value: The development of a multiple item scale. Journal of Retailing, 77(2), 203-220.
Taylor, S., & Todd, P. A. (1995). Understanding information technology usage: A test of competing models. Information Systems Research, 6(2), 144-176.
Tseng, F.-M., & Lo, H.-Y. (2011). Antecedents of consumers’ intentions to upgrade their mobile phones. Telecommunications Policy, 35(1), 74-86.
Urban, G. L., Hauser, J. R., & Urban, G. L. (1993). Design and marketing of new products (Vol. 2): Prentice hall Englewood Cliffs, NJ.
Veblen, T. (2007). The theory of the leisure class: OUP Oxford. Venkatesh, V., & Brown, S. A. (2001). A longitudinal investigation of personal computers in homes:
adoption determinants and emerging challenges. MIS Quarterly, 71-102. Wicklund, R. A., & Gollwitzer, P. M. (2013). Symbolic self completion: Routledge. Wilkie, W. L., & Dickson, P. R. (1985). Shopping for appliances: Consumers' strategies and patterns of
information search. Marketing Science Institute. Wong, N. Y., & Ahuvia, A. C. (1998). Personal taste and family face: Luxury consumption in Confucian
and Western societies. Psychology and Marketing, 15(5), 423-441. Zeithaml, V. A. (1988). Consumer perceptions of price, quality, and value: a means-end model and
synthesis of evidence. The Journal of Marketing, 2-22.
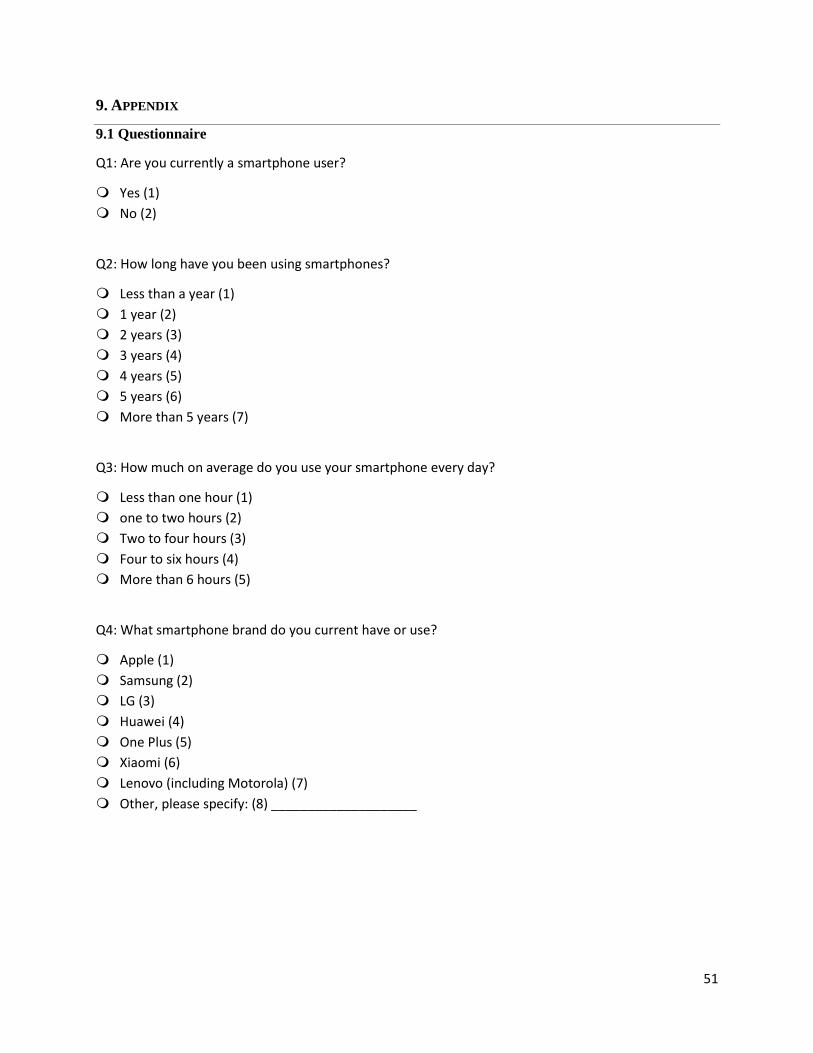
51
9. APPENDIX
9.1 Questionnaire
Q1: Are you currently a smartphone user?
Yes (1)
No (2)
Q2: How long have you been using smartphones?
Less than a year (1)
1 year (2)
2 years (3)
3 years (4)
4 years (5)
5 years (6)
More than 5 years (7)
Q3: How much on average do you use your smartphone every day?
Less than one hour (1)
one to two hours (2)
Two to four hours (3)
Four to six hours (4)
More than 6 hours (5)
Q4: What smartphone brand do you current have or use?
Apple (1)
Samsung (2)
LG (3)
Huawei (4)
One Plus (5)
Xiaomi (6)
Lenovo (including Motorola) (7)
Other, please specify: (8) ____________________
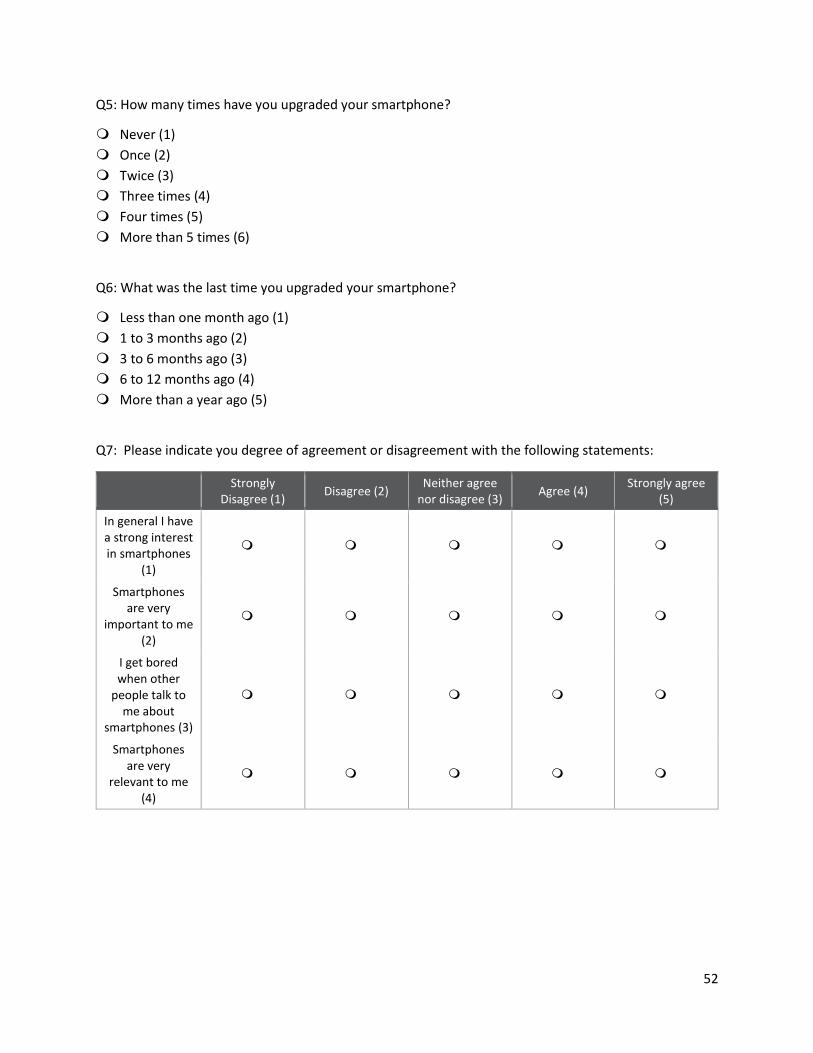
52
Q5: How many times have you upgraded your smartphone?
Never (1)
Once (2)
Twice (3)
Three times (4)
Four times (5)
More than 5 times (6)
Q6: What was the last time you upgraded your smartphone?
Less than one month ago (1)
1 to 3 months ago (2)
3 to 6 months ago (3)
6 to 12 months ago (4)
More than a year ago (5)
Q7: Please indicate you degree of agreement or disagreement with the following statements:
Strongly
Disagree (1) Disagree (2)
Neither agree nor disagree (3)
Agree (4) Strongly agree
(5)
In general I have a strong interest in smartphones
(1)
Smartphones are very
important to me (2)
I get bored when other
people talk to me about
smartphones (3)
Smartphones are very
relevant to me (4)

53
Q8: Behavioral intention: Please read the following statements carefully and indicate your agreement or
disagreement using the 7 points scale below:
Strongly disagree
(1)
Disagree (2)
Somewhat disagree
(3)
Neither agree nor disagree
(4)
Somewhat agree (5)
Agree (6) Strongly agree (7)
I intend to upgrade my smartphone in the near future. (1)
I plan to upgrade my smartphone in the near future. (2)
I will try to upgrade my smartphone in the near future. (3)
Q9: What are the smartphone brands you might consider for your future upgrading? (You can check
more than one brand if it applies)
Apple (1)
Samsung (2)
LG (3)
Sony (4)
Huawei (5)
One Plus (6)
Xiaomi (7)
Lenovo (including Motorola) (8)
Other, Please specify:.................. (9)
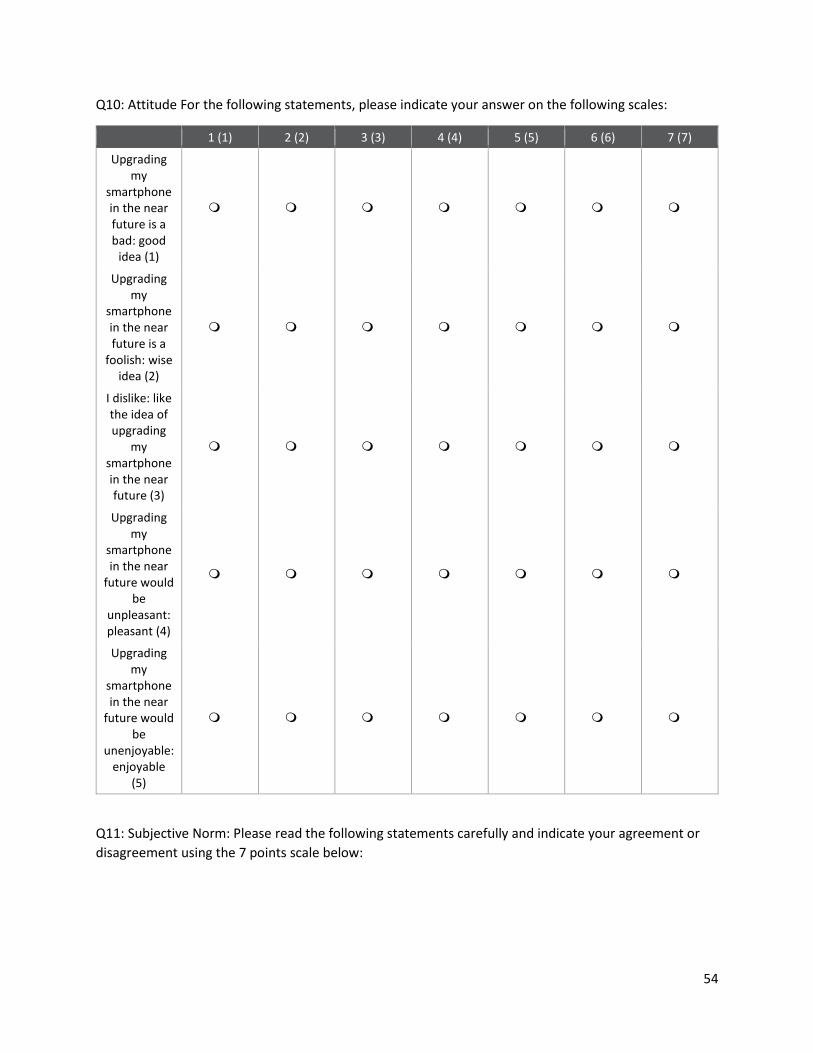
54
Q10: Attitude For the following statements, please indicate your answer on the following scales:
1 (1) 2 (2) 3 (3) 4 (4) 5 (5) 6 (6) 7 (7)
Upgrading my
smartphone in the near future is a bad: good
idea (1)
Upgrading my
smartphone in the near future is a
foolish: wise idea (2)
I dislike: like the idea of upgrading
my smartphone in the near future (3)
Upgrading my
smartphone in the near
future would be
unpleasant: pleasant (4)
Upgrading my
smartphone in the near
future would be
unenjoyable: enjoyable
(5)
Q11: Subjective Norm: Please read the following statements carefully and indicate your agreement or
disagreement using the 7 points scale below:

55
Strongly disagree
(1)
Disagree (2)
Somewhat disagree
(3)
Neither agree nor disagree
(4)
Somewhat agree (5)
Agree (6) Strongly agree (7)
People who influence
my behavior
would think that I
should upgrade my smartphone in the near future. (1)
People who are
important to me
would think that I
should upgrade my smartphone in the near future. (2)
It is expected of
me that I upgrade my smartphone in the near future. (3)
The people in my life
whose opinions I
value would approve me to upgrade
my smartphone in the near future. (4)
56
Many people like
me will upgrade
their smartphone in the near future (5)

57
Strongly disagree
(1)
Disagree (2)
Somewhat disagree
(3)
Neither agree nor disagree
(4)
Somewhat agree (5)
Agree (6) Strongly agree (7)
I would be able to
upgrade my smartphone in the near future. (1)
I have the resources and the
knowledge and the
ability to upgrade my smartphone in the near future. (2)
If I wanted to I could
upgrade my smartphone in the near future. (3)
It is mostly up to me
whether or not I
upgrade my smartphone in the near future. (4)
Upgraded smartphones are generally available in the stores
where I usually shop
(5)

58
The price of upgraded
smartphones is not a
problem affecting the upgrade of
my smartphone
(6)
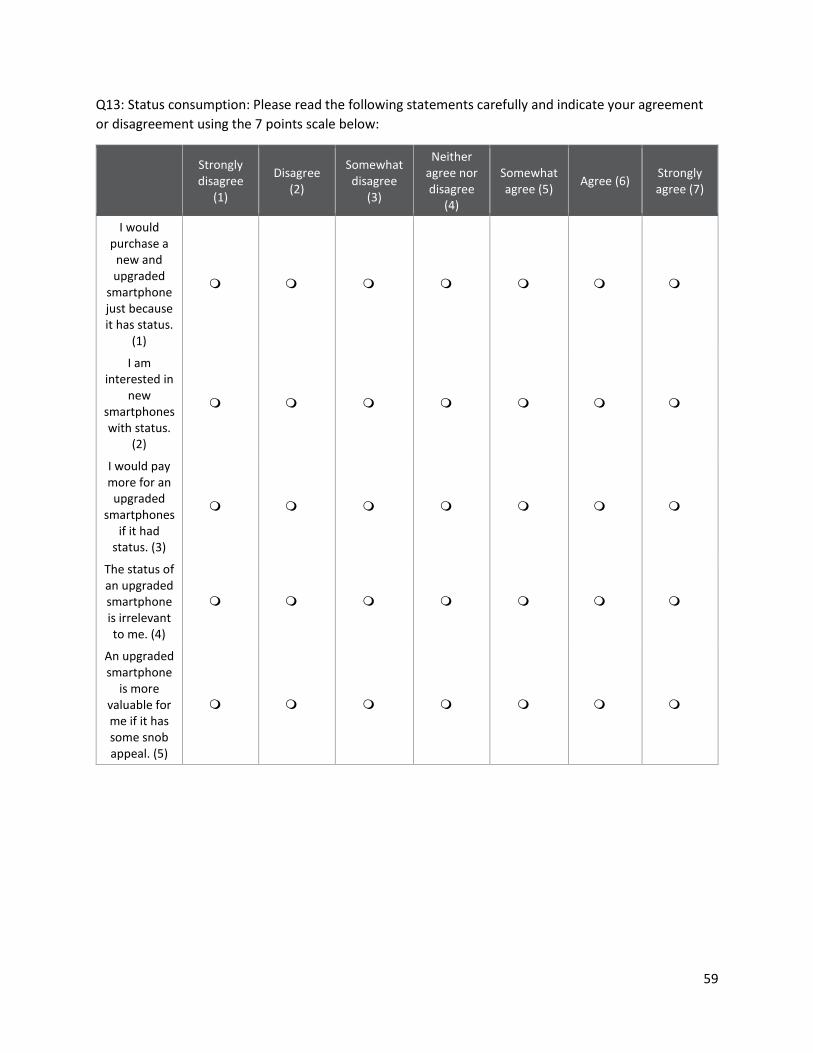
59
Q13: Status consumption: Please read the following statements carefully and indicate your agreement
or disagreement using the 7 points scale below:
Strongly disagree
(1)
Disagree (2)
Somewhat disagree
(3)
Neither agree nor disagree
(4)
Somewhat agree (5)
Agree (6) Strongly agree (7)
I would purchase a
new and upgraded
smartphone just because it has status.
(1)
I am interested in
new smartphones with status.
(2)
I would pay more for an upgraded
smartphones if it had
status. (3)
The status of an upgraded smartphone is irrelevant to me. (4)
An upgraded smartphone
is more valuable for me if it has some snob appeal. (5)
60
Q14: What is your age?
Under 18 (1)
18 - 24 (2)
25 - 34 (3)
35 - 44 (4)
45 - 54 (5)
Q15: What is your gender?
Male (1)
Female (2)
You don't have an option that applies to me. I identify as (please specify) : (3)
____________________
Q16: What is your primary language?
English (1)
French (2)
Chinese (3)
Other, please specify:.......... (4)
Q17: What is the highest level of education you have accomplished?
Less than high school (1)
High school graduate (2)
Some college (3)
2 years undergraduate degree (4)
4 years undergraduate degree (5)
Professional degree (6)
Doctorate (7)
Q18: Where do you currently reside ?
China (1)
Canada (2)
United States (3)
Others (4)

61
Q19: What is your current annual household income in Chinese Yuan?
Less than ¥10,000 (1)
¥10,000 - ¥39,999 (2)
¥40,000 - ¥59,999 (3)
¥60,000 - ¥79,999 (4)
¥80,000 - ¥99,999 (5)
¥100,000 - ¥119,999 (6)
¥120,000 - ¥139,999 (7)
¥140,000 - ¥159,999 (8)
More than ¥160,000 (9)