Embed Size (px)
Citation preview
Monitoring the Prairie Grain Handling and
Transportation System
Grain Monitoring Program Supplemental Program
Report on a Methodology for Tracking Commercial Trucking Rates of the Movement of Western Canadian Grain And A Report of Trucking Rates for the Crop Years:
1999-2000 2000-2001
April 2002 prepared by:
www.quorumcorp.net
Transport Transports Canada Canada
for
Agriculture and Agriculture et Agri-Food Canada Agroalimentaire Canada
701, 9707 – 110 Street Edmonton, Alberta T5K 2L9
TABLE OF CONTENTS
EXECUTIVE SUMMARY........................................................................................................................3
1.0 OVERVIEW................................................................................................................................4
1.1 THE GRAIN MONITORING PROGRAM..........................................................................................4 1.2 THE COMMERCIAL MOVEMENT OF GRAIN BY TRUCK ..................................................................4 1.3 COMMERCIAL TRUCKING RATES ...............................................................................................5
2.0 METHODOLOGY AND APPROACH........................................................................................6
2.1 WORK PLAN ............................................................................................................................7 2.2 SCOPE OF THE ANALYSIS .........................................................................................................7
3.0 GENERAL FINDINGS ...............................................................................................................9
3.1 BACKGROUND..........................................................................................................................9 3.2 GRAIN COMPANIES ARE THE CHIEF SUPPLIERS OF COMMERCIAL TRUCKING SERVICES .............10 3.3 GENERAL RATE STRUCTURES 1999 - 2001 ............................................................................12 3.4 GENERAL OBSERVATIONS AND ANALYSIS ................................................................................14
4.0 SUMMARY AND RECOMMENDATION .................................................................................16
4.1 SUMMARY OF RESEARCH AND ANALYSIS .................................................................................16 4.2 RECOMMENDED METHODOLOGY AND RATE TABLES ................................................................16
APPENDIX............................................................................................................................................19
Quorum Report – Commercial Trucking Rates in the Movement of Western Canadian Grain February 2002
2
Executive Summary This report is part of the supplemental portion of the Grain Monitoring Program (GMP) which calls for the examination and development of a methodology for the tracking of commercial trucking rates for the movement of grain in Western Canada. The commercial movement of grain by truck is a market that has found significant growth in recent years and finds its origins in the broader consolidation and rationalization efforts of both the railways and grain companies. The rationalization of both the rail and elevator networks contributed to the increased length of haul required by trucks and underscored the economic efficiency that could be realized from the use of higher-capacity vehicles to the railhead or – on occasion – final destination. This commercial opportunity was quickly met by a mixture of established trucking firms looking to diversify; newly created firms specializing in the movement of grain; and grain companies seeking to draw traffic into their facilities using their own fleet of equipment and/or contract operators. It is important to note that given its deregulated nature, there is no legal requirement for a trucking firm to subscribe to the rigors of a regulated tariff system. This has posed a challenge to the analysis of this industry as without a regulatory structure (or similar method), there is no truly consistent manner in which to trace historical rates that were charged in an “auditable” form. Quorum approached the project initially through discussion with “for-hire” transportation firms and trucking industry associations. Initially it was envisioned that a network of trucking firms could be established who would be canvassed on a monthly basis in order to gather changes in rates and rate structures. It was quickly found that a network of sizeable trucking firms engaged in the movement of grain did not exist. Mid to large size trucking firms that had at one time worked in the grain trucking segment had either removed themselves from the market or focused their efforts on the long haul movement in a specialty area (i.e. feed) The most common rationale for the removal was the highly competitive and season nature of the segment. The market has now essentially been taken over by small single unit firms, who work directly for the grain companies. Additionally, it was found that two grain companies in particular (Saskatchewan Wheat Pool and Agricore United) have established comprehensive and well organized networks of single unit truckers and bill them out under their own program. Quorum approached both of these companies with the intent of establishing the pretext for a methodology of using their rate structures as a proxy for the monitoring commercial trucking and found they were more that willing to work together with us towards that goal. The analysis that is discussed in section 3 and summarized in section 4 sees the combining of these two companies published rate scales with a subsequent regression applied against each in order to find a common set of rates which the monitoring program will use to measure the changes over time. Quorum proposes and recommends that these rate scales and the attendant regression analysis form the basis for the commercial truck rates measures methodology as well as the basis for the trucking portion of the producer netback methodology.
Quorum Report – Commercial Trucking Rates in the Movement of Western Canadian Grain February 2002
3
1.0 Overview 1.1 The Grain Monitoring Program
On May 10, 2000 the Government of Canada announced changes to its grain handling and transportation policies, to come into effect on August 1, 2000. At that time, the government also stated that an independent third party would be appointed to provide a transparent and continuous monitoring program aimed at assessing the overall efficiency of the grain handling and transportation system (GHTS) under these reforms. To this end, the independent third party would be charged with gauging:
• the benefits accruing to farmers; • whether the Canadian Wheat Board marketing mandate was being adversely affected; • the effect on grain handling efficiency; • the effect on railway efficiency; • the effect on port efficiency for grain; and • the overall performance of the GHTS.
The Federal government stated that the Grain Monitoring Program (GMP) was intended to provide information to the Ministers of Transport, Agriculture and Agri-Food, as well as the Minister responsible for the Canadian Wheat Board, on the overall performance of the reformed GHTS. Should the GMP identify any particular problems or opportunities to improve the system further, the government would then be in a position to act. On June 19, 2001, David Collenette, Minister of Transport; Lyle Vanclief, Minister of Agriculture and Agri-Food; and Ralph Goodale, Minister of Natural Resources and Minister responsible for the Canadian Wheat Board announced that Quorum Corporation (Quorum) had been selected to undertake the GMP.
1.2 The Commercial Movement of Grain by Truck
In general terms, the long and heavy haul commercial movement of grain by truck is a market that has found significant growth in recent years and finds its origins in the broader consolidation and rationalization efforts of both the railways and grain companies. The increased length of haul occasioned by the rationalization of both these networks underscored the economic efficiency that could be realized from the use of higher-capacity vehicles to the railhead or – on occasion – final destination. This served to open a new market for commercial truckers who had previously been unable to displace producers from using their own equipment in making short-haul deliveries to local elevators. This commercial opportunity was quickly met by a mixture of established trucking firms looking to diversify; newly created firms specializing in the movement of grain; and grain companies seeking to draw traffic into their facilities using their own fleet of equipment and/or contract operators.1 And while a number of producers opted for such services, many continued to use their own trucks to haul grain to local elevators. Still others moved to replace their older vehicles with new tractor-trailers having far greater carrying capacities, which they also used in offering independent grain haulage services to their neighbours as a means of augmenting farm income.
It is important to note that given its deregulated nature, there is no legal requirement for a trucking firm to subscribe to the rigors of a regulated tariff system. Although most for-hire trucking firms will publish a “rate card”, most commodities – including grain – are likely to move at a significant discount from these “published” rates under privately negotiated agreements with individual shippers. Such agreements mask the freight rates at which traffic is effectively moved. In a similar manner, discounts from the trucking rates posted by grain companies employing their own
Quorum Report – Commercial Trucking Rates in the Movement of Western Canadian Grain February 2002
4
1 Agricore was recently cited as having some 257 trucking firms registered as participants in its Smart Haul program – an “in-house” trucking service offered to grain producers across the prairies. Truck News, August 2001.
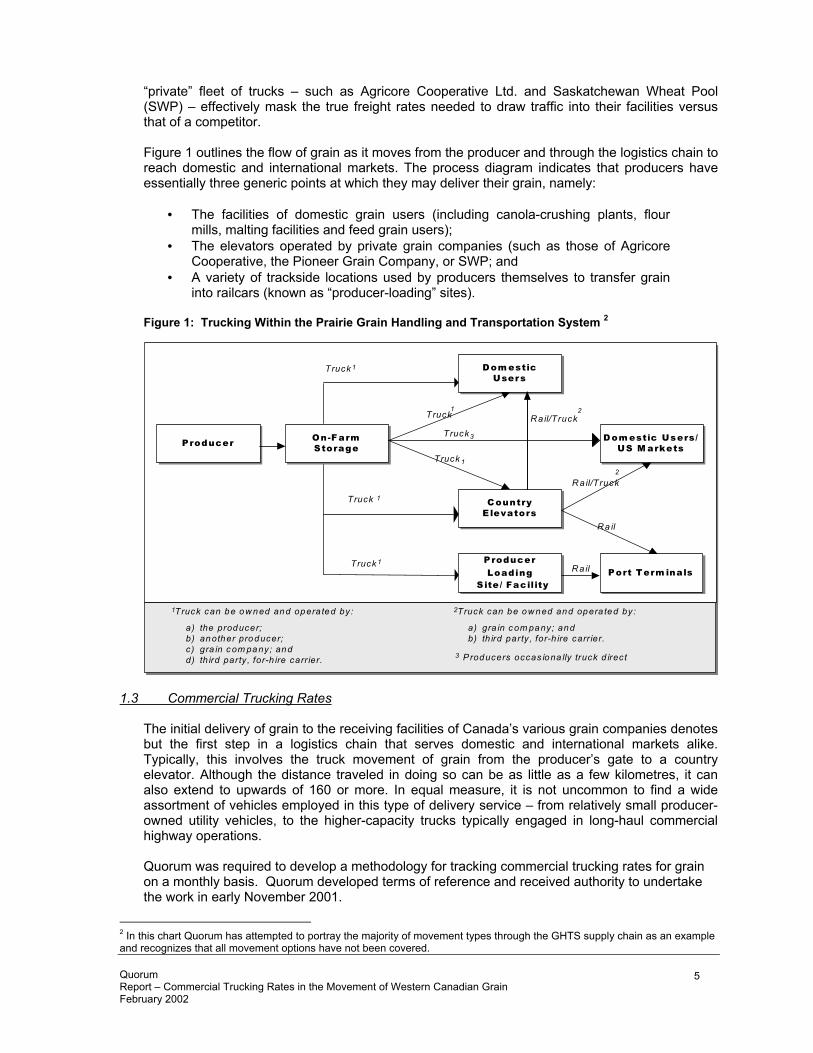
“private” fleet of trucks – such as Agricore Cooperative Ltd. and Saskatchewan Wheat Pool (SWP) – effectively mask the true freight rates needed to draw traffic into their facilities versus that of a competitor. Figure 1 outlines the flow of grain as it moves from the producer and through the logistics chain to reach domestic and international markets. The process diagram indicates that producers have essentially three generic points at which they may deliver their grain, namely:
The facilities of domestic grain users (including canola-crushing plants, flour mills, malting facilities and feed grain users);
•
•
•
The elevators operated by private grain companies (such as those of Agricore Cooperative, the Pioneer Grain Company, or SWP; and A variety of trackside locations used by producers themselves to transfer grain into railcars (known as “producer-loading” sites).
Figure 1: Trucking Within the Prairie Grain Handling and Transportation System 2
Producer Producer On-F arm Storage
On-Farm Storage
Dom estic Users
Dom estic Users
Country Elevators
Country Elevators
Producer Loading S ite
Producer
Loading S ite/ Facility
D om estic Users/ US M arkets
D om estic Users/ US M arkets
Port Term inals Port Term inals
Truck 1
Truck 1
Truck 1
Truck 1
Truck 1
R ail
R ail/Truck 2
R a il
1 Truck can be ow ned and opera ted by:
a) the producer; b) another producer; c) gra in c om pany; and d) th ird party , for-h ire carr ier.
2 Truck can be ow ned and opera ted by:
a) gra in c om pany; and b) th ird party , for-h ire carr ier.
R ail/Truck 2
Truck 3
3 Producers occas iona lly truck d irect
1.3 Commercial Trucking Rates
The initial delivery of grain to the receiving facilities of Canada’s various grain companies denotes but the first step in a logistics chain that serves domestic and international markets alike. Typically, this involves the truck movement of grain from the producer’s gate to a country elevator. Although the distance traveled in doing so can be as little as a few kilometres, it can also extend to upwards of 160 or more. In equal measure, it is not uncommon to find a wide assortment of vehicles employed in this type of delivery service – from relatively small producer-owned utility vehicles, to the higher-capacity trucks typically engaged in long-haul commercial highway operations. Quorum was required to develop a methodology for tracking commercial trucking rates for grain on a monthly basis. Quorum developed terms of reference and received authority to undertake the work in early November 2001.
Quorum Report – Commercial Trucking Rates in the Movement of Western Canadian Grain February 2002
5
2 In this chart Quorum has attempted to portray the majority of movement types through the GHTS supply chain as an example and recognizes that all movement options have not been covered.
2.0 Methodology and Approach In its proposal to the Government officials, Quorum outlined a process and methodology to be established in gathering data on commercial trucking rates. The focus of this effort was centred on gauging the costs typically arising to producers in delivering their grain to local elevators. To do so, Quorum proposed to secure the assistance of both the larger for-hire carriers and the grain companies in an on-going survey of prevailing commercial trucking rates. The data to be collected (as a mileage-based, per-tonne cost to producers) could then be used to develop a representative scale of comparative costs that can be monitored over time. This analysis would be built around the sampling of rates into an appropriate number of delivery points within each of the three Prairie Provinces, and British Columbia. These points would also serve to define the origins of the traffic flows to be examined under other aspects of the overall GMP. In order to garner this information, Quorum proposed to contact and forge relationships with a number of potential data providers. Among those whose specific assistance Quorum intended to seek in an on-going survey of commercial freight rates were:
• • •
• • • • • •
Grain companies (including, but not necessarily limited to): Agricore United Saskatchewan Wheat Pool
Common highway carriers (including, but not necessarily limited to)
D. Volk Trucking Westcan Bulk Transport Trimac Transportation System Biggar Transport Yanke Transport
The issues to have been addressed with the trucking industry as well as the stakeholder community in order to enable Quorum to develop the final methodology and data collection processes were:
• The establishment of appropriate communication channels and relationships with commercial carriers engaged in the movement of grain, and convincing these carriers to participate in the program.
• Through interviews with the commercial carriers contacted, industry associations, as well as in-house expertise, assess the current pricing (rate making) policies of the industry, so as to establish a rate basis that may be measured and analyzed within the GMP. This portion of the assessment would ascertain and ensure that the final input numbers were exclusive of any potential add-ons or incentives commonly imputed into the rates presented.
• With consideration to both the number and service areas of those carriers expressing a willingness to participate, establish a statistically valid sampling methodology that provides for proper geographic and commodity coverage.
• Establish an on-going process for the collection of rate data from the participating carriers.
With this, Quorum would be able to provide for the following deliverables:
• The establishment of an appropriate process and methodology for the capturing of commercial freight rates from primary service providers (i.e., grain companies and for-hire highway carriers) within specific geographic areas, including:
• A listing of the firms to be employed in gathering data on an on-going basis • A listing of the specific service areas from which applicable rate data is to be
gathered
Quorum Report – Commercial Trucking Rates in the Movement of Western Canadian Grain February 2002
6
• The establishment of a detailed protocol for the collection and subsequent storage of the information required in the GMP database.
• A base series of commercial trucking rates for the 1999-2000 and 2000-2001 crop years:
• By specific service area; and • By province.
2.1 Work Plan
From the proceeding, Quorum was to assemble a list of the primary for-hire trucking companies operating in Western Canada using a variety of sources, including: provincial trucking associations; producer associations; and government. From this list, a sample of firms – having appropriate services within the physical confines of the GHTS – was to be drawn. These firms would then be contacted and solicited for their participation in an on-going review of commercial trucking rates. It should be noted that the trucking industry is not regulated, and a carrier’s participation in any evaluation of freight rates must – by definition – be voluntary. It was believed from the outset that securing the ongoing cooperation of these firms would require both time and effort. Once the list of participating for-hire trucking firms and grain companies had been established, a process for gathering of rate information on a monthly basis would be developed. In most cases it was expected that this information would be in a paper form; thus necessitating the establishment of a data conversion and entry protocol for the subsequent electronic storage, and retrieval, of this information. The gathering of data pertaining to the last two crop years was expected to prove problematic given that it involved the assembly of historical information not normally maintained in a structured manner by most carriers. Quorum engaged the services of Mr. Brian Dumsday – an Edmonton based consultant in the field of transportation and logistics – to undertake the majority of this assignment.3 Although Mr. Dumsday’s primary efforts were directed towards identifying, contacting, and securing the participation of these various firms in gathering the aforementioned data, he was also charged with gathering the data, and instituting a protocol for its collection on an on-going basis throughout the term of the GMP.
2.2 Scope of the Analysis The design of the GMP required that Quorum provide for a survey of commercial trucking rates throughout the four western provinces – an area encompassing over 2.9 million square kilometers. Given the myriad of possible truck movements that could be undertaken throughout this vast territory, it became necessary to distill these movements into a more representative, and meaningful paradigm. Accordingly, it was decided that the collection of commercial trucking rates would revolve around a series of specific nodes – or grain delivery stations. These nodes would be selected in accordance with the following geographic determinants:
• That each node have at least one licensed primary grain elevator;4 • That the node be railway-served – be it by a major or shortline carrier; • That the distance between nodes be predicated on a trucking radius of no more than 160
kilometres (approximately 100 miles);5 and
3 A professional engineer by training, Mr. Dumsday is a certified management consultant in the area of transportation and logistics, and a partner in the consulting firm SVS Strategic Value Services. 4 Grain delivery nodes were drawn from the Canadian Grain Commission’s listing of licensed primary elevators.
Quorum Report – Commercial Trucking Rates in the Movement of Western Canadian Grain February 2002
7
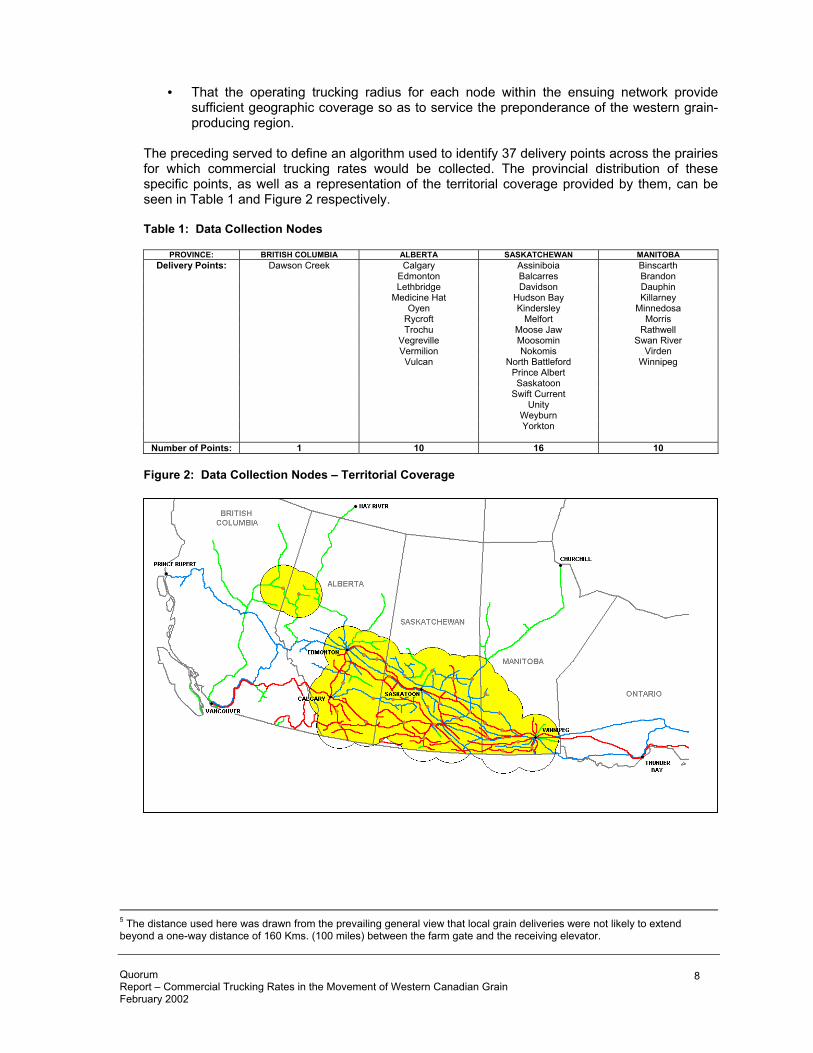
• That the operating trucking radius for each node within the ensuing network provide sufficient geographic coverage so as to service the preponderance of the western grain-producing region.
The preceding served to define an algorithm used to identify 37 delivery points across the prairies for which commercial trucking rates would be collected. The provincial distribution of these specific points, as well as a representation of the territorial coverage provided by them, can be seen in Table 1 and Figure 2 respectively. Table 1: Data Collection Nodes
PROVINCE: BRITISH COLUMBIA ALBERTA SASKATCHEWAN MANITOBA Delivery Points: Dawson Creek Calgary Assiniboia Binscarth
Edmonton Balcarres Brandon Lethbridge Davidson Dauphin Medicine Hat Hudson Bay Killarney Oyen Kindersley Minnedosa Rycroft Melfort Morris Trochu Moose Jaw Rathwell Vegreville Moosomin Swan River Vermilion Nokomis Virden Vulcan North Battleford Winnipeg Prince Albert Saskatoon Swift Current Unity Weyburn Yorkton
Number of Points: 1 10 16 10 Figure 2: Data Collection Nodes – Territorial Coverage
5 The distance used here was drawn from the prevailing general view that local grain deliveries were not likely to extend beyond a one-way distance of 160 Kms. (100 miles) between the farm gate and the receiving elevator.
Quorum Report – Commercial Trucking Rates in the Movement of Western Canadian Grain February 2002
8
3.0 General Findings
3.1 Background Building on the aforementioned methodology, Quorum initially contacted the trucking associations based in Canada’s four western provinces to seek their assistance in identifying carriers engaged in transporting grain between the farm gate and local primary elevators.6 In general terms, these organizations affirmed that such shipments – when not undertaken by the producer himself – were primarily handled by smaller carriers operating under contract to the major grain companies. Moreover, while larger carriers were known to transport grain, these movements generally centred on serving the long-haul, rather than short-haul, market. Typically, such services were performed on behalf of a few key customers whose time-sensitive need for a particular quantity and grade of grain would occasion its highway movement to a particular terminal elevator (such as at Thunder Bay).7 The consultant verified these comments in subsequent discussions with representatives from a number of the member firms represented by these organizations, including Wiebe Transport (Grande Prairie), Yanke Transport (Saskatoon) Direct West Carriers (Saskatoon) It should also be noted that none of the firms contacted expressed a willingness to participate in any on-going monitoring of commercial trucking rates. Recent changes at the Alberta Motor Transport Association (AMTA) has seen an increase in membership, including a large number of small, independent commercial carriers who focus on grain hauling. Peter Vaudry, Member Services, noted that many of these new members operate fleets of between one and five vehicles and haul grain and other items when it appears to be economically viable. Mr. Vaudry went on to indicate that in many cases, grain hauling is more of a sideline rather than the main source of income for many of these operations. These operations will transport from the farm to the grain elevator on their own behalf and then charge their neighbours for the same service when both equipment and time are available. The actual rates charged for these moves often vary by trip and as a result, are difficult to track on an ongoing basis. This information on the grain hauling marketplace was confirmed by Jim Friesen, General Manager of the Saskatchewan Trucking Association (STA), who went on to indicate that the small operator, those with five or fewer vehicles, is more dominant in Saskatchewan than in Alberta. A member of the Grain Sector Task Force of Alberta Agriculture and Rural Development who was contacted mentioned that up until about six to eight years ago, the Department prepared and distributed an annual listing of commercial grain hauling carriers. The service was discontinued when it was discovered that the listing was out-of-date the minute it was published due to high turnover within the industry. Numerous small carriers would operate for one season and then sell-off their equipment the next year, or simply choose not to haul due to the high cost and low return. In many instances, these small carriers were unaware of the actual cost of operating their equipment and would frequently contact the Department to obtain information on the appropriate rate to charge for their carrier services. During our review, we had the opportunity to speak with Ron Wiebe, President of Wiebe Transportation operating out of Grande Prairie, Alberta. Mr. Wiebe indicated that their prime market is long haul, including direct loads from the farm or elevator to major customers or the coast. As noted, these movements are outside the scope of this review, however, Mr. Wiebe went on to say that on occasion and as a service to their customers, they will handle the short-
6 These included specifically: the Manitoba Trucking Association, the Saskatchewan Trucking Association, the Alberta Motor Transport Association, and the British Columbia Trucking Association. 7 Such long-haul movements are beyond the scope of the monitoring activity prescribed by the Federal government. Only those freight rates tied to the short-haul truck movement of grain from the producer’s farm to a local elevator need be monitored.
Quorum Report – Commercial Trucking Rates in the Movement of Western Canadian Grain February 2002
9

hauls (farm to elevator). The concern over the short-haul market is that it is complicated and difficult to ensure ongoing profitability. He noted that frequently, there is a large demand for short-haul trucking over short periods, which makes it difficult to ensure consistent utilization of equipment and manpower. He went on to say that often, short-haul trucking is a part-time venture that many of the carriers in this category operate through the Agricore United and the SWP transport programs, as does Wiebe Transportation, although resorting to this sales vehicle on a limited basis. A discussion with Russell Marcoux, CEO of Yanke Group of Companies, headquartered in Saskatoon, Saskatchewan, mirrored the comments offered by Ron Wiebe. Mr. Marcoux indicated that Yanke has been out of the hopper-bottom grain transport market for almost sixteen years, opting for dry van long-haul transport of bagged product. Mr. Marcoux went on to confirm that the number of short-haul carriers in Saskatchewan is higher than that experienced in either Alberta or Manitoba and many operate through one of the two major programs. He went on to say that for those loads outside the program, freight cost monitoring would be difficult due to the inconsistency of rates on a load-by-load basis. Mr. Doug Machibroda, President of Direct West Carriers, Saskatoon, Saskatchewan, operates a fleet of eleven hopper-bottom trucks to transport grain and other bulk products from terminal-to-terminal and terminal-to-major customers. Mr. Machibroda indicated that at one time, farm pick-ups and delivery to elevators was a major source of their business but now it comprises 5% or less of annual revenue. He cited the seasonality of the farm pick-up market, spring seeding and fall harvesting, as being down-times that make commercial trucking a less viable option. He went on to note that another concern is the lack of proper equipment, at the farm site, to accurately weigh the trailer load, adding doubt as to whether the shipment exceeds the legal limit or not. This is more significant when you consider that many of the farm sites are on secondary roads. Instead, producers, especially those in the 4,000 to 10,000 acre range, operate their own trucks or fleet of trucks. Some of these producers could also haul for their neighbours, although most operate with only farm registered licensing.
3.2 Grain Companies are the Chief Suppliers of Commercial Trucking Services
These consultations effectively served to steer Quorum towards the one remaining group of stakeholders known to provide direct trucking services – the larger grain companies such as Agricore Cooperative Ltd. (Agricore), Saskatchewan Wheat Pool (SWP), and United Grain Growers Limited (UGG). According to statistics from the Canadian Grain Commission, there were some 685 licensed elevators in operation across Canada as at August 1, 2001. With 180 elevators, Agricore accounted for just over a quarter of these; all but five being located in the provinces of Manitoba and Alberta.8 Conversely, while SWP operated some 137 elevators across the prairies at this same point in time – including 14 relatively large facilities in the provinces of Manitoba and Alberta – the preponderance of these were located in Saskatchewan.9 In similar measure, UGG operated another 82 elevators, with the majority – some 64 in total – being Saskatchewan-based. Despite operating in largely distinct geographic spheres, these three firms constituted the largest of the grain companies operating in Western Canada. Together they accounted for 58% of the
8 Agricore Cooperative Ltd. was formed in the wake of a merger between its predecessors: Manitoba Pool Elevators and Alberta Wheat Pool. As a result, the company’s primary elevator facilities are highly concentrated in the provinces of Manitoba and Alberta. The company’s presence in both Saskatchewan and British Columbia is extremely limited; operating but two elevators in the former, and three in the latter. 9 Saskatchewan Wheat Pool has two distinct geographic business entities: Saskatchewan Wheat Pool, which operates primary grain elevators located in the province of Saskatchewan; and AgPro Grain, which operates the company’s elevators in the provinces of Manitoba and Alberta.
Quorum Report – Commercial Trucking Rates in the Movement of Western Canadian Grain February 2002
10
licensed elevators that formed the backbone of GHTS as at August 1, 2001.10 And while it might be questioned whether focusing on the activities of only three firms provides a sufficient basis for an objective examination of commercial trucking rates, the relative scope of their elevator operations offers ample assurance that any ensuing analysis will provide reasonable insight into the commercial trucking costs borne by the typical Western Canadian grain producer. Given the preceding, the consultant concluded that the most practical means by which to secure insight into both past and present commercial trucking rates for grain delivery, was to focus on the activities of these major grain companies. The aforementioned grain companies were then approached, and presented with the primary objective of the monitoring exercise, namely:
“To monitor the effective mileage-based, per tonne cost to producers for the commercial haulage of grain from distances of up to 160 kilometres (100 miles) into 37 selected delivery points located throughout Western Canada (see Table 1)”.
Each was made cognizant of the fact that the review was to span not only the preceding two crop years, but was also to carry forward throughout the term of the GMP, and would involve the gathering of data on a monthly basis. It should be noted that owing to the throws of reorganization within both Agricore and UGG as a result of the merger then taking place between the two companies, Quorum was unable to secure the cooperation of UGG in its study of commercial trucking rates.11 Both Agricore and SWP, however, expressed a willingness to share rate data pertaining to the 1999-2000 and 2000-01 crop years with Quorum . Moreover, both firms indicated that they would be equally willing to support Quorum’s efforts to monitor these rates on an on-going basis under the Grain Monitoring Program.12 In ensuing discussions with both Agricore and SWP, these companies confirmed that their trucking services were built around the use of smaller independent trucking firms operating under contract to the grain companies themselves. Structurally, the trucking programs for both firms closely parallel each other. Each employs a small armada of independent contractors to furnish their “in-house” trucking services. Producers wishing to avail themselves of the convenience inherent in such services, merely arrange with the grain company on the specifics of the on-farm pick-up. Charges for such services are subsequently levied as a deduction on the cash ticket issued to the producer at the time the elevator delivery is made. More importantly, both companies noted that despite the adoption of such programs, producers have largely continued to undertake local elevator delivery of their grain using their own equipment. Agricore ventured that approximately two-thirds of the overall grain deliveries made to the company in the preceding year were by producers who employed their own equipment rather than commercial trucking services.13 Underscoring its experience with the “Smart Haul” program, Agricore also observed that only a fifth of the overall deliveries were affected through the use of
10 On November 1, 2001, Agricore Cooperative Ltd. merged with United Grain Growers Limited (UGG) to form Agricore United. Adjusting for this, the recast statistics for Agricore United show that the company owned a full 38% of the licensed elevators in operation at the beginning of the 2001-2002 crop year. 11 Agricore indicated that the trucking activities of both Agricore and UGG were to be amalgamated in the near future, with overall corporate responsibility to be assumed by the management of the former Agricore transportation group. Although Agricore was unable to shed light on UGG rates specifically, it was noted that the rate structures were known to be very similar. Moreover, it was noted that Agricore United’s future plans involved standardizing the existing service offerings under a uniform rate structure applicable to all elevator locations. 12 Agricore United and Saskatchewan Wheat Pool organizations have agreed to work with Quorum in the monitoring of past, present, and future trucking rates. 13 Although these comments were largely echoed by SWP, neither firm was willing to provide detailed information concerning the relative volumes cited.
Quorum Report – Commercial Trucking Rates in the Movement of Western Canadian Grain February 2002
11
its in-house trucking service.14 By extension, this implies that only 14% of grain deliveries are made using independent commercial trucking services. On the whole, this offers sufficient evidence to the effect that the rates associated with their “in-house” trucking services provide a reasonable estimate of prevailing commercial trucking rates.
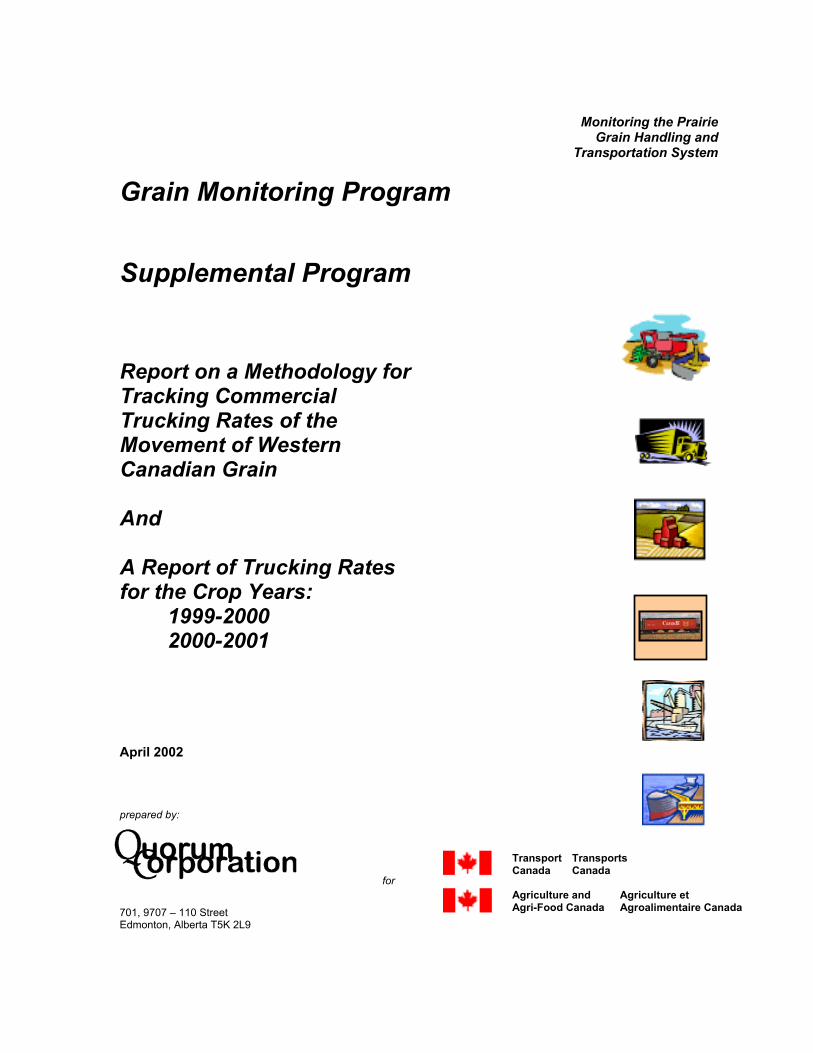
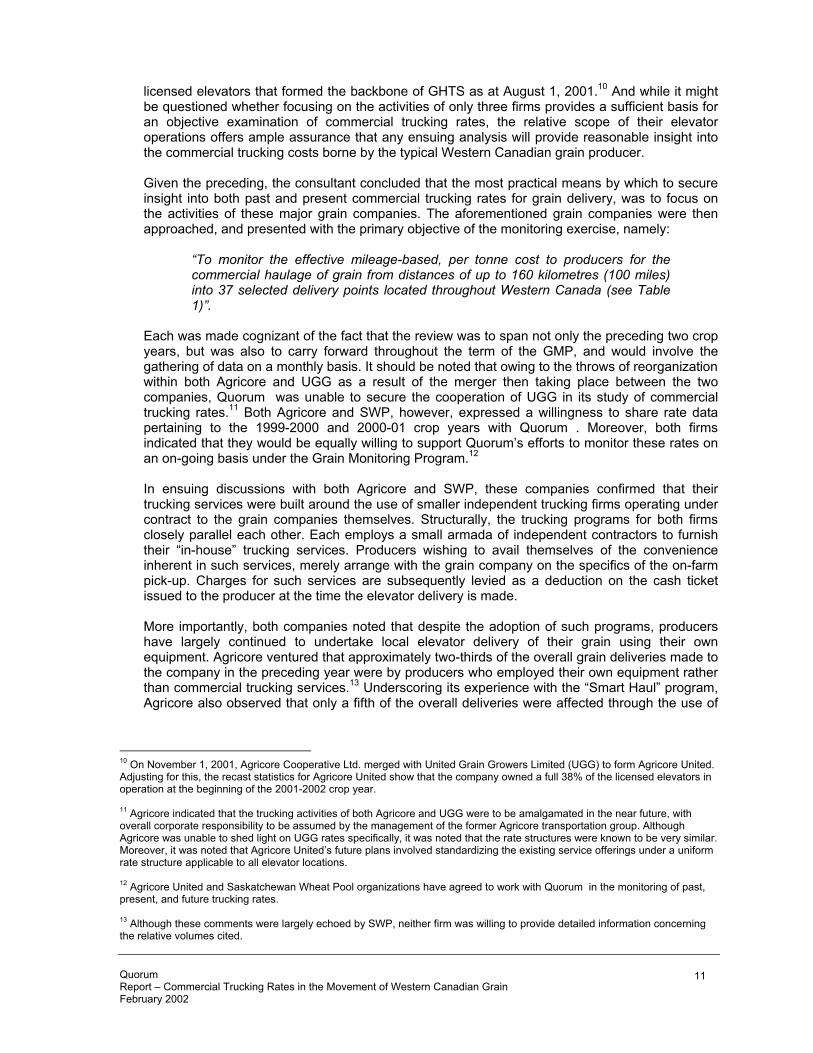
3.3 General Rate Structures 1999 - 2001 The results of this review clearly indicate that – for the most part – both Agricore and SWP offer producers similar trucking services, albeit at marginally differing costs. Moreover, neither of the trucking rates published by these firms has changed materially since the 1999-2000 crop year. The nominal freight rates assessed under Agricore’s “Smart Haul” program have remained unchanged since the beginning of the 1999-2000 crop year. They were, however, made subject to the application of a 6% fuel surcharge introduced at the close of the 2000 calendar year. 15 Although reportedly not always assessed by the company, this effectively raised the cost of transportation to producers using their “in-house” service correspondingly. The rates in effect under this program are presented in Table 2 and Figure 3. Table 2: Commercial Trucking Rates – Agricore Cooperative Ltd.
CALENDAR YEAR Distance (miles 16) 1999 2000 2001 (1)
0 – 15 4.00 4.00 4.24 16 – 25 4.50 4.50 4.77 26 – 35 5.00 5.00 5.30 36 – 45 5.50 5.50 5.83 46 – 55 6.00 6.00 6.36 56 – 70 7.00 7.00 7.42 71 – 85 8.00 8.00 8.48 86 – 100 9.00 9.00 9.54
Notes: (1) – Rates in effect as at January 1, 2001, as a result of an imposed 6% fuel surcharge
Figure 3: Commercial Trucking Rates – Agricore Cooperative Ltd.
0.00
2.00
4.00
6.00
8.00
10.00
12.00
10 20 30 40 50 60 70 80 90 100
Miles
Dolla
rs p
er T
onne
A grico re (A UG 99) A grico re (JA N 01)
14 Unless otherwise stated, all information pertaining to the trucking activities of Agricore are attributable to that of the “pre-merger” Agricore Cooperative Ltd. only. 15 In the face of a significant jump in fuel prices during the 2000-01 crop year, a number of transportation companies sought to apply an additional “fuel surcharge” to the freight rates normally borne by their customers. A recent fall in fuel prices has, however, reduced the pressure on these companies to apply such cost-recovery mechanisms.
Quorum Report – Commercial Trucking Rates in the Movement of Western Canadian Grain February 2002
12
16 Transportation rates (both rail and truck) when distance based are mileage based (as opposed to kilometres). Quorum has maintained that convention for the sake of consistency.
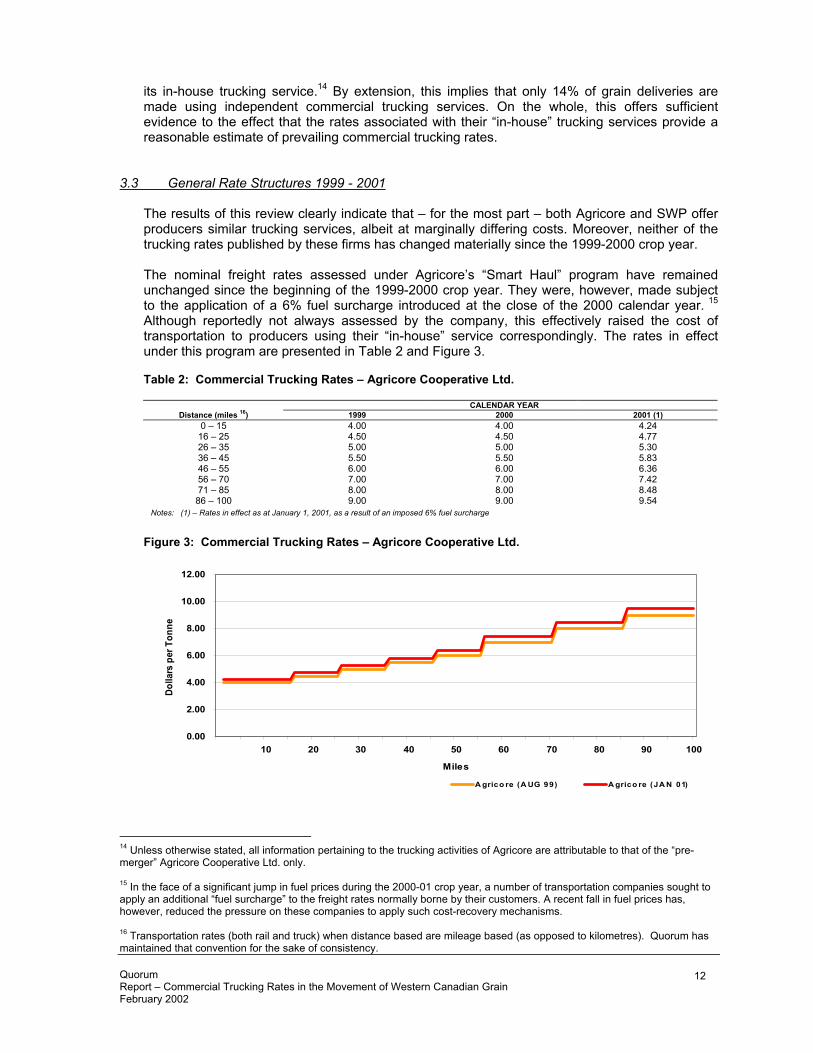
Agricore stated that the rates published under this program have equal application to all provinces in which the company conducts elevator operations – that is to say, Manitoba, Saskatchewan, Alberta, and British Columbia. The company also indicated that despite perceptions to the contrary, it rarely offers producers a trucking incentive – traditionally taking the form of a reduction from posted tariff levels – in order to entice farmers into delivering their grain to an Agricore facility. In keeping with this, it was also noted that when such instruments are employed, they seldom reflect any discernable pattern.17 In an effort to help Quorum gauge the typical haulage distance witnessed in local grain deliveries using these services, Agricore agreed to review its computer records. This examination revealed that an average movement involved a haul of 63 kilometres (39.4 miles), with a payload weight of 33 tonnes. Like Agricore, the rates assessed by SWP for its “in-house” trucking services remained unchanged throughout the period under review. Yet, unlike Agricore, the company chose not to apply a fuel surcharge to a rate structure that was already some 15% higher than that of its rival. Although a partial explanation for this difference may be found in the fact that the bulk of the company’s operations are located in the province of Saskatchewan, rather than those of either Manitoba or Alberta, where the cost of fuel is known to be higher. Nevertheless, SWP noted that its published rates – which are strictly distance driven – applied equally to all of its elevators locations, including those operated in neighbouring provinces under the trade name AgPro Grain. These rates are depicted in Table 3 and Figure 4. In parallel with statements made by Agricore, SWP also indicated that – for the most part – its published trucking rates were those that the producer effectively paid when delivering his grain to an SWP elevator. Acknowledging that discounts were used if there was a perceived need to “pull” grain in from surrounding farms, SWP was quick to echo the sentiments voiced by Agricore: that such incentives were seldom employed, and only if deemed merited by particular circumstances. Although SWP was unable to share any documented data pertaining to the characteristics of a typical movement – be it in terms of payload weights or distances – it was generally ventured that the average haul distance was probably in the range of 64 kilometres (40 miles). While not scientifically derived, this is consistent with the database analysis conducted by Agricore. Table 3: Commercial Trucking Rates – Saskatchewan Wheat Pool / AgPro Grain
CALENDAR YEAR Distance (miles) 1999 2000 2001
0 – 10 4.75 4.75 4.75
11 – 20 5.00 5.00 5.00 21 – 30 5.25 5.25 5.25 31 – 40 6.00 6.00 6.00 41 – 50 6.75 6.75 6.75 51 – 60 7.30 7.30 7.30 61 – 70 8.25 8.25 8.25 71 – 80 9.00 9.00 9.00 81 – 90 9.65 9.65 9.65 91 – 100 10.10 10.10 10.10
17 Quorum cannot confirm the veracity of this assertion. Indeed, such assertions run counter to the general comments heard from other stakeholder groups wherein it is claimed that trucking incentives are commonplace. What is at issue is not the use of such instruments but the frequency with which they are used, and the relative size of the financial benefit obtained from their use.
Quorum Report – Commercial Trucking Rates in the Movement of Western Canadian Grain February 2002
13
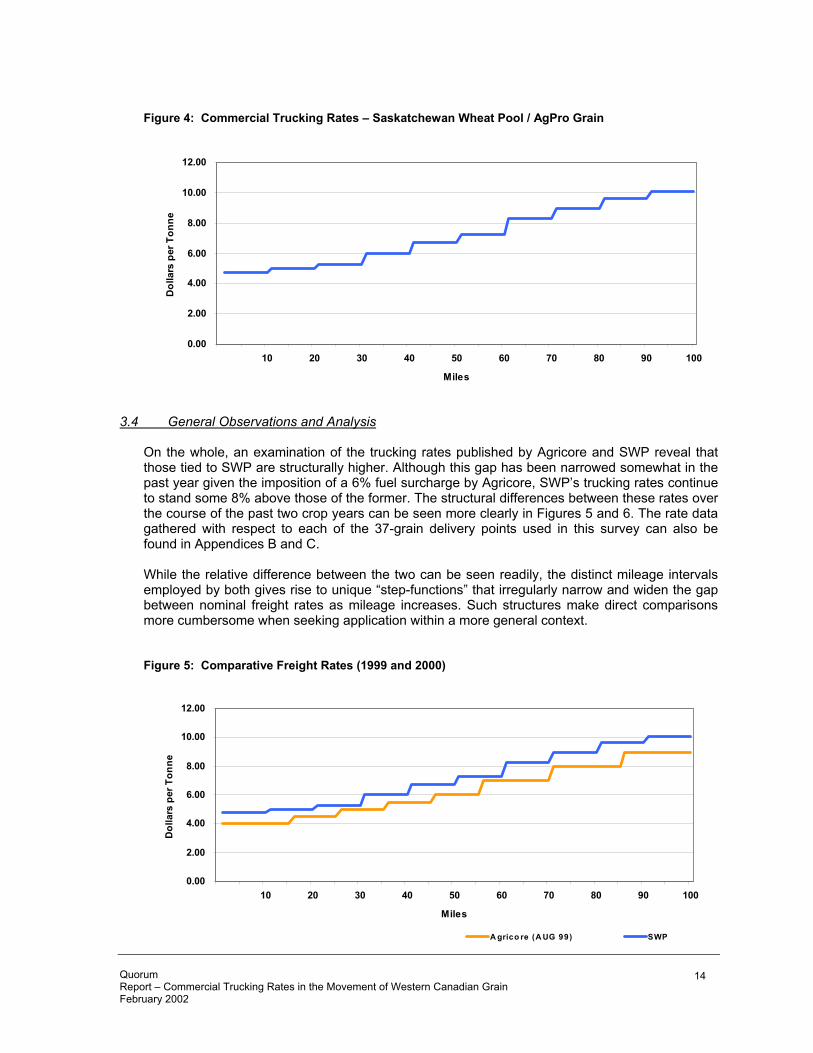
Figure 4: Commercial Trucking Rates – Saskatchewan Wheat Pool / AgPro Grain
0.00
2.00
4.00
6.00
8.00
10.00
12.00
10 20 30 40 50 60 70 80 90 100
Miles
Dol
lars
per
Ton
ne
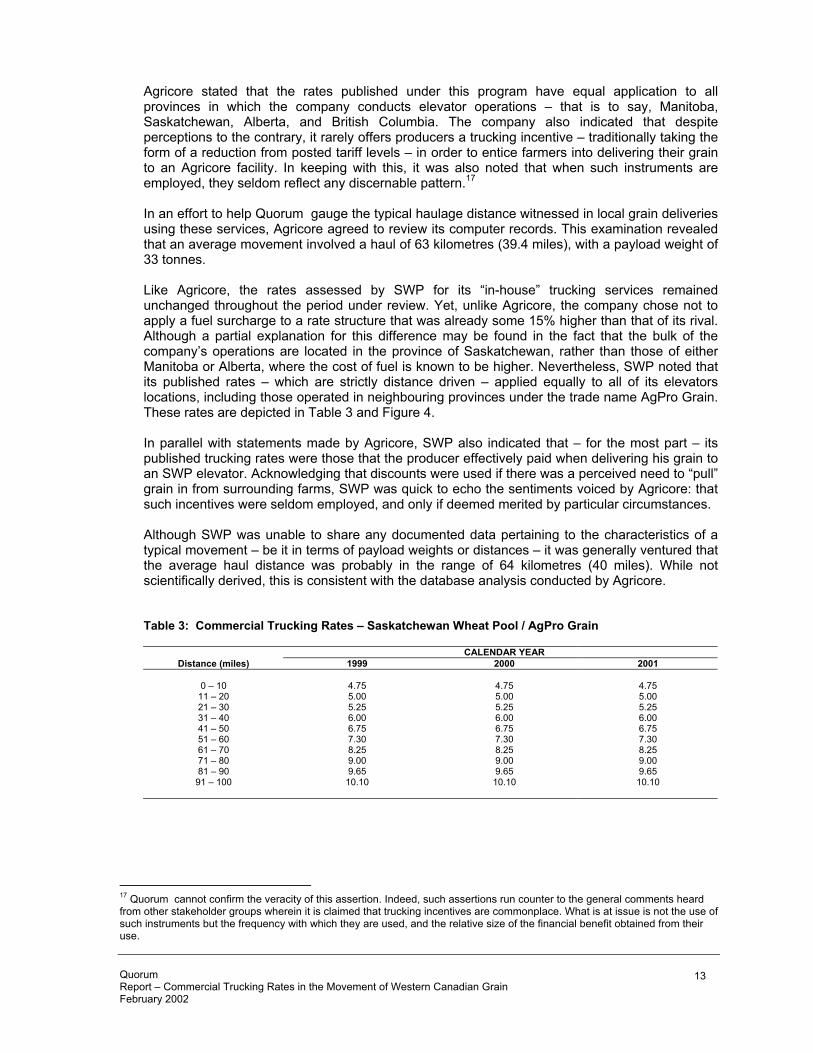
3.4 General Observations and Analysis On the whole, an examination of the trucking rates published by Agricore and SWP reveal that those tied to SWP are structurally higher. Although this gap has been narrowed somewhat in the past year given the imposition of a 6% fuel surcharge by Agricore, SWP’s trucking rates continue to stand some 8% above those of the former. The structural differences between these rates over the course of the past two crop years can be seen more clearly in Figures 5 and 6. The rate data gathered with respect to each of the 37-grain delivery points used in this survey can also be found in Appendices B and C. While the relative difference between the two can be seen readily, the distinct mileage intervals employed by both gives rise to unique “step-functions” that irregularly narrow and widen the gap between nominal freight rates as mileage increases. Such structures make direct comparisons more cumbersome when seeking application within a more general context. Figure 5: Comparative Freight Rates (1999 and 2000)
0.00
2.00
4.00
6.00
8.00
10.00
12.00
10 20 30 40 50 60 70 80 90 100
Miles
Dol
lars
per
Ton
ne
A grico re (A UG 99) SWP
Quorum Report – Commercial Trucking Rates in the Movement of Western Canadian Grain February 2002
14
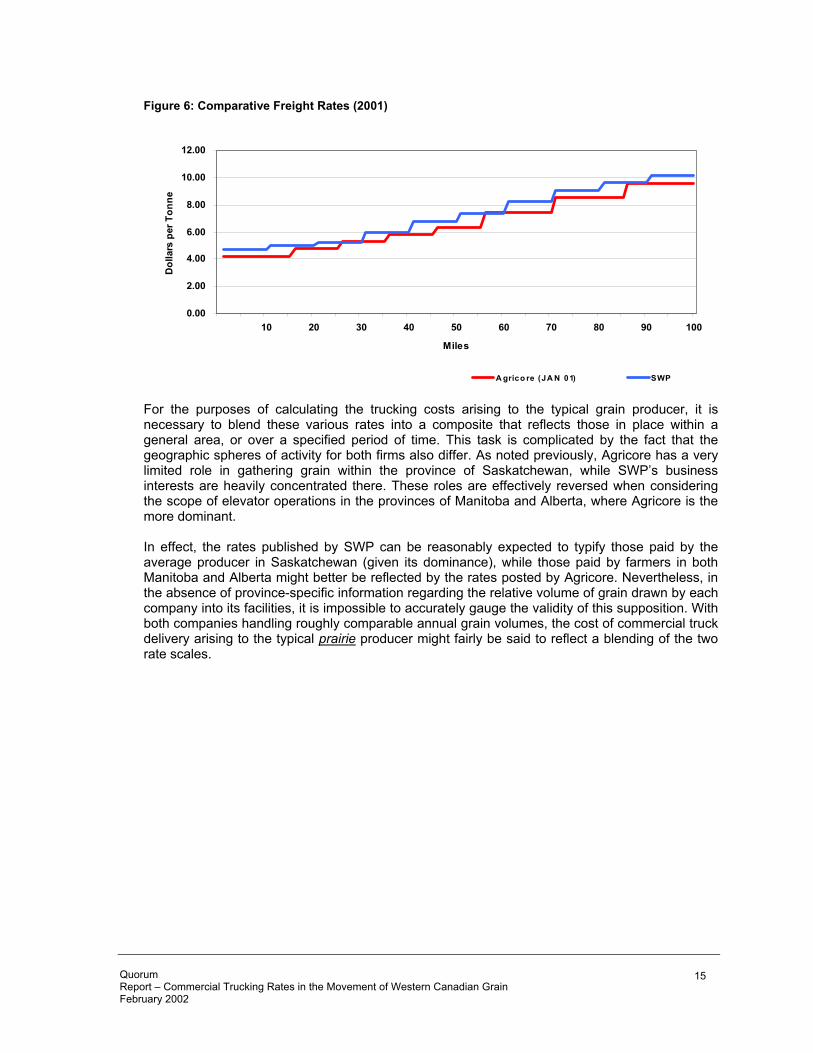
Figure 6: Comparative Freight Rates (2001)
0.00
2.00
4.00
6.00
8.00
10.00
12.00
10 20 30 40 50 60 70 80 90 100
Miles
Dol
lars
per
Ton
ne
A grico re (JA N 01) SWP
For the purposes of calculating the trucking costs arising to the typical grain producer, it is necessary to blend these various rates into a composite that reflects those in place within a general area, or over a specified period of time. This task is complicated by the fact that the geographic spheres of activity for both firms also differ. As noted previously, Agricore has a very limited role in gathering grain within the province of Saskatchewan, while SWP’s business interests are heavily concentrated there. These roles are effectively reversed when considering the scope of elevator operations in the provinces of Manitoba and Alberta, where Agricore is the more dominant. In effect, the rates published by SWP can be reasonably expected to typify those paid by the average producer in Saskatchewan (given its dominance), while those paid by farmers in both Manitoba and Alberta might better be reflected by the rates posted by Agricore. Nevertheless, in the absence of province-specific information regarding the relative volume of grain drawn by each company into its facilities, it is impossible to accurately gauge the validity of this supposition. With both companies handling roughly comparable annual grain volumes, the cost of commercial truck delivery arising to the typical prairie producer might fairly be said to reflect a blending of the two rate scales.
Quorum Report – Commercial Trucking Rates in the Movement of Western Canadian Grain February 2002
15
4.0 Summary and Recommendation As mentioned earlier in this document, the trucking industry in Canada is a commercially autonomous entity and is not obligated to report commercial terms or rates to any regulatory body. The present state of the business segment managing the commercial grain movement by truck can at best be described as unstructured and of questionable stability. The single exception to this fact is the trucking programs managed through Agricore United and Saskatchewan Wheat Pool.
4.1 Summary of Research and Analysis In the analysis, Quorum went to considerable lengths to find alternate means by which to examine and find a method of tracking commercial truck rates for the movement of grain products and found that an examination of rates as presented and published through these programs as being the single best and most consistent manner to accomplish the task. Other alternatives that were explored included requests from specific trucking companies. The bulk of these companies are small one or two unit operations with no stable or permanent administrative process, and therefore not in a position to provide either base year statistics or a consistent basis of ongoing rates. Utilizing the grain company methodology allows for the Monitor to acquire a strong base year data set as well as a consistent flow of ongoing data. In working with the two-grain companies it was found that the preponderance of grain moved to country elevators is done so by or under the control of the producer. SWP estimates two thirds of producers are delivering their own product and Agricore four fifths. By extension, this implies that only 14% of grain deliveries are made using independent commercial trucking services. As stated above, this offers sufficient evidence that the rates associated with their “in-house” trucking services provide a reasonable estimate of prevailing commercial trucking rates. The two programs are very similar in their administrative practices and application. The rate structure, while having some marked differentiations in structure are similarly constricted in terms of mileage level steps in the actual rate.
4.2 Recommended Methodology and Rate Tables
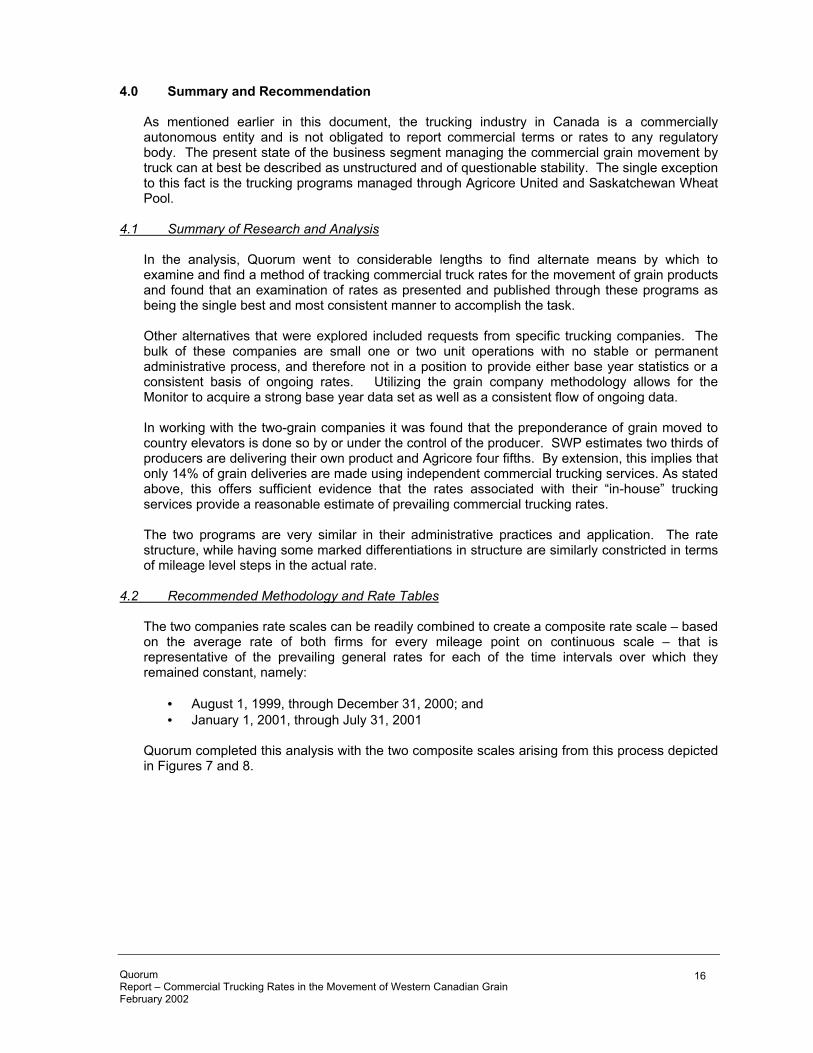
The two companies rate scales can be readily combined to create a composite rate scale – based on the average rate of both firms for every mileage point on continuous scale – that is representative of the prevailing general rates for each of the time intervals over which they remained constant, namely:
• August 1, 1999, through December 31, 2000; and • January 1, 2001, through July 31, 2001
Quorum completed this analysis with the two composite scales arising from this process depicted in Figures 7 and 8.
Quorum Report – Commercial Trucking Rates in the Movement of Western Canadian Grain February 2002
16
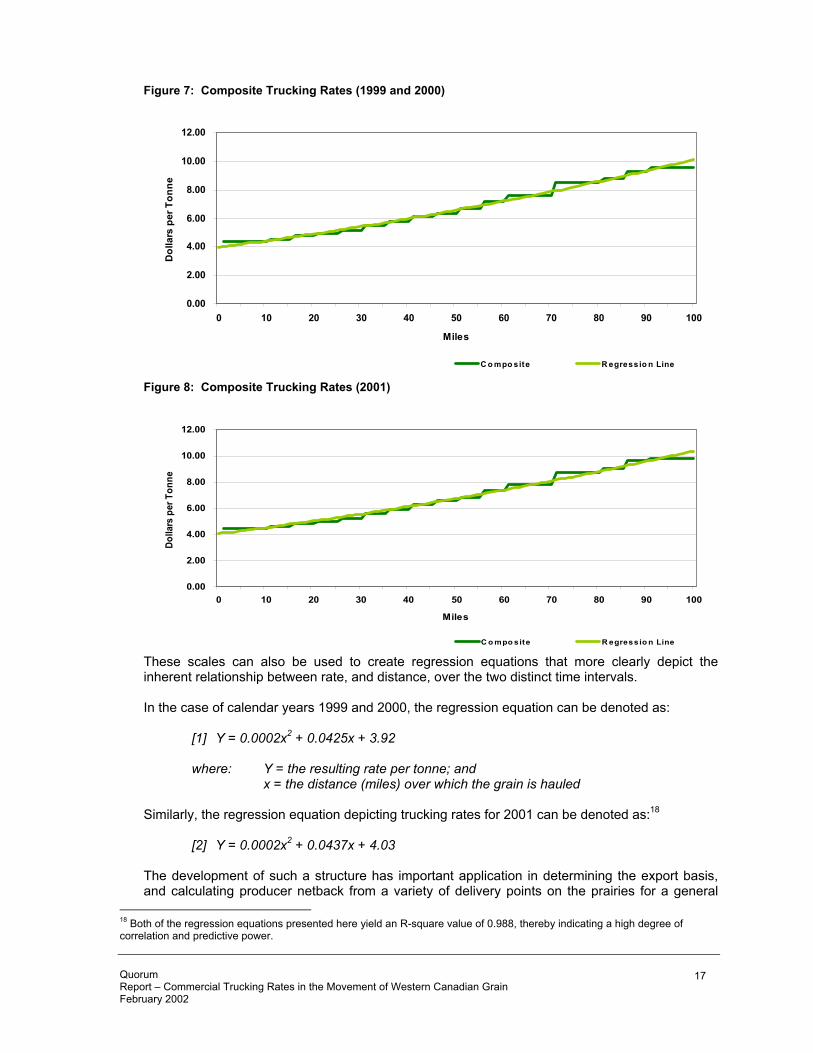
Figure 7: Composite Trucking Rates (1999 and 2000)
0.00
2.00
4.00
6.00
8.00
10.00
12.00
0 10 20 30 40 50 60 70 80 90 100
Miles
Dol
lars
per
Ton
ne
C o mpo site R egressio n Line
Figure 8: Composite Trucking Rates (2001)
0.00
2.00
4.00
6.00
8.00
10.00
12.00
0 10 20 30 40 50 60 70 80 90 100
Miles
Dolla
rs p
er T
onne
C o mpo site R egressio n Line
These scales can also be used to create regression equations that more clearly depict the inherent relationship between rate, and distance, over the two distinct time intervals. In the case of calendar years 1999 and 2000, the regression equation can be denoted as:
[1] Y = 0.0002x2 + 0.0425x + 3.92 where: Y = the resulting rate per tonne; and x = the distance (miles) over which the grain is hauled
Similarly, the regression equation depicting trucking rates for 2001 can be denoted as:18
[2] Y = 0.0002x2 + 0.0437x + 4.03 The development of such a structure has important application in determining the export basis, and calculating producer netback from a variety of delivery points on the prairies for a general
18 Both of the regression equations presented here yield an R-square value of 0.988, thereby indicating a high degree of correlation and predictive power.
Quorum Report – Commercial Trucking Rates in the Movement of Western Canadian Grain February 2002
17
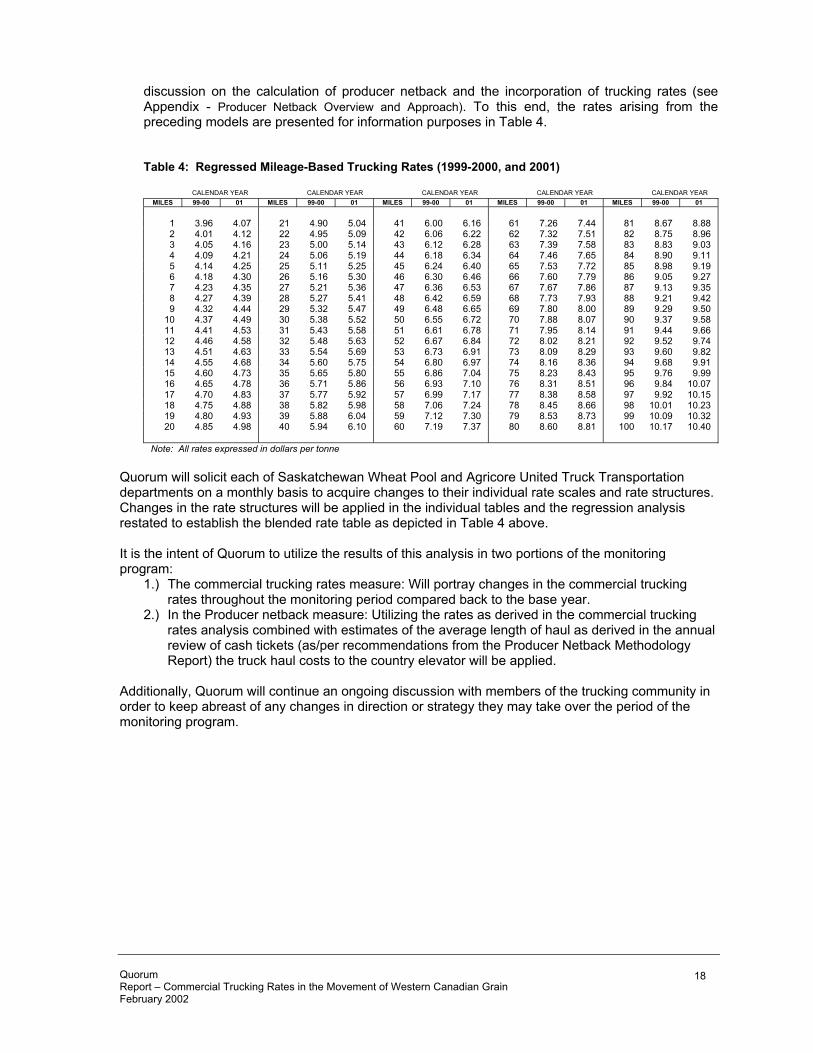
discussion on the calculation of producer netback and the incorporation of trucking rates (see Appendix - Producer Netback Overview and Approach). To this end, the rates arising from the preceding models are presented for information purposes in Table 4. Table 4: Regressed Mileage-Based Trucking Rates (1999-2000, and 2001)
CALENDAR YEAR CALENDAR YEAR CALENDAR YEAR CALENDAR YEAR CALENDAR YEAR MILES 99-00 01 MILES 99-00 01 MILES 99-00 01 MILES 99-00 01 MILES 99-00 01
1 3.96 4.07 21 4.90 5.04 41 6.00 6.16 61 7.26 7.44 81 8.67 8.88 2 4.01 4.12 22 4.95 5.09 42 6.06 6.22 62 7.32 7.51 82 8.75 8.96 3 4.05 4.16 23 5.00 5.14 43 6.12 6.28 63 7.39 7.58 83 8.83 9.03 4 4.09 4.21 24 5.06 5.19 44 6.18 6.34 64 7.46 7.65 84 8.90 9.11 5 4.14 4.25 25 5.11 5.25 45 6.24 6.40 65 7.53 7.72 85 8.98 9.19 6 4.18 4.30 26 5.16 5.30 46 6.30 6.46 66 7.60 7.79 86 9.05 9.27 7 4.23 4.35 27 5.21 5.36 47 6.36 6.53 67 7.67 7.86 87 9.13 9.35 8 4.27 4.39 28 5.27 5.41 48 6.42 6.59 68 7.73 7.93 88 9.21 9.42 9 4.32 4.44 29 5.32 5.47 49 6.48 6.65 69 7.80 8.00 89 9.29 9.50
10 4.37 4.49 30 5.38 5.52 50 6.55 6.72 70 7.88 8.07 90 9.37 9.58 11 4.41 4.53 31 5.43 5.58 51 6.61 6.78 71 7.95 8.14 91 9.44 9.66 12 4.46 4.58 32 5.48 5.63 52 6.67 6.84 72 8.02 8.21 92 9.52 9.74 13 4.51 4.63 33 5.54 5.69 53 6.73 6.91 73 8.09 8.29 93 9.60 9.82 14 4.55 4.68 34 5.60 5.75 54 6.80 6.97 74 8.16 8.36 94 9.68 9.91 15 4.60 4.73 35 5.65 5.80 55 6.86 7.04 75 8.23 8.43 95 9.76 9.99 16 4.65 4.78 36 5.71 5.86 56 6.93 7.10 76 8.31 8.51 96 9.84 10.07 17 4.70 4.83 37 5.77 5.92 57 6.99 7.17 77 8.38 8.58 97 9.92 10.15 18 4.75 4.88 38 5.82 5.98 58 7.06 7.24 78 8.45 8.66 98 10.01 10.23 19 4.80 4.93 39 5.88 6.04 59 7.12 7.30 79 8.53 8.73 99 10.09 10.32 20 4.85 4.98 40 5.94 6.10 60 7.19 7.37 80 8.60 8.81 100 10.17 10.40
Note: All rates expressed in dollars per tonne
Quorum will solicit each of Saskatchewan Wheat Pool and Agricore United Truck Transportation departments on a monthly basis to acquire changes to their individual rate scales and rate structures. Changes in the rate structures will be applied in the individual tables and the regression analysis restated to establish the blended rate table as depicted in Table 4 above. It is the intent of Quorum to utilize the results of this analysis in two portions of the monitoring program:
1.) The commercial trucking rates measure: Will portray changes in the commercial trucking rates throughout the monitoring period compared back to the base year.
2.) In the Producer netback measure: Utilizing the rates as derived in the commercial trucking rates analysis combined with estimates of the average length of haul as derived in the annual review of cash tickets (as/per recommendations from the Producer Netback Methodology Report) the truck haul costs to the country elevator will be applied.
Additionally, Quorum will continue an ongoing discussion with members of the trucking community in order to keep abreast of any changes in direction or strategy they may take over the period of the monitoring program.
Quorum Report – Commercial Trucking Rates in the Movement of Western Canadian Grain February 2002
18
APPENDIX
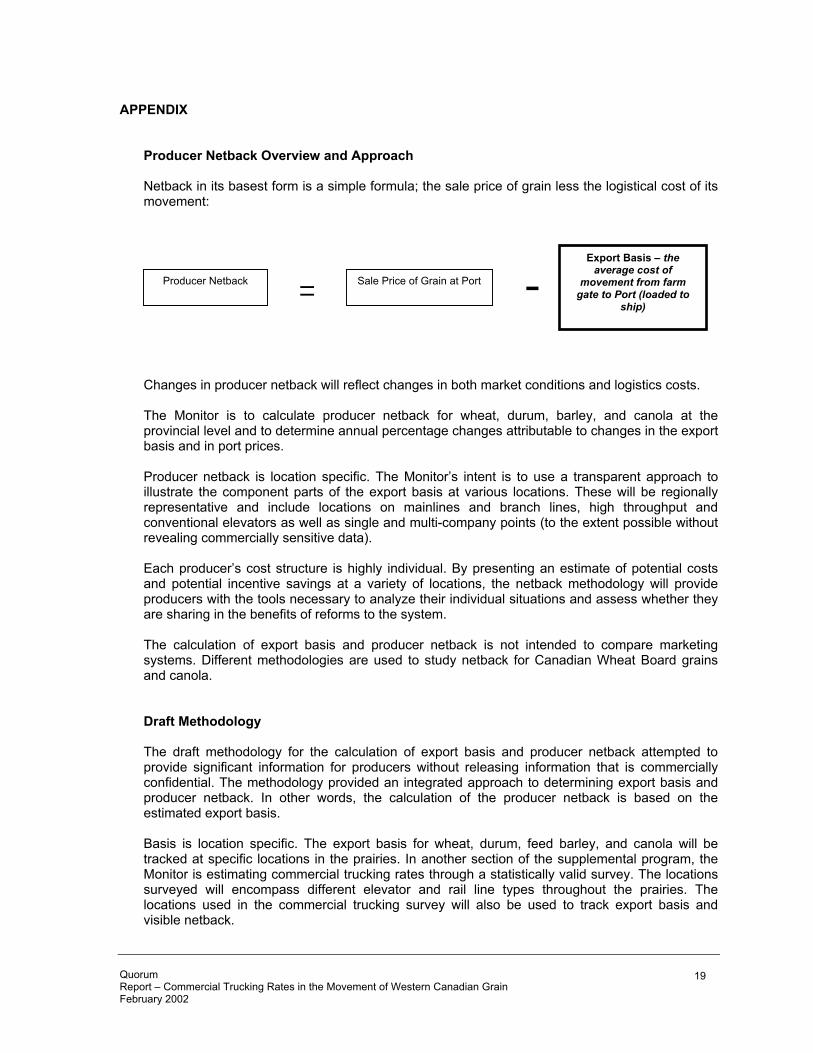
Producer Netback Overview and Approach Netback in its basest form is a simple formula; the sale price of grain less the logistical cost of its movement:
-=Producer Netback
Export Basis – the average cost of
movement from farm gate to Port (loaded to
ship)
Sale Price of Grain at Port
Changes in producer netback will reflect changes in both market conditions and logistics costs. The Monitor is to calculate producer netback for wheat, durum, barley, and canola at the provincial level and to determine annual percentage changes attributable to changes in the export basis and in port prices. Producer netback is location specific. The Monitor’s intent is to use a transparent approach to illustrate the component parts of the export basis at various locations. These will be regionally representative and include locations on mainlines and branch lines, high throughput and conventional elevators as well as single and multi-company points (to the extent possible without revealing commercially sensitive data). Each producer’s cost structure is highly individual. By presenting an estimate of potential costs and potential incentive savings at a variety of locations, the netback methodology will provide producers with the tools necessary to analyze their individual situations and assess whether they are sharing in the benefits of reforms to the system. The calculation of export basis and producer netback is not intended to compare marketing systems. Different methodologies are used to study netback for Canadian Wheat Board grains and canola. Draft Methodology The draft methodology for the calculation of export basis and producer netback attempted to provide significant information for producers without releasing information that is commercially confidential. The methodology provided an integrated approach to determining export basis and producer netback. In other words, the calculation of the producer netback is based on the estimated export basis. Basis is location specific. The export basis for wheat, durum, feed barley, and canola will be tracked at specific locations in the prairies. In another section of the supplemental program, the Monitor is estimating commercial trucking rates through a statistically valid survey. The locations surveyed will encompass different elevator and rail line types throughout the prairies. The locations used in the commercial trucking survey will also be used to track export basis and visible netback.
Quorum Report – Commercial Trucking Rates in the Movement of Western Canadian Grain February 2002
19
The Monitor is to track changes in the export basis from the base year 1999-2000 forward. This methodology for determining CWB export basis allows 2000 crop years and us to “backtrack” and determine the export basis for CWB grains at specific locations for the 1999. The Winnipeg Commodity Exchange (WCE) maintains a historical database of the basis for canola and could provide the historical and future annual data to the Monitor. The WCE does not split the basis into its components. The draft methodology would allow the Monitor to measure changes in the export basis and producer netback from the base year forward. Wheat, Durum, and Feed Barley The methodology for calculating the total export basis for CWB wheat, durum, and feed barley is as follows: 1.) Determine the applicable rail freight: The applicable rail freight for wheat and durum is the lesser of the rail freight to Thunder Bay plus the appropriate Freight Adjustment Factor (FAF) or the rail freight to Vancouver. For feed barley, the applicable freight deduction equals the lesser of the rail freight to Thunder Bay plus the eastern FAF or the rail freight to Vancouver plus the western FAF. 2.) Adjust the applicable rail freight for incentive rates: Reduce the applicable freight rate by the incentive rate for the size of the car spot. If there is more than one company at a location a simple average will be calculated. It is important to note that incentive rates provide only a potential reduction in the basis. The extent to which this reduction is passed on to producers is at the discretion of the grain companies. 3.) Add the cost of commercial trucking from the farm to the elevator. 4.) Add the primary tariff for elevation. If there is more than one company at a location a simple average will be calculated. The figure used in the calculation is the maximum amount that can be charged – the potential charge. 5.) Add the primary tariff for dockage (terminal cleaning). If there is more than one company at a location a simple average will be calculated. The figure used in the calculation is the maximum amount that can be charged – the potential charge. 6.) Add the CWB pool account costs for operations. Subsequent to consultations with industry stakeholders, proposed enhancements include:
o Flag CGC fees as being part of the primary handling tariffs or separate item where applicable19
o Incorporate the Churchill rebate where applicable
o Incorporate CWB tendering rebate20
The visible producer netback for wheat, durum, and feed barley is calculated as follows:
19 WGEA members incorporate the CGC fees into their primary tariffs. ITAC members now show CGC fees as a separate item on cash tickets. The export basis calculations must allow for CGC fees as a separate item at some locations. 20 The CWB will be passing the savings from its tendering programs back to producers. The distribution of the savings will occur through the pool accounts. Thus all producers will receive a portion of the tendering program, not just those producers whose grain moved under the program.
Quorum Report – Commercial Trucking Rates in the Movement of Western Canadian Grain February 2002
20
1.) Adjust the CWB final price for the CWB operating costs (increase the final price by the CWB
operating costs).
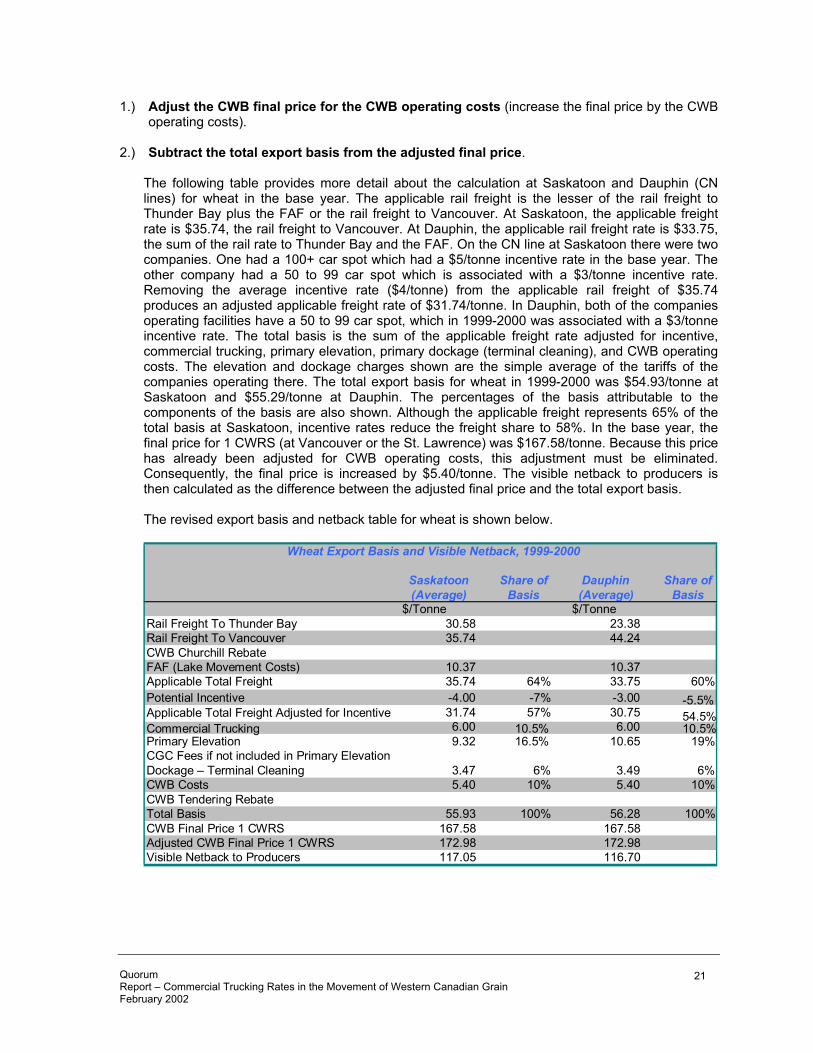
2.) Subtract the total export basis from the adjusted final price. The following table provides more detail about the calculation at Saskatoon and Dauphin (CN lines) for wheat in the base year. The applicable rail freight is the lesser of the rail freight to Thunder Bay plus the FAF or the rail freight to Vancouver. At Saskatoon, the applicable freight rate is $35.74, the rail freight to Vancouver. At Dauphin, the applicable rail freight rate is $33.75, the sum of the rail rate to Thunder Bay and the FAF. On the CN line at Saskatoon there were two companies. One had a 100+ car spot which had a $5/tonne incentive rate in the base year. The other company had a 50 to 99 car spot which is associated with a $3/tonne incentive rate. Removing the average incentive rate ($4/tonne) from the applicable rail freight of $35.74 produces an adjusted applicable freight rate of $31.74/tonne. In Dauphin, both of the companies operating facilities have a 50 to 99 car spot, which in 1999-2000 was associated with a $3/tonne incentive rate. The total basis is the sum of the applicable freight rate adjusted for incentive, commercial trucking, primary elevation, primary dockage (terminal cleaning), and CWB operating costs. The elevation and dockage charges shown are the simple average of the tariffs of the companies operating there. The total export basis for wheat in 1999-2000 was $54.93/tonne at Saskatoon and $55.29/tonne at Dauphin. The percentages of the basis attributable to the components of the basis are also shown. Although the applicable freight represents 65% of the total basis at Saskatoon, incentive rates reduce the freight share to 58%. In the base year, the final price for 1 CWRS (at Vancouver or the St. Lawrence) was $167.58/tonne. Because this price has already been adjusted for CWB operating costs, this adjustment must be eliminated. Consequently, the final price is increased by $5.40/tonne. The visible netback to producers is then calculated as the difference between the adjusted final price and the total export basis. The revised export basis and netback table for wheat is shown below.
Saskatoon Share of Dauphin Share of (Average) Basis (Average) Basis
$/Tonne $/TonneRail Freight To Thunder Bay 30.58 23.38Rail Freight To Vancouver 35.74 44.24CWB Churchill Rebate FAF (Lake Movement Costs) 10.37 10.37Applicable Total Freight 35.74 64% 33.75 60%Potential Incentive -4.00 -7% -3.00 -5.5% Applicable Total Freight Adjusted for Incentive 31.74 57% 30.75 54.5% Commercial Trucking 6.00 10.5% 6.00 10.5% Primary Elevation 9.32 16.5% 10.65 19%CGC Fees if not included in Primary ElevationDockage – Terminal Cleaning 3.47 6% 3.49 6% CWB Costs 5.40 10% 5.40 10%CWB Tendering Rebate Total Basis 55.93 100% 56.28 100% CWB Final Price 1 CWRS 167.58 167.58 Adjusted CWB Final Price 1 CWRS 172.98 172.98 Visible Netback to Producers 117.05 116.70
Wheat Export Basis and Visible Netback, 1999-2000
Quorum Report – Commercial Trucking Rates in the Movement of Western Canadian Grain February 2002
21