Embed Size (px)
Citation preview

Agenda•Introductions•Technical Aspects of RtI•Leadership•Campus Culture•Data Sources•Goal Setting•Planning Interventions•District Documentation

Important Points for Success
1. Foundations1. Laws2. Process
2. Format1. District support: Data collection2. District support: Resources –Ease of Implementation
3. Fidelity1. Staff Understanding2. Staff Development
3
Within a strong MTSS system there are non- negotiables. These non-negotiables include 3 points that affect the technical adequacy for suscessful sustained student growth.
Your MTSS problem solving system should always be rooted in Federal and State laws and regulations.There must be a sustem that supports your data colelction. Needs include technology for ease of aggregation of data and access to strong assessment tools that are user friendly and do not take away from instructional time.
Finally all staff need to understand the nature of MTSS, it’s purpose, and be adequately trained on itnerventions, assessment and documentation issues.

08/11/14
From NCLB:“…holding schools, local education agencies, and States
accountable for improving the academic achievement of all students…” and “…promoting schoolwide reform and ensuring the access of all children to effective, scientifically-based instructional strategies…” [PL 107-110 §1001(4) and (9)]
From IDEA:“…to improve the academic achievement and functional
performance of children with disabilities including the use of scientifically based instructional practices, to the maximum extent possible.” [20 U.S.C. 1400(c)(5)(E)]
Technical AdequacyThe District Guidance Document

RtI: Problem Solving
Assessment
80%
15%
5%
Interventions
Universal ScreeningProgress Monitoring
Progress MonitoringDiagnostics
Progress MonitoringDiagnostics
Grade LevelInstruction/ Support
Student Instructional LevelSupplemental Interventions90 min per week additional
Student Instructional LevelSupplemental Interventions120 min per week additional

“I was so excited about RtI -I went about enthusiastically building a technically sound guidance document. As I began to work with staff on implementation [from the cultural perspective of shifting the way we think about problem solving] I realized suddenly that to me, RtI had become….
One swirling VORTEX OF TERROR!”---Dr. Quentin Woods, Pine Tree ISD
The Reality of Striving for the Goal of Change…
RtI

Pair and Share•Have you ever felt like this with regard to RtI? Why?•What has been your greatest challenge with RtI?•List possible solutions with your team members.
On a scale of 1-5 where is your campus as far as implementing a true problem solving process centered around Tier 1?
Do you continue to hear staff refer to RtI as a referral
From the Student Academic Learning,
Mastery, and Achievement
Independent Learner

RtI Foundations for Success1. Multiple Tiers of Instruction and
Assessment2. Using Data: Balanced Assessments3. Technology4. Highly Qualified Staff
The underlying philosophy of MTSS is simple- use increased levels of ADDED supports, align with scholl needs and infrastructure and support your staff.

The strongest processes that show sustained student growth are those that go beyond
technical adequacy….
They are ones that promote a cultural responsiveness to the learning needs of all students (think Tier 1- 80-%)and are not
dependent on a rote “decision rule” of six points on a graph.
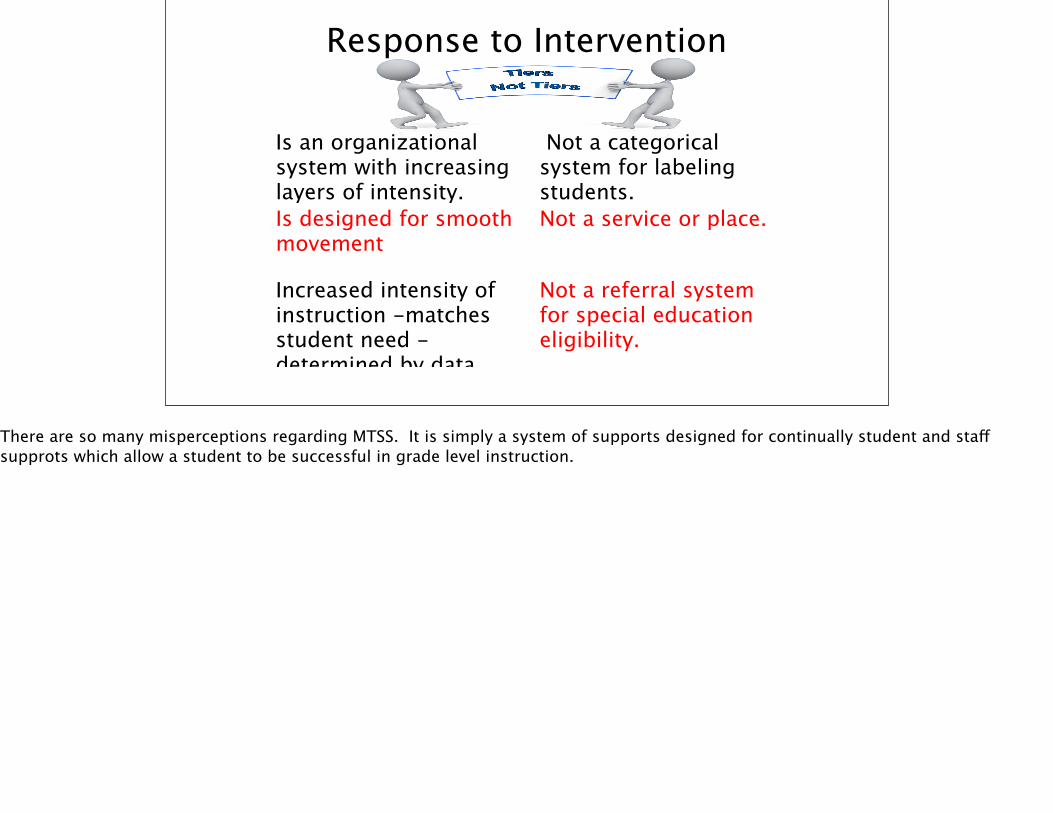
Response to Intervention
Is an organizational system with increasing layers of intensity.
Not a categorical system for labeling students.
Is designed for smooth movement
Not a service or place.
Increased intensity of instruction -matches student need -determined by data.
Not a referral system for special education eligibility.
There are so many misperceptions regarding MTSS. It is simply a system of supports designed for continually student and staff supprots which allow a student to be successful in grade level instruction.

LeadershipThe road to student success begins here….

LeadersLife is short…Every day is a blessing. Every day we work hard to do what’s best for everyone- especially Kids.
The 8th Habit of Higly Effective Leaders
A leader is a person you will follow to a place you would not go by yourself.
15
Joel Barker, Future Edge,
It is about Leadership…
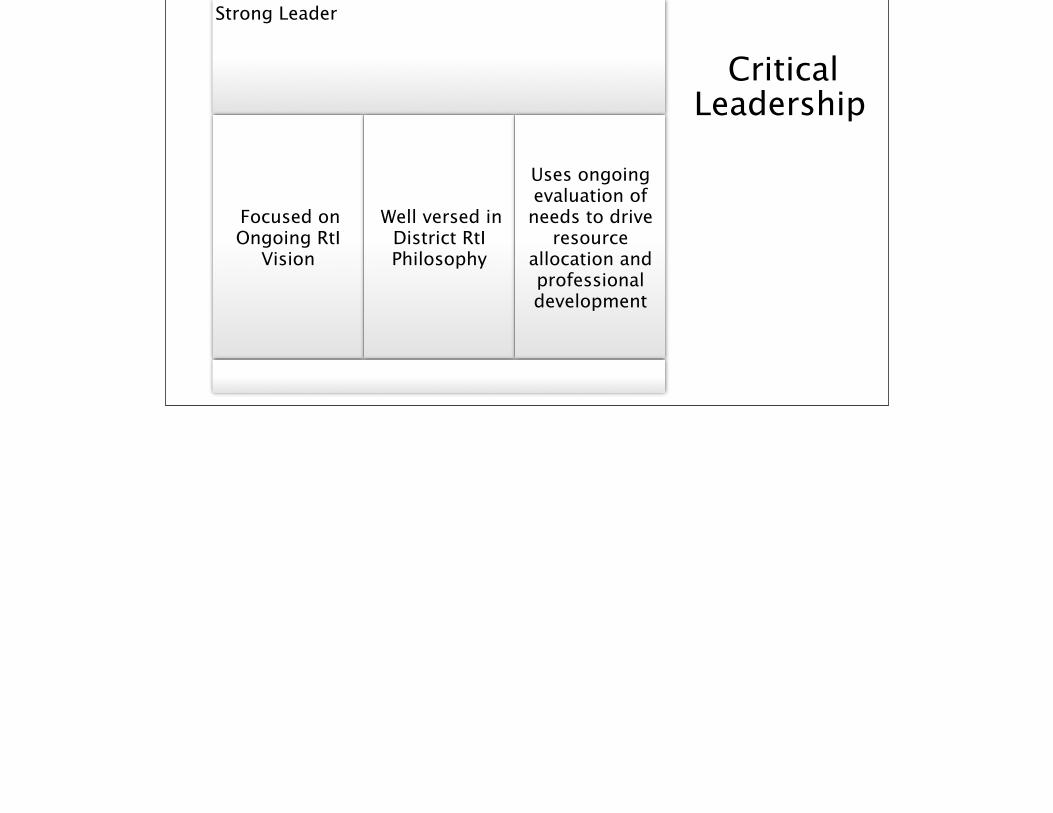
Critical Leadership
Strong Leader
Focused on Ongoing RtI
Vision
Well versed in District RtI Philosophy
Uses ongoing evaluation of needs to drive
resource allocation and professional development

ü Ensure fidelity by having meaningful conversations with staff about data.
ü Create a culture of common values and work together to achieve common goals.ü Provide clear staff expectations
ü Creatively allocate limited resources to ensure personnel have access to
Strong Administrators and Teams
Essential Tasks for Leadership Team
Study and plan ongoing
RtI development.
Embed data based
decisions across all systems
Use hybrid model of problem solving.

Team Essentials
•Data collection and problem solving•Fidelity •Professional Development
20
RtI Team Priorities

•Two types of purposes• 80% rule
• If fewer than 80% of your students are meeting state standards, RtI team meets a minimum of three times per year to address deficits by grade level– team looks at core curriculum and instruction as issues on a scope beyond individual students
• If 80% are meeting state standards, RtI team works with individual students
21
RtI Teams

•Purpose•Identify students who have:
•MARKED DIFFERENCE FROM PEERS IN EDUCATIONAL ATTAINMENT
•NOT BENIFITTING FROM INSTRUCTION •Roles
• Team Leader• Record Keeper• Data Manager• Time Keeper• Case Manager
22
Student Support

•Administrator•General Education Teachers• Counselors / LSSP’s•Special Education Teachers•Specialists (general and Special Education)•Students•Parents
23
What Does the Team Look Like?

•Being a member of the team is, and should be perceived, as a privilege
• Membership is a privilege•Establishing clear roles and responsibilities will contribute to a sense of ownership
24
Team Membership

•Provide differentiate instruction based upon student instructional level
•Gain access to training and support in the use of research-based interventions
•Become proficient in progress-monitoring •Design and implement classroom interventions
25
Team Member Responsibilities: Teachers

•Function as an essential member of the team
•Be active and informed regarding specific expectations concerning academic progress
•Continue to have participatory and approval roles in process
26
Team Member Responsibilities: Parents

• Composition• Principal must lead• Guidance• Someone who can analyze and understand data • Grade level teachers (by grade if necessary)
27
Core Curriculum Support(Evaluates trends based upon Universal Screening data)
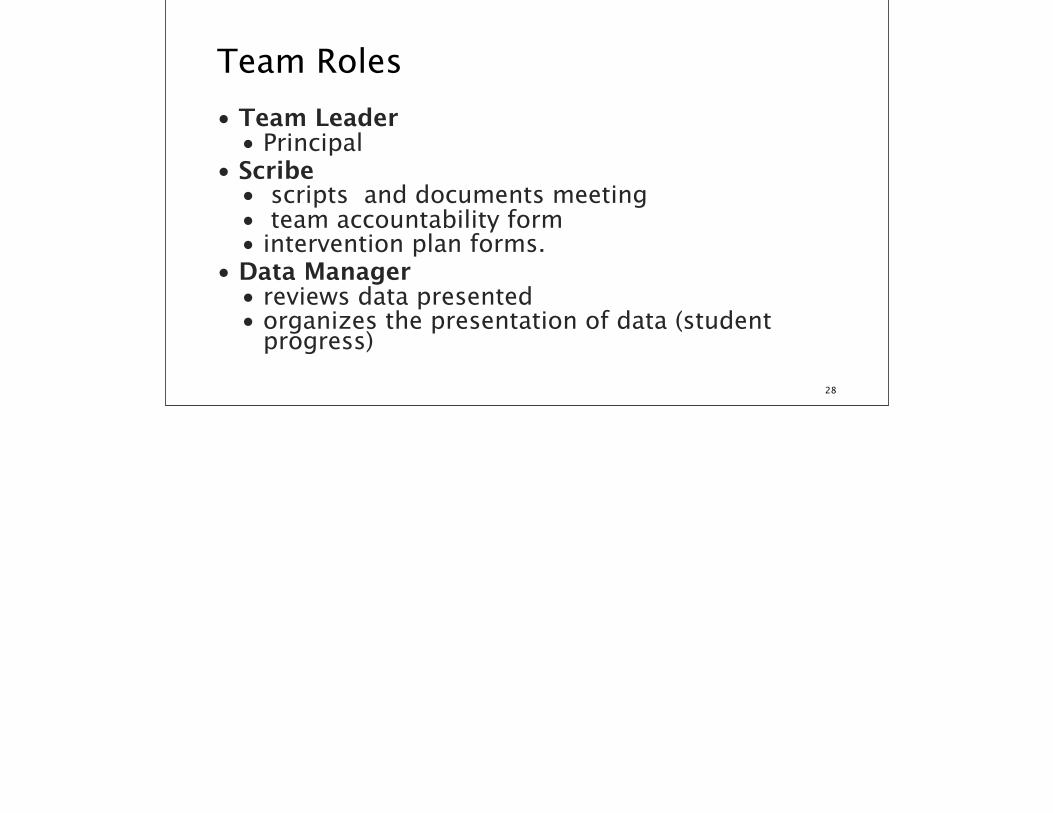
• Team Leader• Principal
• Scribe• scripts and documents meeting • team accountability form • intervention plan forms.
• Data Manager• reviews data presented• organizes the presentation of data (student
progress)
28
Team Roles

•Time Keeper•responsible for keeping the group on task and seeing that all meetings are held in the allotted amount of time.
•Case Manager•consults with teacher of record, a•assembles information on identified student•presenting case to team•monitoring process of intervention.
29
Team Roles

08/11/14 30
Activity : What is effective problem solving?•Think-Write-Share•Working individually first think about how you approach a problem.
• Quickly write the steps of problem solving you typically follow-- try to be specific
•Share with your team. Compare and contrast. What are the implications of varied approaches to
problem solving?

Activity : Role Reflection
31
üSpecific to problem solving and data analysis, what skills/ expertise does your training/ position bring?
üWhat skills/ expertise do you think will be required for effective problem solving and data analysis?
üHow do you envision your role in how RTI will be implemented on your campus?
üHow will your team be involved in maintaining integrity/ fidelity to quality instruction?

Campus Culture

Question
“If an educator keeps using the same strategies over and over and the
student keeps failing,who
Who really is the slow learner?” Michael Rettig
Professor, Emeritus James Madison University

Every organization is perfectly aligned for the results it gets.

Culture
The way you SEE things…..
Determines what you DO
And that determines what you GET.

3 Constants in RtI1. Change2. Principles3. Choice

• Resiliency: Over 40% of teachers do not make it to their 5th year of teaching- many leave by year 3.
• Encouragement of Innovation: PD to support advances in technology. Teachers reinforced and encouraged for “thinking outside the box”.
• Quality of Student teacher relationships
Variables affecting Culture
Warm relationships of mutual respectTeachers/support staff who recognize that students contribute to finding solutions which balance justice, care and truthfulness and conduct their classes based on this philosophyTeachers/support staff who model positive interpersonal behaviorTeacher/support staff styles that stimulate active student participationClasses that promote democratic attitudes and valuesClasses that foster the normative value of helping

The most important aspect of a strong RtI process is the richness of the conversations that occur because
of the layers of multiple occurring data sources.

Alignment, Alignment, AlignmentStudent
Team Process
Instruction / Intervention
Response
08/11/14 40
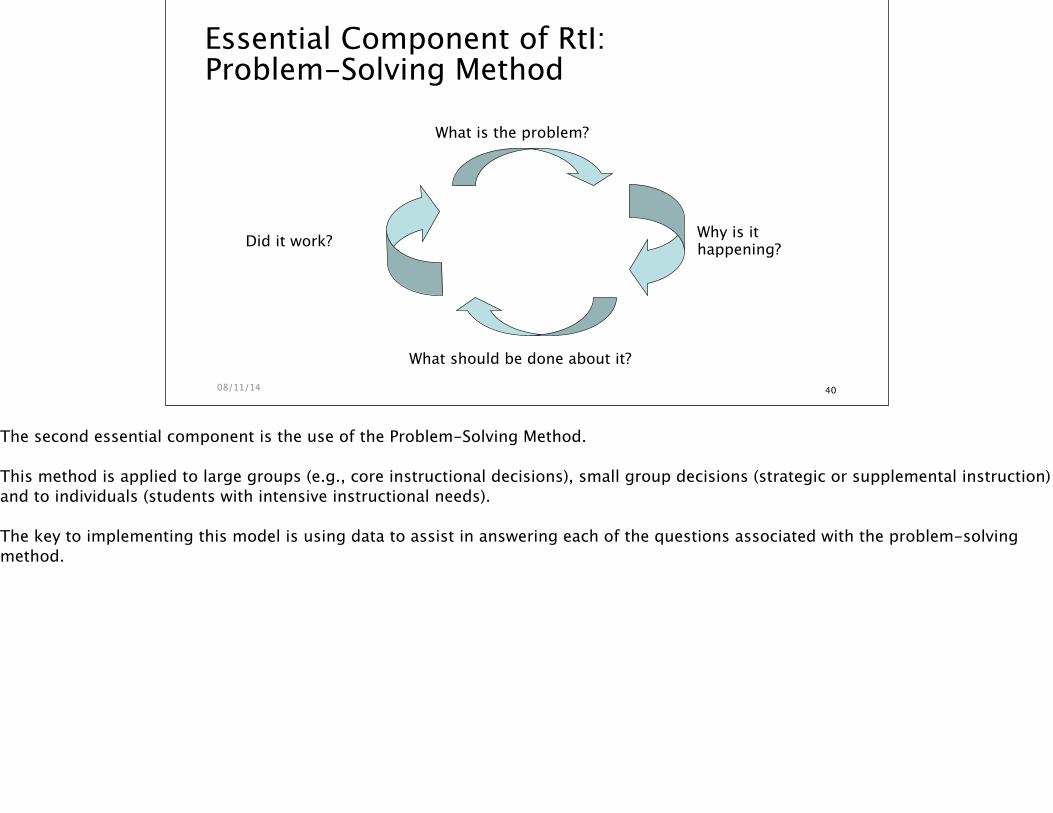
Essential Component of RtI: Problem-Solving Method
What is the problem?
Why is ithappening?
What should be done about it?
Did it work?
The second essential component is the use of the Problem-Solving Method.
This method is applied to large groups (e.g., core instructional decisions), small group decisions (strategic or supplemental instruction) and to individuals (students with intensive instructional needs).
The key to implementing this model is using data to assist in answering each of the questions associated with the problem-solving method.

•Review prepared data sets (Referral) Consultation / Case Facilitation
•Scheduled meeting and attendance•Evidence of linking problem identification to intervention
Team Data Analysis
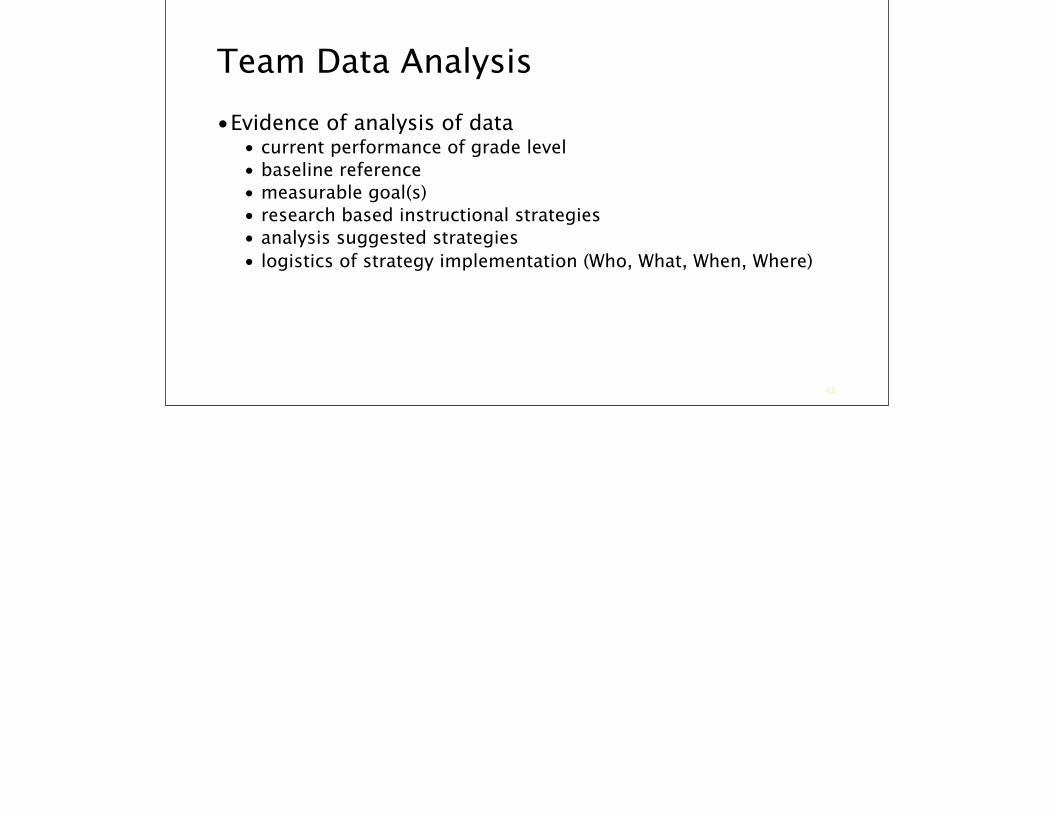
•Evidence of analysis of data• current performance of grade level• baseline reference• measurable goal(s)• research based instructional strategies• analysis suggested strategies• logistics of strategy implementation (Who, What, When, Where)
42
Team Data Analysis
08/11/14
A goal without aplan is just a wish
…focus on the goal to develop the plan
43

Underscoring a Problem: Understanding Data“Most teachers just do not possess the skills to
collect data, draw meaningful conclusions, focus instruction, and appropriately follow up to assess results. That is not the set of skills we were hired
to do.”

08/11/14 45
“Everybody is entitled to their own opinion but they’re not entitled to their own facts. The data is the data.”
Dr. Maria Spiropulu, Physicist
New York Times, 30 September 2003

Data
Q: What type of information do you need regarding the student’s learning that will guide
to effective instruction and intervention?

What to look for:•Adequate access to instruction
•Culturally responsive instruction•Scaffolding (questionnaires, peer mediated)•Meaningful learning activities (anchor activities)•Culturally responsive curriculum•Student-teacher relationships•Progress monitoring

It cannot be emphasized enough the importance of using various data sources for RtI problem solving

What to look for:• Assessment
• Student records (cultural background)• Teacher interviews (awareness of behavior and learning styles of
students with a different cultural background)• Student and family interviews• Progress over time (observations, PM, etc.)• Behavioral checklists• Cognitive and Achievement Assessment

08/11/14
Academic Deficit
•Type of Data• Informal • Criterion-referenced• Curriculum-based (Formative and Summative)• Norm-referenced

Balancing Assessments
-- Assessment systems-- Multiple measures-- Varied types -- Varied purposes-- Varied data sets-- Balanced with needs
51
Purpose of this slide is to see broad data picture; use data from assessments to help you, not just to respond to mandatory testing requirements but to actually use data you gather in your practice.

4 Objectives of RtI Assessment•To inform instructional planning in order to meet the most
critical needs of individual students.•To evaluate whether the instruction or intervention provided
is powerful enough to help all students achieve grade-level standards.
52

4 Objectives of RtI Assessment
•To identify students at the beginning of the year who are at-risk or who are experiencing difficulties and who may need extra instruction or intensive interventions if they are to progress toward grade-level standards .
•To monitor students’ progress during the year to determine whether at-risk students are making adequate progress in critical skills.
53

Multiple Data Sources: ReviewCriterion Referenced Assessment Formative Summative Screen Progress MonitorNorm Referenced Assessment Diagnostic Comparative Progress MonitorCurriculum Based Measurement Rate of Improvement Universal Screen Progress Monitor
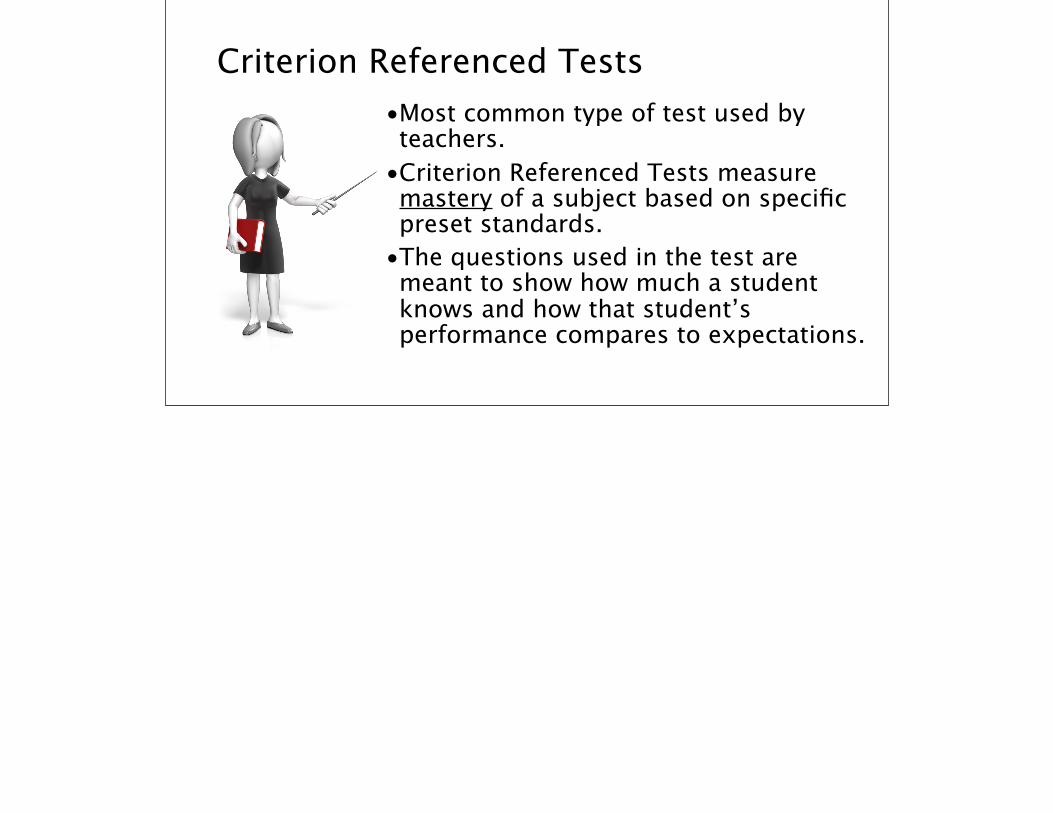
Criterion Referenced Tests•Most common type of test used by teachers.
•Criterion Referenced Tests measure mastery of a subject based on specific preset standards.
•The questions used in the test are meant to show how much a student knows and how that student’s performance compares to expectations.
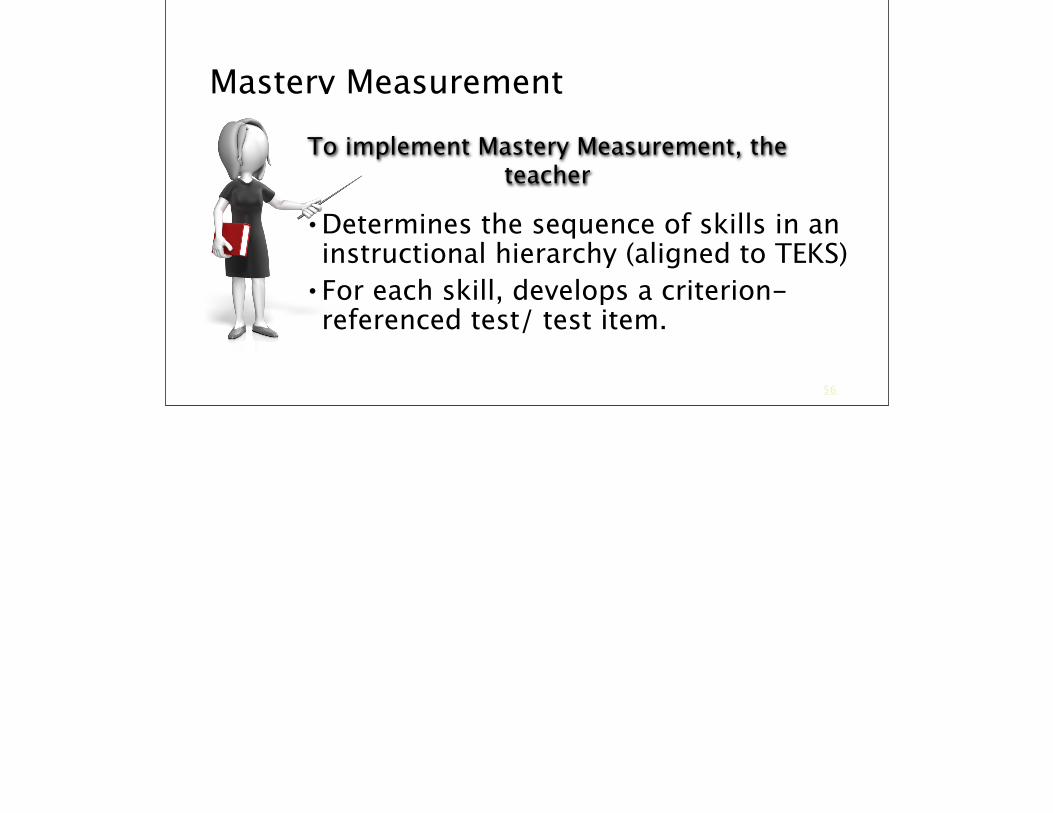
Mastery Measurement
• Determines the sequence of skills in an instructional hierarchy (aligned to TEKS)
• For each skill, develops a criterion-referenced test/ test item.
56
To implement Mastery Measurement, the teacher
Problems with Mastery Measurement• Hierarchy of skills is logical, not empirical.• Performance can be misleading: assessment does not reflect maintenance or generalization.
• Assessment is designed by teachers or sold with textbooks, with unknown reliability and validity.
• Number of objectives mastered does not relate well to performance on high-stakes
57

Norm Referenced Tests
•Norm-referenced tests compare a student's score against the scores of a group of student’s who have already taken the same exam, called the "norm group."
•Score are often interpreted using percentiles.
•Comparative in nature, aligned to researched based developmental and

Curriculum Based Measurement• Describes academic competence at a
single point in time• Quantifies the rate at which students
develop academic competence over time• Used to align and analyze effective
instruction and intervention to increase student achievement
59

Types of Curriculum Based Measurement
•Universal Screening data on all students
provides an indication of individual student performance and progress compared to the peer group’s performance and progress. •Universal Screening data form the basis for examining trends (or patterns)on specific academic or

Types of Curriculum Based Measurement
Progress monitoring documents student growth over time to determine whether thestudent is progressing as expected in the designated level of instructional intervention. Generally this is often presented in graph form.
Multiple Sources Data Activity
Are you smarter than a Statistician (Data Nerd)?

Multiple Sources Data Activity
True or False:
Test bias occurs when one uses a test to predict some criterion of interest results in systematic over- or under- prediction based on group membership.

Multiple Sources Data Activity
True or False: Universal Screening data is provides valuable data that aids in the development of lesson plans for strong Tier 1 instruction.
Why or Why not?

Multiple Sources Data Activity
True or False: In mastery measurement the teacher designs a criterion referenced test with items that match each step in the instructional sequence.
Why or Why not?

Multiple Sources Data ActivityTrue or False: To compare students, it is often easiest to use a norm-referenced test because they were created to rank test-takers.
Why or Why not?
An Introduction to HISD AssessmentsGPISD ISD District RtI Guidelines

Team Philosophy•The 1st intervention is always
effective classroom instruction and classroom management which yield high rates of academic engagement.
•The team always uses the model of problem solving-consultation- instruction/intervention approach.

Problem Identification•Review existing information•Determine student’s functional
level•Identify initial concerns •Analyze multiple data sources•Operationally define the
problem

Existing Data Review•Determine the Student’s
Current Classroom Status: Academic Progress and Work Samples
•Teacher Describes and quantifies concerns
•Review of Records•Parent Contact(s)•Medical Information•Classroom Observations
(ICEL)

Determine Student Functional Levels
•Identify assets and weaknesses• Identify Critical Life Events,
Milestones, Circumstances (Positive and Negative)
• Identify medical and/or physiological sources of concern
• Identify academic variables such as “speed of acquisition” or retention of information
• Identify issues of attendance, transitions, motivation, access to

Identify Initial Concerns
• RtI team is available for any academic, behavioral, teacher or student concern.
•Teacher reports concerns in a data oriented manner.
•Team aligns concerns with data sources

Analyze Multiple Data Sources
Begin With Universal Screening DataüStudent score relative to cut-score in identified
area of concern.§If below cut-score possible need for increased intensity of supports (Tier 2)§If above cut-score instruction is supported through Tier
1 supports

Analyze Multiple Data Sources
Review Teacher Progress Monitoring DataüFormative and Summative Assessments
§Are they differentiated to identified area of concern?§Evidence of alignment to student variables (learning styles)§How does student compare to class peers in the identified area of
concernüStudent Data
§Review student strengths in identified area of concern§Review Student skill deficit/weaknesses in identified area of

Analyze Multiple Data Sources
Analyze Diagnostic Dataü Student strengths and weaknesses relative to identified area of concern
§What specific skills are lacking that present a barrier for student progress?§Need to know developmental acquisition of skills relative to the
identified area of concern.§Is the identified skill deficit significantly below grade
expectations?

Analyze Multiple Data Sources
Review Outcome DataüStudent score relative to peers on district common or benchmark assessmentsüStudent score relative to peers on end of unit or other identified summative assessmentsüStudent score relative to peers on state assessments
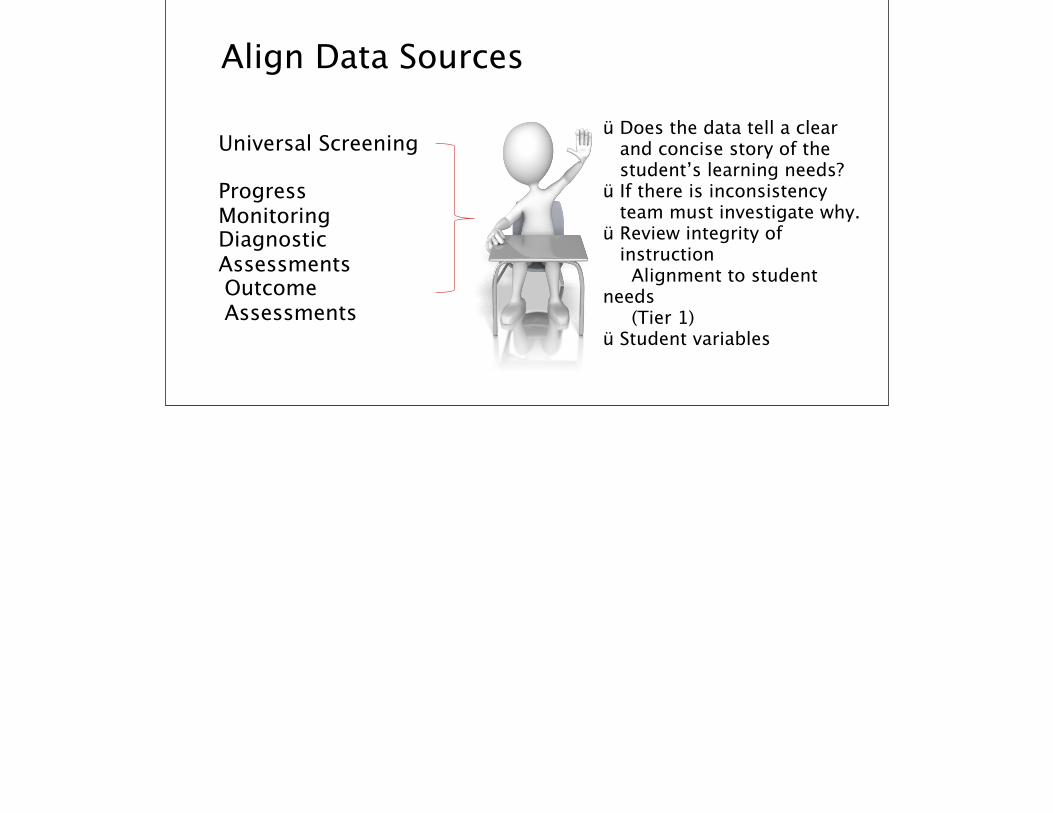
Align Data Sources
Universal Screening
Progress MonitoringDiagnostic AssessmentsOutcome Assessments
ü Does the data tell a clear and concise story of the student’s learning needs?
ü If there is inconsistency team must investigate why.
ü Review integrity of instruction
Alignment to student needs (Tier 1)ü Student variables
Characteristics of a Strong Team§ Meeting Norms
§ Process of Collecting Meaningful Data§ Culture of Collaboration§ Guaranteed and Viable Curriculum§ There is a process to measure where
students are in the curriculum.§ There is a RtI plan in the school district to
help students who are not achieving or who are excelling
Operationally Define The Problem
•Define in measurable terms the area of student need that the intervention design will address.

Goal Setting

General Proceduresü Select goal-level materialü Collect baseline data and set
realistic or ambitious goalsü Administer timed, alternate
measures weeklyü Apply decision-making rules to
graphed data every 6-9 weeks

Goal Setting Methodsü Universal benchmarks (Tier 1)ü Use of growth rates that reflect
typical increases in performance by grade level (Tier 2)
ü Intra-individual framework that accounts for baseline rate of improvement and multiplies rate by 1.5 (Tier 3 and Special Education)

Place Students in a Reading CBM Task•Kindergarten
•Letter Sound Fluency or Phoneme Segmentation Fluency
•Grade 1•Word Identification Fluency
•Grades 2-3•Passage Reading Fluency
•Grades 4-6•Maze Fluency
83
The first decision for implementing CBM in reading is to decide what task is developmentally appropriate for each reader to be monitored. For students who are developing at a typical rate in reading, the correct CBM tasks are as follows:
At Kindergarten, Letter Sound Fluency (or Phoneme Segmentation Fluency).•Select Letter Sound Fluency if you are more interested in measuring students' progress toward actual decoding.•Select Phoneme Segmentation Fluency if you are more interested in measuring students' progress toward phonological awareness.
At Grade 1, Word Identification Fluency.
At Grades 2-3, Passage Reading Fluency.
At Grades 4-6, Maze Fluency.
Once you select a task for CBM progress monitoring (and for Passage Reading Fluency or Maze Fluency, a grade level of passages for progress monitoring), stick with that task (and level of passages) for the entire intervention phase.
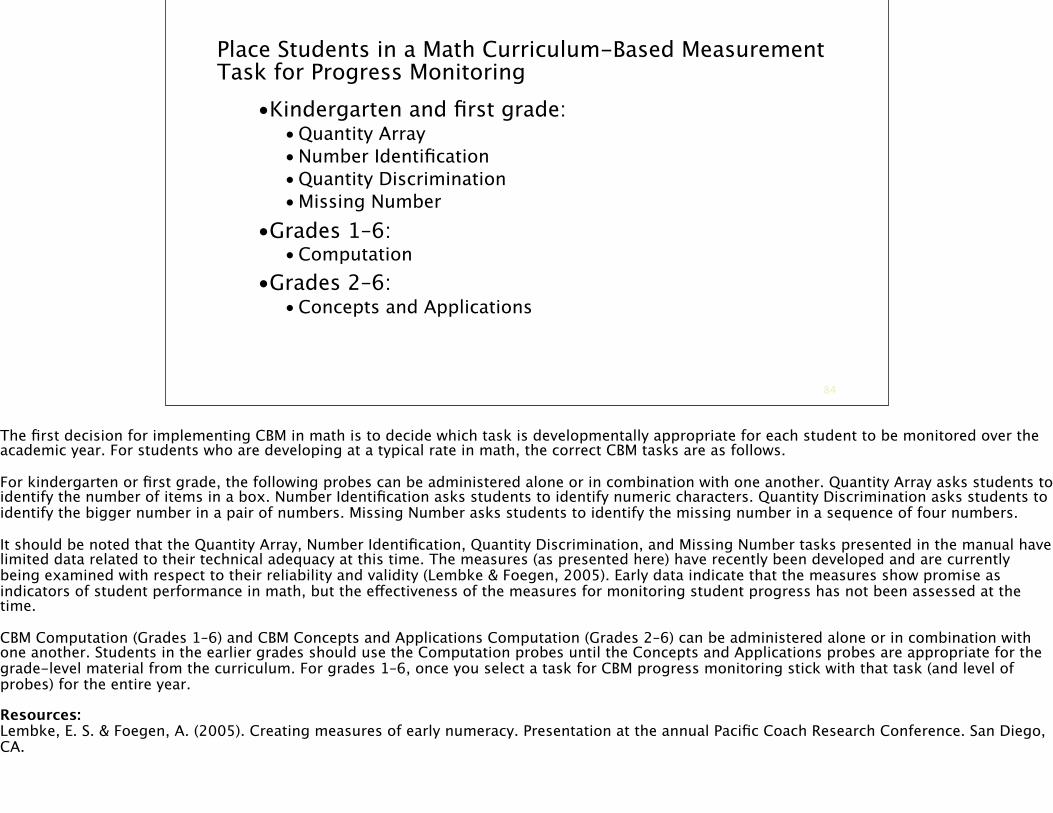
Place Students in a Math Curriculum-Based Measurement Task for Progress Monitoring
•Kindergarten and first grade:• Quantity Array• Number Identification• Quantity Discrimination• Missing Number
•Grades 1–6:• Computation
•Grades 2–6:• Concepts and Applications
84
The first decision for implementing CBM in math is to decide which task is developmentally appropriate for each student to be monitored over the academic year. For students who are developing at a typical rate in math, the correct CBM tasks are as follows.
For kindergarten or first grade, the following probes can be administered alone or in combination with one another. Quantity Array asks students to identify the number of items in a box. Number Identification asks students to identify numeric characters. Quantity Discrimination asks students to identify the bigger number in a pair of numbers. Missing Number asks students to identify the missing number in a sequence of four numbers.
It should be noted that the Quantity Array, Number Identification, Quantity Discrimination, and Missing Number tasks presented in the manual have limited data related to their technical adequacy at this time. The measures (as presented here) have recently been developed and are currently being examined with respect to their reliability and validity (Lembke & Foegen, 2005). Early data indicate that the measures show promise as indicators of student performance in math, but the effectiveness of the measures for monitoring student progress has not been assessed at the time.
CBM Computation (Grades 1–6) and CBM Concepts and Applications Computation (Grades 2–6) can be administered alone or in combination with one another. Students in the earlier grades should use the Computation probes until the Concepts and Applications probes are appropriate for the grade-level material from the curriculum. For grades 1–6, once you select a task for CBM progress monitoring stick with that task (and level of probes) for the entire year.
Resources:Lembke, E. S. & Foegen, A. (2005). Creating measures of early numeracy. Presentation at the annual Pacific Coach Research Conference. San Diego, CA.

RtI Rate of Improvement•Responsiveness to intervention is defined as the rate of improvement, or a progress slope, that is or is not sufficient for the student to become proficient with grade level standards without more interventions.

Goal-Setting: Methods (Fuchs, 2006)
•Use of growth rates that reflect typical increases in performance by grade level•Use of national norms for weekly improvement.•Intra-individual framework that accounts for baseline rate of improvement.
Goal-setting method varies by system used and what question the team is trying to answer.

General Procedures
•Select goal-level material•Collect baseline data and set realistic or ambitious goals•Administer timed, alternate measures weekly•Apply decision-making rules to graphed data every 3 or 4 weeks•Implement instructional interventions when warranted•Use database to analyze errors and to develop instructional procedures

Average Learning Rate Reading
•Establish the•amount of •gain that•students are •expected to•make on a •weekly basis.(Fuchs et al. 2006)
Grade Level Passages RealisticGoals
AmbitiousGoals
6-8 .3 WRC per week
.65 WRCper week
5 .5 WRCper week
.8 WRCper week
4 .85 WRC per week
1.1 WRCper week
3 1.0 WRC per week
1.5 WRCper week
2 1.5 WRC per week
2.0 WRCper week
1 2.0 WRC per week
3.0 WRCper week88

Average Learning Rate Math
For developingstudents, a tableof median ratesof weeklyincrease can beused.
Grade Computation Concepts & Applications
1st 0.35 N/A
2nd 0.30 0.40
3rd 0.30 0.60
4th 0.70 0.70
5th 0.70 0.70
6th 0.40 0.70
89
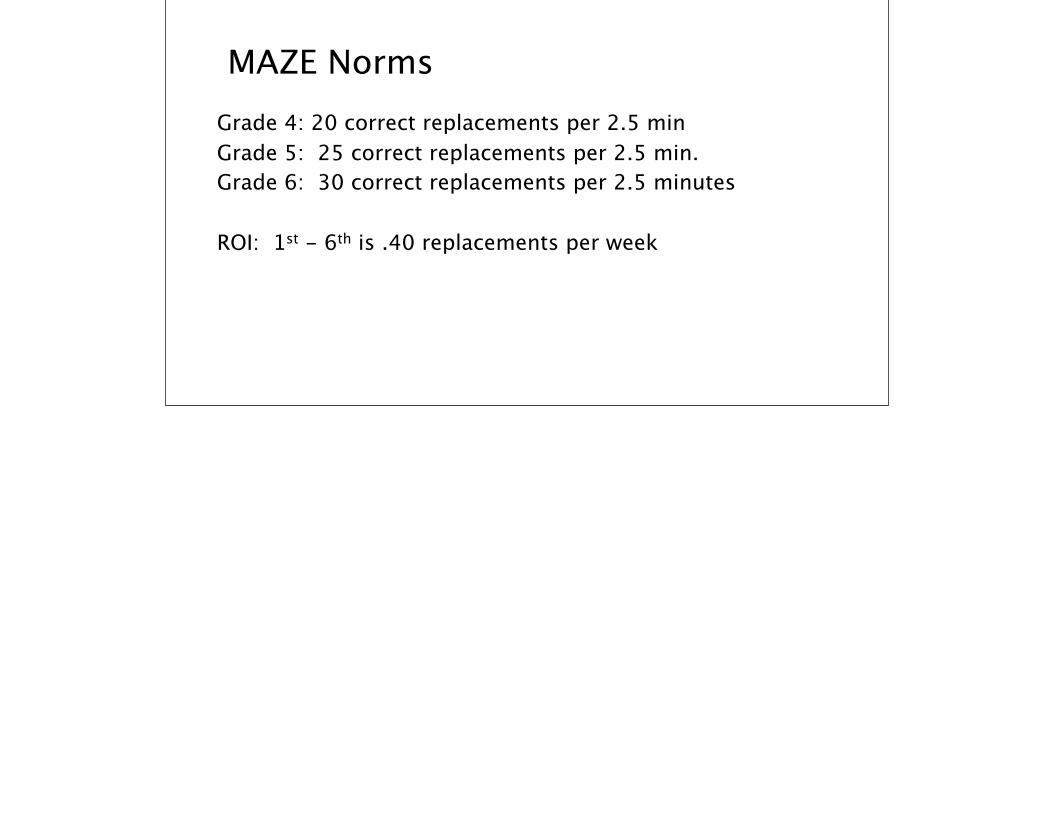
MAZE NormsGrade 4: 20 correct replacements per 2.5 minGrade 5: 25 correct replacements per 2.5 min.Grade 6: 30 correct replacements per 2.5 minutes
ROI: 1st - 6th is .40 replacements per week

Decide on a Data Decision Rule
91
A decision rule is the systematicprocedure by which patterns of data are analyzed. This data analysis assists in
making a decision about the effectiveness of an intervention.

Rules for Making Decisions
92
• Option I: 3 Data Point– Decision is made when 3 consecutive data points fall above or below the aimline (must have minimum 6 pts.).
• Option II: Trend Line Analysis– Decision is made after 9 data points which results in a trendline to compare to the aimline.

General Decision-Making Framework•3-Point Rule
• If 3-5 weeks of instruction have occurred and at least 9 points have been collected, then examine the 3 most recent data points:
• If all are above goal-line, then increase goal.• If all are below goal-line, then make a teaching change.• If the 3 data points are both above and below the goal-line, then keep
collecting data until trend-line rule or 3-point rule can be applied.

General Decision-Making Framework
•Trend-Line Rule:• If 4 weeks of instruction have occurred and at least 8 data points
have been collected, then figure trend of current performance and compare to goal-line:
• If trend of student progress is steeper than goal-line, then raise goal.• If trend of student progress is less steep than goal-line, then make a
teaching change.

Evaluating Progress: Informal Indicators
•Degree of change in “level” of data-points•Variability of data-points•Overlap of data-points
95
Change of level: look at average “level” of cluster of data-points. Variability: prefer stable, steady improvement v. high degree of variability.
Overlap: minimal overlap between data-points collected before and those obtained after intervention.

Plan your Intervention

The first component is the record of what the team members need to do in preparation for
implementing the intervention plan.
Designing the Plan
97

Planning the Implementation
98
• Decide and record WHAT steps need to be taken in order to implement the intervention plan.• Decide and record WHEN each step needs to be completed.• Decide and record WHO will be responsible for each step.

Monitoring Component
99
How do you know our intervention is working?
• The monitoring component is a record of the evaluation procedure and the decision rule.• How the monitoring is to be done• By whom is it going to be Done and• What rules will be used to determine how to proceed with the selected intervention components
Review the Results
100
• Analyze, and Reflect upon results• Results or outcomes of the interventions are the critical
and the ultimate criteria of success for both the efforts of the team and, most importantly, describe the degree to which the student has benefited

Tier 1 Strategies

Possible Reasons for Teachers’ Lack of

Possible Reasons for Instructional

Possible Reasons for Students’ Lack of Independent Learning

Common Reasons Why Students Struggle Academically

Possible Reasons for Teachers’ Lack of
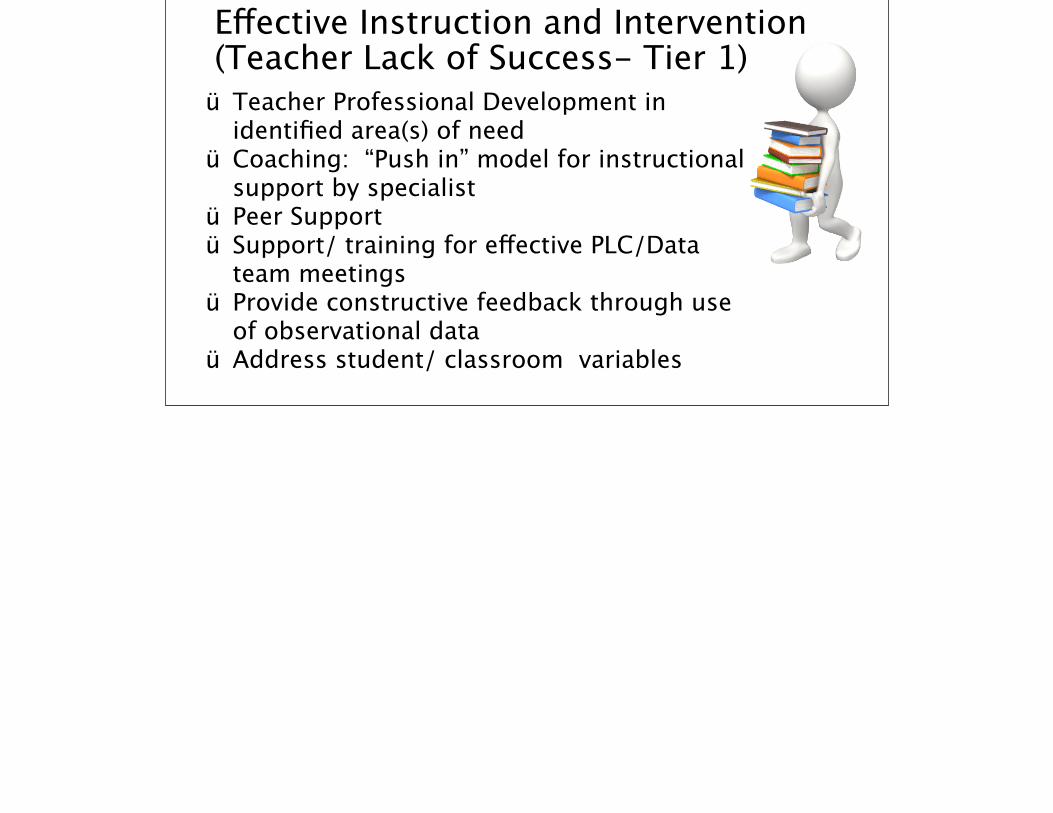
Effective Instruction and Intervention (Teacher Lack of Success- Tier 1)
ü Teacher Professional Development in identified area(s) of need
ü Coaching: “Push in” model for instructional support by specialist
ü Peer Supportü Support/ training for effective PLC/Data
team meetingsü Provide constructive feedback through use
of observational dataü Address student/ classroom variables

Possible Reasons for Instructional

Effective Instruction and Intervention Strategies
Instructional Planning:1. Start with standards: The purpose of standards is not
to articulate specific skills that can be taught in one lesson but to outline an overarching concept that encompasses multiple skills.
A. Use the standards to determine learning goals B. Group learning goals into units C. Logically order the units and plot them on the school calendarsD. Develop differentiated delivery of instruction and activities based
upon data
2. Create formative and summative assessments aligned to standards. Evaluate progress towards goal(s).

Effective Instruction and Intervention Strategies
Instructional Delivery:ü Frame the lessonü Work in the “Power Zone”ü Use frequent small group,
purposeful talk about learningü Recognize and Reinforceü Write critically

Relevant PracticeüUse data to determine flexible
groupingüBuild on student “knowns”üUse learning style information to
differentiate student content-product-process

Effective Instruction and Intervention Strategies
Instructional Delivery:ü Frame the lessonü Work in the “Power Zone”ü Use frequent small group,
purposeful talk about learningü Recognize and Reinforceü Write critically

Effective Instruction and Intervention Practices (Student Need Tier 1)•Use multiple modalities of learning to
increase automaticity.•Focused independent practice of skill to
automaticity (use diagnostic data to align with grade level skill).
•Intentionally taught learning strategies specific to skill area.

Effective Instruction and Intervention Practices (Student Need Tiers 2 & 3)•Peer/Adult Assisted Learning Computer-
Assisted Learning •Programmatic or Curricular Interventions•Specific or Focused Intervention aligned to
data confirmed skill deficit•Supplemental Interventions Intensive •Alternative Curriculum or Replacement
Interventions

Team Process: The Basics
115
•Maintain confidentiality.•Hold meetings in a timely manner •Display agenda during meeting•Set clear time limits.•Access and use auxiliary personnel and other appropriate resources.•Have members that represent a variety of experience and expertise: knowledge of classroom management, curriculum and instruction, and student motivation.
Reflect on how you want to proceed with regards to your team process.
116
Future Horizons. . .

•Guidelines• Ensure quality• Consider campus goals• Generate awareness of the changes• Disseminate information• Introduce model to faculty• Create a team• Identify resources• Develop evaluation plan
117
Summary