Embed Size (px)
Citation preview
Granger Causalityin fMRI connectivity analysis
Alard Roebroeck
Maastricht Brain Imaging Center (MBIC)Faculty of Psychology & Neuroscience
Maastricht University
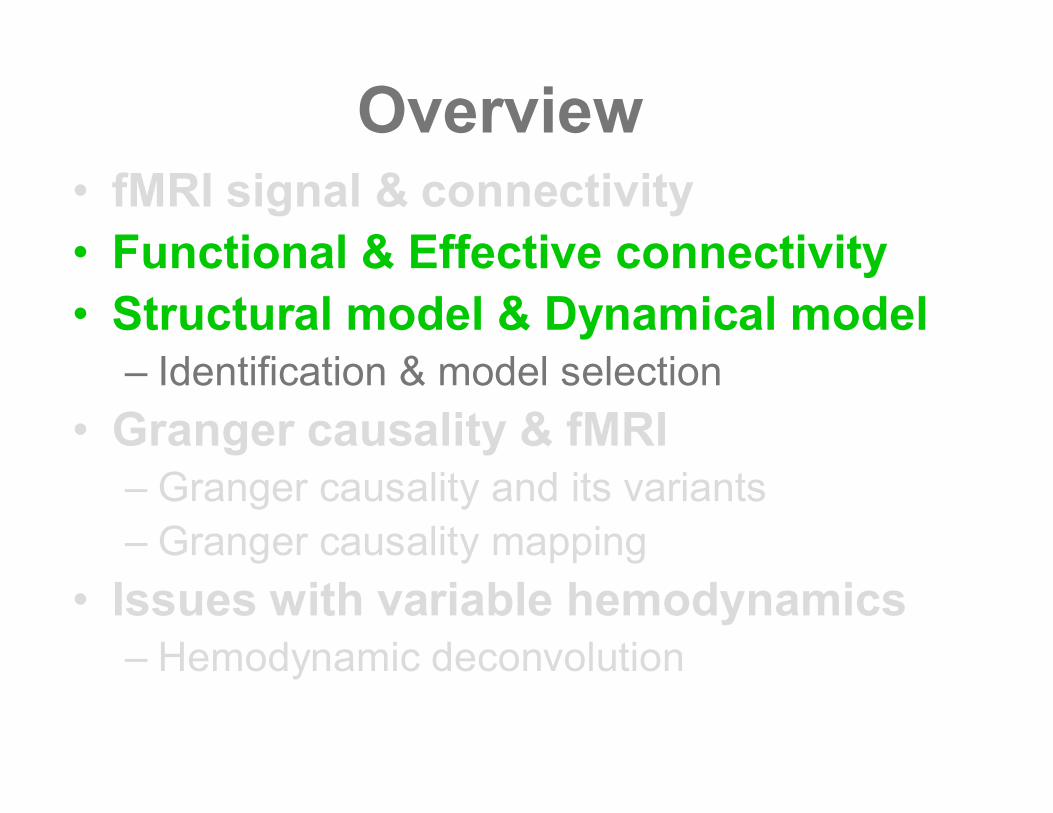
Overview•fMRI signal & connectivity•Functional & Effective connectivity•Structural model & Dynamical model
–Identification & model selection•Granger causality & fMRI
–Granger causality and its variants–Granger causality mapping
• Issues with variable hemodynamics–Hemodynamic deconvolution
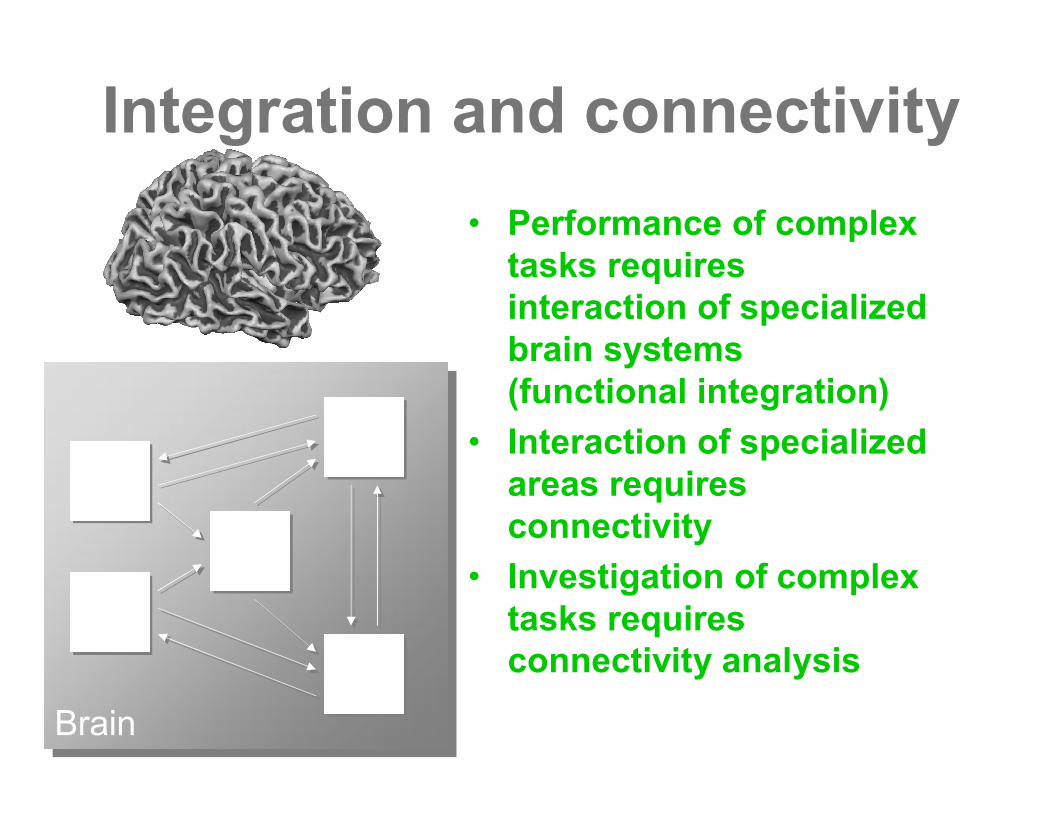
Integration and connectivity• Performance of complex
tasks requiresinteraction of specializedbrain systems(functional integration)
• Interaction of specializedareas requiresconnectivity
• Investigation of complextasks requiresconnectivity analysis
Brain
Brain
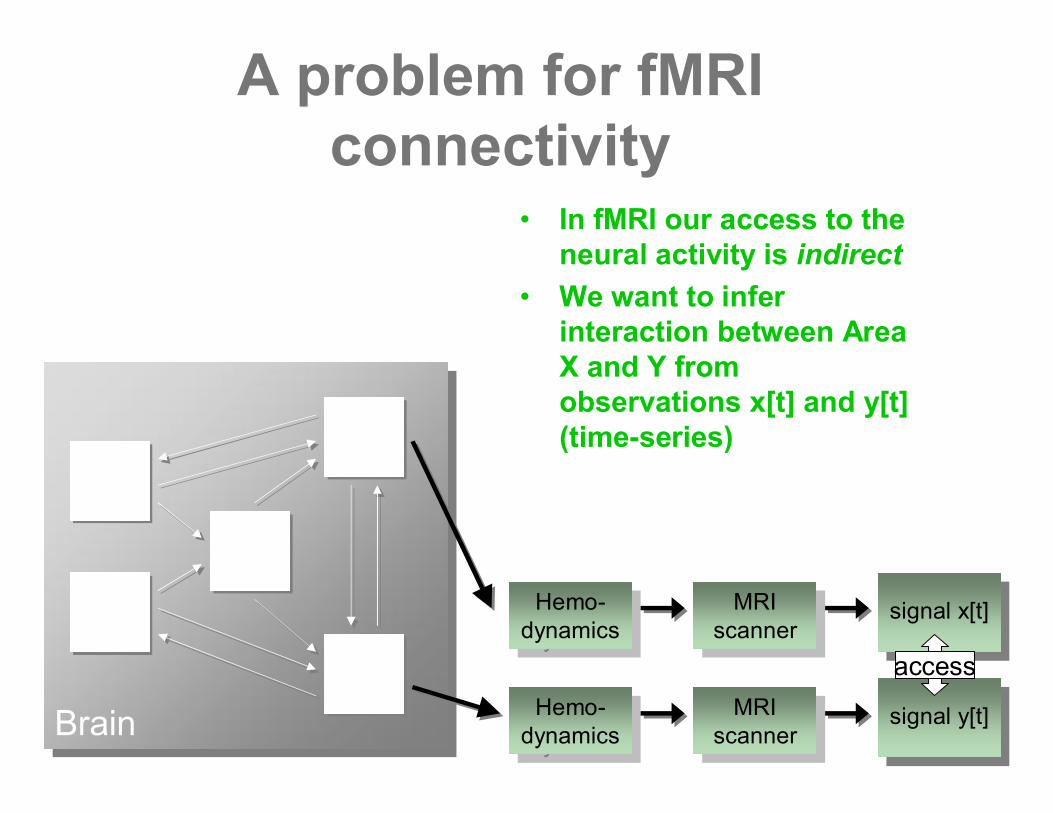
A problem for fMRIconnectivity
• In fMRI our access to theneural activity is indirect
• We want to inferinteraction between AreaX and Y fromobservations x[t] and y[t](time-series)
Hemo-dynamics
Hemo-dynamics
Hemo-dynamics
Hemo-dynamics
MRIscanner
MRIscanner
MRIscanner
MRIscanner
signal x[t]
signal y[t]
access
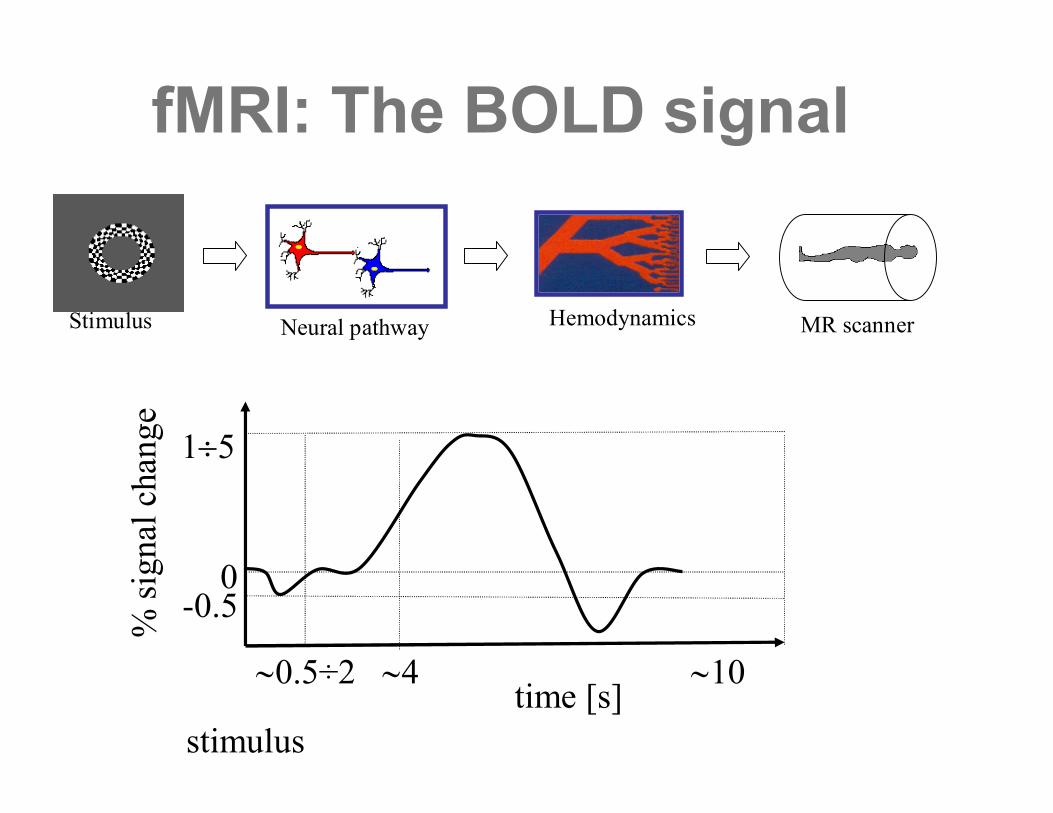
fMRI: The BOLD signal
Neural pathway Hemodynamics MR scanner
time [s]~0.5÷2 ~4 ~10
stimulus
0-0.5
1¸5
% si
gnal
cha
nge
Stimulus
Overview•fMRI signal & connectivity•Functional & Effective connectivity•Structural model & Dynamical model
–Identification & model selection•Granger causality & fMRI
–Granger causality and its variants–Granger causality mapping
• Issues with variable hemodynamics–Hemodynamic deconvolution
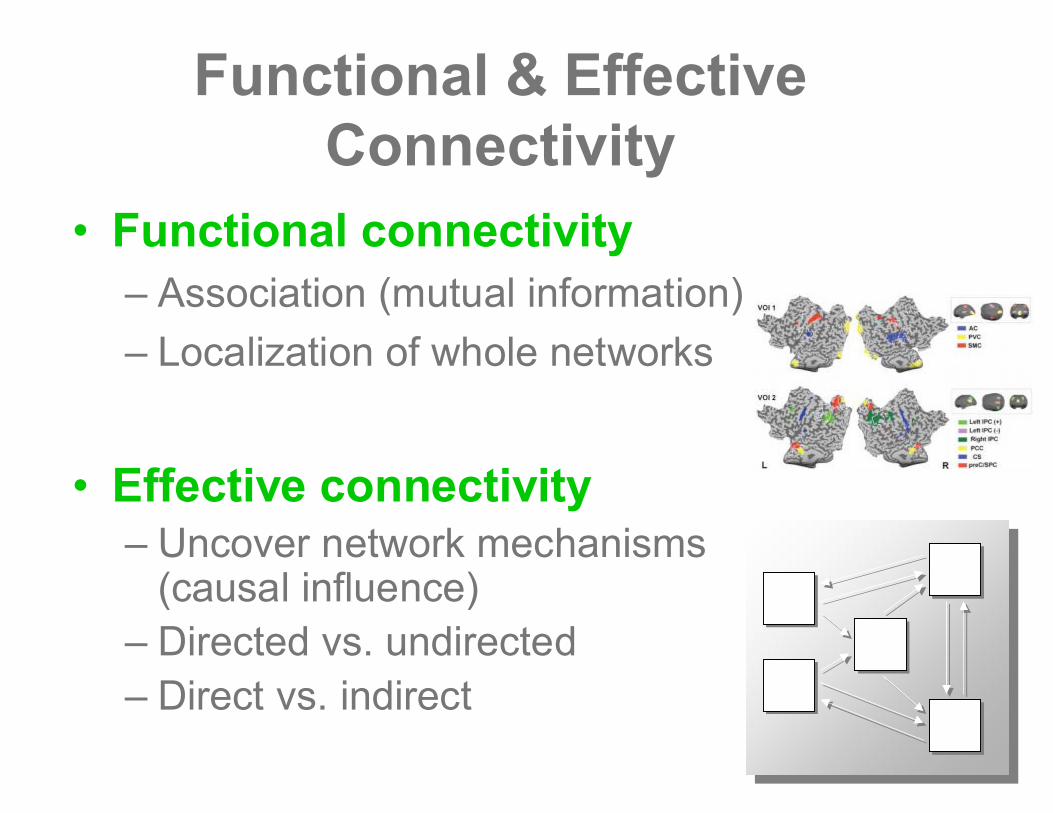
Functional & EffectiveConnectivity
•Functional connectivity–Association (mutual information)–Localization of whole networks
•Effective connectivity–Uncover network mechanisms
(causal influence)–Directed vs. undirected–Direct vs. indirect
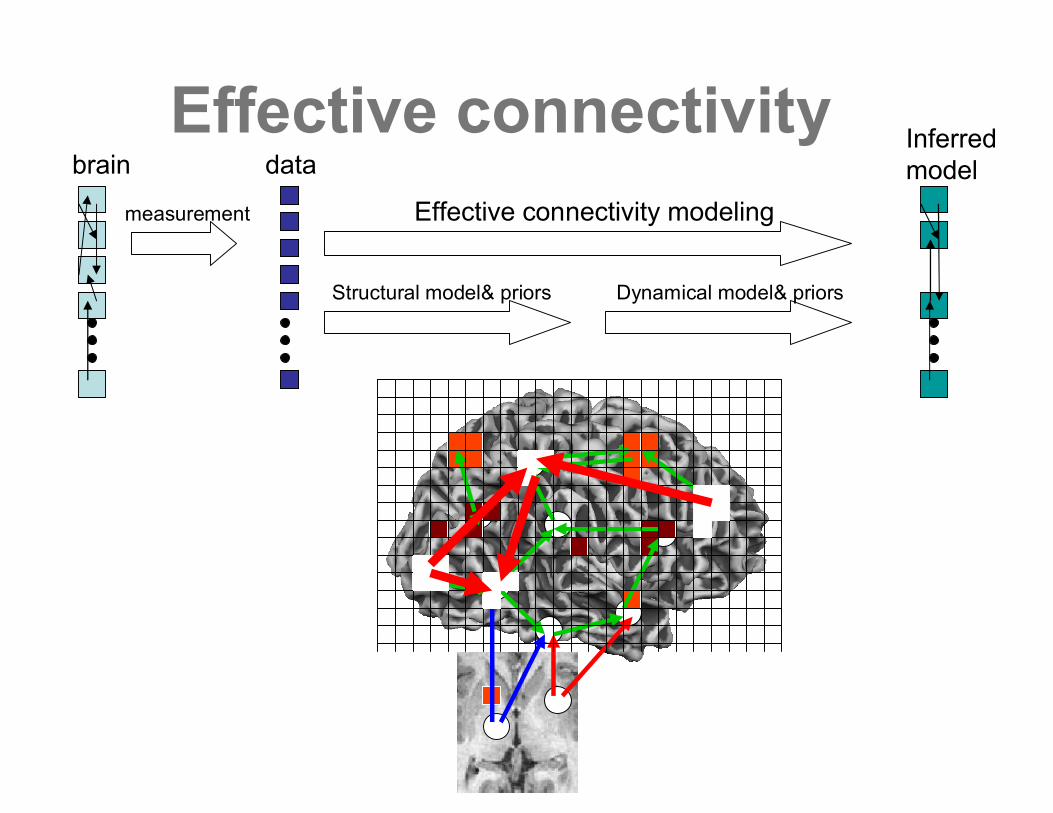
brain
measurement
data
Effective connectivity modeling
Inferredmodel
Structural model& priors Dynamical model& priors
Effective connectivity
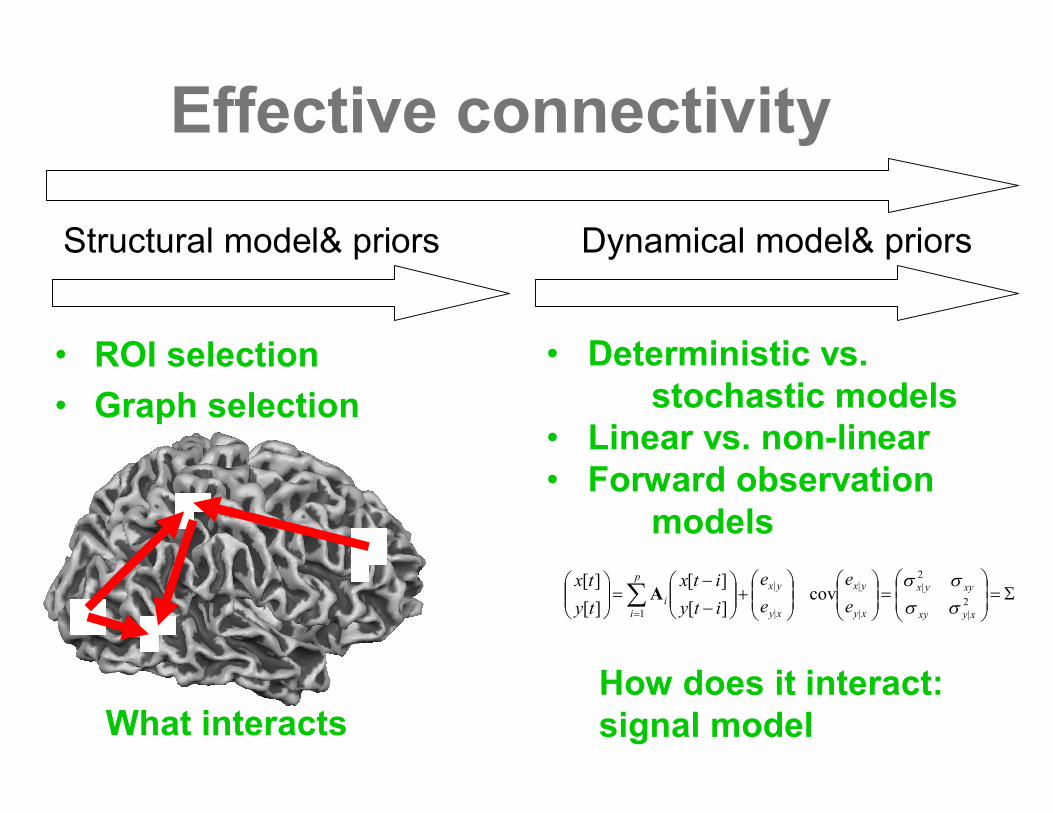
Effective connectivity
• ROI selection• Graph selection
Structural model& priors
What interacts
Dynamical model& priors
S=÷÷ø
öççè
æ=÷÷
ø
öççè
æ÷÷ø
öççè
æ+÷÷
ø
öççè
æ--
=÷÷ø
öççè
æ å=
2|
2|
|
|
|
|
1cov
][][
][][
xyxy
xyyx
xy
yx
xy
yxp
ii e
eee
ityitx
tytx
ssss
A
• Deterministic vs.stochastic models
• Linear vs. non-linear• Forward observation
models
How does it interact:signal model
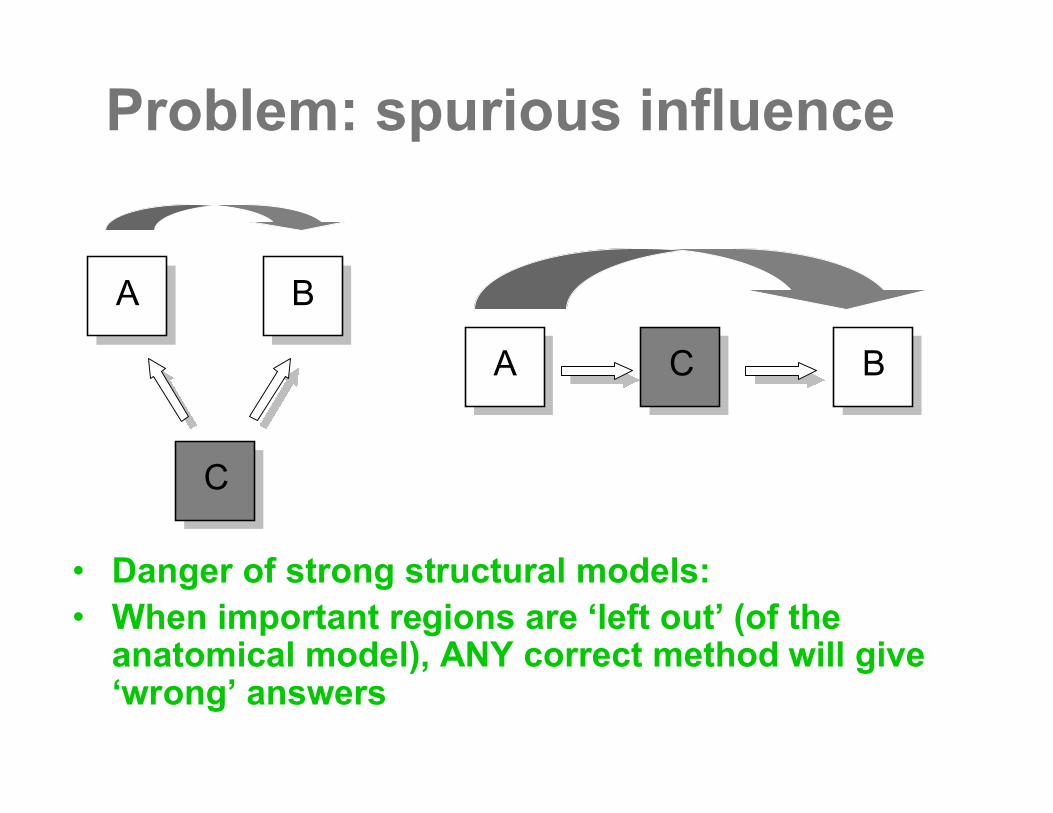
Problem: spurious influence
• Danger of strong structural models:• When important regions are ‘left out’(of the
anatomical model), ANY correct method will give‘wrong’answers
A B
C
A C B
Overview•fMRI signal & connectivity•Functional & Effective connectivity•Structural model & Dynamical model
–Identification & model selection•Granger causality & fMRI
–Granger causality and its variants–Granger causality mapping
• Issues with variable hemodynamics–Hemodynamic deconvolution
S=÷÷ø
öççè
æ=÷÷
ø
öççè
æ÷÷ø
öççè
æ+÷÷
ø
öççè
æ--
=÷÷ø
öççè
æ å=
2|
2|
|
|
|
|
1cov
][][
][][
xyxy
xyyx
xy
yx
xy
yxp
ii e
eee
ityitx
tytx
ssss
A
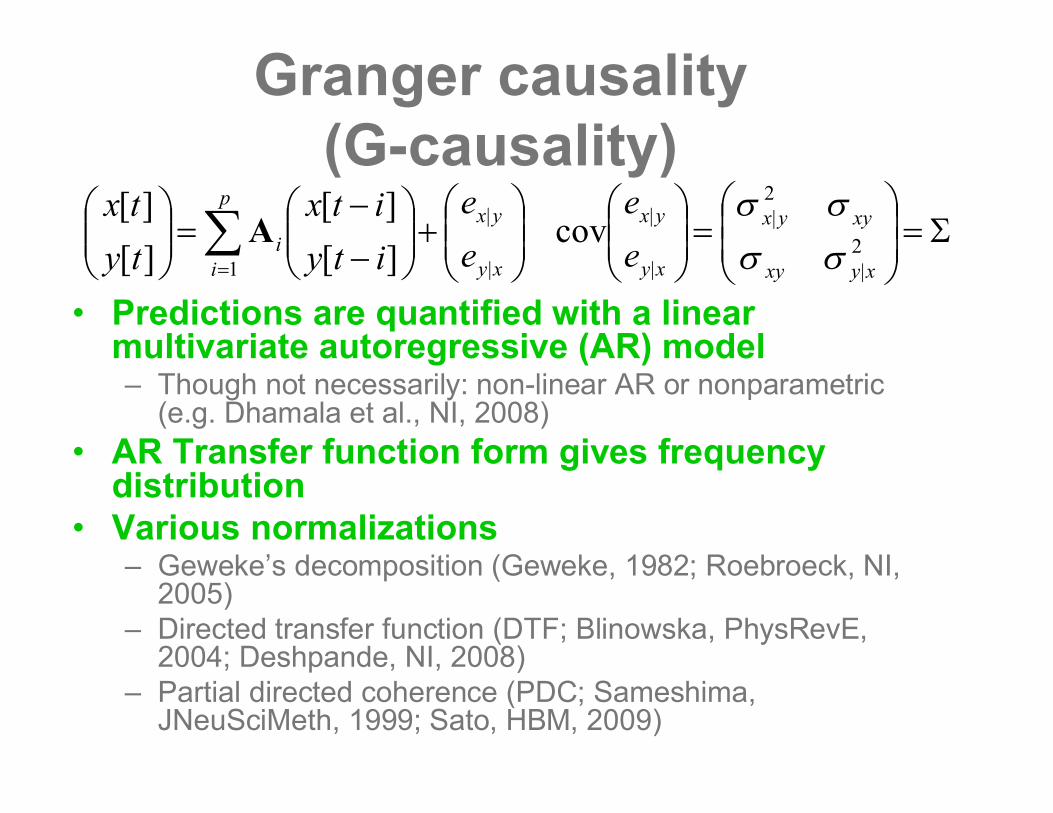
• Predictions are quantified with a linearmultivariate autoregressive (AR) model– Though not necessarily: non-linear AR or nonparametric
(e.g. Dhamala et al., NI, 2008)• AR Transfer function form gives frequency
distribution• Various normalizations
– Geweke’s decomposition (Geweke, 1982; Roebroeck, NI,2005)
– Directed transfer function (DTF; Blinowska, PhysRevE,2004; Deshpande, NI, 2008)
– Partial directed coherence (PDC; Sameshima,JNeuSciMeth, 1999; Sato, HBM, 2009)
Granger causality(G-causality)
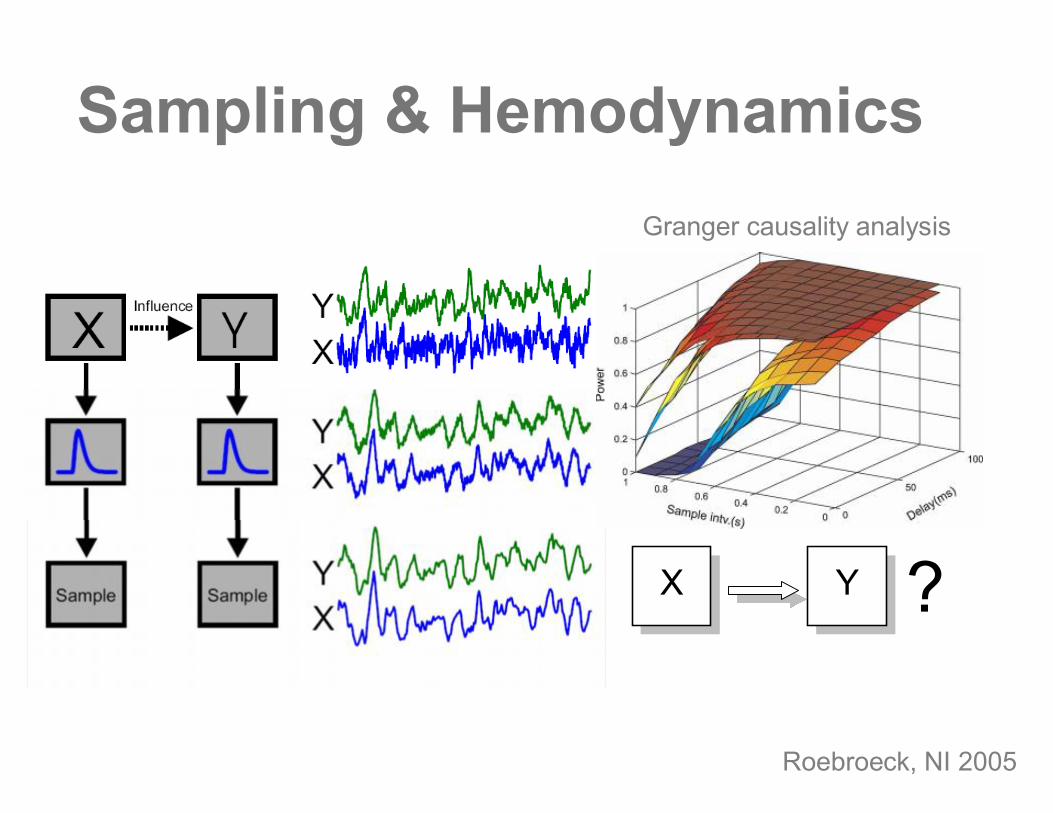
Sampling & Hemodynamics
X Y ?
Granger causality analysis
Roebroeck, NI 2005
Structural model for GC•ROI-based as in SEM, DCM
–E.g. Stilla, 2007; Sridharan, 2008;Udaphay, 2008; Deshpande, 2008
•Massively multivariate based onparcelation of the cortex–Valdes Sosa, 2004, 2005
•Granger causality mapping–Massively bivariate without prior
anatomical asumptions
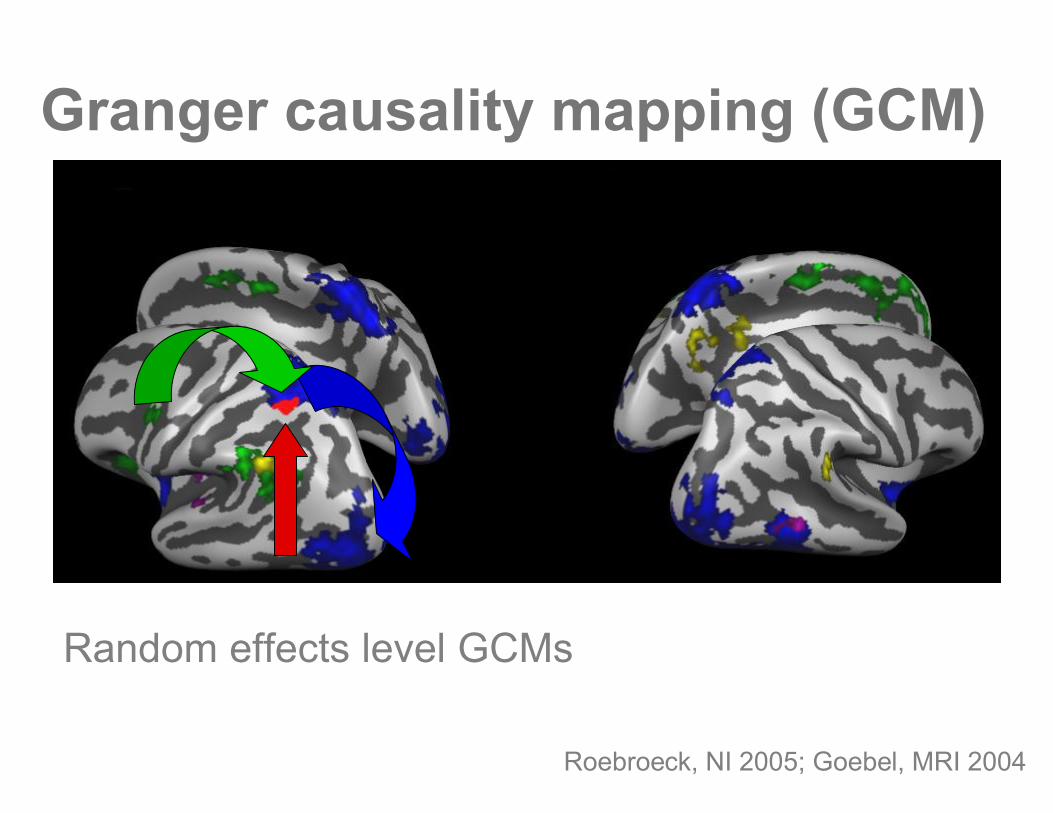
Granger causality mapping (GCM)
Roebroeck, NI 2005; Goebel, MRI 2004
Random effects level GCMs
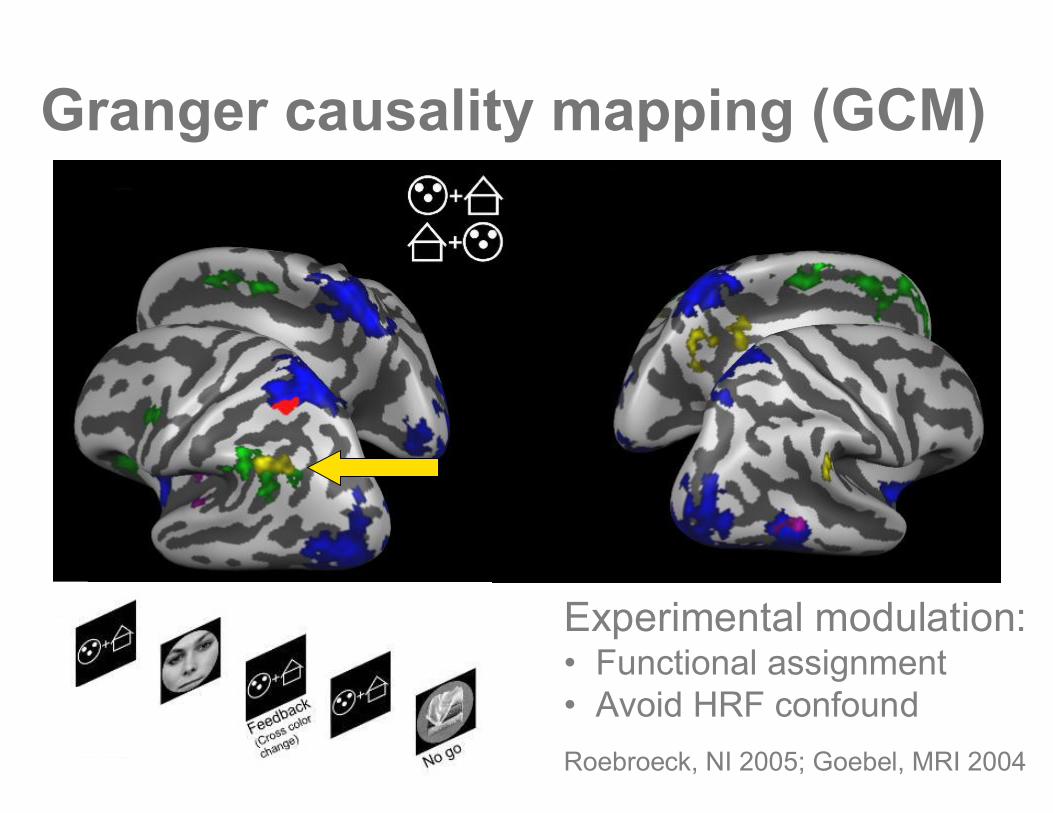
Granger causality mapping (GCM)
Roebroeck, NI 2005; Goebel, MRI 2004
Experimental modulation:• Functional assignment• Avoid HRF confound
Overview•fMRI signal & connectivity•Functional & Effective connectivity•Structural model & Dynamical model
–Identification & model selection•Granger causality & fMRI
–Granger causality and its variants–Granger causality mapping
• Issues with variable hemodynamics–Hemodynamic deconvolution
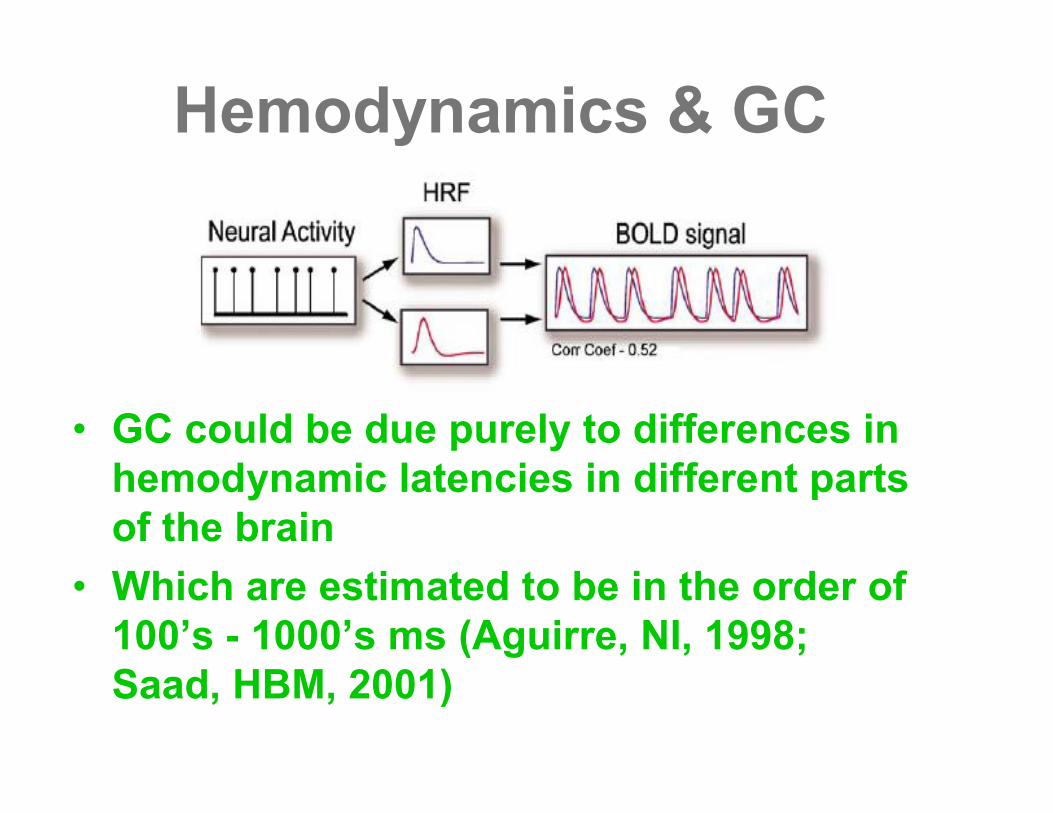
Hemodynamics & GC
• GC could be due purely to differences inhemodynamic latencies in different partsof the brain
• Which are estimated to be in the order of100’s - 1000’s ms (Aguirre, NI, 1998;Saad, HBM, 2001)
Hemodynamics & GC
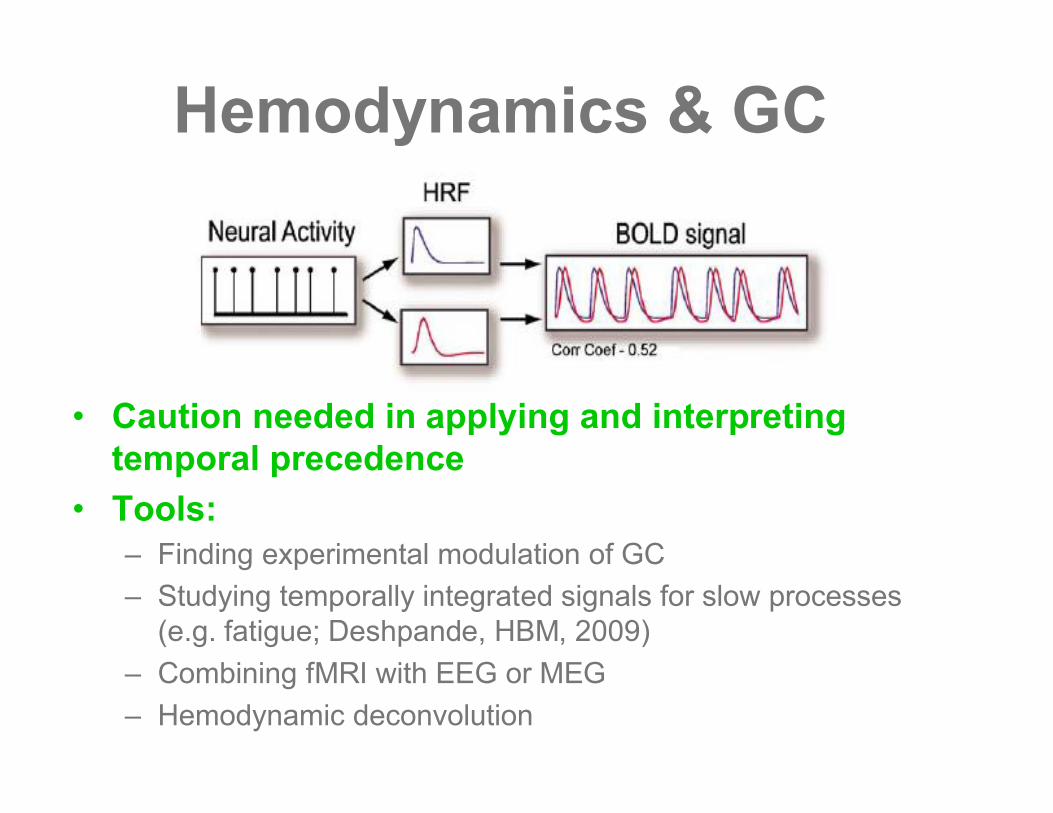
• Caution needed in applying and interpretingtemporal precedence
• Tools:– Finding experimental modulation of GC– Studying temporally integrated signals for slow processes
(e.g. fatigue; Deshpande, HBM, 2009)– Combining fMRI with EEG or MEG– Hemodynamic deconvolution
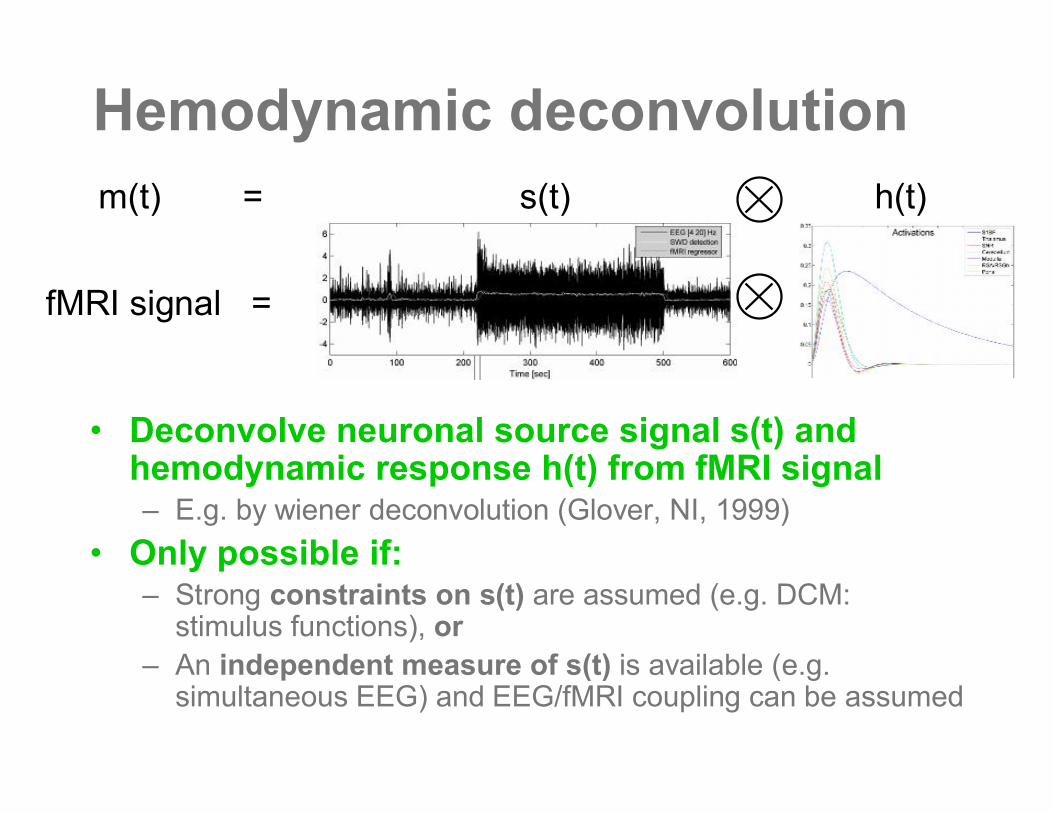
Hemodynamic deconvolution
• Deconvolve neuronal source signal s(t) andhemodynamic response h(t) from fMRI signal– E.g. by wiener deconvolution (Glover, NI, 1999)
• Only possible if:– Strong constraints on s(t) are assumed (e.g. DCM:
stimulus functions), or– An independent measure of s(t) is available (e.g.
simultaneous EEG) and EEG/fMRI coupling can be assumed
fMRI signal =
m(t) = s(t) h(t)
Hemodynamic deconvolution
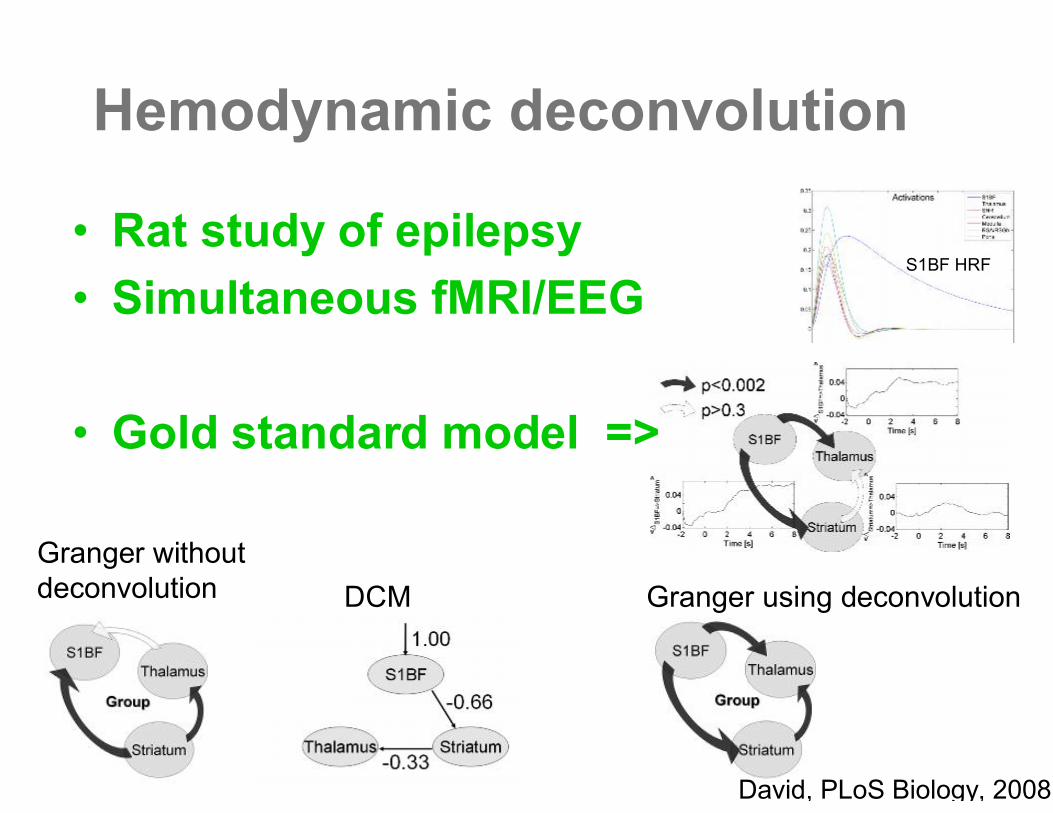
Granger withoutdeconvolution Granger using deconvolutionDCM
•Rat study of epilepsy•Simultaneous fMRI/EEG
•Gold standard model =>
S1BF HRF
David, PLoS Biology, 2008
Summary
•G-causality and AR models arepowerful tools in fMRI effectiveconnectivity analysis
•GC is ideal for massive explorationof the structural model
•Caution is needed with GC in theface of variable hemodynamics


![Entropy OPEN ACCESS entropy - Semantic Scholar...Granger causality Granger [10] continuous based on AR models extended Granger causality Ancona, Marinazzo and Stramaglia [11] continuous](https://img.pdfslide.net/doc/110x75/60a9bab6f99f93648e55bddc/entropy-open-access-entropy-semantic-scholar-granger-causality-granger-10.jpg)