Embed Size (px)
Citation preview

Grant Agreement No.: 611001
UCN
Instrument: Collaborative Project Call Identifier: FP7-ICT-2013-10 Objective 1.6: Connected and Social Media
D2.2: Report on Data Collection Methodologies
Due date of deliverable: 31.03.2015 Actual submission date: 31.03.2015
Start date of project: October 1st 2013 Duration: 36 months
Project Manager: Henk Heijnen, Technicolor SA Author(s): Inria, Intamac, NICTA, Portugal Telecom, Technicolor, University of
Cambridge, University of Nottingham Editor: Inria
Revision: v.1.0
Abstract WP2 focuses on methods to obtain user context (i.e., knowledge of users’ environment, activities, preferences). All this information will then feed the Personal Information Hub (PIH). This deliverable reports on the preliminary data collection methods. We also describe the small-scale user study we are conducting to obtain ground-truth on our inferences of user context.
Project co-funded by the European Commission in the 7th Framework Programme (2007-2013)
Dissemination Level PU Public ü PP Restricted to other programme participants (including the Commission Services) RE Restricted to a group specified by the consortium (including the Commission Services) CO Confidential, only for members of the consortium (including the Commission Services)

v.1.0 UCN
D2.2: Report on Data Collection Methodologies
1
TABLE OF CONTENTS
TABLE OF CONTENTS ......................................................................................................................... 1 1 INTRODUCTION ............................................................................................................................. 2 2 USER CONTEXT METRICS ........................................................................................................... 3
2.1 END-USER DEVICES .................................................................................................................. 3 2.2 SENSORS ..................................................................................................................................... 4 2.3 HOME GATEWAYS .................................................................................................................... 5 2.4 SERVICE BACKENDS ................................................................................................................. 6
3 DATA COLLECTION METHODS .................................................................................................. 9 3.1 END-USER DEVICES .................................................................................................................. 9 3.2 SENSORS ................................................................................................................................... 11 3.3 HOME GATEWAYS .................................................................................................................. 17 3.4 SERVICE BACKENDS ............................................................................................................... 23
4 USER STUDY ON USER CONTEXT ........................................................................................... 38 4.1 BACKGROUND ......................................................................................................................... 38 4.2 THE PACKAGE ......................................................................................................................... 39 4.3 INITIAL TESTING AND REFINEMENT ..................................................................................... 40 4.4 STUDY METHODOLOGY .......................................................................................................... 41 4.5 RECRUITMENT ........................................................................................................................ 46
5 REFERENCES ................................................................................................................................ 48

v.1.0 UCN
D2.2: Report on Data Collection Methodologies
2
1 INTRODUCTION
The UCN project leverages rich knowledge about users to help them find relevant content, identify nearby network resources, and plan how to deliver the actual content to the appropriate device at the desired time. A general challenge for such methods is how to obtain this broader understanding of the user. This includes better knowledge about user’s activities, needs, and interests as well as knowledge about the user local environment. We call this information collectively user context. WP2 is designing and implementing a set of data collectors to automatically obtain user context from various sources. It will also design mechanisms to collect direct feedback and annotations from the user, combining this data with automatically collected user context. In D2.1 we described the preliminary set of metrics UCN will use to capture user context. Here, we first review and update these metrics (Section 2). Then, Section 3 presents the design and implementation of data collection methods. We present methods to collect user context on four different vantage points that together can get can get a comprehensive view of the user: end-hosts, both PCs and mobile devices; home sensors; home gateways; and service backend, in particular for an IPTV and a social TV service. The methods and tools we are developing will output data that will then be stored at the PIH. In addition to describing the data collection methods, this deliverable discusses the user study that we are undertaking in the context of UCN. It is challenging to infer user activity and context from data collected automatically from the different vantage points we monitor. Hence, we are seeking ground truth from users themselves. Section 4 describes the motivation and current status of this user study. The results of this study will help guide our techniques to infer user context.

v.1.0 UCN
D2.2: Report on Data Collection Methodologies
3
2 USER CONTEXT METRICS
In this section we summarize the user context metrics and updates with respect to the initial discussion provided in D2.1. 2.1 End-User Devices
We will implement data collectors both for PCs and mobile devices. Table 1 summarizes the end-user device metrics we plan to use. We collect data on user activity using available sensors, I/O devices and list of running applications. We record user location at varying granularity based on the sensors and APIs available at a particular vantage point. We collect data on the end system to identify the device type (OS, version, brand), its available and currently used resources for performance characterisation. The network data collection consists of configuration tracking, and passive and active performance measurements. Finally, we plan to measure various performance metrics at per application level to obtain a more detailed view on user experience with networked applications. Updates to D2.1: None of the current use cases/applications require mobile devices’ acceleration and rotation state or the exact GPS coordinates, so we mark them removed for now. Inria may add these later to the Hostview tool if necessary. In addition, we have discontinued the Android based home network monitoring device development (more details in 3.3.4), and we are not currently working on active network probes. Metric Vantage Point Tool/Partner User activity Device acceleration and rotation
(gyroscope, accelerometer) Mobile -
Screen state (on/off, full-screen) Mobile, PC Hostview/Inria, UCN Study/Inria,Nott
Microphone and speaker usage (on/off)
Mobile, PC Hostview/Inria
Mouse/keyboard/touch I/O events
Mobile, PC Hostview/Inria
Foreground application Mobile, PC Hostview/Inria, UCN Study/Inria,Nott
List of running applications Mobile, PC Hostview/Inria, UCN Study/Inria,Nott
Location Coordinates (GPS) Mobile - Connected and neighbouring cell
ids Mobile Hostview/Inria,
UCN Study/Inria,Nott Public IP based geo-location
(ISP, city, country) Mobile, PC Hostview/Inria
User-identified location Mobile, PC Hostview/Inria, UCN Study/Inria,Nott
System OS, version, brand Mobile, PC Hostview/Inria, UCN Study/Inria,Nott
Available CPUs, memory, Mobile, PC Hostview/Inria, UCN

v.1.0 UCN
D2.2: Report on Data Collection Methodologies
4
battery Study/Inria,Nott CPU, memory, battery usage
statistics Mobile, PC Hostview/Inria, UCN
Study/Inria,Nott Network Associated cell (apn, cid, lac,
operator, country) Mobile Hostview/Inria, UCN
Study/Inria,Nott Associated WiFi AP (bssid, ssid,
channel, freq, phy rate, security, IP, mode, RSSI)
Mobile, PC Hostview/Inria, UCN Study/Inria,Nott
Other active network(s) (Ethernet, Bluetooth, tethering, VPN)
Mobile, PC Hostview/Inria UCN Study/Inria,Nott
Network interface statistics Mobile, PC Hostview/Inria UCN Study/Inria,Nott
Latency to home network devices
Mobile, PC -
Traceroute to landmarks Mobile, PC - Web performance to landmarks Mobile, PC - Access and home network
bandwidth Mobile, PC -
Application performance
CPU, memory and network usage per application
Mobile, PC Hostview/Inria
TCP flows (RTT, jitter, rx/tx bytes, packets, retransmissions, resets, start and end times, source and destination IPs and ports)
Mobile, PC Hostview/Inria
Non-TCP traffic (rx/tx bytes and packets, “connection” start time and end time, source and destination IPs and ports)
Mobile, PC Hostview/Inria
Table 1: End-user device data and metrics
2.2 Sensors
We will leverage multitude of sensors at home to gather contextual data about household routine(s), person presence and household environment. Table 2 lists the metrics we can measure at various sensors at home. Updates to D2.1: Added new sensor metrics collected by the PT SmartSense platform. Metric Vantage Point Tool/Partner User activity Movement detection
(person, location) PIR and Camera ENSO/Intamac
Arrival and Departure Key fob, Panic Pendant ENSO/Intamac

v.1.0 UCN
D2.2: Report on Data Collection Methodologies
5
Door/window state (open/closed)
Door / Window Contact ENSO/Intamac
System Status
Lighting choice Light Control ENSO/Intamac
Heating/Cooling Mode HVAC System ENSO/Intamac Alarm State –
Home/Away/Night Alarm System ENSO/Intamac
Doors locked/unlocked Door Locks ENSO/Intamac Power consumption Smart plug ENSO/Intamac Biometrics Heart rate (BPM) Personal Biometrics SmartSense/PT Weight Connected Scales SmartSense/PT Activity (Sleeping, Active,
Resting) Personal Movement Sensor / Pendant
SmartSense/PT
Fall Alert Fall Sensor SmartSense/PT Temperature Personal Biometrics SmartSense/PT Blood Pressure (Systolic and
Diastolic) [new] Blood Monitor SmartSense/PT
Glucose [new] Glucose Monitor SmartSense/PT Oxygen saturation [new] Oximeter SmartSense/PT EMG [new] Health Monitor Device SmartSense/PT ECG [new] Health Monitor Device SmartSense/PT Foot Temperature [new] Health Monitor Device SmartSense/PT Foot Humidity [new] Health Monitor Device SmartSense/PT Body Mass Index [new] Health Monitor Device SmartSense/PT Respiratory Rate [new] Health Monitor Device SmartSense/PT Environment Temperature [new] HVAC Thermostat SmartSense/PT Luminosity level [new] Light Sensor SmartSense/PT
Table 2: Sensor data and metrics 2.3 Home Gateways
Table 3 summarizes the gateway metrics. We will collect data on network configuration and performance, user activity (connections and content consumption) and detailed application level performance via network traffic monitoring. Updates to D2.1: Updated metrics of the Technicolor PT gateway. Metric Tool/Partner System Gateway hardware (model, type,
serial no) [new] PT Gateway/Technicolor
Network Connected devices (IP, MAC address, DNS name, WiFi capability and configuration, available services via
PT Gateway/Technicolor, HomeWork/Nott

v.1.0 UCN
D2.2: Report on Data Collection Methodologies
6
UPnP and mDNS) Wireless network (RSSI, phy rate,
throughout of connected hosts, nearby APs) [updated]
PT Gateway/Technicolor, HomeWork/Nott, OpenWRT/Inria
Internet connection (PPP connection and DSL line statistics, e.g. status, SNR for DSL) [new]
PT Gateway/Technicolor
Network interfaces configuration and statistics (e.g. packets/bytes recv/sent, errors) [new]
PT Gateway/Technicolor
IP level configuration and statistics (e.g. packets/bytes recv/sent, errors) [new]
PT Gateway/Technicolor
DNS statistics [new] PT Gateway/Technicolor User activity Device (dis)connect (DHCP reqs,
acks, offers, state) [updated] PT Gateway/Technicolor, HomeWork/Nott, OpenWRT/Inria
Connection statistics (e.g. number of UDP/TCP connections) [new]
PT Gateway/Technicolor, HomeWork/Nott, OpenWRT/Inria
http(s) headers (time-of-day, url, referrer, user agent, content type, response code)
HomeWork/Nott, OpenWRT/Inria
VOIP usage (registration status, call duration, phone hook state, call history, statistics per call such as packet counts, packet loss, RTT, jitter) [updated]
PT Gateway/Technicolor
IPTV usage (IGMP join/leave) PT Gateway/Technicolor Application performance
TCP flows (RTT, jitter, rx/tx bytes, packets, retransmissions, resets, start and end times, source and destination IPs and ports)
OpenWRT/Inria, HomeWork/Nott
Non-TCP traffic (rx/tx bytes and packets, “connection” start time and end time, source and destination IPs and ports)
OpenWRT/Inria, HomeWork/Nott
Table 3: Home gateway data and metrics
2.4 Service Backends
We will collect data from partners existing media services including Portugal Telecoms IPTV service and NICTAs Social TV platform that both provide access to users’ content consumption patterns. We plan to use historical data from Portugal Telecom’s IPTV service combined with contextual information to model a user profile, identify different user profiles

v.1.0 UCN
D2.2: Report on Data Collection Methodologies
7
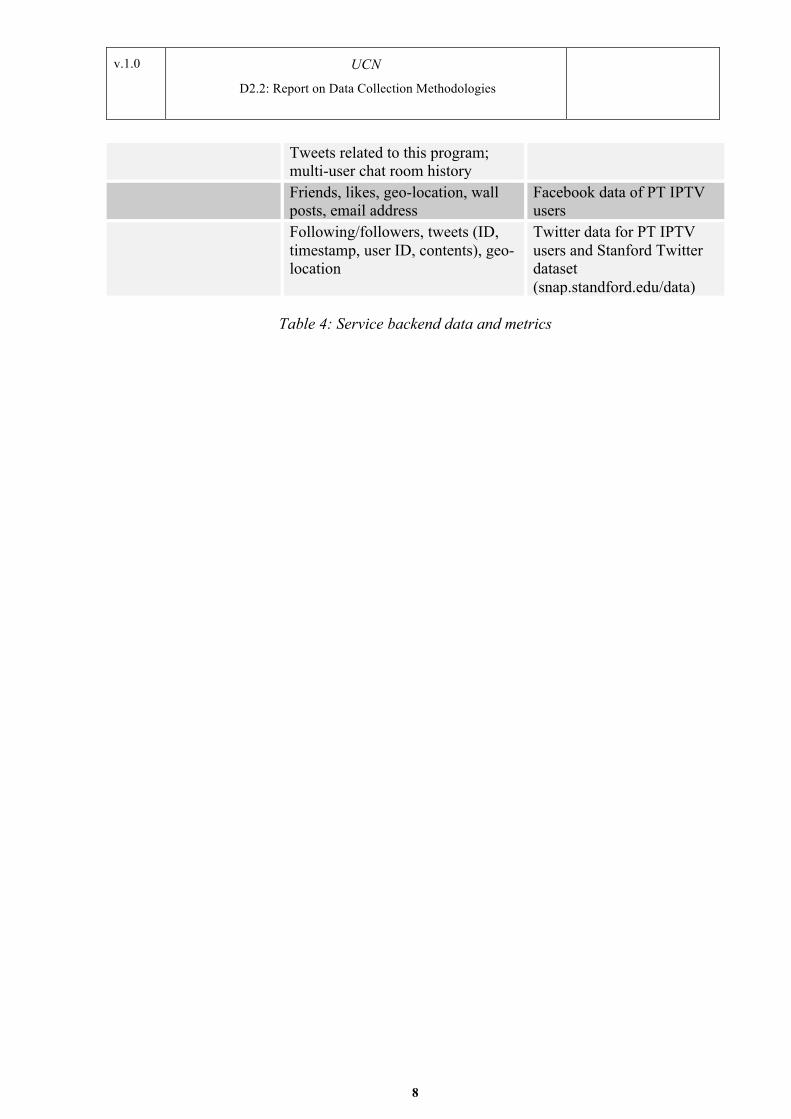
in the same set-top box and recommend content based on user preferences. The NICTA social TV platform allows users to watch live TV and some catch-up TV in their browser, chat with other users watching the same channel, sign in with their online social network (Twitter and Facebook supported), and post comments on Facebook or twitter about the programs being watched. Updates to D2.1: Added PT IPTV mobile companion app and related metrics. Metric Vantage Point User Activity Channel, Duration,
Program StartTime, StartTime, Station ShortName, Title, Episode Title, Description, ProgramId, IsHd, Program Metadata Long Description, Program Metadata Title, Program Schedule Duration, Program Schedule StartTime, Program Schedule StationName, Zapping
PT IPTV service backend
LiveTV_Channel_EPG_Tuned, LiveTV_Channel_Search_Tuned, LiveTV_Channel_Views_Duration, Facebook_Shared, Twitter_Shared, LiveTV_WatchOnTV_Selected, VOD_Movie_AddedToFavorites, VOD_RentMovie, VOD_Movie_Played, EPG_Alert_Program, EPG_Recording_Alert_Program, Recording_Record_Program, Recording_EPG_Program, GA_Play_Episode, GA_Program_Views_Duration [new]
PT IPTV mobile companion app (MeoGo)
TV program data: program title, description, duration, channel name, watch_start_time, watch_stop_time, rating (out of 5 stars), comments; Facebook posts related to this program;
NICTA social TV service backend server
v.1.0 UCN
D2.2: Report on Data Collection Methodologies
8
Tweets related to this program; multi-user chat room history
Friends, likes, geo-location, wall posts, email address
Facebook data of PT IPTV users
Following/followers, tweets (ID, timestamp, user ID, contents), geo-location
Twitter data for PT IPTV users and Stanford Twitter dataset (snap.standford.edu/data)
Table 4: Service backend data and metrics

v.1.0 UCN
D2.2: Report on Data Collection Methodologies
9
3 DATA COLLECTION METHODS
In this section we discuss the initial data collection methods and tools designed and implemented by the consortium. These methods and tools will be used to feed data from various vantage points to the PIH. In this deliverable, we will focus on the challenges of data collection at various vantage points; collection methodologies; the design and deployment of individual tools; and lessons learned from these initial deployments when available. 3.1 End-User Devices 3.1.1 End-host Monitoring with HostView
The end-host monitoring effort in UCN is guided by Inria’s experience in building HostView. HostView is a tool that runs on end-hosts to collect network performance data annotated with the user perception of network performance. It adopts a hybrid measurement methodology that combines network measurement techniques to infer application performance with techniques from HCI to measure user perception. In our previous work, we developed an initial version of HostView [1] that ran on Linux and OS X to collect network packet traces and application process executable names, which we can use to infer network performance per application, as well as a number of end-host performance metrics such as WiFi signal strength/noise and machine CPU load and memory utilization. HostView also recorded user feedback on application performance with two mechanisms: a system-triggered questionnaire based upon the Experience Sampling Methodology (ESM), and a user-triggered mechanism called an “I’m annoyed!” button. The ESM mechanism prompted the user no more than three times per day with a questionnaire about their experience with online applications. The “I’m annoyed!” button was always displayed at the corner of the screen and we asked users to click on it when they are dissatisfied with their application performance. Our experience using the data collected with HostView highlighted a number of shortcomings with the first version of HostView that we are addressing in a new version developed in the context of the UCN project. We note that the initial version of the tool was a grad student project, so we are re-implementing HostView from scratch with a number of improvements to better serve the needs of UCN. The new version still collects network packet traces and the mapping of network flows to application process names information on network environment Here we describe the main changes from the original implementation of HostView. Improved identification of services running on web browser. HostView identifies online activity by mapping network flows to the corresponding application process name. One issue is that many applications today run on top of a web browser and this method cannot distinguish flows from each of the services running within the browser. Thus, we must develop improve HostView to identify network traffic for the individual services running on top of the browser. The new version of HostView parses HTTP headers in real-time to address this issue. Support for missing OSes. HostView supported only Linux and OS X laptops and desktops, but a large fraction of users access online services through handheld devices (e.g.,

v.1.0 UCN
D2.2: Report on Data Collection Methodologies
10
smartphones or tablets) or via Windows systems. The new version of HostView is targeted initially to these missing platforms. Our first prototype is being developed for Windows. Improved identification of network environment. HostView captures the network environment (i.e., which network the user is connected to) with the BSSID/ESSID if the interface is wireless, the MAC address of the first network device if the interface is wired. It also recorded the country, city, and ISP to which the user was connected. This information, however, was obtained at the collection server by mapping the public IP of the host at the upload time. If the upload was done from a different environment then the environment where the traces were collected, then HostView would mislabel the traces. The new version of HostView gets the labeling of the environment at collection time. Improved user activity tracking. HostView captures the list of running applications and the application in foreground, which is a limited notion of user activity. The new version of HostView will track I/O activity more closely (mouse, keyboard, microphone, camera) as well as whether the screen in the screensaver. This will allow us to track user presence and activity more closely. Improved user feedback. The user feedback module of HostView often asks user to fill a report on similar situations. We will improve the user feedback collection method such that it provides more reliable data, and covers varying network conditions and contexts without causing too much annoyance to the user. The new version of HostView is under development at Inria. A basic version of the tool that records a list of running applications (including the foreground window), user activity events (keyboard and mouse activity, screen states) and sockets to application mapping, will be used as a part of the UCN user study discussed in Section 4. 3.1.2 Mobile Device Monitoring
In addition to HostView, Inria and University of Nottingham have together experimented with mobile device monitoring and data collection in the context of the UCN user study (see Section 4 for details). In the study, we collect data from mobile devices using an existing user activity tracking application called Moves1 and a custom activity logger developed in the UCN project Moves is a popular “user activity diary” application for iPhone and Android. It runs constantly on the background and automatically records walking, cycling, and running activities associated with time of day and user location. It lets users view the distance, duration, steps, and calories burned for each activity. Moves provides an open API for 3rd party connected applications that can access the user activity data subject to authorization by the user. We leverage the Moves API in the UCN study to access data about user locations over time (i.e. places visited by the user instead of fine-grained geo-location data). The places are either automatically labelled (e.g. by address or based on known landmarks) or manually named by the user (e.g. home or work).
1 https://www.moves-app.com/

v.1.0 UCN
D2.2: Report on Data Collection Methodologies
11
We have also developed a lightweight user activity logging application for Android2 to get more information about the mobile device’s system configuration, resource use and user activities. Similarly to Moves, the application runs on the background, and periodically records the current network configuration; battery, screen, and audio state; system wide CPU and memory use; network traffic counters (per interface and application); a list of running applications and the foreground application; and the mapping of sockets to applications for traffic identification. In this initial design for the UCN study, the activity logger uploads JSON formatted data periodically to our secure servers where the objects are stored in a key-value database. 3.2 Sensors
We will use a number of sensors to gather data on presence, energy usage and people at home. To this end we leverage the solutions proposed by the industrial partners Intamac and PT as described below. 3.2.1 Intamac IoT Platform
Intamac provides Internet of Everything solutions to business and consumers around the world for applications in security, energy management, vulnerable person care, home automation and lighting, etc. The Intamac ENSO platform consists of a cloud service; a multitude of different types of sensors; and sensor hubs that connect the sensors to the cloud services. A home can have multiple sensor hubs, but usually a single hub is used. Sensors Types There are many options for sensors that may be used. This is a subset of sensors available. Door Contact DC A simple magnetic switch that messages when the sensor
detects if the door or windowed opens or closes. A house typically has Door Contacts installed at each entrance to the dwelling or at vulnerable entry points such as patio doors.
Passive Infrared Movement Detector
PIR This detector detects movement. Most are pet-friendly, and some have cameras that can take photos when movement is detected.
Smoke Detector CD A smoke detector has a built-in siren and can work independently of the hub.
CO Detector COD A CO detector has a built-in siren and can work independently of the hub.
Temperature and Humidity Sensor
A sensor used with HVAC systems to regulate house comfort levels.
Water / Flood Detector
WD/FD A flood detector usually has a built-in siren and can usually work independently of the hub.
2 We prototyped a similar software for iOS but due to the limited APIs for data collection and complicated installation procedure for non-AppStore applications, we decided to stop working on the iOS tool.

v.1.0 UCN
D2.2: Report on Data Collection Methodologies
12
External Siren An alarm device that is triggered by the hub if a sensor indicates an alarm condition.
Strobe / Sounders / Vibrating Pads
Devices that indicate an alarm condition to those hard of hearing.
Smart Plugs / Smart Sockets
PSS / PSM
A Powered Smart Switch device is used to control power to appliances and lamps. Some versions include power consumption monitoring. Some versions also act as ZigBee or Z-Wave repeaters.
Energy Meter Monitor
A device attached to an electricity or gas meter to measure whole-house consumption. Some smart meters have this facility built-in.
Boiler and Heating/Cooling Controllers
Devices that controller HVAC systems based upon one or more thermostats and a hot water and heating/cooling program.
Key Fob Similar to a car key fob, the user can arm or disarm the hub. Often has panic and night mode buttons.
Key Pad A small numeric keyboard installed near the main entrance to the house to enter PIN numbers to arm and disarm the hub. Can also be used to indicate fire, panic and duress alarms.
Fall Sensor A device worn by a person that detects if the person has fallen. The sensor also acts as a panic alarm and can be manually activated.
Sensor Communications Sensors generally communicate only with a hub. In turn, the hub communicates with the outside world. Some sensors can communicate directly between each other – for example Sprue Aegis WiSafe2 sensors. Almost all sensors use wireless technology to communicate. There are several options for the communication, including ZigBee, Z-Wave and various proprietary 860Mhz protocols. Less common are Bluetooth, DECT and WiFi. Sensors communicate their activity immediately that it occurs to the hub. The hub translates the sensor message into a standardised message that the Intamac ENSO platform can process. Sleepy Sensors Most sensors run on battery power. Most battery powered sensors are “sleepy”. To save battery consumption, a sensor will stop communicating with the hub until it has something to report. Most sleepy sensors will send a regular “heartbeat” message to the hub, usually once per hour. PIR type sensors will go to sleep immediately that they detect and report movement and will not wake up until a period of time has passed with no movement detected. This strategy is necessary to achieve a 1-2 year battery life. A “busy” sensor that regularly communicates with the hub will have a drastically shorter battery life.
v.1.0 UCN
D2.2: Report on Data Collection Methodologies
13
Sensors that are permanently powered, such as smart plugs, are not sleepy. Sensors that can be commanded to perform an action, such as sirens, smart plugs or light switches are usually permanently powered and not sleepy. Sensor Messages A sensor reports activity only and not the interpretation of the activity. For example, a Door Contact sensor could report “Door Open”, but not “Intrusion Detected”. The messages a sensor can send is dependent upon the type of sensor. Sensors can also report telemetrics such as energy consumption or temperature. Telemetrics are usually requested rather than published. Sensors can also report whether they are tampered with, such as if the case is opened. Sensors also report battery status, connectivity status, etc. Hub Automation and Modes The hub responds to the sensors messages and relays messages to the cloud platform. A hub can be in different modes – usually Armed, Alarming, Disarmed and Night. The different modes influence the responses to the events that may occur. Rules applied to the hub provide the definition of the behaviour. For example:
1. If the Hub is in Armed mode and a Door Contact of type Perimeter reports status Opened, then change state to Alarming.
2. If states changes to Alarming, sound all Sirens; start Recording state on all video cameras. 3. If Keypad Disarm button is pressed then change hub state to Disarmed. 4. If hub state changes to Disarmed, silence all Sirens. 5. If hub state changes, inform cloud of new state.
Likewise, the cloud also includes a rules engine to process cloud based responses to events. Actions performed in the cloud include informing the system users of alarm conditions, sending commands to the hub, etc. Presence Detection A sensor will not, in itself, provide a presence detection solution. Presence detection includes the following:
§ Who is present? § Where in the dwelling is each person present? § Is the person moving between locations or leaving a location? § If a person is not in the dwelling, are they nearby or heading to or away from the
dwelling? § What is each person’s usual routine?

v.1.0 UCN
D2.2: Report on Data Collection Methodologies
14
The PIH recommender will take the relevant sensor data to calculate presence. For example, if a key fob or fall sensor is present, it is likely that the device owner is present. If video face detection detects more people in the house than there are residents defined, it is fair to assume that visitors are present. If a smart phone is present in the house (e.g., is connected to the WiFi), it is likely that the owner is present. This data can be cross-referenced to corroborate the likelihood. Video Cameras Video cameras can detect movement and sound and report these events to the cloud. The cameras can be configured to record a video clip when it detects activity. Video cameras can also be used to stream live video to a user while away from the house. Streaming is limited by the domestic network bandwidth available for upload. Video cameras work independently of the hub and communicate directly with the cloud. Cloud communications Devices such as hubs and video cameras talk with the cloud via secure XMPP and REST protocols. Video is streamed from the camera as either live video or clips stored in the camera. Streaming is secured via cloud services. For example, an authorisation token obtained by the viewing app is valid for 1 minute and needs to be renewed regularly during playback. 3.2.2 PT Smart Sense
The PT Smart Sense project collects data from well being sensors and channels it to the cloud backend either through the home Internet connection of the gateway (GTW) or any other Wi-Fi connection using a mobile phone as a GTW. The main objective of the project is to present aggregated and post-processed sensor data over time (e.g. week) to the user to allow him (or any other care taker) to monitor his well being. In order to perform this task, it is important to:
§ Collect information from sensors which can give information about weight, blood pressure, sugar level, etc.; this information can be collected by the user or any other person (care taker) as long as it is authorized. It can be automatically fed by the sensor or introduced manually.
§ Go through a learning process to understand what is normal and is a deviation and process aggregated values (e.g. body mass)
§ Represent graphically the relevant values to be visualized on a TV or mobile device.
To help users being updated about their health evolution, this projects aims at facilitating and storing vital measures, like weight, blood pressure and cardiac rhythm. Knowing that data is only helpful if it can be used to give relevant information to users, it also has the aim to provide evolution of users well being and detect abnormal values, by comparing with historic data.

v.1.0 UCN
D2.2: Report on Data Collection Methodologies
15
Methodology This project was developed following two steps:
§ A pool of volunteers from PT Inovação (any employee can use the application); § A selected tester partner; a Portuguese institution which takes care of elder people
(Santa Casa da Misericórdia)
Data collection, privacy and security All measures can be collected using physical devices (sensors) connected to a GTW by Bluetooth (or some other selected protocols e.g. ZigBee - adaptors have to be developed case by case) or manually by the user or any authorised caretaker. Each user has his own account that he uses to log in and perform the measurement. The available data that has been monitored can be seen on the following table.
Well Being data Temperature Blood Pressure (Systolic and Diastolic) Weight Glucose Movement Oxygen saturation Heart Beat Rate EMG ECG Foot Temperature Foot Humidity Body Mass Index (calculated) Respiratory Rate Step Counter
Table 5: Recorded measures
Service overview Measurement devices are connected to one Raspberry Pi gateway that sends data to the SmartData backend platform. The devices are used as usual, allowing the evaluation of blood pressure, cardiac rhythm and weight. Through a web portal is possible to access the measurements evolution, calculate the Body Mass Index (BMI) and check median values. The measures can be seen on a large range of devices, from a TV Screen to a Smartphone. There can also be physicians or caretakers that see the evolution and can be notified by abnormalities. Technical overview Data retrieved by devices is sent to SmartData backend platform where it is routed to a PostgreSQL database, for lifelong storing, and to Cassandra big data database. On top of that

v.1.0 UCN
D2.2: Report on Data Collection Methodologies
16
sits the REST API that provides access to Cassandra data. The portal uses those endpoints to provide meaningful information to users.
Figure 1: User interface on a Meo STB
Figure 2: High level architecture
Currently, the connection between the STB and the backend is secured through a VPN but it is being replaced by a secure encryption algorithm. We are also working on privacy policies that will be handled by the user. More details on security and privacy can be found in D4.2.

v.1.0 UCN
D2.2: Report on Data Collection Methodologies
17
3.3 Home Gateways
Users today often access Internet from home. A collector running on the home gateway can observe all the network traffic in the home network and to/from the Internet. Hence, it can track all users’ networked activities when users are at home. It can also observe which devices are connected to the home network and when as well as the performance of the home network. We have developed data collection tools for the Technicolor commercial gateways (3.3.1), and we also leverage data collection tools developed for gateways running open platforms (3.3.2) where we can obtain more detailed measurements. One problem of collecting user context data from the gateways is that we must be able to identify the users interacting with networked devices. We discuss an initial approach to address this issue in 3.3.3. Finally, in 3.3.4, we describe our initial efforts on personalized home network diagnosis. Efficient and accurate methods to diagnose network problems in users’ homes is key to adapt network behavior and content delivery to users.
3.3.1 Data Collection on Technicolor Gateways
Technicolor is working together with Portugal Telecom on a home gateway monitoring framework (gateway probes and scalable backend). Below we describe the gateway platform, the data collection methodology and the on-going pilot deployment that involves a number of real PT customers. Technicolor Gateway Description: The hardware platform (i) supports both ADSL2+ or Fiber ONT connectivity, (ii) 4x100 Mbps full duplex Ethernet ports, (iii) a WiFi access point enabled by a Broadcom 802.11b/g/n 2x2 radio with MIMO support, operating at 2.4Ghz with support for both 20Ghz and 40Mhz channels. The gateway firmware supports the Open Gateway Services Initiative (OSGI) specification—a java middleware framework that enables drop-in modules that can extend the functionality and services offered by the gateway in a modular manner. Collection Methodology: We have implemented a lightweight OSGI module that periodically queries a set of metrics that change over time. The OSGI module starts with a default set of metrics and an associated frequency. The metrics we collect are restricted by the list of metrics currently exposed by the gateway API. Hence, we can only collect a sub-set of the metrics listed in Section 2.3. In particular, we collect only network metrics and user activity metrics (except HTTP headers). At every period, the module queries the metrics against a proprietary API, formats the results as a JSON object, and sends this using a HTTP POST to a backend server. The server responds with a new set of parameters (and frequency) or a default reply (which maintains the current configuration). Particular design choices in our data collection (frequency, metrics, data format) are configurable, but in practice these are dictated by a set of very stringent operational constraints: the additional monitoring could not affect the stability of the gateway platforms, or negatively impact any of the services offered. This on a fairly resource constrained hardware platform. This precludes the monitoring module from maintaining large amounts of state, using excessive bandwidth, polling frequently. After a considerable testing effort, the monitoring module in our test deployment

v.1.0 UCN
D2.2: Report on Data Collection Methodologies
18
was configured with a polling period of 1 minute3. The JSON objects received at the server vary between 15-20kB. Test Deployment: We have instrumented a number of residential home gateways since over a year in Portugal Telecom. Each of the subscribers in our deployment is subscribed to a Triple-play service, which offers three distinct services -- (i) Internet access, (ii) managed IPTV service, and (iii) managed VoIP service. The Internet service is offered in three different speed/service tiers, with small price differences across the offerings. The IPTV service is offered in two packages -- basic, with 120 channels, or premium, with 170 channels. Currently, all of the subscribers are subscribed to the latter offering. In addition to the "broadcast" TV, the Portugal Telecom also provides a mechanism for subscribers to stream the broadcasting (also a catch-up TV service) on supported devices (mobile devices and computers). The voice service provides free calling to fixed lines in-country (always), and during off peak hours (9pm to 9am). Calls made outside of this set incur usage charges proportional to call duration. Importantly, the VoIP service is provided differently based on the underlying access technology. ADSL subscribers obtain a fixed line telephony service -- the telephone instrument is directly plugged into the phone outlet, while Fiber customers receive a managed VoIP service through the home gateway. Packets for IPTV and VoIP are given higher forwarding priority, presumably due to the latency sensitive nature of the applications. 3.3.2 Data Collection on Open Gateway Platforms
Data collection tools for open gateway platforms allow us to get more detailed measurements of user traffic traversing the gateway, because we are no longer limited by the gateway API to collect measurements. UCN will leverage data collection tools that run on two distinct platforms: OpenWRT, the Linux version for embedded devices, which is available in a number of off-the-shelf home routers; and a Linux Eee PC notebook developed for the Homework project [6]. These data collection tools have been developed in our previous work. OpenWRT gateways: Inria brings into UCN its long-term collaboration with the BISmark project (http://projectbismark.net/). BISmark instruments home gateways to perform both active measurements of access ISP performance and passive measurements of home traffic. We are collaborating with the BISmark team to develop a module, called WTF (Where is The Fault) that uses pcap to collect the packet headers from each flow from the wide-area network interface on the router, as well as from both wireless interfaces. It sends these packet headers to a server. To preserve user privacy, WTF only collects the IP and TCP headers from packets and anonymizes all IP addresses and MAC addresses using a SHA-256 hash salted with a router-specific secret. The router discards all private information before uploading statistics to the server, at which point it deletes all local data. We perform all analysis on the server side with anonymized statistics. Continuous data collection and analysis imposes significant CPU load, and the traces themselves can be large. Thus, WTF collects packet traces periodically. In UCN, we can use these traces to compute most of the network statistics listed in 2.3, the application performance metrics and the user activity metrics except for IPTV and VoIP data as we have no access to triple-play services traffic.
3 Our dataset also includes a smaller, initial deployment with 30 second polling.

v.1.0 UCN
D2.2: Report on Data Collection Methodologies
19
Homework gateways: The Homework router platform from University of Nottingham [6,7] mixes standard open-source components with custom software to implement a routing platform that makes data collection and platform control available via simple REST APIs. Deployed on a Linux eeePC, it relaxes the resource constraints of traditional home router platforms to enable richer data collection and experimentation with different purpose-specific UIs. Several such UIs were produced and deployed with users for extended periods (4—6 months) in a previous project. Platform control was enabled by using NOX and Open vSwitch, open-source OpenFlow controller and switch implementations respectively. Data collection was enabled through a custom database supporting an extended version of the Stanford STREAM Data Manager (http://infolab.stanford.edu/stream/) as three components. The ephemeral timeseries component holds the most recent (complete) data received from monitoring processes. The continuous, large volume of such data makes it infeasible to persist it all, and demands careful implementation to keep up. A persistent timeseries component holds (selected) timeseries data for later use, and a persistent relational component stores derived information unrelated to the time of occurrence, e.g., machine details and the daily volume of data. Packets were intercepted when forwarded using libpcap and the data gathered used to populate three default persistent timeseries:
§ A flows table captures network traffic by recording the number of packets and bytes associated with a particular (transport level) type of traffic in the preceding second, recording protocol, source and destination information. This allows us to monitor bandwidth usage in the home.
§ A links table captures wireless device information by recording the received signal strength, number of retries, and number of packets associated with a particular device. This allows us to show machines within range of the network, and the wireless topology of the setting.
§ A leases table captures connection to the network by recording when a DHCP lease (see below) is granted to a device, or a lease is revoked. This allows us to indicate the status of machines connected to the network.
These tables were then accessed directly by some UI applications, and were further processed and combined with other application specific data and events to produce derived tables used by yet other UI applications. 3.3.3 Recognizing Users in Home Gateway Data
In this section we summarize our work on user identification from home gateway data [5]. The goal of this work is to explore the possibilities for detecting the unique behaviours and traffic characteristics of users within their NetFlow traces. This would enable the automatic assignment of traffic to specific users, enabling reporting and control of the network using the ”user behind the device” as the focus rather than the device itself. The first challenge we address is how to collect a valid ground truth dataset linking NetFlow data to users within the domestic environment. To this end, we designed HomeNetViewer to

v.1.0 UCN
D2.2: Report on Data Collection Methodologies
20
collect, visualise and annotate network data within the home. Then, we report some results from our preliminary investigations conducted with NetFlow traces collected in a previous study, annotated retrospectively using HomeNetViewer by one occupant of the household. System Design Our system was built around the Homework router platform. During the design phase, we observed that a high fraction of user traffic was HTTP traffic, and for this reason it was decided to focus the interface on exploring HTTP traffic rather than traffic on all ports. HTTP also has the advantage that users are somewhat familiar with its main identifying feature, the Uniform Resource Locator (URL) and the host/domain names contained within them. HTTPS was not included as the encryption prevented the extraction of the required data from the packets as they passed through the router. It was also observed that non-HTTP activity on the network, for example, Skype and BitTorrent often left clues in the HTTP logs that they were in use. These clues take the form of either visits to related websites (e.g. torrent search engines) or accessing interface components and/or software updates over HTTP (e.g. Skype’s interface is an embedded web page). We constructed an interface to visualise the data and collect annotations, including; device ownership, device usage and user activity ground truth annotations. It consisted of a set of time-lines one for each device connected to the network. Each set of time-lines was labelled with the device hostname where available, or the device MAC address if no hostname was captured. The devices could be renamed by the users to a more human friendly name if required. It was also possible to assign an owner to each of the devices in the interface. The timelines represented Wi-Fi RSSI bandwidth (inbound and outbound) and annotated HTTP visits along with annotations added by the users. Any section of the time line is selectable and the users could apply a number of annotation types to the selected time range. These are: Host/Domain activity tags: a nested list of all the hosts that were contacted in the selected time frame grouped by domain name, and where users were instructed to examine the list to find domain/hostnames that they recognised. They were then asked to add ”tags”, relating to the activity most likely to have caused them to visit that domain/host. Tags are entered as free text but a list of previously entered tags is displayed to improve consistency and reduce duplication. Host/Domain user tags: it was noted that some hosts/domains have a strong link to an individual in the household so this data was also collected. Search activity tags: View and assign search terms to activities. Search user tags: View and assign search terms to users. Free user: Annotate the time-lines with who was using a device at a given time Free activity: Annotate the time-lines with the activity being performed at a given time. Experimental Setup Our initial experiment was developed using five months of traffic captured within a single-family household in mid 2012 using the Homework router platform [7]. The household consisted of two adults of working age with two children at secondary school. These traces were collected from 24 devices. A breakdown of these can be seen in Table 6. The traces contained:
• 32.6 million IP flow records, 15.6 million in and 17.0 million out the imbalance is due to failed connections.
• 17.1 million HTTP requests. • 32 million RSSI readings.

v.1.0 UCN
D2.2: Report on Data Collection Methodologies
21
• 23 thousand DHCP lease requests.
Table 6: Device breakdown
Table 7: Number of annotations by type
Using the interface described above we instructed the participant to annotate three weeks of network traces from their household. This generated 547 annotations. Table 7 shows which type of annotations were collected to be used as the ground truth for our classifiers. Training the Classifiers Using the generated annotations, it has been possible to perform a preliminary analysis to ascertain the feasibility of using these annotations to assign traffic to users. The annotations allowed the assignment of 99 thousand of the 2.9 million flows (33%) recorded on port 80 and 443 to users, creating our ground truth dataset. This dataset allowed us to formulate a simple supervised machine learning classification problem. We evaluated several classifiers (Naive Bayes, k-Nearest Neighbors, Random forest) and the tree based random forest classifier provided the best initial results. The dataset was split into to two sections the first 4000 flows per user were designated as the training set and the remaining flows were used to verify the resulting classifier. The classifiers were trained on eight features extracted from the flow records these were; number of packets, flow duration, time since the last flow to same hosts, packet rate, average packet bytes, source address or destination address and destination port or source port. The accuracy of the best classifier varied from 57% to 88% for different users (complete results available in [5]). Discussion While we have shown for some users that this technique can provide reasonable results the accuracy of the classifiers needs to be significantly improved before it would be acceptable for deployment in a real system.
range. These are:
Host/Domain activity tags: a nested list of all the hoststhat were contacted in the selected time frame grouped bydomain name (see Figure 4). Where users were instructedto examine the list to find domain/hostnames that theyrecognised. They were then asked to add ”tags”, relatingto the activity most likely to have caused them to visitthat domain/host. Tags are entered as free text but a listof previously entered tags is displayed to improveconsistency and reduce duplication. Host/Domain usertags: it was noted that some hosts/domains have astrong link to an individual in the household so this datawas also collected. Search activity tags: View andassign search terms to activities. Search user tags: Viewand assign search terms to users. Free user: Annotatethe time-lines with who was using a device at a given timeFree activity: Annotate the time-lines with the activitybeing performed at a given time.
Experimental set-upOur initial experiment was developed using five months oftra�c captured within a single-family household in mid2012 using the Homework router platform [8]. Thehousehold consisted of two adults of working age with twochildren at secondary school. These traces were collectedfrom 24 devices. A breakdown of these can be seen intable 1. The traces contained:
• 32.6 million IP flow records, 15.6 million in and 17.0million out the imbalance is due to failedconnections.
• 17.1 million HTTP requests.• 32 million RSSI readings.• 23 thousand DHCP lease requests.
Using the interface described above we instructed theparticipant to annotate three weeks of network tracesfrom their household. This generated 547 annotations.Table 2 shows which type of annotations were collected tobe used as the ground truth for our classifiers.
Device Type Num devices Num flows (Millions)Mobile phone 4 0.4Desktop PC 2 11.3Laptops 4 9.5Tablets 6 7.1Music players 2 0.1Games consoles 1 0.8Unknown 5 2.7
Table 1: breakdown of the device in our dataset
Annotation Type Number of annotationshost/domain activity 107host/domain user 28Search activity 195Search user 157free user 59free activity 0
Table 2: Number of each type of annotation collected
Training the classifiersUsing the generated annotations, it has been possible toperform a preliminary analysis to ascertain the feasibilityof using these annotations to assign tra�c to users. Theannotations allowed the assignment of 99 thousand of the2.9 million flows (33%) recorded on port 80 and 443 tousers, creating our ground truth dataset. We chose toexamine inbound and outbound flows separately, usinginbound flows to look for variations in the behaviour of
907
WORKSHOP: HOMESYS

v.1.0 UCN
D2.2: Report on Data Collection Methodologies
22
The human annotations collected for this analysis occurred a significant time after the acquisition of the data. This passage of time affected the quality and density of our ground truth because it was not always apparent to our participant who caused the observed traffic. Hence, some sections of the traffic are un-annotated. Within the un-annotated sections of traffic it is imposable to calculate the accuracy of the generated annotations as we do not have the required ground truth for comparison. Several sources of noise have been identified within the data which may have a impact on the accuracy of the classification. One source of noise originates from the underlying structure of web based applications. A single-page visit will download many resources (html, images, js and css), generating many flows per page view. Even if the page is customized to a user a significant number of the resources related to the operation of the site will be identical between users. Therefore, only a small number of flows for a particular site visit will provide useful information to the classifiers. We also observed a large number of the generated annotations were at times when only automatic traffic was observed (e.g. windows update and ICloud backup). We attribute this to automatic traffic being present as noise in the classifier training set. Filtering out these common flows and removing automated traffic before classification may lead to a better result. How to achieve this and whether it will have any impact on accuracy is still an open question. Our classifiers also worked across all devices on the network. This may have a bearing on accuracy as different devices generate distinctive traffic patterns for visits to the same web application. For example, a mobile optimised website may deliver different content to mobile and desktop clients. Hence, training one classifier per device may prove beneficial. Another approach to improve accuracy would be to change the way the classifiers operate. Currently, our classifier considers a single flow at a time. A better strategy may be to look at several flows at once, for example, grouping flows by time and using multiple flows as a single observation. 3.3.4 Home Network Diagnosis
UCN aims at personalizing the networking experience of users. Many users today connect to the Internet from home, but there are no easy-to-use diagnosis tools to assist the majority of users who are not network experts. Hence, UCN is focusing on developing methods to assist users when they experience trouble with their home networks. The assistance should be made specific to the user’s ability to fix a technical problem. Our methods will help both end-users and ISPs. In fact, our discussions with several large access ISPs reveal that service calls are (1) costly and (2) many calls are usually caused by problems that have nothing to do with the ISP. Therefore, ISPs are eager to deploy online techniques to assist in home network diagnosis. We will solve this problem in two phases: first, develop more efficient mechanisms for home users to report trouble to their home ISP (instead of waiting for hours on a phone line) and then to provide a personalized diagnosis. Technicolor and Inria made a first attempt by implementing this system on the set-top-box so that home users can complain about their network performance directly from their TVs. This enhanced set-top-box also performed active measurements to determine network performance over time and anytime a user reports a problem. We developed this system using the “Astro box”, an android set-top-box with

v.1.0 UCN
D2.2: Report on Data Collection Methodologies
23
HDMI in and out ports designed by Technicolor. The Astro box allowed us to “overlay” any content on the TV image, and in particular to interact with the home network user. The system supported active probing (inside the home network and on internet link) to capture access performance and “browsing” and “streaming” experience of users as well as to characterize devices inside the home (number, type). We also developed an intuitive user interface for users to report trouble on their TVs (instead of calling a call center), capturing user feedback in just a few clicks. In the Fall of 2014, Technicolor/Inria sent the Astro box for testing in Portugal Telecom for later deployment. Unfortunately, the box was not stable enough to go into production. We spent considerable time trying to debug all the issues, but the box was never stable for more than a week. Given the lack of support for developing in the box and the fact that the Astro box was limited in term of CPU and memory, we have decided to abandon this approach. Instead, we decided to develop diagnosis techniques that rely only on data collected in the home gateway. Inria is working with the BISmark team on techniques to detect whether throughput bottlenecks are in the home wireless network or on the access link. We use the OpenWRT data collection method described in Section 3.3.2 to capture TCP/IP headers of packets traversing the gateway to identify throughput bottlenecks. Technicolor and Inria are working on new techniques to diagnose poor home wireless performance. Wireless is known to be the #1 problems for customers and the most complex to (1) diagnose and (2) fix. In this work we rely only on passive metrics exposed by the gateway wireless driver to identify the problem root cause and then explain the user how to fix the problem. We are working with the metrics collected as described in Section 3.3.1. As a starting point, we are studying how wireless performance metrics correlate with achieved throughput so that we can explain why users have low throughput in home wireless networks. It should be noticed that wireless troubleshooting is an extremely complex problem (due to the unpredictable nature of the communication medium) and that providing personalized online support will have a huge impact on the user experience. This is why we decided to address this personalization problem in priority. For the user interaction, we will use a feature of Technicolor gateways known as Qeo, which allows gateways to communicate with any Qeo-capable device in the home. Qeo is standardized under the AllSeen Alliance, an industry consortium that develops open source solutions for home devices interaction. Instead of using a special STB and the TV, our plan is that the user will use a tablet or phone app to report problems to the ISP. When such a problem is reported, the app will communicate with the GW (thanks to Qeo) to perform a local root cause analysis and the user will receive a report proposing one or more ways to fix the problem they experience. Note that with this approach, we can also use the cellular network to report an eventual failure of the access network. 3.4 Service Backends
In this section, we describe the data collection methodology and deployment at partners’ existing media service backends: NICTA’s Social TV platform and Portugal Telecom’s IPTV service.

v.1.0 UCN
D2.2: Report on Data Collection Methodologies
24
3.4.1 NICTA Next-Generation Content Discovery & Distribution Project
The Next-Generation Content Discovery & Distribution project is a research project to design, develop and trial technologies in the area of social TV, recommendation and content distribution. The project represents a collaborative effort between Australian Centre for Broadband Innovation (ACBI) and National ICT Australia Ltd (NICTA). The project also has a number of partners including the Australian Broadcasting Corporation, Technicolor, AARNET & others. The project has two overarching objectives:
• Exploring Usage, Recommendation & Privacy: as more user-generated and studio-generated content becomes available, the task of finding and positioning content becomes difficult. In this context, this project specifically focuses on maximising content recommendation effectiveness, while taking into account the privacy implication to the end users. Therefore, this aspect of the project has two key objectives:
o Develop new content recommendation techniques, which overcome the current recommendation systems’ limitations including low accuracy and loss of privacy
o Develop new privacy-preserving mechanisms to compute statistically sound aggregated usage and behaviour data, while preserving the privacy of data belonging to individual users or service providers.
• Efficient Content Delivery: the bandwidth and storage costs associated with distributing large amounts of on demand content are extremely high. This project addresses this problem by developing peer-assisted, scalable & efficient content distribution methods for on-demand video.
Methodology The proposed methodology draws on both theoretical and experimental research, and the use of trial sites to feed data back into the research. When appropriate, the experimental approach will seek to use live prototypes with real users, in particular for the collection of data for the behavioural-related research (e.g., recommendation engines). To this end, NICTA established two test beds in the following order:
§ A laboratory test-bed, internal to NICTA, serving 6-10 users; this test-bed is primarily used for development, testing and demonstration.
§ A university or community residence environment for some hundreds of users. The focus of this trial was the collection of data for the behavioural aspects of the project, in collaboration with the University of New England in Armidale.
We plan to apply the lessons learned from these environments in the context of UCN. Data Collection and Privacy As discussed, the trials for the project were established primarily with the purpose of gathering data. Privacy of the trial participants, however, was considered of utmost

v.1.0 UCN
D2.2: Report on Data Collection Methodologies
25
importance, and trial participants were informed as to exactly what information was being recorded. A range of data from the trials was captured, stored and analysed, though no attempt was made to reconcile this data to any user. No user identification or IP address information was stored along with the usage data and while each participant was identified by a unique key associated with their client software bundle, no login, email or any other form of identification was required. Usage data was collected for the duration of the trial, and was stored at NICTA, in accordance with NICTA’s data safety policies and practices. The following key user reactions were recorded:
§ Title / Genre & Channel Selection § Like, Play, Stop, Pause, Resume events § Twitter, Facebook and Recommendation posts
Trial participants were offered free live, catch-up TV and video-on-demand services, for the duration of the trial. The live TV service consisted of free-to-air TV channels (http://www.freeview.com.au/), with a catch-up TV service offered in partnership with the Australian Broadcasting Corporation, with the videos selected from their iView service (http://www.abc.net.au/iview/). For the video-on-demand service, videos were selected from popular TED Talks (http://www.ted.com/). The respective hosts of future trials may also later add additional material. In the case of a university, for example, this may include lectures or other informational material. During the trial, the participants were able to watch TV through their computer, and their usage history was stored and securely transmitted to a data collection server for later analysis. Specifically, any “Like” “play”, “stop”, “pause” events, and the associated video item (title, genre, etc or TV channel) were collected. The collected data was used periodically to enable a video recommendation service, where users are presented with videos that are more likely to interest them. From an ethical standpoint, data was only collected on videos played through our client application, which was restricted to the videos we provided as part of the service. In addition, there was no specific content of sensitive nature in the video on demand system (no adult-only material or other). All videos provided by either the ABC or from TED Talks were reviewed by the project team before presentation within the system. Service Overview The service provided by the Social TV platform includes a range of content delivered to either a PC/Mac based client application or a more traditional Set-top Box, all via IP. The service includes:
§ Live TV - Captured from a local, conventional Live TV signal and re-broadcast over IP using multicast
§ Video on demand/catch up TV using ABC iView content § Online Content (Such as TED Talks), Local Content (Such as university lectures)
& social network integration such as Twitter and Facebook § Recommendation fusion of online + broadcast + catch-up TV content

v.1.0 UCN
D2.2: Report on Data Collection Methodologies
26
The service was provided at no cost to trial hosts or participants and offered participants a modern user interface to select and view content. The experience is identical regardless of the platform, providing a consistent user experience, and access to standard Live TV, ABC iView, Internet and locally added content.
Figure 3: Service Appearance - Recommendations Screen
In addition to a standard EPG that is expected for a Live TV service, users also experience a recommendation screen, detailed information screens and a capability to provide and view ratings and feedback on programs. Facebook and Twitter integration allows participants to automatically post and view comments on the program being watched.
Figure 4: Appearance - Program On-Screen Twitter Integration
Users are able to comment on programs directly while watching TV, and view other comments on the program being watched.

v.1.0 UCN
D2.2: Report on Data Collection Methodologies
27
Figure 5: Service Appearance - Program Detail
Much like iView from the ABC, users are able to get detailed information on each program as well as have immediate access to social network information on the program. Content Licensing: The right to re-broadcast iView content is provided by the ABC, with explicit approval granted for each trial. The Live TV signal is a re-broadcast local TV signal, and is therefore license free, and TED talks are free for redistribution. Any additional content delivered on the platform by the trial hosts must be owned by the trial host or licensed for redistribution on such a platform. Recommendation Service The recommendation service, developed at NICTA, is realised through the use of collaborative filtering techniques, where users and video items are logically clustered in the recommendation engine. This clustering is not directly exposed to participants, who only see a list of suggestions. The quality of the recommendation engine output will then be evaluated and refined in an attempt to maximise the quality of the recommendation. The quality of the recommendation will be measured, e.g. as the ratio of items viewed from the recommended list to the overall number of item viewed. Video on-demand recommendations have been around for some time, but this study allows us to obtain a live, on-demand and catch-up TV services data set. The live TV events can be annotated with Electronic Program Guides, to obtain information about the show currently being watched. Technical Overview The project utilises a primary server in NICTA in Sydney as an aggregation point for content delivered as part of the service offering to trial participants. A replica of this primary server serves as the main delivery server for each trial site. Essentially, this server requires a connection to AARNET to be kept up to date, and a reliable network connection to its clients.

v.1.0 UCN
D2.2: Report on Data Collection Methodologies
28
In addition, the server requires an aerial connection to enable it to receive and re-transmit free to air TV. This is illustrated at a high level in the diagram below.
Figure 6: High Level Infrastructure Overview The project requires a single on-site 3RU Server with ~2TB or RAID enabled Storage, Video Ingest and streaming capability. This server performs the content ingest and multicast of the Live TV, and also serves the on demand streams. The system requires a secure, cooled environment, as well as a local TV aerial feed to enable it to capture the local TV channels. Clients for the trial may be in one of 2 forms: an application for a PC/Mac, or a stand-alone set-top box running the same application. In the initial stages of the trials, only the desktop application will be available. The application is a browser-based desktop application bundle that must be downloaded and installed on the user’s PC. The application is supported on Windows, Linux or MacOSX based machines, and requires a reasonably modern computer (last 5 years or so) with at least 2GB RAM to run effectively. Trials at Armidale The project had trials outside NICTA, at the University of New England (UNE), Armidale. With its commitment to research, excellent local network infrastructure, large local student population and proximity to early NBN deployments, the University of New England in Armidale was a prefect trial site for the service. Approval process: Independent of the technical evaluation, implementation of the trial will required an approval process. The UNE required to know which data was to be collected, and

v.1.0 UCN
D2.2: Report on Data Collection Methodologies
29
NICTA delivered a document describing the exact information collected and the timeframe of the data collection. The Trial with UNE: the trial in the University of New England leveraged existing NICTA infrastructure, adding a single on-campus server with access via AARNET. It was considered best to install the server in a secure server room that has a simple access to a roof UHF antenna, and was close to the colleges. The server had a uniquely resolved interface for student clients and one for the staff network, + 1 for management. Participant Population & Network: The primary targets for the trial were the dorm rooms at the colleges. Rooms are simple and have no Aerial, though students could have a TV and their own aerial (estimated <50% have TVs). Foxtel redistribution was tried for a while over IP though the take-up rate was poor – students didn’t want to pay for it. Housing 2100 students, there is a 10G link to the colleges - 2 x 1G to each of the 8 colleges, with 1GBit/s to each room. The Colleges are all on a L2 Switched VLAN and ideally. Service delivery ports of the server were best in this VLAN as the bulk of the traffic could remain within this VLAN rather than be routed back through the campus network. The campus wireless network is A//B/G Dual radio “Dumb” Access Points with no 802.11n yet. This network is geared to supporting common areas and was unlikely to be viable for delivery of much (if any) of content from the service. Indeed, usage on the service could dramatically affect other services on the wireless network, so the service was considered unlikely to be made available via the wireless network. Security: ABC had stringent requirements around the security of IView content, and NICTA confirmed their approval based on the parameters for likely restricted access to the server room on campus. The server room is card swipe access only with revocation, and ~20 IT staff have access. Network access to server was also secured. Data Rates and Protocols: VOD Video (iView) is 650K with the Multicast being up to 19Mbit/s according to the channel. Total bandwidth of multicast traffic for all channels is estimated at 110Mbit/s. It is expected that the load on the server for VOD traffic could be quite high, given the number of potential participants, and performance testing will be conducted by NICTA. The Following protocols will need to be enabled in order to deliver the service:
1. Client side delivery is HTTP/HTTPS or multicast 2. IGMP V2 required on the server as network does not yet have IGMP V3 support 3. Management and content replication on server require RSYNC and SSH enabled
The 1st Trial Summary Location: University of New England, student dormitory Population: 2500 students Trial period: ~ 7 months (Feb 22, 2013 – Sept 22, 2013) Stats:
1286 downloads 135 monthly active unique users

v.1.0 UCN
D2.2: Report on Data Collection Methodologies
30
What Have We Learned Several approaches for TV show recommendation engines were compared; the best method found to be performing on the iView workload is matrix factorization, a commonly used method for movie recommendation. The matrix factorization algorithm factorizes the users’ input ratings matrix into two latent matrices: a user-factor matrix and an item-factor matrix. The dimension of the latent matrices, k, is an external factorization parameter. One of the advantages of the matrix factorization model in the context of UCN, is that inputs from several information sources (user ratings, social media, etc.) can be incorporated into the same latent factor domain. Unfortunately, the online-social network augmented recommendations could not be designed due to lack of data in the trials, and is left for future work. In this trial, students mostly watched live TV – this results in a sparse dataset for VoD, and makes it hard to evaluate the recommender output (which only operates on VOD). We need better content for VoD matching the demographic of participants.
0
100
200
300
400
500
600
700 Total users
0
20
40
60
80 Daily unique users
0
50
100
150
200
250
300
2/22/13 3/22/13 4/22/13 5/22/13 6/22/13 7/22/13 8/22/13 9/22/13
VOD views
Live TV views

v.1.0 UCN
D2.2: Report on Data Collection Methodologies
31
We need to interview students to understand user reticence / retention issues. However, we have no direct access to students, and have to relay through student services and head of collages. During the trial, we had technical issues due to multicast deployment on campus - multicast works on wired network only, where some students prefer Wi-Fi. Doing user-based trial research in the TV/entertainment area is challenging. The main difficulties are:
§ Content acquisition - how to find content which appeals to a large portion of the trial population.
§ User acquisition - how to convince potential users to invest time and effort into using a new system or platform, especially for a temporary trial. User utility needs to be high in this case.
§ Engineering required - doing user-based trials requires product design and engineering experience, which is difficult to find in a research organization
3.4.2 PT Smart TV
The aim of the PT Smart TV project is to design and develop new services for the Portuguese IPTV users. It includes suggestions and recommendations, visualisation of aggregated data derived from normal TV consumption information as well as social networking integration. Currently, data is being collected from different sources: IPTV Set Top Boxes (STBs), mobile TV apps, Twitter and Facebook. Data can be collected at the home gateways (GTWs) for simple usage services or users who want to access a smarter service, have to install an application on their STBs which will feed data into the so called PT SmartData cloud platform, allowing algorithms to process and recommend based on their viewing patterns. It is also possible to collect data from a special mobile app version of the PT IPTV solution called MeoGo. Objectives The main objective of the project is to recommend valuable TV programs/channels, based on users viewing history of channels and TV programs. In order to accomplish this, is necessary to:
• Mine the user STB, or other consumption device like a Smartphone/Tablet, to gather information about what is being watched, namely the channel, the show, the time of the day, how long was watched and how long was the show..
• Profile the user, based on the information gathered in almost real-‐time. The more relevant aspects are the top channels being watched, top shows, top genres, trends of TV consumption by day and time of the day and top recordings.
• Recommend a channel or TV show, by combining the data from the user history with the EPG of the week before and after.
Methodology The methodology used serves both research and business purposes. So, it is gradual, iterative and goes through the following phases:

v.1.0 UCN
D2.2: Report on Data Collection Methodologies
32
• A laboratory test-‐bed, internal to PT, serving 4-‐6 users; this test-‐bed is used for development, testing and demonstration.
• A community of beta testers (150-‐200 users). The focus of this trial is to intensively collect feedback in order to improve the proposed solutions in terms of usability and functionality.
• A larger group of users (200-‐1500 users) in a pre-‐commercial status. • Promote and release a commercial version, depending of course on the results collected
in all previous phases.
Currently a new interface version of the IPTV service has been launched (meaning, is ready for phase 4) which exposes some of the implemented functionalities (e.g. top 5, suggestions) based on information collected at the backend. Nevertheless, due to the nature of the new software used on the STB (which gives more detailed and personalised data), namely the proprietary and confidentiality rights, the experiments were limited to a reduced set of users in a controlled environment (meaning, we are still in phase 1). The plans are to expand in the coming months, due to the public release of the software to PT customers. On the other hand, there is more flexibility for the mobile usage (i.e. MeoGo app) and soon it will be possible to get viewing data from all clients who want to install a simple app (for now is limited to a controlled environment). This will allow them to send data related to their TV consumption to the backend and receive, in return, recommendations accordingly. Some additional incentives might be offered. It is also possible to relate the MeoGo account with the respective STB, providing cross platform recommendations. Data Collection Currently usage data is collected and stored at PT, in accordance with PT’s data safety policies and practices. Nevertheless, in the new and experimental solution the user has to activate the service on his set top box and install an app on his mobile phone/tablet. Therefore, the user will be perfectly aware of the terms and conditions of the collected data and the used means to accomplish it. In the future, and according to the UCN PIH architecture, the user will be able to set up the terms of disclosure. The user will be able to choose which privacy and security mechanisms will be used to transfer his data and who will be able to have access to which data. This work is part of the research and experimental track conducted by PT in WP4 and documented in more detail in D4.2. Assuming the user allows data to be sent to PT, on every minute an event is built, based on the viewed content, and sent to the backend, namely the current channel, program, start and end time, title, episode, description, program id and time viewed and, if it is a recording (Catch up TV or recordings), also the date and time that the user saw the content. The following table summarises the collected information from the set-top-box:
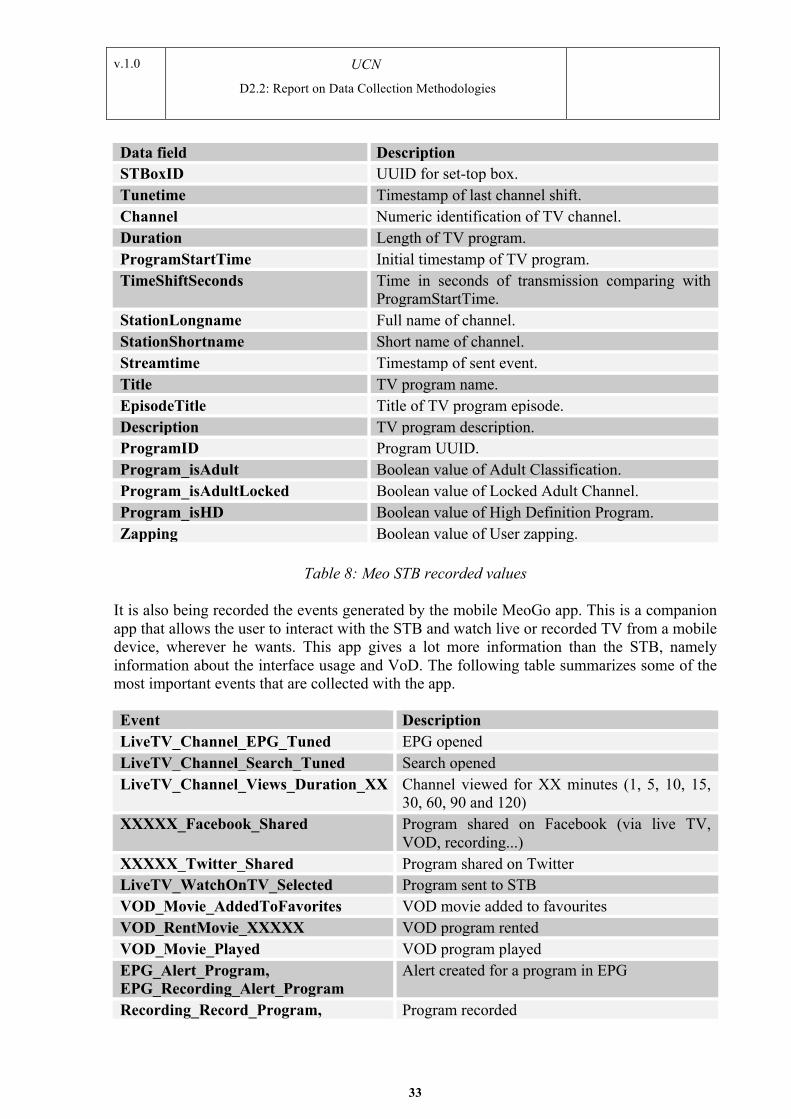
v.1.0 UCN
D2.2: Report on Data Collection Methodologies
33
Data field Description STBoxID UUID for set-top box. Tunetime Timestamp of last channel shift. Channel Numeric identification of TV channel. Duration Length of TV program. ProgramStartTime Initial timestamp of TV program. TimeShiftSeconds Time in seconds of transmission comparing with
ProgramStartTime. StationLongname Full name of channel. StationShortname Short name of channel. Streamtime Timestamp of sent event. Title TV program name. EpisodeTitle Title of TV program episode. Description TV program description. ProgramID Program UUID. Program_isAdult Boolean value of Adult Classification. Program_isAdultLocked Boolean value of Locked Adult Channel. Program_isHD Boolean value of High Definition Program. Zapping Boolean value of User zapping.
Table 8: Meo STB recorded values
It is also being recorded the events generated by the mobile MeoGo app. This is a companion app that allows the user to interact with the STB and watch live or recorded TV from a mobile device, wherever he wants. This app gives a lot more information than the STB, namely information about the interface usage and VoD. The following table summarizes some of the most important events that are collected with the app. Event Description LiveTV_Channel_EPG_Tuned EPG opened LiveTV_Channel_Search_Tuned Search opened LiveTV_Channel_Views_Duration_XX Channel viewed for XX minutes (1, 5, 10, 15,
30, 60, 90 and 120) XXXXX_Facebook_Shared Program shared on Facebook (via live TV,
VOD, recording...) XXXXX_Twitter_Shared Program shared on Twitter LiveTV_WatchOnTV_Selected Program sent to STB VOD_Movie_AddedToFavorites VOD movie added to favourites VOD_RentMovie_XXXXX VOD program rented VOD_Movie_Played VOD program played EPG_Alert_Program, EPG_Recording_Alert_Program
Alert created for a program in EPG
Recording_Record_Program, Program recorded

v.1.0 UCN
D2.2: Report on Data Collection Methodologies
34
Recording_EPG_Program GA_Play_Episode Recording played GA_Program_Views_Duration_XX Recording viewed for XX minutes (1, 5, 10, 15,
30, 60, 90 and 120)
Table 9: MeoGo recorded events From the events generated it is possible to get a number of measures, like the top channels and top shows of an user, that can be used to shape the order in which the recommendations are given to user.
Figure 7: Top programs for February (number of views)
Figure 8: Number of channel views by time interval (in minutes)

v.1.0 UCN
D2.2: Report on Data Collection Methodologies
35
Service Overview The service provided can be split in two components, both inside an ordinary IPTV STB. The first is the application that records what the user is watching. This application runs whenever the user wants and sends the data to the SmartData backend platform that stores it. The second is the application that runs in the STB menu that shows the recommendations using the retrieved data.
Figure 9: Live TV recommendations
Based on what the user saw in the last two weeks, the algorithm identifies the top channels and recommends what is being transmitted at that time on those channels. It also recommends TV programs to watch, based on the viewed recordings. The user can also get recommendations based on genres, that retrieve related programs and orders them based on the channels and programs watched and temporal proximity for the last week (recordings) and next week (EPG suggestions). Integration with social networks is also possible. In the near future information about the preferences of the user (in case the user decides to make it public) expressed in Facebook will be taken into account in our recommendations algorithm.
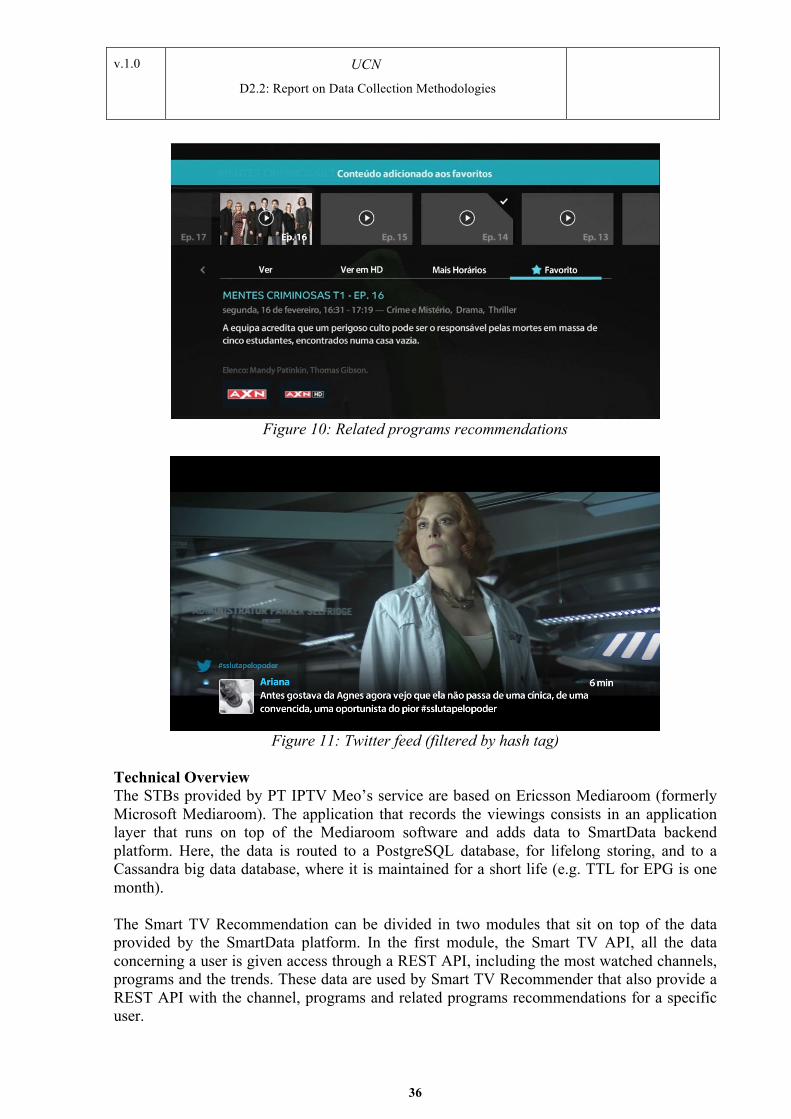
v.1.0 UCN
D2.2: Report on Data Collection Methodologies
36
Figure 10: Related programs recommendations
Figure 11: Twitter feed (filtered by hash tag)
Technical Overview The STBs provided by PT IPTV Meo’s service are based on Ericsson Mediaroom (formerly Microsoft Mediaroom). The application that records the viewings consists in an application layer that runs on top of the Mediaroom software and adds data to SmartData backend platform. Here, the data is routed to a PostgreSQL database, for lifelong storing, and to a Cassandra big data database, where it is maintained for a short life (e.g. TTL for EPG is one month). The Smart TV Recommendation can be divided in two modules that sit on top of the data provided by the SmartData platform. In the first module, the Smart TV API, all the data concerning a user is given access through a REST API, including the most watched channels, programs and the trends. These data are used by Smart TV Recommender that also provide a REST API with the channel, programs and related programs recommendations for a specific user.

v.1.0 UCN
D2.2: Report on Data Collection Methodologies
37
Figure 12: High level architecture

v.1.0 UCN
D2.2: Report on Data Collection Methodologies
38
4 USER STUDY ON USER CONTEXT
Alongside of other activities reported above researchers from INRIA and the University of Nottingham are engaged in an on-going small-scale study of relevant user practices in order to inform the design of the automated context data collection for the project. The data collection methods here are quite distinct from what will ultimately happen when using the PIH. Instead a mixture of direct ethnographic observation, interview and data logging activities will be used to collect ground truth about the user context. Data visualization techniques will also be used in order to gather information about user response to, and engagement with representations of their personal data. The reason for adopting this mixed method approach is that simply asking users to label their data after the fact is problematic in a number of ways. First of all, people’s recollection of their activities is variable and subject to error. Secondly, people omit to mention a wide range of things they undertake in order to accomplish the activities they are labelling and it is frequently the taken-for-granted aspects of human action that are the most important to capture. The overlaying of actual ethnographic interviews and ethnographic observations is therefore essential for providing a proper sense of what ground truth might be beyond basic user annotations. 4.1 Background
As will be evident from the preceding discussions, personalization is at the core of UCN and the approaches it is adopting. This interest can manifest itself in a variety of ways but articulates itself around primary questions such as: What should the system recommend to the user? What user likes, interests and preferences should the system be taking into account? Where is the user? Who is the user with? What is the user doing? Answers to these questions can together be used to infer user activity and context. But first of all there is a need to understand how such questions might be addressed and the extent to which they can be addressed through data that may be available to the system, and the extent to which other sources of information will be required to build up a meaningful understanding of user activity and context. The approach the project has adopted to arrive at this preliminary and important understanding is to undertake a relatively small and discrete study of a select but diverse group of users where it will be possible to explore this matter in depth by engaging with the users individually. In this way we are able to gather ground truth about user activity and context by using a battery of both social scientific and data logging techniques. Once an initial dataset has been gathered in this way it can be used to instruct further approaches to data collection and analysis and to inform the design of automated data collection techniques. From here it will then be possible to scale up the collection of data about user activity and context progressively such that much larger cohorts of users can be accommodated. The underlying rationale for this approach to getting ground truth has several features. First of all, after-the-fact, recollection-based labelling of data is potentially problematic. Things are forgotten or mis-recalled and a wide variety of potentially important considerations are never

v.1.0 UCN
D2.2: Report on Data Collection Methodologies
39
mentioned or captured. Additionally, the specific sense accruing to specific situated practices and just exactly what is involved in the realisation of those practices is completely absent form the data. This is why user annotation is accompanied by direct ethnographic observations of practice and close discussion of the data with an ethnographer through the means of a data visualization tool. In this way the ethnographer is able to see just what kinds of reasoning people are bringing to bear upon their activities and the ways in which those activities are being made available to other people. 4.2 The Package
In order to facilitate the collection of data about user activity and context for the purposes of this initial study a package was developed that could by various means assemble a body of log-based information that might be open to inspection, analysis and subsequent user elaboration. Although some of the elements outlined above are not currently included in this package, for instance sensor-based data, it was felt that the logs would generate enough detail for us to be able to build up s rich picture of activity and context in collaboration with the users themselves. DATA COLLECTION Data collection at this stage was constructed around relatively low-hanging fruit that could be assembled and deployed in the wild without large amounts of investment in development. In this way we hoped to be able to get some ground truth data about user activity and context without too significant a delay. It is notable that even with this relatively limited ambition the assembly of a working and deployable package still took the greater part of year through from conception, to initial assembly, to testing, to refinement, to user recruitment (and the establishment of appropriate ethical study protocols), to having something robust enough to place upon ordinary user devices. The package as is now being deployed is constructed of the following elements: Network Traffic 1) Open source tunnel applications tunnel device traffic via our own servers using OpenVPN. 2) Information about certain kinds of application use is extracted on the basis of accessed services. In particular, we extract DNS requests and replies from the captured traffic traces to associate IPs with hostnames, and secondly, we re-direct HTTP traffic (flows to port 80) through a transparent web proxy to extract the HTTP requests and replies so that we can associate individual HTTP flows to more meaningful URLs. Application Processes Information about certain kinds of application processes is harvested from the device so that we are able to complement the above extraction of data about accessed services with finer grained detail so that we can obtain a richer sense of how devices and applications are being used throughout the day. This part of the package is currently only available for Android devices and Windows PCs.

v.1.0 UCN
D2.2: Report on Data Collection Methodologies
40
Device Information Certain kinds of information about the user device itself is obtainable and therefore harvested. This includes elements relating to:
§ Configuration, e.g. the device type, the operating system, etc. § State, e.g. battery, screen, network connectivity, running applications, etc. § Performance, e.g. memory use, CPU use, network utilization, etc.
This part of the package is currently only available for Android devices and Windows PCs. Geographical Location As a separate strand the commercially developed application ‘Moves’ is installed on people’s mobile devices. Moves is a mobile phone app that runs on both the iPhone and Android phones. It is an activity diary that records people’s location throughout the day. It is also able to present summaries of any walking, cycling or running that people do. It has the additional feature of giving people the means to identify and label any places that they visit throughout the day. This, in turn, gives us a body of data about location as people chose to reason about it themselves, rather than as an abstract set of coordinates. Moves data (location data and any labels that you have tagged it with) is gathered and stored alongside people’s network activity data. Users are asked to go through an initial connection process in order to ensure that the Moves data is incorporated into the larger UCN study package. An important feature of this part of the package is the fact that, to give richer insight, it requires active annotation on the part of the users. USER ANNOTATION As well as annotating the location data users are also asked to contribute to the study through another annotation activity. User Calendar and Diary Here users are encouraged to record any additional observations they may wish to make about their online activity. In particular they are asked to provide annotations whenever events occur that might have an impact upon the character of their online activity, such as time spent away from home, the presence of visitors, special occasions, and so on. As a critical part of what needs to be recorded here is the actual time at which it happens it was decided that the simplest approach would be for entries to be made in a Google calendar. Users are therefore asked to create a new and independent calendar entitled ‘ucn’ that is then linked to the UCN project via the same VPN server as that being used for the other kinds of data being collected. In this way all of the data, including the user’s annotations, is effectively compiled to the same place and therefore open to being visualized as a composite for analysis. 4.3 Initial Testing and Refinement
Once the initial kinds of logging systems we wished to implement had been decided, a description of the study and its associated technological features was submitted for ethical

v.1.0 UCN
D2.2: Report on Data Collection Methodologies
41
review. As the intention is to deploy the system in both the UK and France ethics approval was sought in both countries simultaneously. This process took a number of months to complete and passed through several stages of revision. Of particular concern here was the need to adequately provide control over data collection in houses where data about children might be gathered. Accompanying documentation was also prepared at this time, including information sheets about the study and various kinds of consent forms. Once ethics approval had been received in both the UK and France work began upon preparation of the package as described above. Initial effort was devoted to getting servers configured and deployed in both the UK and France, which could handle the collection of network traffic via an OpenVPN tunnel. An initial tool for visualizing the data being collected was also built. As will be discussed in section 4.4, the ability to display the data in terms of time of day, amount of activity, and kind of activity, is a critical minimum for being able to use the study methodology we have adopted. Early testing occurred across four members of the project team to ensure that the kind of information being logged was adequate and the approach effective. Refinements to both the logging process and the visualization occurred after these initial tests. At this time research was also conducted to find a suitable cross-platform location logging service that could be built into the package and the viability of Moves as a candidate was identified. This was then tested alongside of an exploration of how to visualize the Moves data within the same visualization tool that was being used for the display of the other information. Once these basic elements had been built and tested further work was undertaken to ensure that the package, in various configurations, could be implemented for Android, iOS, MacOS systems. These implementations were also tested across 5 members of the project team and, once small bugs had been ironed out, a registration website built for participants, and deployment documentation prepared the process of recruitment of participants was undertaken. The final element to be built into the package was the implementation of the Google calendar solution for the management of user diary annotations. The work involved in setting up for the user studies proved to involve a number of significant challenges. One of these was the large range of potential devices that might need to be accommodated, e.g. Macintosh, Windows, iPhones, iPads, Android phones, and so on. This significantly increased the complexity of development and testing. Another challenge was that the study of users’ online activity would take place in the wild rather than in a laboratory setting. This meant that being involved in the study should not disrupt their ordinary everyday routines. Nor should the collection of data in any affect the performance of their devices such as battery duration, network access or CPU activity. The visualization of user activity also presented challenges in terms of how to display heterogeneous datasets, e.g., location and usage, and how to make the interface intuitive enough for ethnographers to use during visits and for users to find intelligible. An additional challenge was the amount of work involved in the development of study protocols that would remain commensurate whilst also meeting the ethics requirements of two different countries. 4.4 Study Methodology
The first set of studies of users being undertaken to acquire ground truth data will involve the installation of the context and activity-logging package described above, in section 4.2. The

v.1.0 UCN
D2.2: Report on Data Collection Methodologies
42
package will collate data about network use from certain user devices for a period of 2 months. The Visits In a first visit to each household the prospective adult participants are first of all given an information sheet (see Appendix 1) about the project, which they are required to read. They are then asked, with full negotiation across the whole of the household, to sign any relevant consent forms (see Appendix 2-4) before selecting the specific devices upon which the logging software will be installed. Initial registration to the study is undertaken by the user online, but the download and installation of the necessary software and its necessary configuration is something that is handled in collaboration with the ethnographer in order to ensure that all elements are configured and working as they should be. In the same session the ethnographer assists the participant with the installation of the Moves application where mobile devices are being used. Finally the ethnographer assists the participant with the setting up of the Google calendar so that diary entries can be made and associated with the other data in the visualization. Finally the users are instructed in how to manage any problems that might arise and are given a further sheet for retaining the important information specific to their own deployment.
Figure 13: The project registration website
At the end of the first month of deployment participants will be asked to review the data gathered so far with an ethnographer using the online visualization tool. This will provide an opportunity to identify and explain patterns within the data and to construct activity labels for certain kinds of network traffic. After this the participants will be asked to provide a short tour of the existing technological arrangements in their homes and to allow the ethnographer to remain in the home for a while to conduct direct observation of their situated practices. During this interim visit the ethnographer will also talk through with participants the information gathered using the Google calendar-based diaries.

v.1.0 UCN
D2.2: Report on Data Collection Methodologies
43
Figure 14: The data visualization interface
Figure 15: Providing for in-situ ethnographic annotation

v.1.0 UCN
D2.2: Report on Data Collection Methodologies
44
Figure 16: Overlaying other data and notes
In deliverable D4.1 we went into some detail regarding the reasons why this kind of visualization tool is required for the realisation of this kind of study. A key issue we point to is the difficulty of arriving at what technical data is telling you about the social world. There are three parts to this problem:
1. The social organisation of the world has to somehow be made legible and this is not something that technical data alone can do.
2. Even if social action is made visible, it still takes membership of the household to understand what is really going on.
3. You therefore have to somehow provide people with a means to explain what the data means. This is what the visualization interface aims to accomplish in the context of this particular study, through the interaction of specific household members with the ethnographer.
The visualization tool therefore enables us to:
§ Probe peoples’ understanding of what the technical data means. § Examine just how they represent that understanding to a third party, in this case an
ethnographer. § And thus to also capture data regarding just how the work of explaining the data gets
done. This in turn will provide important insight regarding what mechanisms will need to be built to enable people to render their data meaningful and useful for the services being delivered via the PIH.

v.1.0 UCN
D2.2: Report on Data Collection Methodologies
45
The final visit to participant’s houses at the end of the second month of deployment will be largely conducted in the same fashion as the interim visit. In particular this will provide us with an opportunity to explore whether the display of what the data was making available regarding their practices in the interim visit has had any impact upon those practices at all. At the conclusion of the final visit the ethnographer will assist the participants in removing the logging software from their devices and returning them to their normal state. The Ethnographic Approach As a complement to the log data, ethnographic data is gathered in various ways: through written notes, through audio recordings and, where appropriate and the participants are willing, video recordings of specific activities and interactions. The ethnographic approach arose originally in anthropology as a response to 19th century methods of collecting data about inhabitants of other cultures. These methods consisted primarily in the assembly of secondhand accounts of these cultures as produced by missionaries and explorers. In the early 20th century a push came to try and understand these cultures from the inside by living amongst the inhabitants for extended periods of time, learning the local language, participating in local practices, and trying to ‘grasp the native’s point of view’ [4]. This principal of hanging out with the people you are trying to understand and trying to arrive at a member’s point of view has been a central tenet of ethnographic work ever since. In systems design it involves spending time with specific groups of users to whom the design is being directed in an endeavor to similarly arrive at a proper understanding of local practices [2]. An additional aspect of the approach being adopted in these studies is that the analysis is ethnomethodological in character [3]. What this amounts to is going beyond simple scenic descriptions of what people are seen to do in order to bring out how their activities are ordered and methodical means of accomplishing particular courses of action. This involves explicating how local members must necessarily reason about the things they do in order to get their activities done. Thus findings from ethnomethodological studies are typically articulated around the organisational properties of activities as a set of methods for bringing about specific local accomplishments. Ethics and Protection of Rights All of the ethnographic data is being gathered exclusively by the project ethnographer, Dr Peter Tolmie. All of the data collected (log data and ethnographic data) is stored on an independent data store maintained and accessed exclusively by the researchers who first gathered the data, remote from any individual computer or potential online access. All other project members only have access to this data once it has been reviewed and anonymized by the researchers themselves. Similarly none of the data is to be used for external dissemination without similar anonymization and the consent of the parties involved. As data is being gathered from home settings where children may be amongst the inhabitants it is inevitable that some of the data will include the activities of children. In order to cover this eventuality the following process is being adopted:
a) In the first meeting everyone in the household is made aware of what kinds of information the software is capturing and they have the right to veto specific selections
v.1.0 UCN
D2.2: Report on Data Collection Methodologies
46
of devices if they have concerns. Importantly, the software is also be installed with a means of stopping logging upon command. Participants are also able to request that logged data for a certain period be deleted if there is a concern that sensitive data may have been captured by mistake. At the preliminary meeting all members of the household are made aware of these options and shown how to use them, including any children in the house. b) The adults in the household are given an information sheet explaining the study, the use of the logging software, what the ethnographic study will entail, and their rights relating to the capture of the data and its subsequent use. They are also given a consent form where they will are asked to confirm their willingness to participate and that they have fully understood what data will be captured and the ways in which it might be used. c) The focus of the study is upon adult use of the devices and adult consumption of content. Nonetheless, as indicated above, it is possible that where there are children in a household some data relating to those children may be incidentally captured. This is unavoidable when capturing real data from real households. However, where there are children in the household the parents are asked to sign a separate consent form that covers the use of any incidental capture of data relating to the children, either as a feature of the video recording of adult interactions around their devices during the ethnographic observations, or as a result of children using the logged devices. Where appropriate the children are also provided with a separate assent form to acknowledge their understanding of what the study entails and to provide or withhold assent for any data relating to them to be used. Where children are too young to engage in the process in this way information is mediated to them through the involvement of their parents. Assent is usually to be indicated by written signature but where a child is too young to sign, parental assistance is sought to ensure that the child is giving clear assent. If parental consent or child assent is not forthcoming any data relating to the children in that household is to be deleted from the record so that it cannot be used. This fact is also made clear to the participants.
4.5 Recruitment
Participants are being drawn from a variety of household configurations in both France and the UK. In France recruitment was initiated by sending out an invitation to participate to a database of 2,500 potential participants already managed by the Centre Multidisciplinaire des Sciences Comportementales Sorbonne Universités-INSEAD who are research partners of INRIA and who therefore offer access to certain shared resources. 140 responses were received to this initial invitation and subsequent requests for more information about the potential participants enabled us to whittle the list down to 27 households that were distinct from one another in some way. Studies in these households began at the end of January 2015 and will continue to be rolled out in phased groups every month throughout the first half of the year. First results from these studies are likely to be available by mid-April 2015 as the first round of deployments are completed and preliminary analysis undertaken. In the UK recruitment has had to proceed on the basis of identifying potential households through friends of friends and studies in a smaller number of households are likely to begin by April 2015.

v.1.0 UCN
D2.2: Report on Data Collection Methodologies
47
Selection of households is being based upon a variety of factors. These include: the geographical location of the household and consequent access to services (e.g. is the household in a rural, suburban or urban area?); the kind of accommodation being lived in (e.g. is it an apartment, a small terraced house, a large detached house, etc.?); the constitution of the household itself (e.g. is it single occupancy, a couple, a family with small children, a family with older children, a group of friends etc. living together, a retired couple, and so on?); related to the prior the actual number of people living in the household and the extent to which it is regularly augmented by visitors; the occupation of the prospective participants, their age, their background, and the household’s socio-economic character; the nature of the local access to networks, and the extent to which the prospective participants make use of other networks in other locations; the kinds of computing devices being used and the ones being used specifically for the consumption of media; the kinds of consumption of media practices prevalent in the household (e.g. just watching dedicated TVs, downloading and watching on laptops and mobile devices, catch-up TV and live streaming, and so on); and, finally, the degree to which the prospective participants are active users of social media (in order to support the project interest in how recommendation by social media impacts consumption). As indicated above, deployments in individual households will span a period of 2 months, beginning with an initial visit and installation of technology, followed by an interim visit to discuss the data gathered so far and to ground the data in direct observations of practice, with a final visit being used to complete discussion of the data before the logging software is uninstalled. In parallel to the ethnographic observations and analysis a machine-based analysis will also be undertaken and results of this will be compared with the ground truth data being derived from the ethnographic work. At the time of writing we have started the data collection from four different households in the Paris area in France. The interim visits to these households are planned for mid-April, as well as an initial setup of another patch of 4-8 new participants.

v.1.0 UCN
D2.2: Report on Data Collection Methodologies
48
5 REFERENCES
[1] D. Joumblatt, R. Teixeira, J. Chandrashekar, N. Taft, “HostView: Annotating end-host performance measurements with user feedback”, HotMetrics Workshop, New York, USA, June 2010. [2] Crabtree, A., Rouncefield, M. & Tolmie, P. (2012) Doing Design Ethnography, London: Springer. [3] Garfinkel, H., (1967) Studies in Ethnomethodology, London: Polity Press. [4] Malinowksi, B (1984) (Originally published 1922) Argonauts of the Western Pacific, Prospect Heights, Illinois: Waveland Press Inc. [5] A. Brown, R. Mortier, T. Rodden, “An exploration of user recognition on domestic networks using NetFlow records”, in Proc. HomeSys workshop at the ACM International Joint Conference on Pervasive and Ubiquitous Computing (UBICOMP), 2014. [6] Sventek, J., Koliousis, A., Sharma, O., Dulay, N., Pediaditakis, D., Sloman, M., Rodden, T., Lodge, T., Bedwell, B., Glover, K., and Mortier, R., “An information plane architecture supporting home network management”, In 2011 IFIP/IEEE International Symposium on Integrated Network Management (IM) (2011), 1–8. [7] R. Mortier, T. Rodden, P. Tolmie, T. Lodge, R. Spencer, A. Crabtree, J. Sventek, and A. Koliousis, “Homework: Putting interaction into the infrastructure”, In Proceedings of 25th ACM Symposium on User Interface Software and Technology (UIST), October 7–12 2012.

v.1.0 UCN
D2.2: Report on Data Collection Methodologies
49
APPENDIX I: INFORMATION SHEET FOR THE UCN ETHNOGRAPHIC STUDIES
The User-Centric Networking (UCN) project is seeking to understand how people consume various kinds of content when using computer networks. Findings from this will then be used to inform the creation of completely new mechanisms for helping users in three principal ways: a) to find content they a genuinely interested in having access to; b) to assist in the identification of nearby places where networks might be accessed; and c) to help to ensure that the things people want to consume are delivered to the particular device they want them on at the time they would most like to consume them. The project will also be seeking to understand how people’s social networks have an impact upon their content consumption and to make use of that understanding within the technology it designs. In order to be able to accomplish its research goals the project needs to undertake some detailed observations of users across a range of environments in order to understand first-hand the practices involved in consuming media and other content according to context. These studies will then be used to inform the creation of some simple applications that can be used to gather much larger bodies of data about user consumption of content across networks. The studies will involve the installation of some lightweight network logging software on particular devices to collate some basic information about your network use over a period of 4 to 6 weeks. At a preliminary meeting the adults in your household, in full consultation with everyone else in the house, will be asked to nominate the specific devices that they are willing to have the logging software installed upon for the duration of the study. The software will then record a list of all the webpages you visit, as well as where you are when you visit them (if you choose to tell us that) and what else the device is doing when you visit them (again, if you choose to tell us that). You can opt out of collection on a specific device at any point by using the opt-out mechanism provided with the software. You will also be given them means to delete data captured by mistake. Opting out of the data logging will bring no penalty. However, if you remain opted-out for more than a few days we may contact you to determine whether you wish to withdraw from the study permanently. If there are minors in your household who may make use of a nominated device you will need to take care to remind them that their actions may be logged and, if necessary, be prepared to take measures to opt-out or delete the data. Prior to and at the end of the period over which the software is running you will be asked to take part in a short interview and asked to provide a short tour of the existing technological arrangements in your home. You may also be asked to keep diaries of your network use and some direct observations of your content-related practices will be undertaken in your home for about half a day mid-way through the deployment to ground the other sources of information. Additionally you will be shown representations of the data being logged so that you can talk it through with us in more detail. Data from these observations and interviews will be gathered in various ways: through written notes, through audio recordings and, where appropriate and you are willing, video recordings of specific activities and interactions. At the conclusion of the study the logging software will be removed, but you will be invited to maintain your connection with the project by downloading the developed applications when

v.1.0 UCN
D2.2: Report on Data Collection Methodologies
50
they are ready and by joining a UCN project-related user panel so that you can feed directly into the design activities. For further information about the studies and the project or in relation to your consent, please feel free to contact me: Dr Peter Tolmie, Senior Research Fellow, Mixed Reality Lab (MRL), School of Computer Science, University of Nottingham, Jubilee Campus, Wollaton Road, Nottingham, NG8 1BB Email: [email protected] Phone: +33 677 999690 All of the data we gather will be stored in accordance with the Data Protection Act 1998, namely on a password protected drive in a secure facility and only for the duration for which it is required. It will only be directly accessible by the ethnographer who has collected the data and will be pre-anonymised prior to being shared with other members of the project. You have been chosen to participate in this study as someone who might be representative of a future user of this type of system. You may withdraw consent from the study at any time prior to, during or after the gathering of the data, and for any reason without penalty or requirement to explain your motivations, by contacting me on the address above. In this event all data will be erased. All data will be further verified for anonymisation prior to any publication of project results, unless you have given specific consent for data to be published that could identify you. Please be aware that publishing data will result in information becoming available through the internet to anyone who wishes to access it.

v.1.0 UCN
D2.2: Report on Data Collection Methodologies
51
APPENDIX II: ETHNOGRAPHIC STUDIES CONSENT FORM
The User-Centric Networking (UCN) project is seeking to understand how people consume content over computer networks and to design new ways in which media services might be delivered to users according to their interests and needs. To participate you will be asked to install some lightweight network logging software on a device specifically chosen by yourself and your family that you are all happy to have monitored. This will be discussed with all of you before any software is installed. This software will collate some basic information about your network use over a period of 4 to 6 weeks. The information gathered will include a list of all the webpages you visit, as well as where you are when you visit them (if you choose to tell us that) and what else your device is doing when you visit them (again, if you choose to tell us that). You can opt out of collection on a specific device at any point by using the opt-out mechanism provided with the software. You will also be given the means to delete data captured by mistake. Opting out of the data logging will bring no penalty. However, if you remain opted-out for more than 4 or 5 days we may contact you to determine whether you wish to withdraw from the study permanently. During the period the software is activated you will also be asked to participate in interviews, provide a brief tour of the technology in your home, keep a diary, and be observed from time to time engaging in various relevant activities. As detailed on the attached information sheet, data will be recorded in a variety of ways, subject to your consent, and will remain directly available only to the person who has gathered it. All subsequent use of the data will be anonymised. This sheet is to confirm your consent to participate in the study. I have read and understand the attached information sheet, which includes information about the data to be recorded. I understand that I can withdraw at any time by contacting the researcher at the address provided in the information sheet, without any need to explain my reasons and without any penalty, and that in this case my personal data will be erased from the records. I confirm that I am over the age of 18. This is to confirm that I have agreed to take part in this research during the following period: ................................................ Signed ....................................................... Name............................................................ Address ............................................................................................................................ .......................................................................................................................................... Contact Tel No: ........................................... Email: ....................................................... In addition to the data analysis, I give permission for data that could identify me (e.g. photos, video) to be published Signed ..................................................................

v.1.0 UCN
D2.2: Report on Data Collection Methodologies
52
APPENDIX III: ETHNOGRAPHIC STUDIES PARENTAL CONSENT FORM
The User-Centric Networking (UCN) project is seeking to understand how people consume content over computer networks and to design new ways in which media services might be delivered to users according to their interests and needs. Over the course of our observations of your activities it is possible that some data may be captured that includes your children. This sheet is to cover that eventuality and is only to be accompanied by a personal consent form. Its purpose is to confirm your consent to allow some of your children’s activities to be gathered as part of the data collected during the study. Note that video data relating to your children will only be gathered whilst a parent is also present and will only be published with your express consent. If you ask us not to gather or use such data we shall avoid doing so without need to explain your reasons and without penalty. Likewise, if your children seek for themselves to avoid involvement this will be treated by us as a withdrawal of consent on their part. If your children should make use of any devices in the household that are being monitored as part of the study please either turn the logging off whilst they do so or discuss with them whether they want that data to be removed. If it is reasonable to do so your children will also be given a separate assent form to confirm their understanding of the study and to indicate their preferences regarding the use of any data that relates to them. Failing this we will ask you to help us to ensure that your children have a good grasp of what is going on. I have read and understand the attached information sheet, which includes information about the data to be recorded. I understand that I can withdraw this consent at any time by contacting the researcher at the address provided in the information sheet, and our personal data will be erased from the records. I confirm that I am the parent/legal guardian of ……………………………………… This is to confirm that I have agreed to allow ………………………………………… to take part in this research during the following period: ............................................... Signed ........................................................ Name........................................................... Address ............................................................................................................................ Contact Tel No: ............................................ Email: ...................................................... In addition to the data analysis, I give permission for data that could identify my child (e.g. photos, video) to be published Signed ...........................................................................

v.1.0 UCN
D2.2: Report on Data Collection Methodologies
53
APPENDIX IV: ETHNOGRAPHIC STUDIES ASSENT FORM
Your parents/guardians have been asked to take part in some research that is trying to understand how the people in your home use the internet to watch films and TV programs, listen to music, look at the news, go on Facebook and Twitter, and other things like that. Whilst we are in your home looking at how your parents/guardians do that we will be using cameras to make recordings of exactly what they do. This is so we can examine those things more closely later on. It is possible that while we are filming you may happen to get recorded as well, though we will not be focusing on filming you. We will also be putting things on one of your parents’/guardians’ computers to make a record of what they do with it when they use it. It is therefore also possible that if you use that computer some of the things you do may get recorded as well.
We need you to be happy that these things get recorded if we are going to use them. If you are not you need to tell us and we will make sure that we try hard not to record you. If we do record you by mistake we will make sure that we get rid of those recordings. Your parents/guardians will also be given a way of stopping the recording on the computer and of removing things recorded on the computer after they have happened. If you want them to stop the recording whilst you use it or want them to get rid of something later on make sure you tell them so they can do so.
Can you please sign this document for us to say that you understand these things and to tell us how you want us to use any recordings that end up being made of you.
I understand what will be happening during the study and that I can have any information collected about me removed whenever I ask for it to be removed, and without having to explain why.
Signed ....................................................... Name............................................................
I do / do not* want you to make use of any film recordings you may make of me.
I do / do not* want you to make use of any information about how I use computers.