Embed Size (px)
Citation preview
Grant Agreement nº.SCS8-GA-2009-234061
Coordination and support action (Coordinating)
FP7-TRANSPORT SST.2008.3.1.4. Urban delivery systems
Project acronym: TURBLOG_WW
Project title: Transferability of urban logistics concepts and practices from a worldwide perspective
Deliverable 3.9
Urban logistics practices – Mumbai Case
Study
Due date of deliverable: 28th February 2011
Submission date: 10th March 2011
Start date of project: October 2009 Duration: 24months
NEA Transport research and training
Version 1.0
Project co-funded by the European Commission within the Seventh Framework Programme
Dissemination Level
PU Public
PP Restricted to other programme participants (including the Commission Services)
RE Restricted to a group specified by the consortium (including the Commission Services) X
CO Confidential, only for members of the consortium (including the Commission Services)
TURBLOG D3.9: Urban Logistics practices – Mumbai case study ii
Foreword
The TURBLOG Deliverable 3.9 was produced by Deepak Baindur, from the Centre for Infrastructure Sustainable Transportation & Urban Planning, Indian Institute of Science in Bangalore, India.
The review of the document was made by:
Nathaly Dasburg-Tromp (NEA)
Rosário Macário, TIS.PT
Maria Rodrigues, TIS.PT
Ana Gama, TIS.PT
This document is set to be Restricted to a group specified by the consortium (RE), and should be referenced as:
“TURBLOG (2011) Transferability of urban logistics concepts and practices from a world
wide perspective - Deliverable 3.9 - Urban logistics practices – Mumbai Case study”
QUALITY CONTROL INFORMATION:
Version Date Description
0.1 31/08/2010 TURBLOG D3.9 Draft version
0.2 24/09/2010 TURBLOG D3.9 Final version to be revised
0.3 12/10/2010 TURBLOG D3.9 Final version after revision
0.4 30/11/2011 TURBLOG D3.9 Final version for quality control
0.5 03/03/2011 TURBLOG D3.9 Final version after quality control
Final 1.0 10/03/2011 Submission of TURBLOG D3.9 final version to the EC

TURBLOG D3.9: Urban Logistics practices – Mumbai case study iii
TABLE OF CONTENTS
EXECUTIVE SUMMARY ...................................................................................... 1
1 Introduction ............................................................................................ 3
1.1 Objective of the report ....................................................................... 3
1.2 Scope and methodology ....................................................................... 4
1.3 Report structure ................................................................................ 5
2 Overview of india and the city of mumbai ....................................................... 7
2.1 Mumbai city in the macro context .......................................................... 7
2.1.1 Country profile .......................................................................... 7
1.1.1 .................................................................................................... 16
2.2 Urban freight in Mumbai ..................................................................... 17
2.3 Urban transport problems in City of Mumbai ............................................. 28
3 Institutional framework and current transport and logistics policies ...................... 33
3.1 National level .................................................................................. 33
3.1.1 Institucional Framework At The National Level ...................................... 33
3.1.2 National Urban Transport Policy ......................................................... 35
3.2 Urban level (Mumbai City level) ............................................................ 38
3.2.1 Institutional framework at the urban level of Mumbai City ........................ 38
3.2.2 Mumbai’s Urban Transport Policy ....................................................... 41
4 Measures used in Mumbai City ..................................................................... 43
4.1 Introduction .................................................................................... 43
4.2 Measures used in Mumbai City .............................................................. 43
5 Selected good practice ............................................................................. 47
5.1 Introduction .................................................................................... 47
5.2 The Dabbawalas of Mumbai ................................................................. 48
5.3 Stakeholders ................................................................................... 52
5.4 Product and/or Service involved ........................................................... 55

TURBLOG D3.9: Urban Logistics practices – Mumbai case study iv
5.5 Financial aspects .............................................................................. 56
5.6 Transferability potential of the selected good practice ............................... 57
5.7 Other aspects .................................................................................. 60
6 Evaluation of the good practice ................................................................... 62
6.1 Introduction .................................................................................... 62
6.2 Specific urban freight data collected...................................................... 62
6.3 Impacts .......................................................................................... 63
6.3.1 Transport impacts ........................................................................... 63
6.3.2 Economic impacts ........................................................................... 64
6.3.3 Environmental impacts .................................................................... 65
6.3.4 Social impacts ................................................................................ 66
6.4 Implementation of measures ................................................................ 68
6.4.1 Specific changes needed to implement measures ................................... 68
6.4.2 Integration aspects ......................................................................... 69
6.4.3 Acceptability ................................................................................. 69
6.4.4 Bottlenecks/barriers ........................................................................ 70
6.4.5 Success and failure factors................................................................ 71
7 Conclusions ............................................................................................ 73
8 References ............................................................................................ 76

TURBLOG D3.9: Urban Logistics practices – Mumbai case study v
INDEX OF TABLES
Table 1: Types of permits issued for plying goods transport vehicles ........................... 14
Table 2: Octroi Rates in different districts in Maharashtra state ................................. 15
Table 3: Urban freight indicators by impact category .............................................. 16
Table 4: Finding from traffic count at different Mumbai road junctions in Jan 2009 (Rush
Hour period) .......................................................................................... 24
Table 5: Daily fatalities in accidents in Mumbai Metropolitan Region ........................... 30
Table 6: Transport sector - involvement of State and private sector ............................ 34
Table 7: Indian Auto fuel policy 2001 .................................................................. 37
Table 8: Proposed time frame for introducing cleaner vehicles .................................. 37
Table 9: Governmental Organisations involved in urban transport in Mumbai ................. 38
Table 10: Stakeholders directly involved in the Mumbai dabbawala logistics system ........ 53

TURBLOG D3.9: Urban Logistics practices – Mumbai case study vi
INDEX OF FIGURES
Figure 1: Structure of the Report ....................................................................... 6
Figure 2: Map of Asia ...................................................................................... 7
Figure 3: Country Map of India ........................................................................... 8
Figure 4: Urban freight system approach. ............................................................ 12
Figure 5: Location of Mumbai in India ................................................................. 18
Figure 6: Greater Mumbai Metropolitan Region Map ................................................ 19
Figure 7: Spatial structure and commercial areas in the Mumbai city ........................... 23
Figure 8: Mumbai suburban Railway Network ........................................................ 26
Figure 9: Coding system framework used by the Dabbawalas ..................................... 51
Figure 10: Dabbawala logistics activity chart: home to work ..................................... 52
Figure 11: Scarcity/Density of Origins/Destinations affects the choice of delivery
organization ........................................................................................... 58

TURBLOG D3.9: Urban Logistics practices – Mumbai case study vii
LIST OF ACRONYMS
BEST Bruhanmumbai Electric Supply and Transport Undertaking under the Brihanmumbai Mahanagar Palika (Mumbai Municipal Corporation)
BPO Business Process Outsourcing
CBD Central Business District
CDP City Development Plan
CO Carbon Monoxide
CO2 Carbon Dioxide
GoI Government of India
Govt. Government
HC Hydro Carbon compounds
HGV Heavy Goods Vehicle
HR Human Resource
IT Information Technology
kg Kilograms
Km Kilometers
Kmph Kilometres per hour
MMRDA Mumbai Metropolitan Region Development Authority
NOx Nitrogen Oxide compounds
PM Particulate Matter
Rs. Indian Rupees (Indian Currency) Exchange rate of 1 € ~ Rs. 58
RTO Regional Transport Office
SEZ Special Economic Zone in India
Sms Short Message Service
SOx Sulphur Oxide compounds
SRTU State Road Transport Undertaking (India)
T-km Tonne - kilometres
VVIP Very Very Important Person
TURBLOG D3.9: Urban Logistics practices – Mumbai case study 1
EEXXEECCUUTTIIVVEE SSUUMMMMAARRYY
The overall objective of the TURBLOG project is to compare urban logistics practices of
selected case studies in different cities in the world and analyse the potential transferability
of the selected good practices to other cities in the world.
The present report analyses the selected good practice from India. The Mumbai Dabbawala or
tiffin carrier operation has been selected as a best practice, as it is widely recognised as an
outstanding example of six sigma implementation in the Indian context. This is a meal
delivery system in the sprawling megapolis of Mumbai, where many workers and employees
prefer home-cooked meals for lunch. This is currently a highly efficient and low cost delivery
solution, which has astounded logistics professionals all over the world.
The main objective of the report is to analyse the business model of the Mumbai dabbawala
best practice and to evaluate the potential transferability of the best practices to urban
logistics processes in other cities across the world.
Before focussing on the Mumbai Dabbawala case study, basic information of India and the city
of Mumbai is presented along with the institutional governance framework, transport policies,
existing transport related problems and measures undertaken to mitigate the existing
problems. This provides a better perspective of the environment in which the dabbawalas are
operating, but also allows visualising the essentials of the system and its potential for
replication in other cities.
The case study demonstrates that the informal sector is also capable to develop a best
practice in the urban freight logistics. It shows how urban public transport system can be
exploited for urban freight movements in cities where cheap, regular and reliable public
transport services are available. The main findings of the evaluation of this case study is that
the dabbawala system has demonstrated how a highly efficient and low cost delivery solution
can be developed with a positive impact on city, citizens and companies by suitably
combining factors of inexpensive manpower availability, perpetual demand, urban transport
infrastructure, unique traffic flow pattern and intuition based management practices.
Potential transferability factors identified in this case study are summarised as follows:
• Utilisation of urban public transport system for freight movements provided they have
a good network and services are cheap, reliable and regular;
• Adaptation of business processes considering the skill sets and abilities of the
company’s employees;

TURBLOG D3.9: Urban Logistics practices – Mumbai case study 2
• Customer focus and continuous innovation to keep the urban logistics services
attractive to its core customer base.
The Mumbai dabbawala service essentially delivers a homogeneous product flow system with
high demand in a city that has a linear topography, congested road network and cheap,
regular and reliable public transport system. This business model may not be easily replicated
for non-homogenous product flows and in cities without the similar characteristics. Even so,
the potential transferability factors from this case study are the effective organisational
structure of the dabbawala system and strong ethics and value system that continuously
motivate its members to excel in their business of delivering tiffin boxes.

TURBLOG D3.9: Urban Logistics practices – Mumbai case study 3
11 IINNTTRROODDUUCCTTIIOONN
The subject of city logistics or urban freight transport deals with the activities of delivering
and collecting goods in town and city centres. The activities include a number of
intermediate processes such as transportation, goods handling, storage, inventory
management, home delivery services, return of goods and waste. Although many of the
processes are done outside city limits, they can be studied in its entirety of supply chains that
transgress all geographical borders (Stantchev & Whiteing 2006). A characteristic of urban
freight transport is the small loads and frequent trips result in the increase of transport
intensity or the traffic density.
This chapter identifies the main objectives of Deliverable 3 of the TURBLOG project which is
primarily focused on a best practice in urban logistics from India. Further the scope of the
report and methodology used to analyse the Indian best practise case study is discussed. This
chapter concludes with the presentation of the structure of the report.
1.1 OBJECTIVE OF THE REPORT
One of the goals of the TURBLOG project is to present more detailed information on specific
urban logistics practices in different cities of the world, with the final objective to analyse
the potential transferability of the selected good practices to other cities in the world. This
report is one of the 9 in-depth case studies on urban logistics that are studied in different
parts of the world as part of the TURBLOG project.
The main objectives of this Report are as follows:
• to analyse the business model of the “Mumbai Dabbawalas” or in other words the
lunch box delivery system in the city of Mumbai, India;
• to explore the potential transferability of the selected good practice to other cities in
the world and identify limitations in its replication to other contexts.
The main purpose of this report is to present the operational details of the dabbawala service
and explore the main features that have contributed to the sustained success of this service
in Mumbai, in spite of challenges that come with changing times.
TURBLOG D3.9: Urban Logistics practices – Mumbai case study 4
1.2 SCOPE AND METHODOLOGY
Deliverable 3 analyses an urban logistics best practice in the city of Mumbai, India. The
selected good practice is the business model of the “Mumbai dabbawalas” or in other words
the lunch box delivery system in the city of Mumbai. The city of Mumbai was selected for the
case study, because it is the commercial capital of India and a very cosmopolitan megapolis
housing urban people with diverse and deep rooted traditions, culture, values and food habits
coexist (Mahias M.C. 1999).
The tiffin suppliers (also referred to as dabbawalas in this report) deliver daily home-cooked
lunches to thousands of workers and employees in Mumbai, India. The service has been
recognised as a best practice model of urban logistics management and entrepreneurship,
which cannot be seen anywhere else in the world in terms of size and scope of operations
(Balakrishnan & Teo 2004). This organisation has a number of unique features that have
contributed to their sustained success and growth which could offer lessons for other logistics
companies’ over the world:
• It is one of the oldest surviving pre-Independence urban logistics systems in the city
of Mumbai and probably in the world. The dabbawala services were begun in 1890 by
a group of people with same ethnic background (from Pune) to support their
livelihood in India (Ravichandran 2005). The system has been operational for about
120 years without interruption. As of 2005, the services handled more than 300,000
transactions a day (150,000 boxes), employed 5,000 people and earned Rs. 360
million every year (Ravichandran 2005);
• The Mumbai dabbawala business model was conceived, developed and perfected by a
group of people who had migrated from rural areas in search of jobs. They had little
or no formal education in the area of logistics. The system has continuously evolved
since its inception and has stayed attractive to a particular market segment over time
(Pandit 2007);
• The dabbawala service maintains an impeccable record of punctual and reliable
services on all working days of the year. The service not only provides clean home
cooked food, but also delivers it safely against theft and damage (Percot 2005). There
is no disruption of services as long as the Mumbai suburban rail service network is
functional. The services reported less than six errors in 13 million transactions, which
have earned them recognition as an urban logistics service best practice in India;
• The delivery system is organised as a co-operative movement whose basic entity is
the dabbawala. The relatively flat 3 tiered organisational structure symbolises
equality and fairness. The 3 tier system allows them to be readily scalable to adapt to

TURBLOG D3.9: Urban Logistics practices – Mumbai case study 5
demand ensuring optimal resource deployment. This structure allows the organisation
to carry out centralised planning and decentralised execution of business services;
• A unique motivating factor to improve and sustain performance levels is driven by
ethical considerations rather than personal wellbeing. The system is built on pride to
deliver food to their customers and thus as a means of service to humanity. The
members do not consider themselves as logistics providers. Mutual respect for each
other and empowerment are reinforcing features;
• This occupation belonging to the informal sector is interesting because of its special
relationship to the customised food habits of Indians, but also specific to Mumbai’s
geography.
For this case study, urban freight implies the movement of lunch boxes (or tiffin boxes)
carried by suppliers (dabbawalas) where a major part of the door to door delivery system is
done using Mumbai’s public transport system, namely the suburban commuter rail. Since the
commuter rail is a major mode of transport for the case study, the report focuses on public
transport system and specifically, Mumbai’s suburban commuter rail infrastructure and
services.
The business model and the measures employed in this case study are already implemented
for many decades i.e. not measures out of simulation or theoretic models. Through the case
study of the Dabbawalas, this report will identify best practices in the following types of
measures in the city of Mumbai:
• Emerging actualised concepts as to how freight distribution and collection can be
integrated with urban public rail transport systems that is otherwise primarily used
for passenger movements;
• Business arrangements: focussing on private associations and self regulation within a
monopolistic service in the food distribution market.
1.3 REPORT STRUCTURE
The structure of the document is shown in Figure 1. Chapter 2 provides an overview of India
and the city of Mumbai in the macro context. Specifically, the city’s transport infrastructure
system, public transport services and existing transport problems in the city of Mumbai are
reviewed. Chapter 3 highlights the institutional framework and current urban transport
policies of India and particularly in the city of Mumbai. In Chapter 4, the current measures
used in the city of Mumbai are reviewed. This chapter also describes several planned
transport infrastructure projects in Mumbai. The policy measures (mainly involving addition of

TURBLOG D3.9: Urban Logistics practices – Mumbai case study 6
transport capacity) to fulfil the stated objectives of the policy documents are reviewed. This
chapter concludes with a brief description and status of the transport infrastructure projects
planned or underway in Mumbai.
Figure 1: Structure of the Report
Chapter 5 explores the case study of the dabbawalas in detail. Here, the Mumbai dabbawala
business model is analysed. In doing so, the contribution of the stakeholders, services
involved and financial aspects are discussed in detail. The purpose is to identify which aspects
are the keys to the success of this business model and which can be transferable to freight
logistics practices in other urban goods distribution systems and geographical regions/cities.
Chapter 6 evaluates the dabbawala service system from different perspectives in terms of its
social and business impact to the city’s transport system, economy and environment. Further,
this chapter explores whether specific changes are necessary at urban policy level to
replicate this best practice in other cities in the world. In this analysis, transferability is
explored from aspects of integration, acceptability, bottlenecks and success/failure factors.
Finally, Chapter 7 concludes with an overview of the report and key research findings.
TURBLOG D3.9: Urban Logistics practices – Mumbai case study 7
22 OOVVEERRVVIIEEWW OOFF IINNDDIIAA AANNDD TTHHEE CCIITTYY OOFF MMUUMMBBAAII
2.1 MUMBAI CITY IN THE MACRO CONTEXT
2.1.1 Country profile
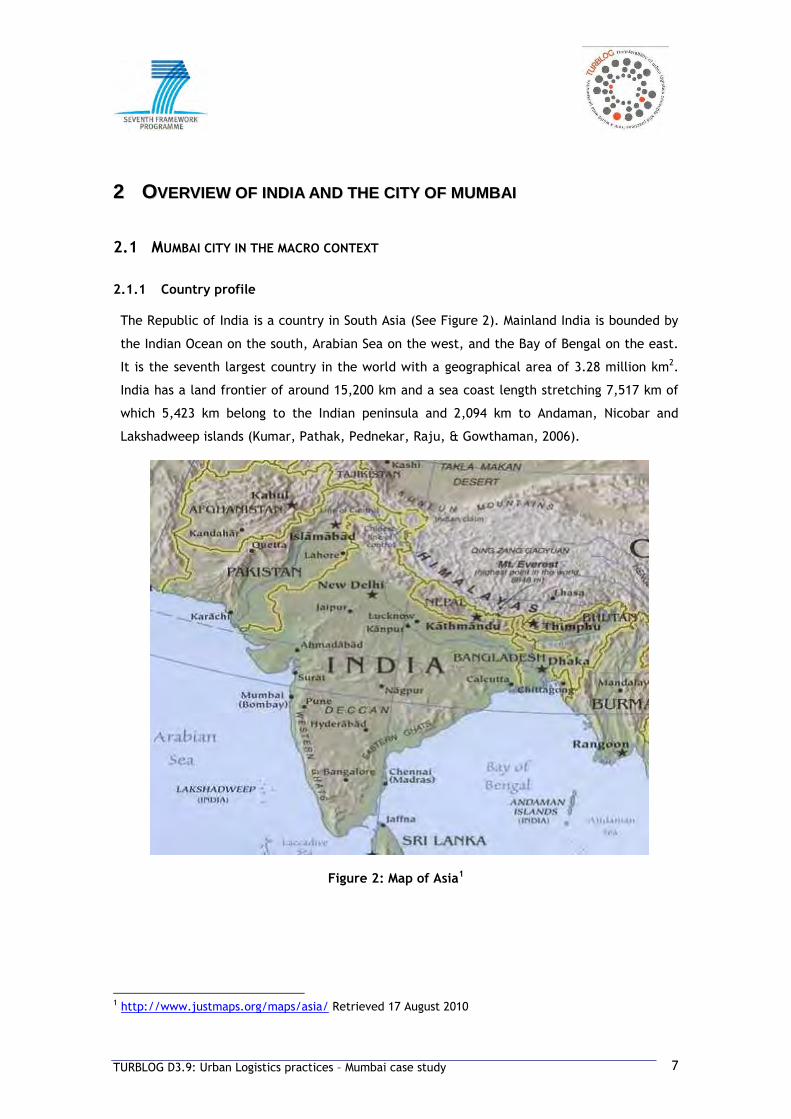
The Republic of India is a country in South Asia (See Figure 2). Mainland India is bounded by
the Indian Ocean on the south, Arabian Sea on the west, and the Bay of Bengal on the east.
It is the seventh largest country in the world with a geographical area of 3.28 million km2.
India has a land frontier of around 15,200 km and a sea coast length stretching 7,517 km of
which 5,423 km belong to the Indian peninsula and 2,094 km to Andaman, Nicobar and
Lakshadweep islands (Kumar, Pathak, Pednekar, Raju, & Gowthaman, 2006).
Figure 2: Map of Asia1
1 http://www.justmaps.org/maps/asia/ Retrieved 17 August 2010
TURBLOG D3.9: Urban Logistics practices – Mumbai case study 8
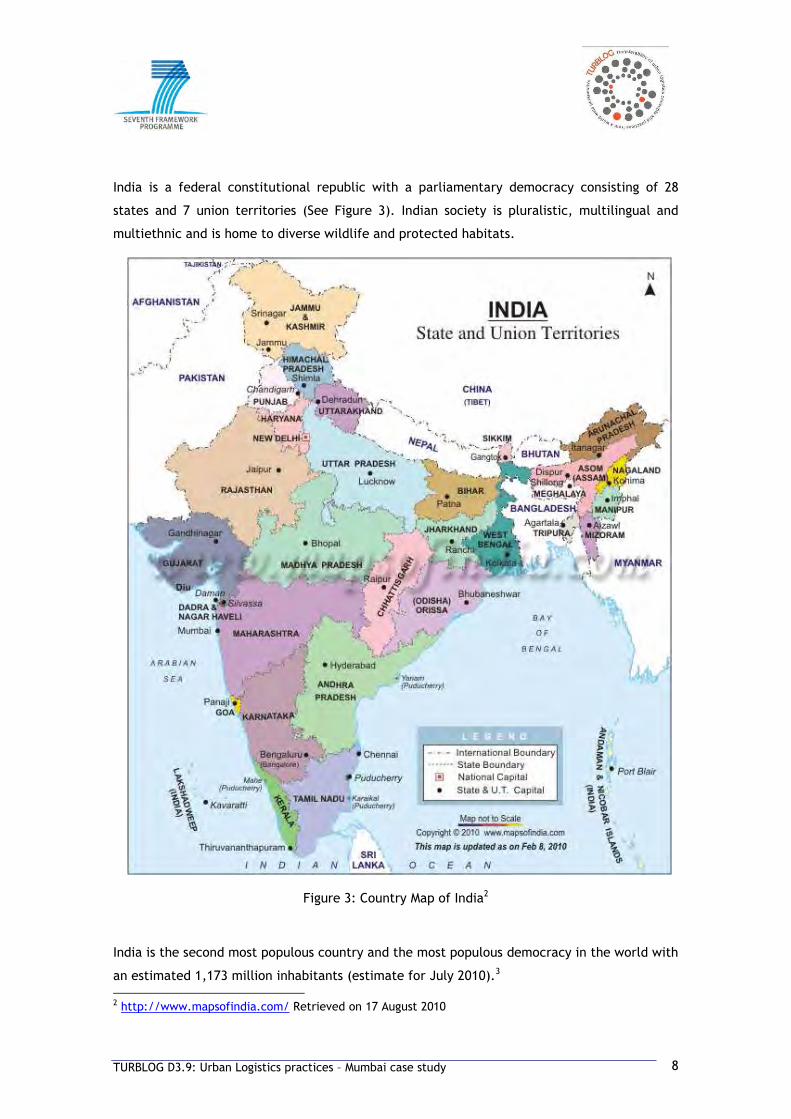
India is a federal constitutional republic with a parliamentary democracy consisting of 28
states and 7 union territories (See Figure 3). Indian society is pluralistic, multilingual and
multiethnic and is home to diverse wildlife and protected habitats.
Figure 3: Country Map of India2
India is the second most populous country and the most populous democracy in the world with
an estimated 1,173 million inhabitants (estimate for July 2010).3 2 http://www.mapsofindia.com/ Retrieved on 17 August 2010

TURBLOG D3.9: Urban Logistics practices – Mumbai case study 9
India occupies 2.4% of the world’s land area and supports over 17.5% of the world’s
population. India’s urban population increased 11 fold during the twentieth century and is
increasingly concentrated in large cities4. By 2001, 35 million plus cities existed in India, with
the largest cities namely Delhi, Mumbai and Kolkata having a population of more than 10
million each. The 2001 Census data showed that around 70% of India’s population resided in
rural areas while around 30% resided in cities in India5.
There is a large variation in population density across India. According to the 2001 Census
Report, the average Indian population density was 324 persons per km2. It varies from 13
persons per km2 in Arunachal Pradesh to 9,294 in Delhi. Among the States, West Bengal is the
most thickly populated with a population density of 904 persons per km2.
Following strong economic reforms from the socialist inspired economy of a post-
independence Indian nation, free market activities were initiated in 1990 for international
competition and foreign investment. As a result, India began to develop a fast-paced
economic growth rate averaging 8-10% per annum. By 2008, India had established as the
second fastest growing major economy6. According to the IMF, the Indian economy is the
eleventh largest economy in the world by nominal GDP and has the fourth largest purchasing
power parity in April 20107. India’s per capita income (nominal) in 2009 was $1,031 and
ranked 139th in the world, while per capita (Purchasing Power Parity) of 2,941 is ranked
128th8. India is regarded as an emerging economic power as it is endowed with a very large
pool of human and natural resources, coupled with a growing large pool of English speaking
skilled professionals.
India was primarily an agro-based economy until the early 1990s. Indian trade underwent
massive restructuring following the 1991 liberalization policies. Ever since, Indian exports
3 Source: The World Factbook (www.cia.gov)
4 http://lcweb2.loc.gov/frd/cs/profiles/India.pdf Retrieved 17 August 2010
5 http://www.censusindia.gov.in/Census_Data_2001/India_at_glance/glance.aspx Retrieved 17 August
2010
6 http://www.australiannews.net/story/366072 Retrieved 17 August 2010
7http://www.imf.org/external/pubs/ft/weo/2010/01/weodata/weorept.aspx?sy=2007&ey=2010&scsm=
1&ssd=1&sort=country&ds=.&br=1&c=534&s=NGDPD,NGDPDPC,PPPGDP,PPPPC,LP&grp=0&a=&pr.x=81&pr
.y=8 Retrieved 17 August 2010
8 http://siteresources.worldbank.org/SOUTHASIAEXT/Resources/DPR_FullReport.pdf Retrieved 17
August 2010
TURBLOG D3.9: Urban Logistics practices – Mumbai case study 10
have experienced a growth rate of 18% per annum, while the import sector has experienced a
growth rate of 34%9.
The main exports of India are engineering goods, iron and steel, jewellery and gems, textiles,
chemicals and agro products. In 2009, United Arab Emirates was the major importer of Indian
products attracting around 12% of all Indian exports. This was followed by United States of
America (US) attracting 11.7%, China 5.3% and Singapore 4.5%.
Agriculture constitutes India’s largest economic sector and significantly contributes to the
socio-economic development of the country. Agriculture along with allied sectors like
forestry, logging and fishing accounted for 17% of GDP in 2009 employing 52% of the total
workforce. India is the largest producer in the world of milk, cashew nuts, coconuts, tea,
ginger, turmeric, fruit and black pepper. It is also the second largest producer of wheat, rice,
sugar, cotton, silk, peanuts and inland fish. It is the third largest producer of tobacco.
Indian manufacturing industry accounts for 28% of the GDP and employs 14% of the total
workforce of which almost a third of the industrial labour force is engaged in simple
household manufacturing only. Textile manufacturing is the second largest source of
employment after agriculture and accounts for 26% of manufacturing output.
Indian service sector has the largest share in GDP accounting for 55% in 2007 and has grown at
a fast rate of 7.5% providing employment for around 23% of the workforce. The share of
business services (IT, IT enabled services and BPOs) to the nation’s GDP increased from 4.8%
to 7% from 2005-06 to 2008. Organized retail supermarkets account for 24% of the total urban
consumer market as of 2008.
The main imports to India are crude oil and machinery. Other imported commodities are
precious stones, fertilizers, iron and steel, gold and silver, consumer electronics, chemicals,
coal and transport equipment. In 2009, India ranked 15th in the world in terms of import
volume. India’s main import partners are China (11%), Saudi Arabia (6.9%), USA & UAE (6.7%)
and Iran (4.2%)9.
In the last 20 years, the inter-regional transport growth by weight in all modes has grown over
eight times in absolute terms from 283 million tonnes to 2,387 million tonnes from (1978-
2008), the bulk of the growth has been after early 1990s period which coincides with the
liberalization of the Indian economy.
In 2007-08, the modal shares for inter-regional freight transport in India was dominated by
road at 50% in transport volumes expressed in tonne-km. Indian Railways had 36% and coastal
9 http://www.economywatch.com/indianeconomy/export-import.html Retrieved 17 August 2010

TURBLOG D3.9: Urban Logistics practices – Mumbai case study 11
shipping occupied 6% of total transport output and the rest was by air and inland waterways.
The total transport output in terms of tonne-kilometres has grown exponentially in the past 3
decades from 188.9 billion t-km (1978-79) to 1,300 t-km (2007-08) which is nearly 7 times in
absolute terms (Singh et al. 2008). The average lead distances moved by a unit tonne of cargo
indicated that road transport was popular for relatively short distances (up to 453 km), rail
transport for middle distances haulage of up to 661 km and shipping and airways for distances
greater than 1,000 km (Singh et al. 2008).
India’s inhabitants speak a diverse array of languages (16 official languages as well as
innumerable local dialects) and businesses are geographically scattered around twenty eight
states and seven union territories. Therefore it is difficult to make sweeping generalization of
business culture in India. Even so, there are certain factors universally applicable when
carrying out business in India.
In India, inter-personal relationships are placed before business interests and therefore
considered most important. Secondly, society and businesses are hierarchically structured
where one strong individual will issue direct instructions down the chain of command.
Employees have allotted positions and decision making power. Decisions from the top are
usually followed unquestioningly. Because of this cultural characteristic, many Indians find it
extremely difficult to work in a non-hierarchical business structure as is in the West.
Therefore doing business in India necessitates the liaison as near to the top of the hierarchy
as possible to have an impact on the business decision making10.
English is one of the fifteen official languages in India and is universally spoken by the
educated sections of society. As with many Asian cultures, it is difficult for Indians to say no
as it is considered offensive and leads to difficulty in continuing relationships. Disagreements
are communicated by vagueness and lack of commitment.
2.1.2 Urban freight data collection in the country
The availability of statistical data about urban goods movements in Indian cities is almost
non-existent, when compared to the situation in general traffic and in passenger transport,
where the data basis is relatively better than in the urban freight domain. Unlike in
developed countries, comprehensive time series urban freight data (by weight, distance,
volume, cost and revenues) in India is not known to be carried out to author’s knowledge.
According to the Planning Commission Committee Report for XI 5 year plan, there is not yet
10 http://www.worldbusinessculture.com/Business-in-India.html Retrieved 17 August 2010

TURBLOG D3.9: Urban Logistics practices – Mumbai case study 12
an institutionalised collection of freight transport data in any of the urban or inter-urban
transport flows.
Figure 4: Urban freight system approach.
Source: BESTUFS II (Schoemaker et al. 2006)
Urban freight transport data is used by different stakeholders within the urban environment.
BESTUF II project (Schoemaker et al. 2006) identified the main stakeholders requiring freight
transport data to be city authorities, shippers, receivers, transport operators and vehicle
manufacturers. Each stakeholder has specific viewpoints, objectives, expectations and
requirements for collecting urban freight transport data (Huschebeck 2001). Figure 4 shows
the complexity of city logistics and their different influencing factors.
The Municipalities require data to manage the urban transport system better. This means
ensuring that urban goods transport and supply are carried out optimally, or in other words,
minimising both the operational costs of transport and negative external costs to society
(Schoemaker et al. 2006). Municipalities require information on traffic and transport such as
the number of trucks of a special size registered in a city or region or transport amounts (in
tonnes) of single business fields. The former data can be obtained easily without much
financial effort and its use is rather limited for urban freight transport planning. But transport
TURBLOG D3.9: Urban Logistics practices – Mumbai case study 13
amounts are difficult to collect partly due to the difficulty in collection and partly because
transport companies are reluctant to share the data for reasons of confidentiality
(Schoemaker et al. 2006). On the other hand, transport industry requires data to ensure cost
efficiency for operations, more transparency in access-restrictions and harmonisation of
restrictions throughout the city.
The acquisition of reliable statistical data and performance of periodic updating is necessary
in order to obtain information about special situations or for the robust evaluation of policy
measures implemented (Stantchev & Whiteing 2006). Having such evaluation results will be
useful for the planning, implementation and assessment of measures in urban goods transport
in Indian cities. A comparison of planning and organisation of goods transport and city
logistics is extremely difficult in the present circumstances because of two critical factors -
goods transport data in India is non-existent and because of the lack of systematic and non-
existent standard data collection methodologies and institutions (Sriraman et al. 2006).
Information such as the number of trips by each vehicle in the transport company, vehicle
occupancy factors, sizes of vehicles in different fleets, goods transports via different
transport modes, use of road space by trucks and lorries and much more information is usually
missing in typical surveys carried out in many cities abroad (Sriraman et al. 2006). To develop
realistic urban freight transport models, data on transport chains, number of tours and
number of stops and origin-destination matrices related to transport weights, consignment
sizes, vehicle types, etc. is essential and this is not available from statistical survey data
(Huschebeck 2001). The main sources for data collection in India for urban freight movements
are Permit System, Vehicle Registrations and Octroi charges (Sriraman et al. 2006).
Permit system:
Permits are issued by the State Transport Authorities to operators for intra-State and National
permits. Presently the method of data collection on goods transport is done by means of
permits and licences issued to vehicles and operators as well as the revenues collected by the
Regional Transport Offices under the Motor Vehicles Act, 198811. This is the Central Act
applicable throughout the country. For goods carriage, Table 1 shows the different types of
permits issued.
11 http://www.cyberabadpolice.gov.in/Acts%20and%20Laws/MV%20ACT.pdf Retrieved on 30 August 2010

TURBLOG D3.9: Urban Logistics practices – Mumbai case study 14
Table 1: Types of permits issued for plying goods transport vehicles12
Type of Permit Class of vehicles to which permit
applies
Description
Goods carriers Goods trucks, delivery vans, trailers, etc.
Transportation of goods within Maharashtra State for hire or reward
Temporary Permit
All kinds of transport vehicles
Use of transport vehicles on special occasions like fairs, religious gatherings, seasonal business, to meet a particular temporary need and in case of pending decisions on renewal of permit
National permit of goods vehicles
Goods truck with sleeping berth to spare driver
Transportation of goods all over India
However the database relating to these permits is not updated on a systematic basis, as a
result one is unable to know the exact number of permits issued.
Under the National permit scheme, each truck had to pay Rs.20,000 annually to obtain a
National permit (TOI 2010). The fee allowed the truck operator, access to its home state
where it was registered and three neighbouring states. For each additional state, the truck
operator had to pay an additional Rs. 5,000. Under the new regulation a unified national
permit is effective from May 1, 2010, which will be implemented in 2011 (TOI 2010). The new
permit system aims to give a further impetus to the goods and services tax with the objective
to create a seamless pan-Indian market. According to the new regulation, each commercial
goods vehicle will need to register for the national permit at the Regional Transport Office
(RTO) and pay the national permit fee of Rs. 15,000 per truck per annum to the State Road
Transport Undertaking, a NGO at the Centre. Each state will receive its share of revenue
based on the average of the last 3 years collection. The National permit is expected to save
costs of up to Rs. 10,000 annually per truck, reduce operation hurdles and time for both
commercial vehicles and the State Administration. Shippers and forwarders will not be too
affected by the new unified national permit as the permit fee contributes to less than 2% of
the total operating cost.
12 http://maharashtra.gov.in/english/homedept/transport/permit.html Retrieved on 13 August 2010
TURBLOG D3.9: Urban Logistics practices – Mumbai case study 15
Vehicle Registrations:
Another source of data is the number of vehicles registered by the Regional Transport Offices
in each State. Registration is done on basis of vehicle category (Sriraman et al. 2006).
Assuming an average loading capacity per vehicle type, the total capacity available for goods
carriage can be estimated. However, this data does not give the break up relating to
composition of fleet. Registered numbers often include vehicles which have been
deregistered.
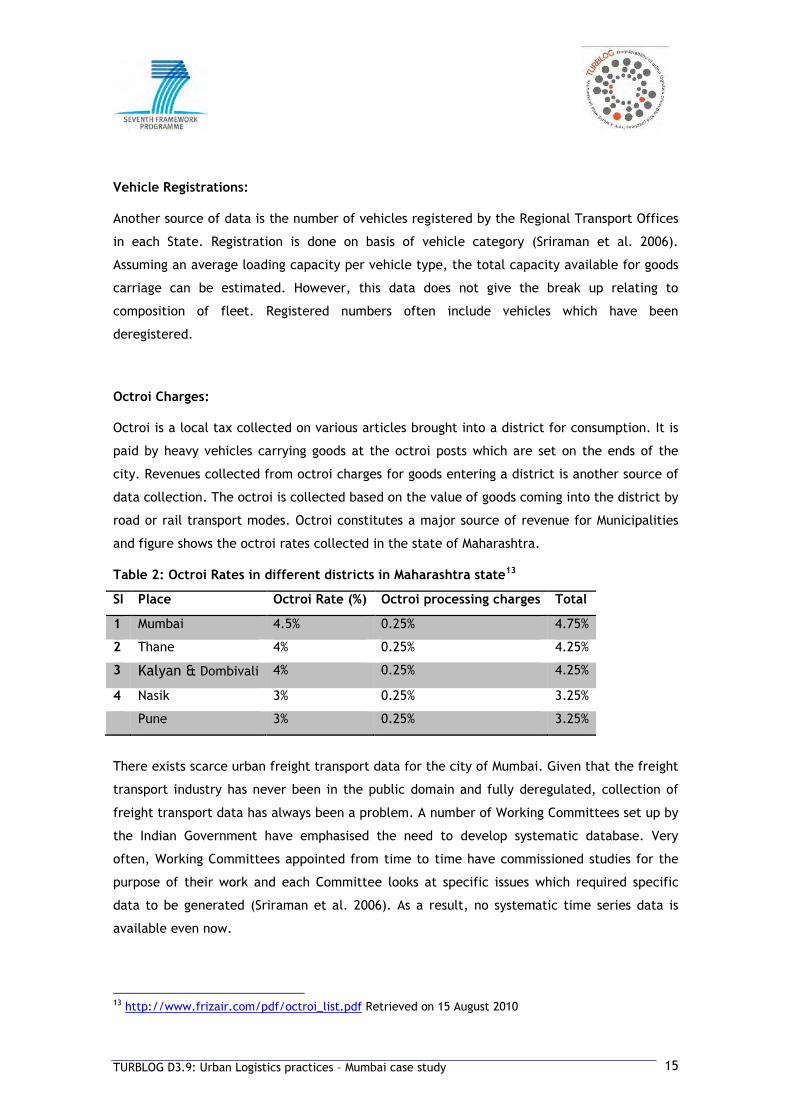
Octroi Charges:
Octroi is a local tax collected on various articles brought into a district for consumption. It is
paid by heavy vehicles carrying goods at the octroi posts which are set on the ends of the
city. Revenues collected from octroi charges for goods entering a district is another source of
data collection. The octroi is collected based on the value of goods coming into the district by
road or rail transport modes. Octroi constitutes a major source of revenue for Municipalities
and figure shows the octroi rates collected in the state of Maharashtra.
Table 2: Octroi Rates in different districts in Maharashtra state13
SI Place Octroi Rate (%) Octroi processing charges Total
1 Mumbai 4.5% 0.25% 4.75%
2 Thane 4% 0.25% 4.25%
3 Kalyan & Dombivali 4% 0.25% 4.25%
4 Nasik 3% 0.25% 3.25%
Pune 3% 0.25% 3.25%
There exists scarce urban freight transport data for the city of Mumbai. Given that the freight
transport industry has never been in the public domain and fully deregulated, collection of
freight transport data has always been a problem. A number of Working Committees set up by
the Indian Government have emphasised the need to develop systematic database. Very
often, Working Committees appointed from time to time have commissioned studies for the
purpose of their work and each Committee looks at specific issues which required specific
data to be generated (Sriraman et al. 2006). As a result, no systematic time series data is
available even now.
13 http://www.frizair.com/pdf/octroi_list.pdf Retrieved on 15 August 2010

TURBLOG D3.9: Urban Logistics practices – Mumbai case study 16
Table 3 enlists critical urban freight indicators for freight transport planning and policy
purposes and highlights the severe gap in existing data collection in the Indian context. As
seen in the table below, data on the number of registered freight vehicles, number of
transport companies, urban freight flows and safety related data is collected for Indian cities.
Table 3: Urban freight indicators by impact category
Impact category Indicator category
Indicator Collected in India (Yes / No)
Freight volumes and commodities in urban areas
Transport demand
• Volumes transported into urban areas No
Logistics • Goods receivers • Logistics costs • Share of urban transport costs
compared to total supply chain • Salaries in urban freight transport
No No No No No
Population • Population density and share of population in urbanized areas
• Household size
No No
Urban freight transport fleet
Freight vehicles
• Number of vehicles according to GVW and age
• Proportion of goods vehicles in total traffic
• Ownership of vehicles • Vehicles operating in cities
Yes Yes No No
Urban traffic flow
• Number of vehicles entering cities • Distribution of freight vehicles
movements over day
Yes No
Service visits and waste collections
• Service visits • Waste collection
No No
Performance • Freight vehicles kilometres • Use of load capacity
No No
Urban Deliveries General delivery characteristics (operator)
• Combined shipments • Delivery days and times • Regularity of trips • Origin of delivery trips • Number of stops per tour, per day • Trip length • Distance between stops • Trip times • Travel time to and within city centre
No No No No No No No No No
General delivery characteristics (receivers)
• Deliveries at premises • Dwelling time in urban area/loading
and unloading times
No No

TURBLOG D3.9: Urban Logistics practices – Mumbai case study 17
Impact category Indicator category
Indicator Collected in India (Yes / No)
Home delivery • Home delivery services offered by shops
• Number of km covered by inhabitant
No No
Contribution to economy
Employment % in transport and logistics
• Number of jobs in transport • Number of transport related
companies
No Yes
Environment Energy use • Typical fuel consumption by vehicle type
• Energy consumption in urban freight transport
• Consumption of non- renewable fuel resources
No No No
Exhaust emissions
• Typical emission factors by vehicle type
• Share of urban freight in exhaust emissions
No No
Noise • Noise levels driving truck • Noise levels loading/unloading truck
No No
Safety Accidents and casualties in urban freight transport
• Number of accidents • Number of fatalities • Involvement of freight vehicles in
accidents • Weekly distribution of accidents
involving HGVs
Yes Yes Yes No
Road user type • Cyclists • Pedestrians • Car drivers
No No No
Source: Adapted from (Huschebeck 2001)
2.2 URBAN FREIGHT IN MUMBAI
Mumbai or formerly Bombay is the capital of the Indian state of Maharashtra (See Figure 5).
Mumbai lies on the west coast of India and has a deep natural harbor. Mumbai lies in the
mouth of the Ulhas river. The coastal region of Maharashtra state in which Mumbai is a part
known as the Konkan region (Dwivedi & Mehrotra, 2001). Mumbai is geographically located on
the Salsette island which is surrounded by the Arabian sea.

TURBLOG D3.9: Urban Logistics practices – Mumbai case study 18
Figure 5: Location of Mumbai in India14
The Mumbai region as a whole is a low land lying on the west of Sayhadri hill ranges. Many
parts of the city lie just above sea level with average elevation of 14m. The Mumbai region
has a varied landscape marked by a series of north-south hill ridges in central and eastern
part which is characteristic of the Deccan lava formed by successive layers of basalt flows.
Mumbai has a peculiar geography - a narrow wedge shaped land surrounded by water on 3
sides – which has for decades, dictated spatial growth which is mainly linear along the North-
South axis.
Mumbai has 6 major lakes with numerous tributaries flowing towards the Arabian Sea that
provide important sources for water for the region. Three small rivers – Dahisar, Poisar and
14 http://www.urban-age.net/10_cities/_data/_FIC/FIC_MBI.html Retrieved 11 August 2010

TURBLOG D3.9: Urban Logistics practices – Mumbai case study 19
Oshiwara originate within the Sanjay Gandhi National Park. The Mithi river passes through the
Mumbai and originates from Tulsi Lake, gathering waters overflowing from Vihar and Powai
lakes. The rivers and lakes are only used for agricultural and industrial purposes. The city’s
coastline has numerous creeks and bays from Thane creek on the east to Madhav Marve on the
western front. The region has a 167 km coastline of which a vast area is occupied by wetlands
and mangroves.
Figure 6: Greater Mumbai Metropolitan Region Map15
After India’s independence in 1947, Mumbai’s spatial growth took place in the south near the
Mumbai Port. Gradually it spread northwards along the suburban rail corridors. Until 1968,
most of the Region’s urban growth was confined to Greater Mumbai municipal limits. The
urban sprawl study indicates that after 1968, urban sprawl took place along Kalyan, Mira-
Bhayander, Navi Mumbai and Vasai areas by conversion of agricultural land and reclamation of
wetlands (Phatak, Pendharkar, & Patkar, 1999). Figure 6 shows the area of Greater Mumbai
15 http://www.mmrdamumbai.org/ Retrieved on 12 August 2010

TURBLOG D3.9: Urban Logistics practices – Mumbai case study 20
Metropolitan Region. Despite rapid urban sprawl in recent times, 42% of the Greater Mumbai
region’s area is occupied for agriculture and 26% is covered by forestlands16.
According to the 2001 Census, Mumbai had a population of 11,914,398. Recent estimates
showed that Mumbai’s population grew at compounded rate of around 1.98% per annum
touching 13,662,800 in 2008 with an average population density roughly estimated to be
22,000 people per km2.
Mumbai is considered the financial capital of the country as it generates 6% of the total GDP
of the nation17. In 2009, Mumbai’s GDP was Rs. 200,483 crores (USD 42.7 billion) and per
capita income was Rs. 128,000 (USD 2,730) which is almost 3 times the national average (FT
2008). Many of India’s business conglomerates and Fortune 500 companies have headquarters
in Mumbai.
Until the 1970s Mumbai’s economy flourished on textile mills and sea trade. Port and shipping
industry is an established sector in Mumbai, with Mumbai port being one of the oldest and
significant ports in India. In the past 3 decades, the economy has diversified into other
sectors such as engineering, diamond polishing, healthcare, information technology, media
and entertainment.
A significant part of Mumbai’s workforce was employed in state and central government
undertakings. Mumbai also has a large workforce of semi-skilled self employed population
who earn a livelihood as hawkers, taxi drivers, mechanics, vendors and other service and
manufacturing professions. A very large recycling industry exists in the Central Mumbai region
that processes waste for other parts of the city, which is a major source of employment for
the informal sector.
Nariman point area in south Mumbai was the first Central Business District (CBD) as the city
expanded in the period between 1950s and 1960s. During that period, growth of real estate
for businesses and offices was taking place within a small geographical area in South Mumbai
(Nariman Point CBD area). While affordable housing was increasingly available mainly in the
north and east parts of Mumbai. Over a period of time, this resulted in a large workforce
travelling to South Mumbai creating increasing levels of road and rail congestion. Over the
years, Nariman Point CBD area became saturated with the consequence that real estate
prices increased as new land was not available for further real estate development.
16http://www.mcgm.gov.in/irj/portalapps/com.mcgm.ahome_keyprojects/docs/1-
2%20Regional%20Setting.pdf Retrieved 12 August 2010
17 http://www.financialexpress.com/news/gdp-growth-surat-fastest-mumbai-largest/266636/ Retrieved
11 August 2010

TURBLOG D3.9: Urban Logistics practices – Mumbai case study 21
For decades, Mumbai’s spatial development followed a mono-centric, linear pattern of
growth wherein, office and commercial activity concentrated at the southern end of the city,
the industrial and residential development spread northwards along the suburban rail
corridors. The first regional plan for Mumbai Metropolitan Region was sanctioned in 1973. The
Regional Plan of 1973 sought to alter this pattern by developing Navi Mumbai on the main
land across the harbour, and by creating other growth centres, like Bandra-Kurla Complex and
Kalyan Complex. Since then, much efforts and investment have gone into development of
these growth centres, relocation of economic activities from the Island City, and creation of
new infrastructure, such as, Mankhurd - Belapur railway line and Jawaharlal Nehru Port.
These efforts, together with large population growth in Thane, Kalyan, Bhiwandi, Vasai - Virar
area and massive industrial investment taken place outside Greater Mumbai set in motion an
irreversible process of spatial decentralization. The proposals of the revised Land Use Plan in
the Regional Plan 1996-2011 (Phatak et al. 1999) reflected a logical extension of this process
and were guided by existing development trends.
Presently, South Mumbai continues to remain the most dominant business centre in the
Mumbai Metropolitan Region. Bandra-Kurla Complex has developed as Mumbai’s new
International Finance and Business Centre. Vashi has acquired a key position in Navi Mumbai’s
development as the centre for wholesale trade. Similarly, Central Business District of Navi
Mumbai, and the area around Jawaharlal Nehru Port have developed for port-related
activities and have attracted office establishments, export processing activities etc. Owing to
new investments in the new centres combined with good transport linkages between them
have contributed to these centres being key job centres and areas between them, along
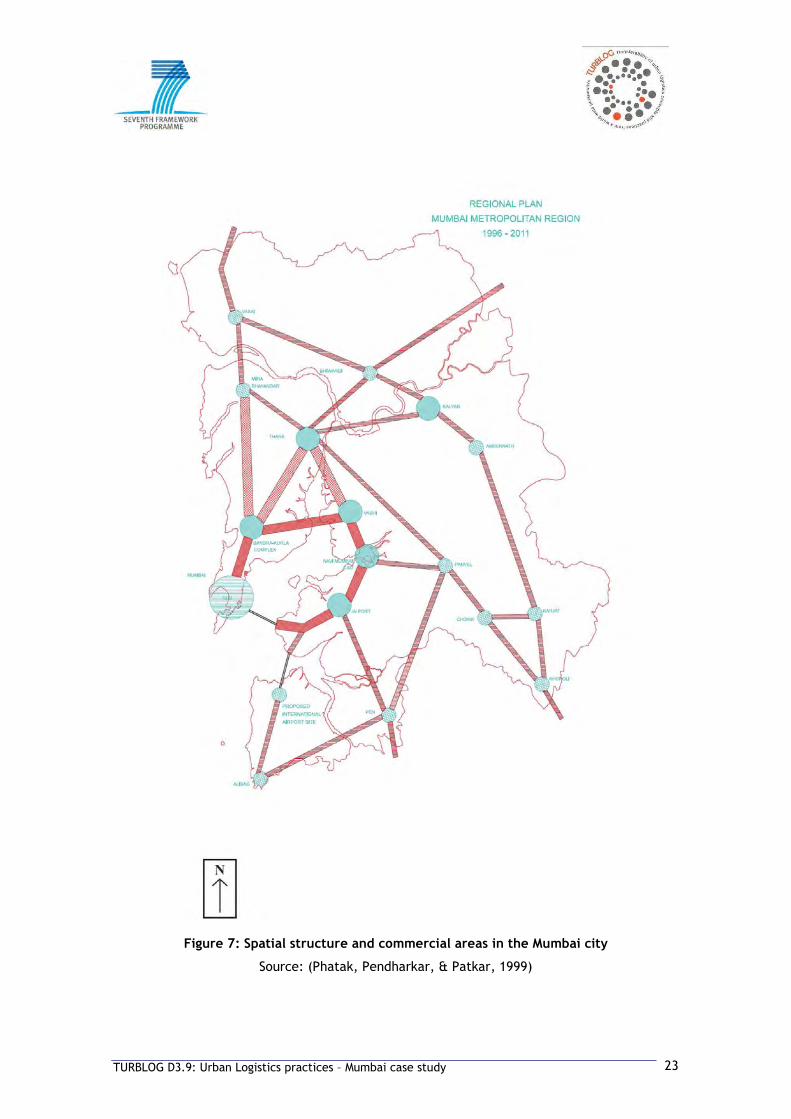
transport corridors, are witnessing new development. This structure comprising of South
Mumbai CBD, New Mumbai CBD, Jawaharlal Nehru Port, Bandra-Kurla Complex and Vashi form
the Pentagon (See Figure 7). This has emerged as MMRDA’s core of economic activity and
population. The possibility of the Mumbai Trans-harbour Link, and second international
airport at Mandwa are likely to strengthen the Pentagon pattern further.
Beyond the Pentagon, the existing urban centres and the transport corridors joining them
form two concentric arcs. The first encompasses Mira-Bhayandar, Thane, Panvel, Pen and
Alibag. The second arc encompasses Vasai-Nalasopara, Bhiwandi, Kalyan, Ulhasnagar,
Ambernath, Karjat and Khopoli. While the urban centres represent concentration of jobs and
population, the intervening areas along the transport corridor will be stimulated for dense
urbanization in the future. The resultant spatial pattern of the Region’s development, thus,
would consist of a core represented by the Pentagon, and rings of urban centres and
development areas along the major transport links. This pattern (graphically represented in
Figure 7) is guiding the present land use strategy.

TURBLOG D3.9: Urban Logistics practices – Mumbai case study 22
New growth centres and new transport linkages are likely to give rise to a new spatial
structure, new pattern. De-centralization of commercial areas has been visible in Mumbai but
took some years for businesses and population to relocate. Office relocations in Mumbai have
shown some typical trends. Establishments needing large areas and having captive clientele
appear to have adopted decentralized locations while smaller establishments, essentially
depending on inter linkages with other establishments and competing with similar
establishments, have agglomerated in areas with relatively lesser real estate market prices.
In Andheri, (near Saki Naka and SEEPZ) a lot of new offices related to electronics are coming
up mainly through land use conversions from residential to industrial zones.
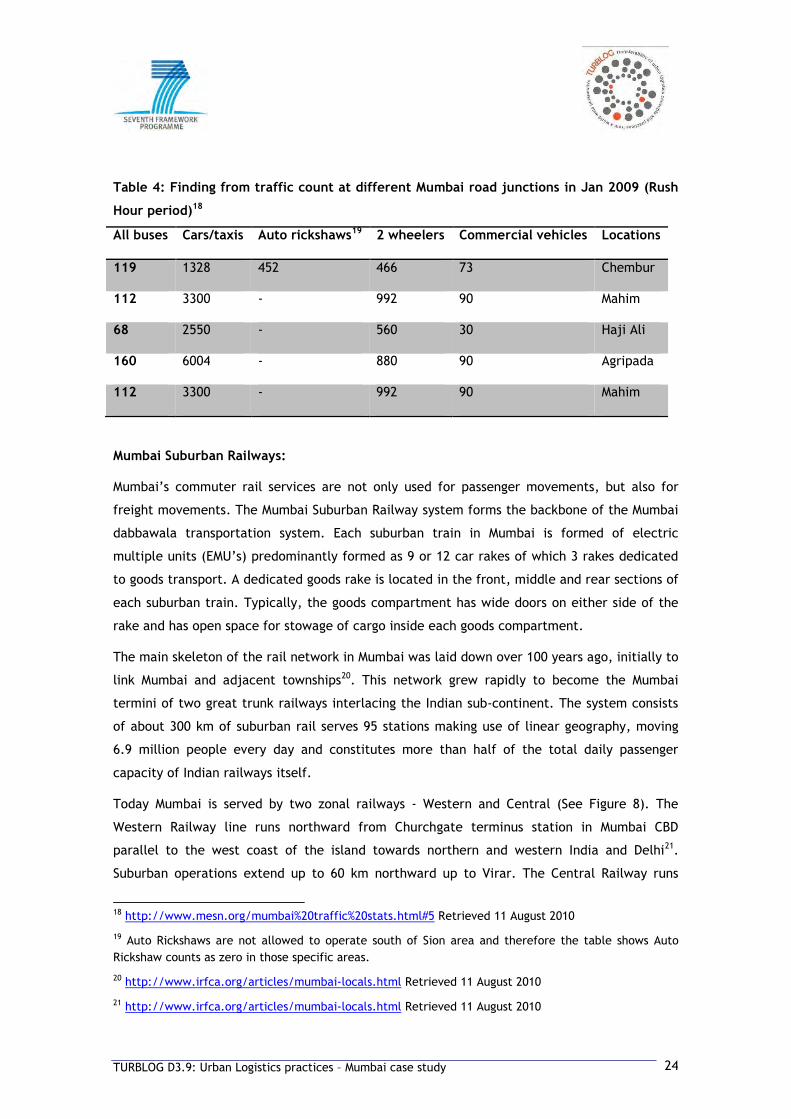
Road users are diverse and employ slow, medium and fast motorized and non-motorized
vehicle types (mixed traffic) on the same road infrastructure. For example, vehicles include
cyclists, pedestrians, hand carts, bullock carts, auto rickshaws, cars/taxis, commercial
vehicles which include trucks, vans, trailers, tankers & tempo. Many of the roads are
inaccessible to slow modes of transport and are indicated through notifications by the Traffic
Police on their website. Table 4 shows the traffic counts in high volume junctions around the
city.
Transport of millions of Mumbai citizens and goods is done by train, road and water transport
modes. Over 88% of the Mumbai commuters and a small part of goods is transported by public
transport (suburban trains or buses) because it is the most convenient, efficient and cheap
transport to a population that cannot afford a car or use a private goods vehicle. Mumbai has
the most extensive bus and rail networks among India’s major cities.
TURBLOG D3.9: Urban Logistics practices – Mumbai case study 23
Figure 7: Spatial structure and commercial areas in the Mumbai city
Source: (Phatak, Pendharkar, & Patkar, 1999)
TURBLOG D3.9: Urban Logistics practices – Mumbai case study 24
Table 4: Finding from traffic count at different Mumbai road junctions in Jan 2009 (Rush
Hour period)18
All buses Cars/taxis Auto rickshaws19 2 wheelers Commercial vehicles Locations
119 1328 452 466 73 Chembur
112 3300 - 992 90 Mahim
68 2550 - 560 30 Haji Ali
160 6004 - 880 90 Agripada
112 3300 - 992 90 Mahim
Mumbai Suburban Railways:
Mumbai’s commuter rail services are not only used for passenger movements, but also for
freight movements. The Mumbai Suburban Railway system forms the backbone of the Mumbai
dabbawala transportation system. Each suburban train in Mumbai is formed of electric
multiple units (EMU’s) predominantly formed as 9 or 12 car rakes of which 3 rakes dedicated
to goods transport. A dedicated goods rake is located in the front, middle and rear sections of
each suburban train. Typically, the goods compartment has wide doors on either side of the
rake and has open space for stowage of cargo inside each goods compartment.
The main skeleton of the rail network in Mumbai was laid down over 100 years ago, initially to
link Mumbai and adjacent townships20. This network grew rapidly to become the Mumbai
termini of two great trunk railways interlacing the Indian sub-continent. The system consists
of about 300 km of suburban rail serves 95 stations making use of linear geography, moving
6.9 million people every day and constitutes more than half of the total daily passenger
capacity of Indian railways itself.
Today Mumbai is served by two zonal railways - Western and Central (See Figure 8). The
Western Railway line runs northward from Churchgate terminus station in Mumbai CBD
parallel to the west coast of the island towards northern and western India and Delhi21.
Suburban operations extend up to 60 km northward up to Virar. The Central Railway runs
18 http://www.mesn.org/mumbai%20traffic%20stats.html#5 Retrieved 11 August 2010
19 Auto Rickshaws are not allowed to operate south of Sion area and therefore the table shows Auto
Rickshaw counts as zero in those specific areas.
20 http://www.irfca.org/articles/mumbai-locals.html Retrieved 11 August 2010
21 http://www.irfca.org/articles/mumbai-locals.html Retrieved 11 August 2010

TURBLOG D3.9: Urban Logistics practices – Mumbai case study 25
from Mumbai Chatrapati Shivaji Terminus (CST) situated on the eastern side of the Island and
serve a large part of Central India. Suburban services extend from Mumbai CST as far as
Kasara to the north east (120 km) and Karjat to the south east (100 km). The Central Railway
is also responsible for services on the “Harbour Line” which runs from CST along the east side
of Mumbai Island to Rawli Junction where the line splits. One branch goes to north west to
join the western railway main line at Bandra, with other line continuing northward to Kurla,
before turning east wards to serve Chembur and Mankhurd and cross the new Thane Creek
bridge to access the developing city of new Mumbai.
The railway tracks are encroached upon by the squatters very close to the railway line in the
Chembur Govandi area, resulting in speed restrictions having to be imposed on the trains for
safety. At Wadala, the Mumbai Port Trust rail line joins the harbour line and north of Wadala.
The harbour lines are shared with freight traffic to and from the Mumbai docks. Within the
Mumbai area both railways carry a combination of suburban, long distance and freight traffic.
Within Mumbai many stations are less than 1.5 km apart and in some cases, less than 1 km.
Such close stations are characteristic of a metropolitan urban railway rather than a suburban
system. In addition to the lines radiating from Mumbai there is a single track connection
between Vasai Road on the Western Railway and Diva on the Central Railway. This allows long
distance north south trains to bypass Mumbai. The branch from Diva junction to Roha provides
a link to the Konkan railway.
Due to its extensive reach across the Mumbai Metropolitan Region and efficiency of suburban
rail, the system suffers from severe overcrowding unknown to any other rail system of similar
dimension. Over 4,500 passengers are packed in a 9 car rake during peak hours as against a
capacity of 1,700. For goods transport too, 3 dedicated rakes are observed inadequate during
peak hour traffic. Due to insufficient oversight, many passengers are known to use dedicated
goods rakes for commuting during peak hours. This further reduces available capacity and
increases inconvenience to carry goods during the train journey.

TURBLOG D3.9: Urban Logistics practices – Mumbai case study 26
Figure 8: Mumbai suburban Railway Network
(Source: www.mapsofindia.com )

TURBLOG D3.9: Urban Logistics practices – Mumbai case study 27
Road Infrastructure Network:
The organized freight haulage industry in the city of Mumbai predominantly utilizes the road
transport for the movement of goods. Mumbai region has an extensive road infrastructure
network and is well connected by 4 National Highways (to Pune, Nasik, Goa and Ahmedabad)
and 19 designated State highways for inter-regional passenger and goods traffic. Mumbai
region has about 2,000 km of road length including 11 flyovers, 47 Road over bridges (ROBs)
and 104 bridges. The structural condition of the roads is generally good, though the riding
surface deteriorates during monsoons as unprecedented rains and flooding is common.
The road network has developed in a predominantly north-south direction. Extensive
development over much of the peninsula has led to the major traffic movements being
concentrated into three main corridors: western, central and eastern. The western corridor
generally provides higher level of service than central and eastern corridors. The central
corridor, especially in the south Island area, is severely congested with high pedestrian
movements and bus traffic. The eastern corridor which runs adjacent to the port area, carries
large volume of truck traffic and suffers badly from long term parking and informal roadside
vehicle maintaining activities.
East- West movement is constrained by the Western and Central Railway tracks which also run
majority of the length of the Island City. Consequently major traffic movements are
concentrated on relatively few roads, resulting in major points of congestion where east-west
movements intersect the north-south corridors. To the north of Mumbai Island, east-west
movements are further restricted by the limited number of crossing points on the Mithi river.
This lack of good link between places like Santacruz and Chembur often results in
considerably long detours via Sion and the Western and Eastern Express Highways, both for
passenger and freight movements within the Mumbai region.
The roads of Mumbai serve not only as a means of transport provision but also function as
parking areas for vehicles, extended footways, sites for hawkers and other commercial
activities. In some places notably on the Western Expressway, part of the right of way has
been encroached upon by slums. These other functions, together with frequent disruption due
to service provision and maintenance, severely reduce the traffic capacity of Mumbai roads
and highways.
The road network has developed piecemeal and this has resulted in some junctions acting as a
focus for a large number of intersecting streets. These tend to be controlled by traffic signals
which have long cycle times to accommodate the large turning movements at the junctions.
Delays to traffic are considerable and the problem increases wherever pedestrians and goods
vehicles compete with passenger traffic for the limited road space.

TURBLOG D3.9: Urban Logistics practices – Mumbai case study 28
When these junctions are located in close proximity, which is the case in many areas in
Mumbai CBD, severe traffic congestion occurs, resulting in low average journey speeds of less
than 10 km/h. The areas around Churchgate and Mumbai Central railway stations are
particularly congested during the morning and evening peak periods. However traffic speeds
on the eastern and Western Express Highways and on the main corridors in Mumbai region is
reasonably better due to active traffic management enforced by the traffic police.
Freight movement is concentrated around Masjid Bunder, port areas, Byculla and Mazagaon
areas in the island city while Navi Mumbai, Ghatkopar, Kurla, Vikhroli and Bhandup in the
suburbs. De-centralisation policies in the early 1990s have led to the relocation of the
following wholesale markets from Masjid Bunder area to Turbhe near Vashi:
• Onion and Potato Market;
• Grain, rice, oil seeds market;
• Condiment, spices, sugar, jaggery and dried fruits markets;
• Iron and Steel stockholding sites and wholesaling markets were shifted to Kalamboli in
Navi Mumbai.
Due to the above shifting, it is observed that the heavy vehicular traffic is slowly declining in
the City areas while the traffic on Express Highways and National Highways is growing.
2.3 URBAN TRANSPORT PROBLEMS IN CITY OF MUMBAI
2.3.1 State of the art
Urban freight transport demand has increased as a consequence of increasing urban
population, consumption patterns mainly as a consequence of increased economic activity
and the mushrooming of malls for shopping. Due to the availability of a large diversity of
consumer products and shopping malls all across the city, Mumbai experiences a massive
increase in urban freight transport movements generally similar to cities in developing
economies. From 1991 to 2005, the total number of motorized vehicles (goods and passenger)
more than doubled from 0.6 to 1.3 million. While the vehicles multiplied 37 times over the
last 50 years, Mumbai’s road network only doubled. The number of registered vehicles (goods
and passenger together) is growing at 4-5% per annum. Trailers have also registered 9% CAGR
reflecting the increase in containerized goods movement through Mumbai’s ports22.
22http://www.mcgm.gov.in/irj/portalapps/com.mcgm.ahome_keyprojects/docs/2-
5%20Urban%20Transportation.pdf Retrieved on 14 August 2010
TURBLOG D3.9: Urban Logistics practices – Mumbai case study 29
Road traffic density during peak hours in some areas of the city is so high that the average
speeds climb down to as low as 6 – km/h especially in the areas of Sion, Bandra and Dadar. In
addition to vehicular growth other major factors for road congestion are identified as follows:
• Inadequate capacity of existing arterial roads linking CBD areas to the rest of
Mumbai’s Metropolitan Region is identified as one of the main issues causing road
congestion. There is a lack of East-West and North-South connectivity linking the
commercial business centre for the movement of people and urban freight along
these corridors. The existing arterial roads ( Eastern and Western Express Highways)
and suburban rail infrastructure (Western, Central and Harbour Lines) are proving
inadequate for the increasing traffic volumes over the years;
• Free flow of traffic is seriously hampered by unplanned and frequent digging of roads
by utility agencies/companies for laying utility lines throughout the year which after
roads restoration leave the road in a bad condition. This causes road width to
decrease on localized areas causing severe bottlenecks and problems of congestion;
• The poor riding surfaces in internal road networks either because of neglect or poor
quality of maintenance (especially post monsoons every year) is a cause of slow
traffic movement and resultant congestion. Road closures or diversions to promptly
attend to maintenance works aggravate the traffic problems of congestion in the city;
• Traffic bottlenecks exist in the form of narrow right of ways in certain dense traffic
regions in the city’s road networks resulting in overall drop in traffic speeds;
• Because of the severe imbalance of parking spaces and number of vehicles in the city,
car and goods vehicles are forced to resort to on-street parking causing decrease in
road capacity for free flow of traffic on the road networks. In 2007, common parking
spaces were available for only 8,000 vehicles in 100 odd pay and park areas across
city. The city’s vehicular density is 591 vehicles per km2 compared to the
international average vehicular density of 300 vehicles per km2 23. While some
warehouses and retail outlets have dedicated parking areas, in most cases they are
inadequate, hence the solution is to park on the streets, sometimes double and triple
parking. This inevitably creates problems for drivers and for the traffic police who are
unable to clear congested roads, making traffic jams inevitable;
• Proliferation of slums especially on sites reserved for essential infrastructure
particularly of transport is causing impediments to the implementation of transport
23 http://www.dnaindia.com/opinion/editorial_mumbai-s-parking-problem_1080666 Retrieved on 15
August 2010

TURBLOG D3.9: Urban Logistics practices – Mumbai case study 30
infrastructure augmentation projects. Most of these encroachments are on lands
allocated to public infrastructure projects;
• Fragmented transport planning and decision-making: issues, policies, projects related
to urban transport are handled at different levels by different departments in the
region. There is a lack of coherent integrated approach in planning and managing
transport infrastructure and services. Further the necessary investment is not coming
in the transport sector due to financial constraints of respective organizations. Due to
the fragmented planning and implementation of projects, urban transport (both
passenger and freight) is negatively affected.
As a direct consequence of road congestion and vehicular growth, negative externalities such
as delays, air pollution and increased fuel consumption negatively impact India’s economy,
human health and energy security. Mumbai is considered as one of the most polluted cities in
the world24. The growth of population, vehicles and industrial activity has aggravated air
pollution levels. Vehicular emissions are found to be a major source of air pollution
particularly at locations with higher traffic intensity.
Table 5: Daily fatalities in accidents in Mumbai Metropolitan Region
Year Persons killed every day
Road Rail Total
2002 5 10 15
2003 5 10 15
2004 6 13 19
2005 7 12 19
Source: (Lea, 2007)
In Mumbai, pollution from road and building construction is second only to vehicular
pollution. The effects of increase in air pollution have serious effects on health and wellbeing
of its citizens. A recent survey in May 2010 showed that deaths due to respiratory tract
infections increase by 20%25.
Official statistics (see Table 5) show increasing trend in the number of road and rail accident
fatalities over time which pose another problem to policy makers as a consequence of traffic
24
http://webcache.googleusercontent.com/search?q=cache:4qQxabgL0ucJ:www.gits4u.com/envo/envo19
.htm+10+most+polluted+mumbai&cd=6&hl=en&ct=clnk&gl=in Retrieved on 15 August 2010
25 http://www.gits4u.com/envo/envo19.htm Retrieved on 15 August 2010
TURBLOG D3.9: Urban Logistics practices – Mumbai case study 31
growth. As per 2009 statistics available from the traffic department of the Mumbai police,
there were 6,613 road accidents in which 662 people were killed. The highest number of
accidents was caused by cars in which the casualties were 105 followed by trucks which
caused 94 deaths26.
Goods transport in Mumbai is important as two major ports of the country are located in
Mumbai region and the region is well connected by rail and road with the rest of the country.
Intercity flow of goods is characterized by bulk shipment, whereas intra city movements are
characterized by smaller shipments. The increase in the urban population, urban sprawl on
the one hand and the relocation of wholesale markets and warehouses has triggered growth in
urban freight transport volume and intensity. MMR produces 110,000 tonne of freight traffic
daily, and attracts another 104,000 tonne on roads. Of this, Greater Mumbai generates about
43% and attracts 37% (Lea, 2007). Navi Mumbai, Bhiwandi and Thane regions are also
important freight traffic attraction centres. About 16% of the total freight movement
constitutes through traffic, not stopping in MMR.
The annual urban freight transport growth rate in Mumbai Metropolitan Region (MMR) is
estimated to be 5.7% which means an inflow of goods tonnage to MMR is expected to increase
from 100,000 tonnes in 2005 to 440,000 tonnes by 2031. According to (Lea, 2007), truck
terminal area requirement will need to be increased from 350 Ha in 2005 to 1450 Ha by 2031.
2.3.2 Expected urban transport problems in the future
According to MMRDA’s Mumbai Regional Plan, the city’s population is expected to grow 23
million by 2011 assuming the growth rate of 2.2% per annum. Accordingly, Mumbai’s urban
population is projected to double in the next 32 years making the problem even more
worrying. In fact, travel demand is often linked to economic growth more than population
growth. The forecasted private vehicle growth in MMR is expected to grow by 9 million by
2031, an estimated increase of approximately 4.5 times from 2005. High vehicular growth is
expected in Thane, Kalyan and Pen-Raigad areas compared to Greater Mumbai.
In the case of Mumbai, as vehicular growth is taking place even faster than population
growth, this could have serious implications on sustainability of the economic growth unless
immediate proactive steps to mitigate the existing problems are not managed well.
26 http://www.dnaindia.com/mumbai/report_mumbai-tops-in-accidental-deaths_1351819 Retrieved on
15 August 2010

TURBLOG D3.9: Urban Logistics practices – Mumbai case study 32
According to the CTS Report, the annual growth rate of goods vehicle traffic assessed from
past growth trends at 5.9% per annum. The inflow of goods tonnage of MMR is expected to
increase from 100,000 tonnes in 2005 to 4.4 million tonnes in 2031. The existing high rate of
on-street parking of goods vehicles clearly indicates the shortage of dedicated parking and
truck terminal areas in the MMR region. The CTS has therefore proposed a long term strategy
to expand truck terminal area from 350 Ha (2005) to 1450 Ha by 2031. The short term
measures proposed mainly consist of improving access roads to the terminal areas, creation of
adequate basic infrastructure in terminal areas (Lea, 2007).
The observed speeds on some of the major corridors in the study area from 1990-2005
indicate that overall speeds are decreasing with time and this trend would continue into the
future unless a combination of infrastructure capacity addition with appropriate transport
demand management measures are used.

TURBLOG D3.9: Urban Logistics practices – Mumbai case study 33
33 IINNSSTTIITTUUTTIIOONNAALL FFRRAAMMEEWWOORRKK AANNDD CCUURRRREENNTT TTRRAANNSSPPOORRTT AANNDD
LLOOGGIISSTTIICCSS PPOOLLIICCIIEESS
3.1 NATIONAL LEVEL
3.1.1 Institucional Framework At The National Level
The organisation of transport system in India is institutionally complicated. Many of the
transport sector activities are state controlled, there are other significant segments which are
almost entirely in the private sector. But, the strong and sustained thrust towards
deregulation has seen that private investment and practices are slowly entering the transport
sectors which previously were fully under Government control. The relative importance of the
state, organisation of the various transport sectors within States and the current structure of
provisioning of infrastructure, services and regulation are brought in Table 6.
The responsibility for transport is largely overseen at a Central Government level by the:
• Ministry of Road and Highways Transport for inter-city roads, highways and
expressways;
• Ministry of Urban Development for transport infrastructure development within the
cities;
• Ministry of Railways for the national and some commuter rail services;
• Ministry of Shipping for Major ports, inland waterways and shipping;
• Civil Aviation Ministry for airlines and airport.
Within each of the above Ministries, transport infrastructure planning, policy making,
investment, design, construction, regulation and enforcement functions are carried out by a
myriad of agencies and organisations (Refer Table 6).
The Indian railway system is a monolithic departmental enterprise which covers provision and
maintenance of the track network, operation of freight and passenger services and also
substantial production units for rolling stock (Raghuram 2000). Railways have been the
slowest to allow private investment and management into rail infrastructure and services.
More recently, there are plans to allow private participation to upgrade the rail network and
improve the quality of services.

TURBLOG D3.9: Urban Logistics practices – Mumbai case study 34
Table 6: Transport sector - involvement of State and private sector
Physical Basis / assets
Ownership / Control
Air Rail Road Water
Regulator (State controlled) DGCA, AAI
(State controlled) Indian Railways
(State controlled) NHAI, PWD, urban Admin., local Govts. Defence
(State controlled) GoI, State Maritime Boards, Port Directorates, TAMP
Terminals
(Partly Open) AAI, Defence, Private Consortiums
(State controlled) Indian Railways
(Open to all) SRTUs, large industries, trucking companies, etc.
(Partly Open) Major Ports, GoI, State Maritime Boards, Port Directorates, Private & captive ports, TAMP
Rolling Stock (Open to all) IA, AI, private airlines
(State controlled) Indian Railways
(Open to all) SRTUs, private vehicle owners
(Open to all) SCI27, GESCO28, ESSAR, Varun and others
Maintenance Services
Terminals (State Controlled) AAI
(State Controlled) Indian Railways, large captive industries
(Open to all) SRTUs, large industries, trucking companies
(State Controlled) Major ports, GoI. State Maritime Boards, Port Directorates, some private & captive ports
Rolling Stock / Equipment
(Open to all) IA, AI, other private airlines
(State Controlled) Indian Railways
(Open to all) Small scale garages, large workshops for SRTUs, private workshops
(Open to all) Port dry docks, ABG, Bharati Shipyards, CSL, HSL & HDPE
Operations
Terminals (Partly open) DGCA, AAI, private cos.
(State controlled) Indian Railways, large industries for captive sidings
(Open to all) SRTUs, large industries, transport companies, State warehousing corporation
(Partly open) Major ports, GoI, State Maritime Boards, Port Directorates, some private and captive ports
Rolling Stock (Open to all) IA, AI, other private airlines
(State controlled) Indian Railways
(Open to all) SRTUs, private vehicle owners
(Open to all) SCI, GESCO, ESSAR, others
Customer Services
(Open to all) IA, AI, other private airlines
(State controlled) Indian Railways
(Open to all) SRTUs, private bus operators, TCI, forwarding agents, etc.
(Open to all) Brokers, charterers, forwarding agents
Regulations
Licensing DGCA IR RTO DG Shipping
Pricing Market forces for private airlines, DGCA
Parliament, Railway Rates Tribunal
Market forces DG Shipping, TAMP, private ports
Service levels DGCA IR, Railway Claims Tribunal
Market forces DG Shipping
Source: Updated from (Raghuram 2000)
27 Shipping Corporation of India (State owned shipping company)
28 Great Eastern Shipping Company Pvt. Ltd.
TURBLOG D3.9: Urban Logistics practices – Mumbai case study 35
In sharp contrast, a large number of organisations are involved in road transport including
Central Government (for highways and expressways), State Governments (for state highways
and PMGSY29), Defence Ministry (for border roads) and large industries and contractors (for
project roads). A few city Municipalities have organised truck terminals under supervision of
the local governments.
In road services, infrastructure and terminal maintenance is vested to private concessionaires
or else to national/state or local governments. Maintenance of the rolling stock and
equipment is largely managed by a vast number of small scale garages all over the country.
The Ministry of Road Transport and Highways (MORTH), the Ministry of Urban Development,
the Rail Ministry, the Ministry of Shipping and the Civil Aviation Ministry have independently
chalked out different transport development strategies and identified areas of investment
specific to their transport sector.
The Ministry of Urban Development is responsible for formulating policies, supporting and
monitoring programmes and coordinating the activities of various Central Ministries, State
Governments and other nodal authorities related to urban development. The mandate
extends to urban transport policy making as well.
3.1.2 National Urban Transport Policy
To proactively address the issues of urban transport such as transport delays, accident risk,
deterioration of air quality and increased consumption of petroleum fuels impacting India’s
energy security, the Government of India announced a National Urban Transport Policy in
April 200630. The policy focused on the need to “move people – not vehicles”. The policy
measures were directed towards:
• Improvements in public transport and facilities for the use of non-motorised modes;
• Sought greater involvement of private sector in transport infrastructure development,
provision of public transport services;
• Innovative financing mechanisms to enhance efficiency and reduce the impact on public
budget;
• Better integration of land use and transport planning to reduce travel demand;
• Encourage the use of cleaner technologies;
29 Pradhan Mantri Gram Sadak Yojana programme to build and maintain rural roads
30 http://www.urbanindia.nic.in/policies/TransportPolicy.pdf Retrieved on 30 August 2010

TURBLOG D3.9: Urban Logistics practices – Mumbai case study 36
• Building capacity of urban transport planning at institutional level;
• Create awareness amongst people to muster support for initiatives that require tough
decision making and compromises that some people might need to make.
The NUTP acknowledges that freight traffic will grow substantially as cities, population and
economic activities expand. Timely and smooth freight movements are crucial for the well
being of the people and economic viability of the city. Amongst the policy measures proposed
are further encouraging:
• Using off peak passenger travel times to move freight;
• Earmarking late night hours for freight movements within the city and restricted
entry of heavy vehicles into cities during day time;
• Building of bypasses through public private partnerships for freight trucks enabling
such traffic to go around the city and not add to city traffic;
• All the wholesale activities are proposed to be located at the periphery of the city
along the major rail and/or highway rather than at the city centre, therefore
developing dedicated truck terminals for parking facilities for freight trucks outside
city limits through public private partnerships31;
• Parking spaces must be provided at appropriate locations on street/ off-street with
proper management and use of ITS. Appropriate parking fees should be levied to
manage the demand and reflect the cost of urban land used for the purpose;
• Planning of ring roads to relieve traffic congestion in the central area and also allow
balanced urban development. Similarly, bypass roads to be planned and
developments along such bypasses controlled to ensure that such bypasses do not
become arterial city roads in the future. All new satellite townships/ emerging
activity centres (SEZs) planned for future are either developed along defined major
transport corridors and/or integrated properly with mass transit systems in the Master
Plan itself;
• Implementation of Auto Fuel Policy approved by the Government of India in 2001 that
laid down the roadmap for tighter emission regulations up to 2010 for new vehicles
(See Table 7). Vehicles produced before the first mass emission norms in 1991 would
require to be replaced;
• Adoption of alternate fuel vehicles as an important step to clean the environment by
bringing industry into confidence and building a consensus on a roadmap indicating
31 National Urban Transport Policy

TURBLOG D3.9: Urban Logistics practices – Mumbai case study 37
strict time frames for their adoption and supply for necessary fuel supply
infrastructure (See Table 7).
Table 7: Indian Auto fuel policy 2001
Vehicle Category
Bharat Stage II (entire country)
Bharat Stage III (11 metros)
Bharat Stage III (entire country)
Bharat Stage IV (11 metros)
Commercial vehicles
1 April 2005 1 April 2005 1 April 2010 1 April 2010
2 & 3 wheelers
1 April 2005 Preferably April 2008 but not later than 1 April 2010
Passenger vehicles
1 April 2005 1 April 2005 1 April 2010 1 April 2010
Source: (Chandra 2006)
Table 8: Proposed time frame for introducing cleaner vehicles
Time Frame Technology
Short Term Ethanol, CNG, LPG
Medium Term Bio diesel, Electric vehicles, Hybrid Electric Vehicles
Long Term Hydrogen / Fuel Cell
Source: (Chandra 2006)
The Ministry of Road Transport & Highways developed a legal and regulatory framework for
inspection, maintenance and certification of in-use vehicles in the country to improve air
quality and safety on the roads. Presently, vehicular emissions are governed under Section 56
of Motor vehicle Act and Rule 62 of Central Motor Vehicle Rules for commercial vehicles. The
procedure is for the vehicle owners to get their vehicles attended at dealer/private
workshops and to offer them for inspection to the Regional Transport Department.
Certificates are issued generally after visual inspection and normally valid for one year.

TURBLOG D3.9: Urban Logistics practices – Mumbai case study 38
3.2 URBAN LEVEL (MUMBAI CITY LEVEL)
3.2.1 Institutional framework at the urban level of Mumbai City
A number of governmental organisations are involved in the urban freight and logistics sector
in the city of Mumbai for the development and management of transport infrastructure and
services in addition to the Mumbai Corporation of Greater Mumbai (MCGM). They are
tabulated in along with their main responsibilities and functions in Table 9)32.
The current legal institutional arrangements for managing urban transport (passenger and
freight together) were developed at a time when urban transport was not a major problem.
As a result, there is a high degree of fragmentation and separate enactments covering
different transport modes. There is no dedicated administrative authority in India to
administer urban freight transport. The planning and implementation of urban transport
infrastructure rests with multiple agencies which do not necessarily work in a coordinated
manner. In most cities, the goods transport is fully deregulated and fares are governed by
market forces. Roads are built and managed by local bodies or State Public Works
Department.
Table 9: Governmental Organisations involved in urban transport in Mumbai
Governmental Organisations Responsibilities / Functions
Municipal Corporation of Greater Mumbai (MCGM)
Construction & maintenance of flyovers and bridges Road up gradation Removal of obstructions, projections in and upon streets
Brihanmumbai Electric Supply & Transport Undertaking (BEST)
To provide safe, efficient, affordable and courteous passenger services at an economic fare
Mumbai Metropolitan Region Development Authority (MMRDA)
Planning & coordination of Mumbai Metropolitan region Responsible for the Mumbai Urban Transport Project
Maharashtra State Road Development Corporation (MSRDC)
Plan, investigate, design, construct, manage, promote and operate road projects & area development Invite tenders, bids, offers & contract for the above purposes
Maharashtra Maritime Board Port development in Mumbai
32http://www.mcgm.gov.in/irj/portalapps/com.mcgm.ahome_keyprojects/docs/1-
3%20Urban%20Governance%20Framework.pdf Retrieved 13 August 2010
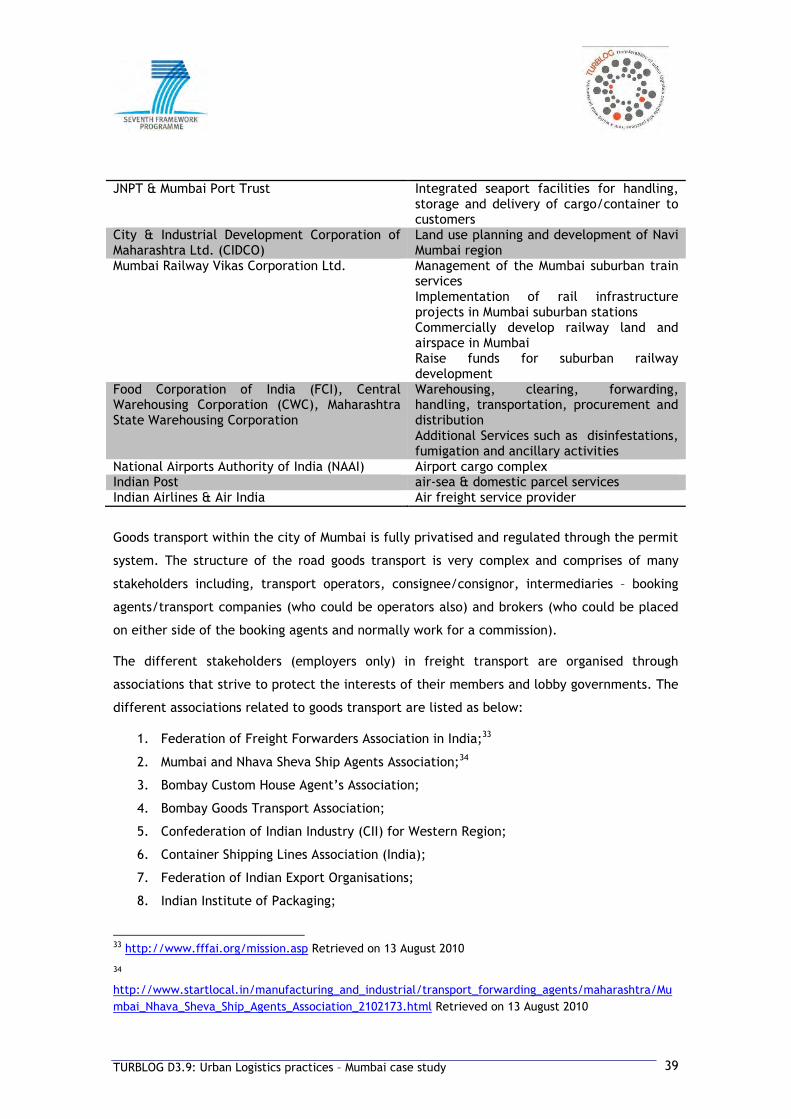
TURBLOG D3.9: Urban Logistics practices – Mumbai case study 39
JNPT & Mumbai Port Trust Integrated seaport facilities for handling, storage and delivery of cargo/container to customers
City & Industrial Development Corporation of Maharashtra Ltd. (CIDCO)
Land use planning and development of Navi Mumbai region
Mumbai Railway Vikas Corporation Ltd. Management of the Mumbai suburban train services Implementation of rail infrastructure projects in Mumbai suburban stations Commercially develop railway land and airspace in Mumbai Raise funds for suburban railway development
Food Corporation of India (FCI), Central Warehousing Corporation (CWC), Maharashtra State Warehousing Corporation
Warehousing, clearing, forwarding, handling, transportation, procurement and distribution Additional Services such as disinfestations, fumigation and ancillary activities
National Airports Authority of India (NAAI) Airport cargo complex Indian Post air-sea & domestic parcel services Indian Airlines & Air India Air freight service provider
Goods transport within the city of Mumbai is fully privatised and regulated through the permit
system. The structure of the road goods transport is very complex and comprises of many
stakeholders including, transport operators, consignee/consignor, intermediaries – booking
agents/transport companies (who could be operators also) and brokers (who could be placed
on either side of the booking agents and normally work for a commission).
The different stakeholders (employers only) in freight transport are organised through
associations that strive to protect the interests of their members and lobby governments. The
different associations related to goods transport are listed as below:
1. Federation of Freight Forwarders Association in India;33
2. Mumbai and Nhava Sheva Ship Agents Association;34
3. Bombay Custom House Agent’s Association;
4. Bombay Goods Transport Association;
5. Confederation of Indian Industry (CII) for Western Region;
6. Container Shipping Lines Association (India);
7. Federation of Indian Export Organisations;
8. Indian Institute of Packaging;
33 http://www.fffai.org/mission.asp Retrieved on 13 August 2010
34
http://www.startlocal.in/manufacturing_and_industrial/transport_forwarding_agents/maharashtra/Mu
mbai_Nhava_Sheva_Ship_Agents_Association_2102173.html Retrieved on 13 August 2010

TURBLOG D3.9: Urban Logistics practices – Mumbai case study 40
9. Maharashtra Chamber of Commerce & Industry;
10. Western India Automobile Association;35
11. Indian Freight Club;
12. Air Cargo Agents Association of India;
13. All India Confederation of Goods Vehicles Owners Association (AIGVOA).
Trade and labour Unions in the interests of the employees in the urban transport sector and
employees in the industry are as follows:
1. All India Motor Transport Union;
2. BEST Pariwahan Karmachari Sangh;
3. Union Clearing Services;
4. Transport and Dock Workers Union;
5. BEST Workers Union;
6. Motormen’s Union (Mumbai Suburban railways).
The users of road freight transport are the manufacturers, distributors, retailers of goods and
the general public who are typically expected to represent the demand side of the market.
Operators are expected to provide the services in terms of movement (Sriraman et al. 2006).
The intermediaries seem to play a significant role in the provision of road goods transport
services. These can be normally of two categories: (1) Booking agents/Transport
companies/transport contractors and (2) Brokers / Commission agents/ Suppliers of Vehicles.
Booking agents are firms or persons who accept and store goods, both parcels and bulk and
arrange for their movement through operators. This agent acts as the owner of the cargo i.e.
he negotiates with and on behalf of the users (Sriraman et al. 2006). His responsibility is to
collect and distribute goods carried by goods carriages. He is also responsible for cargo loss
and damage claims while performing other customer service functions. In some cases, the
agents employ their own trucks and function as operators. In addition, agents also advance
money to operators (especially small ones) to help meet their working capital requirements
and by discounting bills on unloading.
A Broker normally represents the supply side i.e. the truck operators and is sought out by
truck operators for loads, though some have also represented user interests for a commission.
The broker takes a commission from the truck owners and ensures the supply of trucks to the
transport company/booking agent (Sriraman et al. 2006). Given that the dependence on small
35http://www.maharashtradirectory.com/industrialresources/manufacturers-associations-mumbai.htm
Retrieved on 13 August 2010

TURBLOG D3.9: Urban Logistics practices – Mumbai case study 41
operators is significant, the broker ensures reliability of the operators (e.g. the movement
etc. for the user). Large fleet operators depend on these brokers for moving a certain volume
of traffic over and above what their own fleet would permit.
Surveys conducted by (Sriraman et al. 2006) found that there are three areas from which
most of the intermediaries operate. A significant location is the Masjid Bunder/ Wadi Bunder/
P. D’Mello (city) area. This has traditionally been the area of their operations especially till
the last decade, since only limited movement of trucks in the city (due to time restrictions)
have been permitted. With the shifting of some of the major wholesale markets to the New
Mumbai area and emergence of warehousing facilities in New Mumbai, Bhiwandi and Wadala,
intermediaries have begun operating from these three areas as well. Though the market in
the city area (in terms of intermediaries) is still significant at present, they are gradually
relocating to the new warehousing facilities in the Mumbai suburbs.
It is estimated that there are around 5,000 booking agents/ transport companies operating in
the Mumbai region (Sriraman et al. 2006). About 1,200 of these are formally associated with
the Bombay Goods Transport Association (BGTA) as members.
3.2.2 Mumbai’s Urban Transport Policy
One of the big challenges of achieving the objectives of National Urban Transport Policy is
controlling urban expansion and integrating city development plans with transportation plans.
To ensure this the Jawaharlal National Urban Renewal Mission (JNNURM) for each city was
established to consolidate fragmented programmes and schemes under one umbrella. The
JNNURM requires cities to prepare a Comprehensive City Development Plan (CDP) as a vision
document before it is able to access funding from JNNURM (Chandra 2006). The CDP is
required to include a broad city investment plan that enlists priority projects for the city.
From CDPs received from the different cities in India, it was observed that the transport
projects in many cities were more of a compilation of requirements of individual
agencies/departments within the city administration and lacked an overall transport or
mobility plan. This showed the continuance of multiple fragmented decision making
departments for urban transport planning and the absence of a single agency responsible for
this (Chandra 2006). Road and bridge projects were proposed by public works departments or
State road development corporations, bus transport systems by transport departments and
metro rail systems by urban development departments.
MMRDA with the assistance of World Bank under the Mumbai Urban Transport Project initiated
a Comprehensive Transportation Study for Mumbai Metropolitan Region. M/S LEA International
TURBLOG D3.9: Urban Logistics practices – Mumbai case study 42
Ltd. Canada in joint venture with LEA Associates South Asia Pvt. Ltd. was appointed by
MMRDA to carry out the study on January 2005. The main objectives of the study are to
identify travel and transport patterns of residents in Mumbai and recommend long term
comprehensive transportation strategy for MMRDA up to 2031.
According to the Comprehensive Transportation Study prepared by Lea Associates Pvt. Ltd.
for Mumbai Metropolitan Region (Lea, 2007), the vision is to transform Mumbai city into a
world class city in the next 10-15 years through a phased manner. In the Study urban freight
transport specific goals have been identified to:
• To facilitate and promote economic growth of the Region;
• To minimize adverse environmental impacts that may occur in the process of
economic growth;
• To improve efficiency of existing methods of resource mobilization;
• To adopt innovative methods of resource mobilization and facilitate, attract and
guide private investment in desired directions;
• To consider and evaluate significantly different strategies in the long term for
development of the Mumbai region;
• To support the goal of transforming Mumbai into a world class city with a vibrant
economy and a globally comparable quality of life.
The vision for the next 15 years will be reflected in the investment programme that will be
implemented in a phased and time bound manner.

TURBLOG D3.9: Urban Logistics practices – Mumbai case study 43
44 MMEEAASSUURREESS UUSSEEDD IINN MMUUMMBBAAII CCIITTYY
4.1 INTRODUCTION
Long term transport strategy has been proposed for Mumbai Metropolitan Region based on a
detailed travel demand analysis conducted for the Comprehensive Transportation Study.
Upgrading road network, development of goods terminals and traffic engineering measures
such as flyovers, Road Over Bridges, Road Under Bridges, truck parking areas, traffic
markings, road traffic controls etc. have been the dominant strategies so far; although other
alternative strategies have been envisaged such as further capacity expansion and multimodal
transfer facilities for seamless movement of goods from one mode to the other have been
proposed and work on these projects are at different phases of implementation.
4.2 MEASURES USED IN MUMBAI CITY
Measures used in Mumbai for alleviation of traffic congestion have been a mix of land use
policy measures, development of new urban transport infrastructure and expansion of the
existing urban transport infrastructure network. These measures are categorised according to
its type and are briefly reviewed below:
1. Interventions for loading / unloading:
• Development of truck terminals, truck parking lots
Orderly planning for the expansion and location of truck terminals forms an important
objective in planning the transport system in Mumbai under the CTS Report. Based on the
detailed analysis of goods vehicle movements, new truck terminals have been proposed.
Approximately 44 major truck terminals have been identified in the study area. Five major
truck terminals and 10 mini truck terminals are proposed to be developed by 2031 taking into
consideration the expected Dedicated Rail Freight Corridor (DRFC), which is expected to
reduce delays occurring due to inter-mixing of port related and city traffic. These are
identified as follows:
• On Dedicated Rail Freight Corridor (DRFC), near boundary of MMR on NH-8 (Mumbai-
Ahmedabad);
• On DRFC, near Taloja Industrial area;
• Near JN Port Trust;

TURBLOG D3.9: Urban Logistics practices – Mumbai case study 44
• Near the proposed international airport in New Mumbai;
• Near intersection of NH3 (Mumbai-Nashik Road) and DRFC.
The Wadala Truck Terminal is developed by MMRDA on 115 hectares of land, to move the
existing freight distribution centre from the Masjid Bunder area. The basic objective of
developing the Truck Terminal is to decongest South Mumbai by shifting the existing transport
companies offices and go downs, which are today concentrated in B&C Wards in South
Mumbai causing severe traffic congestion. It will also help to rationalize the movement of
truck traffic on the city roads. This is designed for a capacity of 3,000 trucks at a time with
all infrastructure facilities like offices and go downs of transport companies,
loading/unloading facilities, parking and idle trucks, banks, restaurants, dormitories, etc. The
truck terminal will have free access to Eastern Express Highway and Anik-Panjarpol link,
which forms the part of East Island Freeway. As economic activities gradually move north
from the island city, the potential advantage of Wadala Truck Terminal in terms of its
location will improve efficiency of freight distribution.
• Shifting of wholesale markets
In the 1990s a number of wholesale markets shifted from the South Mumbai to the New
Mumbai area in order to relieve the traffic from the congested south part of the city36. To
encourage relocation, MMRDA extended loan facilities for shifting the wholesale markets for
building construction, construction of wholesale market blocks, shops-cum-godowns, surfacing
of internal roads in the market yard, construction of well equipped central facility building
for the wholesale fruit and vegetable markets, etc. Shifting of wholesale textile markets from
South Mumbai to Bandra-Kurla Complex is under consideration.
• Restrictions on freight vehicles
Time and route restrictions on freight vehicles have been the preferred policy measures to
relieve congestion on city roads in India. In the case of Mumbai city, restrictions on hourly
and weekly periods of vehicle movements are regulated by the Mumbai traffic police. Mumbai
traffic police issue traffic restrictions and enforce it in the city of Mumbai. The Traffic
Control Branch regularly issues notifications to denote no parking areas on heavy vehicular
movement, animal driven vehicles, handcarts, bicycles and others37.
2. Emerging (actualised) concepts: 36 http://www.mmrdamumbai.org/projects_swm.htm Retrieved on 11 August 2010
37 http://www.trafficpolicemumbai.org/Notifications.htm Retrieved on 11 August 2010

TURBLOG D3.9: Urban Logistics practices – Mumbai case study 45
• Demand management and road user charges
Traffic restrictions scheme based on number plates has been implemented for regulating
entry/exit to the Mumbai Metropolitan area. According to the scheme, vehicles with plates
ending with 1 & 2 would be bared entry into Mumbai on Mondays. Those with number plates
having the last digits 3 & 4 would not be allowed on Tuesdays, 5 & 6 on Wednesdays and, 7 &
8 on Thursdays and 9 & 0 on Fridays. Government and police cars, ambulances and emergency
vehicles would be exempt from the ban.
• Improvement of existing public transportation, network and fleet
Mumbai’s suburban railway system is used for passenger as well as freight movements for
intra-urban transport. For each suburban train at least 3 rakes are dedicated for goods
transport. To improve the suburban rail system the Mumbai Urban Transport Project (MUTP I
& II) was developed as per recommendations of the Comprehensive Transportation Study and
covers road and rail components. The thrust is to improve suburban rail system by adding rail
capacity along western and central lines and completing two key east-west road links. The
MUTP I (also called Bombay Urban Transport Project) concentrated mainly on improving the
bus transport system in Mumbai operated by the BEST by procuring buses, construction of
flyovers, installation of traffic signals etc. The MUTP I project was completed in 2008 and
MUTP II has been formulated by Mumbai Rail Vikas Corporation to further improve suburban
rail system. MUTP envisages investment in suburban railway projects, local bus transport, new
roads, bridges, pedestrian subways and traffic management activities. The second phase
involves further optimisation of western and central lines and will take another 2-3 years. The
total project cost is estimated to be Rs. 3,700 crore and is awaiting clearance from the
Ministry of Railways, Government of India.
• Development of all north-south & east-west arterial roads and missing links
To reduce detour of freight and passenger movements in the Mumbai Metropolitan Region, 3
major road infrastructure projects are underway to develop the main arterial roads and
missing links. They are:
a) Mumbai Urban Infrastructure Project (MUIP) to augment east west connectivity and
strengthening the north-south corridors by developing 17 high speed signal free
corridor with dedicated bus lanes on north-south and east-west links. It will focus on
improving the station areas. The project is ongoing with different components
implemented by MCGM, MMRDA and MSRDC costing Rs. 2,648 crores;
TURBLOG D3.9: Urban Logistics practices – Mumbai case study 46
b) Mumbai Trans-Harbour Sea Link Project (Sewree to Nhava) to improve connectivity
between the island city and mainland by building a 22 km long six lane bridge through
to facilitate economic development in Mumbai Metropolitan region;
c) Development of Western Sea link is to develop additional north-south corridor on the
western flank of the city via 4 km long sea bridge from Western Express Highway to
Worli Sea face. A North-South link connecting Worli end of Bandra-Worli sea link is
now under construction to Nariman Point with a dispersal link connecting Cuffe
Parade. The alignment runs a major sea bridge of 14 km abutting the western shore
line.
• Development of freeways around Mumbai and connecting with the hinterland
In order to reduce congestion on the western corridor between Bandra and Nariman Point, the
Western Freeway (Worli – Nariman Point) is planned to be constructed via a 13.75 km sealink
upto Priyadarshini park combined with a tunnel under the Malabar Hill.
All the above infrastructure projects are implemented under the JNNURM scheme under a
Public Private Partnership basis framework. These projects were evolved in line with the
overall transport strategy for MMRDA of improving North-South and East-West connectivity by
provision of better road and rail networks as well as improving public transport system.

TURBLOG D3.9: Urban Logistics practices – Mumbai case study 47
55 SSEELLEECCTTEEDD GGOOOODD PPRRAACCTTIICCEE
5.1 INTRODUCTION
Mumbai Dabbawalas (also spelt as dabbawallas or dabbahwallahs) or tiffinwalas are used as
the best practice case study for this deliverable. The Mumbai dabbawallas operations are
widely recognised as an outstanding example of excellence in urban logistics (Balakrishnan &
Teo 2004) (Jampani & Dutta 2004). Reportedly their mistake rate is just 1 in 16 million
deliveries (i.e. 99.999999% accuracy) which caused the Forbes Global magazine to award this
service the six sigma performance rating in 2001 (Mallik & Mukherjee 2007). Besides the
accuracy rating, the Dabbawala supply chain system has also attracted interests from global
educational institutions and think tanks for its complexity38.
A dabbawala (meaning one who carries the box), is a person in Mumbai whose job is to carry
and deliver freshly made food packed in lunch boxes from home to office workers. This case
study was selected because the lunch delivery supply chain has become famous for their
precision and efficiency.
The case study is about food distribution logistics employing public transportation system
(suburban railways) that is unique in Mumbai city. It is an indigenous model, conceived,
developed and perfected by a group of individuals who have very little or no formal education
in the area of logistics.
This section provides a detailed analysis of the content and decisions made by the Mumbai
dabbawalas in managing the system effectively.
38 Berkeley University in California teaches the logistic system of Dabbawalas as a case study in one of
their business management programs and many Indian business schools and industry associations have
the Dabbawala logistics system in their case-study agenda. In 1998 two Dutch filmmakers, Jascha De
Wilde and Chris Relleke, made a documentary called "Dabbawalas, Mumbai's unique lunch service" and in
2001, the Christian Science Monitor, the Boston-based newspaper, covered the Dabbawalas in an article
called "Fastest Food: It's Big Mac vs. Bombay's Dabbawalas" The British Broadcasting Corporation and the
Australian Broadcasting Corporation have done features on the delivery system as well, while Prince
Charles was so impressed with their service that he had even invited a few Dabbawalas to his wedding
with Camilla Parker in London.

TURBLOG D3.9: Urban Logistics practices – Mumbai case study 48
5.2 THE DABBAWALAS OF MUMBAI
The measure is a case study of the dabbawalas or tiffin carriers of Mumbai. The logistics
business thrives on the Mumbai employees whose needs are to get a home cooked meal
respecting their culture and tastes.
The delivery of the lunch boxes is an excellent case study that showcases excellence achieved
in the informal sector, whose actors are proud of their rural roots and with the use of low
technology and effective organisation. The case study presents a private logistics service
organised in the informal sector and does not constitute any policy measure.
The dabbawala operations originated way back in 1890 when India was under British rule
(Mallik & Mukherjee 2007). At that time, people migrated for work to Mumbai from different
states and belonging to different communities. At working places there were no canteens and
many did not bring their lunches from home. Besides, different communities had different
food habits, tastes and preferences which could only be satisfied by a homemade meal.
Identifying this need, a gentleman named Mr. Mahadeo Medge started this lunch delivery
service (Jampani & Dutta 2004).
The Mumbai dabbawala operations are confined to Mumbai. The services include collection,
transportation and delivery of lunch boxes from home to office location in the morning. In the
evening the lunch boxes are moved in the reverse direction. A total number of 200,000 lunch
boxes i.e. 400,000 transactions are carried out per day on all working days throughout the
year. These services are available six days a week i.e. on 25 working days in a month. There
is no disruption to work as long as the Mumbai suburban rail network is functional.
The Mumbai Dabbawala system is organized as a co-operative movement, where the basic
entity is the dabbawala. Upto 8 dabbawalas makes up a team. Upto 8 of such teams would
form a group. There are 120 groups that together constitute the entire organization (Mallik &
Mukherjee 2007). The basic model of the selected good practice heavily depends on
teamwork and meticulous timing.
There are around 5,000 dabbawalas in the system at any moment of time. Each dabbawala is
assigned upto 30 customers in a specific geographical area. Each dabbawala visits his
customers for tiffin box collection using a fixed route by bicycle or walking. The household is
expected to keep the lunchbox ready when the dabbawala reports for collection, which is
usually between 7.00 am and 9.00 am (Ravichandran 2005). If the lunch is not ready the
dabbawala will leave for the next destination. After collecting approximately 30 of such lunch
boxes they are brought to the nearest suburban railway station for sorting and onward
transportation.
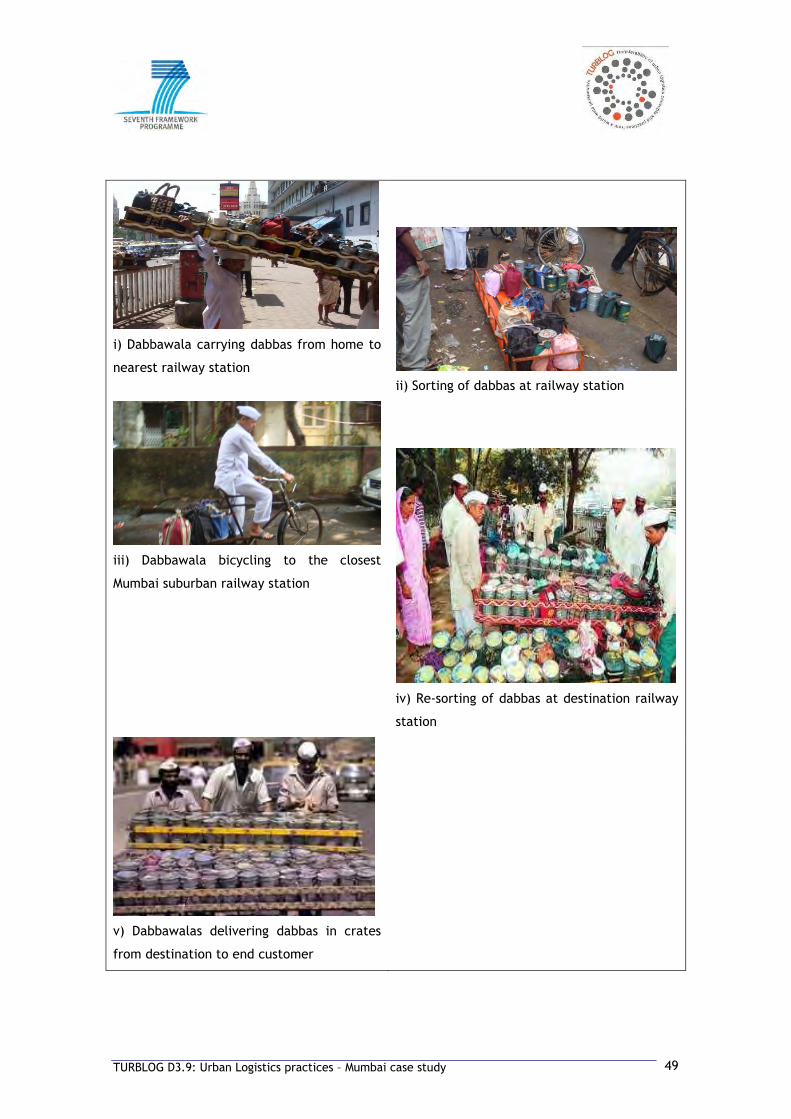
TURBLOG D3.9: Urban Logistics practices – Mumbai case study 49
i) Dabbawala carrying dabbas from home to
nearest railway station
ii) Sorting of dabbas at railway station
iii) Dabbawala bicycling to the closest
Mumbai suburban railway station
iv) Re-sorting of dabbas at destination railway
station
v) Dabbawalas delivering dabbas in crates
from destination to end customer

TURBLOG D3.9: Urban Logistics practices – Mumbai case study 50
Usually more than one team of dabbawalas operate out of a collection point in a railway
station.
At the originating railway station a team of designated dabbawalas sorts the lunch boxes
according to their destinations. The dabbas have a detailed and elaborate codification system
that facilitates the sorting process. The codification system clearly identifies the origin of the
lunch box, associated collection team member, destination, corresponding team leader,
destination, location, building identification and floor number (Unnithan 2001).
The dabbas are sorted based on the coding system at the closest origin railway station and
bundled into groups for origin to hub transfer using the Mumbai suburban rail services. The
origin to hub transfer normally happens in designated carts. These carts are loaded into pre-
determined compartments in the beginning or at the end of the train.
At the destination railway station, the dabbas are re-sorted based on final destination
(location, building and floor).The sorting and loading operations need care and are time
bound. The lunch boxes arrive at the destination railway stations by 11:30 am.
At each destination station, boxes are handed over to local dabbawalas (the last link in the
chain), who deliver them to the end customer at their office locations in time for lunch hour
by designated members. All dabbas are delivered before 1.00 pm.
The empty boxes after lunch are again collected at the destination railway station and sorted
to the respective origin location, placed on standard carts, loaded on trains and unloaded at
the respective origin stations by designated members. The dabbas are then finally taken to
individual households by the same dabbawala who collected them in the morning.
Usually, by 5.30 pm all dabbas are delivered to households and the dabbawalas retire for the
day.
To better understand the complex sorting process, let's take an example. At Vile Parle
Station, assume there are 20 teams of dabbawalas, each having 5 members and each member
servicing 30 customers. That makes 3,000 tiffins in all. These 3,000 tiffins are collected by
9.00 am, reach the station and are sorted according to their destinations by 10.00 am when
the 'dabbawala special' train arrives. The railway provides sorting areas on platforms as well
as special compartments on trains travelling south between 10.00 am and 11.30 am. During
the journey, these dabbawalas regroup according to the number of Tiffin’s to be delivered in
a particular area, and not according to the groups they actually belong to. If 150 Tiffin’s are
to be delivered in the Grant Road Station area, then 5 dabbawalas wait at that station,
keeping in mind one person can carry no more than 30 tiffins.
During the first sorting process, each dabbawala would have concentrated on locating only
those 30 tiffins under his charge, wherever they come from, and this specialization makes the
entire system efficient and almost error-free. Typically it takes about ten to fifteen minutes

TURBLOG D3.9: Urban Logistics practices – Mumbai case study 51
to search, assemble and arrange 40 Tiffin’s onto a crate, and by 12.30 am they are delivered
to offices.
Coding System
Most of the dabbawalas have migrated from villages to Mumbai in search of jobs. Due to
economic hardship or lack of interest a majority of them have been educated up to primary
school level. Hence, the dabbawala delivery system has adapted the coding system
accordingly. Instead of technological solutions, the coding system is based on the exchanges
of dabbas between dabbawalas. The system uses unique codes for the railway stations,
origin/destination points and identity of the dabbawalas handling each dabba. For this, signs,
different colours, numbers and a few letters are used and same is clearly marked on each
dabba.
Figure 9: Coding system framework used by the Dabbawalas39
The codification system ensures complete traceability of lunch boxes in the system. It enables
material flow and tracking of individual boxes by detailed information which integrates the
knowledge and information of individual dabbawalas on route, origin, handling agent,
destination address, etc. The “address” of the customer is painted on the top by the
dabbawalas. The home address is not marked since the dabbawala knows by heart to which
places in his collecting area he has to pick up his dabbas. If a new customer appears in his
own collecting area, he will do the complete journey to check the address of delivery in order
to fix with the other dabbawalas in which manner it will be then delivered. He will have to
find who, on the way, will have a free place in his freight to take one more tiffin box up to
which place, and so on up to the very place of delivery. Once the chain has been established,
with all the necessary stops for exchange decided, it is possible to mark the address.
39 http://www.typocity.com/icon.htm Retrieved on 15 September 2010

TURBLOG D3.9: Urban Logistics practices – Mumbai case study 52
Figure 9 depicts a sample set of codes that are marked on a 'dabba' that help to identify the
origin and destination points, help different groups of dabbawalas to identify their set of
'dabbas' at each leg of the journey and help sort the 'dabbas' at each juncture before they
make the onward journey. Since many 'dabbawallas' are illiterate, the coding system is
decided arbitrarily by the dabbawalas and known to all of them.
W1
W2
W3
W – WORK AREAS
Figure 10: Dabbawala logistics activity chart: home to work
5.3 STAKEHOLDERS
The dabbawalas’ service is a monopoly in the Mumbai Metropolitan Region. Six stakeholders
are identified that are directly involved in the provision of the dabbawala logistics system

TURBLOG D3.9: Urban Logistics practices – Mumbai case study 53
(see Table 10). The main clientele for the lunch box service as explained above are office
going employees in the city of Mumbai (Pathak 2010). Their needs are to receive fresh food
from home at reasonably cheap costs on a regular, reliable and fast service such that the food
is at least warm when they consume it. These constitute the main requirement of the
customers.
As seen typically in the informal sector the dabbawala service does not make formal contracts
with its clientele. The whole system relies on trust. When the dabba delivery service is
commenced, service charges for a full month are collected in advance. Subsequently, money
is collected in the first week of every month and remitted to the muqaddam on the first
Sunday (Quien 1997). The range of customers includes students (both college and school),
entrepreneurs of small businesses, managers, especially bank staff, and mill workers. They
generally tend to be middle-class citizens who, for economy reasons, hygiene, caste, dietary
restrictions or simply because they prefer wholesome food, rely on the dabbawala to deliver a
home cooked mid-day meal (Quien 1997). New customers are generally acquired through
referrals. Some are solicited by dabbawalas on railway platforms. Addresses are passed on to
the dabbawala operating in the specific area, who then visits the customer to finalize
arrangements.
Table 10: Stakeholders directly involved in the Mumbai dabbawala logistics system
Parties/stakeholders Functions
Working people in Mumbai
Clients (receivers) of the dabbawala service
Family members of the working people Suppliers of filled lunch boxes for delivery to family member in CBD area
Canteens / catering services Suppliers of filled lunch boxes if home cooked food is not available
Employees of the dabbawala system Executing the dabbawala logistics service
Railway services The suburban Railway services are used to transport the tiffin boxes
Product manufacturers, service providers, retailers, etc.
Marketing of their products through the dabbawalas. Some are also customers of the service
Suppliers of the filled tiffin boxes i.e. family members of the working people in Mumbai
support the dabbawala in meeting no delays in delivering lunch boxes. While the end
customers, i.e. working people in Mumbai accept delivery at the ground floor level of their
workplaces at destination locations.
TURBLOG D3.9: Urban Logistics practices – Mumbai case study 54
Canteens or catering service providers that cater to specific tastes are also hired to offer
value added services in the distribution system. When a customer to the dabbawala service is
unable to arrange home cooked food, he could opt for a canteen/catering service. The
canteens prepare wholesome food, pack them in the standard tiffin boxes at the appropriate
time and deliver it to the dabbawala who will then ensure it reaches the end customer. Of
course, the charges of this value added service also include the costs of the catering services.
It is not clear whether the dabbawalas receive a commission for employing a particular
canteen service.
The collection of the filled lunch boxes at the homes or canteens have to be ready at the
prescribed time assigned by the dabbawalas. When the dabbawala knocks the door, the tiffin
box should be ready. If not, then for 2-3 days the time is given to the customer to adjust for
punctuality (Pandit 2007). After that if the delay persists, the services are stopped as it
affects the services to other customers in the logistics chain. In this way, the system ensures
that bad customers are discouraged by which the service efficiency, operation and
profitability from existing customers is maintained.
The members of the dabbawala service system are delighted to work for the Trust as they are
supported by empowerment, compensation and a lifelong economic activity in the informal
sector which is uncommon in other professions atleast in the informal employment sector.
The suburban Railway services are employed for the main haulage of the tiffins. Every
dabbawala buys a railway pass which allows them to make unlimited trips on designated
routes for a period of time. The commuting passengers in suburban trains are generally
tolerant to the inconveniences caused to them by the dabbawalas activities in the
overcrowded, overstretched suburban rail transport services.
The dabbwala service is also used to market consumer products and services selectively to its
potential clientele. Realising the potential and reach of the dabbawalas several brands have
tied up with them to reach out to consumers. For example, the most recent promotion is the
one of confectionery company, Perfetti Van Melle India (PVMI). The company recently
distributed its newly launched liquid-filled, mango-flavoured candy, Mangofillz with each
tiffin box sent out. This is the first fruit candy from PVMI, as the other products are milk-
based or breath-fresheners and gums40.
40 http://www.afaqs.com/perl/news/story.html?sid=26629) retrieved on 17 August 2010
TURBLOG D3.9: Urban Logistics practices – Mumbai case study 55
5.4 PRODUCT AND/OR SERVICE INVOLVED
The Mumbai dabbawala system is designed to collect, transport and distribute lunch boxes
routinely to its customers every working day (Mallik & Mukherjee 2007). The service not only
provides clean home food but it also delivers it safely against theft and pilferage. As bringing
home cooked food is the main service provided by the dabbawala system, the characteristics
of the goods and service requirements can be characterised as follows:
• Perishability – Home cooked food needs to be supplied within a short period of time
(typically 2-3 hours) and on time so as to ensure non-perishability of the food items at
the time of delivery;
• Size & easiness of handling – The Tiffin box in which the food is kept is typically made
of aluminium or stainless steel in which there are 4 compartment in order to keep
different kinds of food items separated. The outer container is typically of particular
size and water tight, which simplifies the transport and handling of dabbas with
relative ease even in tough metropolitan conditions like busy road traffic and
congested urban rail systems experienced typically in Mumbai;
• Special conditions - Adverse weather conditions like extreme heat or heavy rainfall
may delay the delivery and to a certain extent there might be special problems like
vehicles/rail accidents;
• Fragility - The dabbas used by the dabbawalas are made of aluminium casing and
therefore the food within is compactly arranged within a compartmentalised lunch
box. Even so, it needs to be ensured that the dabbas are not dropped or overturned
as the food may get mixed.
The efficiency of the dabbawalas ensures complete customer satisfaction as there is no delay.
The service is continuously innovated by offering new services, while riding on their core
strength of on-time and reliable delivery services. A few examples of their innovation are
introducing a new express delivery service (pick-up at 11am), linking with groups of
housewives to cook and supply dabbas for customers who prefer home-cooked food, work
with marketing agents and media houses to physically distribute promotional items, along
with the dabbas, to the offices or residences of their customers (Pathak 2010). The standard
dabbas used for the meal delivery have slowly given way to more elaborate and colourful
packaging, and the system has cleverly evolved to accommodate the request of customers
who want their meals to be delivered to them in a fancy and “appetizing” manner (Percot
2005).

TURBLOG D3.9: Urban Logistics practices – Mumbai case study 56
5.5 FINANCIAL ASPECTS
Each customer of the dabbawala system is charged between Rs. 400 to Rs. 700 per tiffin per
month for the service depending on customer requirements, transport distances and
economic condition of the customer. Customised offerings (larger lunch box, special diet
requirements, etc.) are charged separately. The customer only needs to invest upfront, a
token sum to purchase the tiffin box to store the meals. Further negotiation of the price and
collection timings will be done between the customer and team leader. Generally, lower
income customers are charged lesser than others. It is up to the team leader to decide on the
final rates based on his judgement and consideration of the economic status of the customer.
The main cost items are wages, rail passes and rail freight charges. The members use the rail
network which charges Rs. 100 per crate and Rs. 180 per member per month. Each member is
paid a reasonable compensation of between Rs. 5,000 to Rs. 7,000 per month net wages after
meeting all expenses like railway monthly passes and capital costs incurred for purchase of
carts, crates and bicycles. The exact wages for each dabbawala varies according to the total
customers serviced, services provided and total origin-destination distance.
There are no large investments in the services of the dabbawala delivery system, since it is
primarily a labour intensive service. When a member is recruited he is obliged to buy his own
uniform and purchase a bicycle for himself. The bicycle is used by the member himself for
pickup and delivery. All these contribute to low operational costs and hence a reasonable
price for the end customer.
New recruits are initially hired on a salary. After evaluating their performance they are
offered membership (shareholders) of the trust and assigned to one of the groups by the
member who introduced him to the group. Each dabbawala is guaranteed a monthly income
and employment for life. As there is no retirement age, he may work as long as he is
physically fit. Each team is financially independent and serves its own customers without
hampering the interests of the others, but work together in the delivery process.
Each member pays Rs. 15 per month as contribution to the welfare fund which acts as an
insurance cover. The association provides various services to its members from this welfare
fund, including loan facilities for emergencies, education expenses for members’ children,
health care, etc. The balance of the savings goes to a charitable trust.
Other sources of revenue come from marketing. Realising the large customer base to which
the dabbawalas are in direct contact with, a number of business enterprises use the
dabbawalas to market their products and services by sending flyers to the end customers
through the dabbawalas. Donations from philanthropic institutions and fees received from
public speaking and presentations also constitute other revenue sources. A quarter of the

TURBLOG D3.9: Urban Logistics practices – Mumbai case study 57
total revenues received from marketing activities go the Trust, while the rest are equally
distributed amongst all the dabbawalas.
5.6 TRANSFERABILITY POTENTIAL OF THE SELECTED GOOD PRACTICE
This section explores the potential transferability of the business model of the dabbawala
system to other cities and other companies. The following conditions are identified as unique
to the Mumbai dabbawala system which has sustained the service for so many years:
• Topography: The Dabbawala service has evolved in the context of Mumbai city whose
topography is linear. At the origin it is dispersed over a large area. At the destination it is
concentrated on a small geographical area. The traffic pattern is characterized by low
volume spread over a large area to high volume spread over a small area. The linear
geographic dimensions such as seen in Mumbai city is an important factor when considering
transferability of this particular service;
• Flexible infrastructure: The main mode of transportation employed in the dabbawala
logistics service is the regular and reliable public transportation system in the city i.e. the
suburban railway system. The entire operational area serviced by the Dabbawalas is
connected by a well developed rail infrastructure;
• Inexpensive public transportation system: Mumbai suburban rail services are inexpensively
priced. This keeps the cost low and hence affordable price to the customers. Lower price
induces volume and scale economies;
• Culture: Mumbai is a very cosmopolitan city where people with diverse cultures,
backgrounds and food habits migrated. The diversity of food habits makes it impossible for
local restaurants, canteens or fast food centres to fulfil specific tastes and needs of each
employee in a same place.
A lot of Indians employing the tiffin box service feel that getting home cooked food in the
office is a link between work and home that a lot of dabbawalas’ customers express as a
heartening feeling. A lot of people in the workplace insist that it is stressful to adjust to
other people (Percot 2005). In addition stressful and long hours of work coupled with long
travel in congested traffic conditions are a norm which induces fatigue. A lot of employees
feel that they have insufficient time to spend with their families and rest at home. For
them the delivery of lunch boxes and eating home cooked food forms a bonding with their
home and family members. Eventually some consider that hiring a dabbawala is also a
question of status. Mumbai people agree that nothing is better than home food as there is
no pleasure or dignity to eat standing in front of everybody;

TURBLOG D3.9: Urban Logistics practices – Mumbai case study 58
• Service characteristics: The dabbawala service caters to the most basic and perpetual
demand of delivering home prepared ethnic food to Indian middle income executives
working in Mumbai. This market segment is expected to exist for a long time to come. The
only threat to its existence is the changing food habits of the customers, but this is surely
expected to be slow;
• Density and relative locations of the origin-destination: The distribution of the origin and
destination points plays an important role in the selection of a delivery system. Figure 11
shows 3 typical delivery organizations ideally suited for each of the spatial distribution of
origin-destination pairs.
Figure 11: Scarcity/Density of Origins/Destinations affects the choice of delivery
organization
Source: (Balakrishnan & Teo 2004)
In the postal delivery system, the origins and destinations are well spaced out within the
region. In such systems a hub and spoke system is typically employed. In Warehouse retailer
delivery systems, goods from the central warehouse need to be delivered to retailers spread
over the region wherein a zoning system is typically used. In this customers are grouped into
zones, each served by a sub-delivery unit. In the meal delivery system in Mumbai, origins are
spread out over a region with 70% of destinations clustered near a central area.
After considering the factors favourable to Dabbawala services, the following part explores
conditions for transferability of this best practice to other urban logistics operations:
Efficient and cheap (public) transport system:

TURBLOG D3.9: Urban Logistics practices – Mumbai case study 59
The city needs to have an efficient and reliable (public) transportation system as its
backbone. An appropriately extensive network of the (public) transport system along with an
inexpensive charging system is a prerequisite to develop similar logistics services in other
cities.
Homogenous, regular and perpetual demand:
For transferring this best practice to the movement of other products, the product’s service
demand requires to be regular and perpetual (such as food for customers). Moreover
packaging of the product preferably needs to be homogeneous or standardized and handy for
efficient stacking in larger crates/containers as well as for fast loading/unloading movement.
Adaptation to local conditions:
The practicability of employing best practices from other case studies to one’s own logistics
services needs to be thoroughly analysed and local constraints and advantages have to be
leveraged in an innovative way.
Much of the success of the dabbawalas logistics system is attributed to its ability to evolve
continuously to adapt to local conditions rather than blindly following best practices imported
from elsewhere. This is evident in the coding system used to track the flow of dabbas within
the entire delivery network. While bar codes are common to modern day delivery system, its
high cost (relative to cost of the service) and the environment (manned by illiterate workers)
meant that the system was incompatible to the local conditions. The dabbawalas hence chose
to evolve a coding system that is understandable and simple to its workers, fully recognizing
the fact that its strength lies on its cheap labour and committed workforce. Since the system
is operated by strictly controlled but loosely linked groups, each group is allowed a certain
amount of flexibility in personalizing the coding system. Thus the ‘mukadam’ (the manager of
each operating group) can personalize some colors to differentiate the dabbas pertaining to
each of his group members.
Standard operating procedures:
Over the years the system has evolved an outstanding standard operating procedure which
ensures certainty in the operational model at any stage. Each member’s role is clearly
articulated and the codification system is perfect and well understood by all members.
Members are empowered to task execution. Fair business practices (equal compensation) and
joy of work, pride in the activity and fun mixed with work break the monotony of the
standard working procedure in this system.

TURBLOG D3.9: Urban Logistics practices – Mumbai case study 60
Customer Focus:
Although the dabbawala service functions in a monopoly market environment, the service is
priced low to attract and retain relevant customer segment and base. The process is capable
enough to fulfill the assurances of service quality. The dabbawala association has elevated
the objective of their business as an opportunity to serve society by provision of food, which
for them is a higher motivating factor than an operational objective as a transport logistics
support to deliver lunch boxes.
Customer cooperation:
The dabbawalas do not wait for lunch boxes if they are not ready when they arrive for
collection at residences. The household understands the need to be punctual to support the
functioning of these services and extends appropriate co-operation. Such understanding
between the client and service provider is crucial for the effectiveness of the logistics service
system.
5.7 OTHER ASPECTS
A number of elegant management practices are unique to the dabbawala system and can be
adapted to local conditions in other urban logistics systems across the worlds. They are as
follows:
Organisational Structure
The Mumbai Dabbawala system is organized as a cooperative structure to symbolize equality
and fairness. The employees of the dabbawala delivery system constitute the main
stakeholders of this logistics system.
It has a three tier organizational structure which is readily scalable based on business
opportunity and volume. The three tiers are:
1. Panch Committee or Governing Council comprising of President and secretary – top
level;
2. Muqaddams (team leaders or supervisors) – middle level;
3. Gaddis or Dabbawalas – lower level.
Each dabbawala carries around 30 tiffin boxes. There are totally around 5,000 dabbawalas
with 800 member teams operating in different areas within the Mumbai Metropolitan Region.
Each team has between 5-7 dabbawalas depending on the service demand in their area of
operation. Each team is supervised by a Muqaddam (team leader). The Muqaddam’s role is to

TURBLOG D3.9: Urban Logistics practices – Mumbai case study 61
supervise sorting of dabbas, to keep payment records, settle disputes, search new customers
and train new dabbawalas. Each group is financially independent but works together in the
delivery process. Each group serves its own interests without hampering the interests of the
other. The compensation is same at the group level following the philosophy of “equal work
equal pay”.
This structure is an optimal way of delivering centralized planning and decentralized
execution of business services. This structure also ensures attention to detail and
decentralization at the team level. As each member is associated with a fixed route and the
revenue opportunity is well integrated with the organizational structure.
The Governing Council holds meetings on the 15th of every month to discuss disputes,
operational issues and business policies. Muqaddams and Dabbawalas are entitled to attend
the meetings.
Human Resource Management Practices
The organization is built on a sense of pride of providing food to their customers and
belonging to the organization as they hail from the same ethnic group and wear a uniform
while at work. Mutual respect for individuals and empowerment are reinforcing features.
This is a great motivating factor to consistently improve their performance. After the delivery
of lunch boxes, the members break away from work to enjoy leisure time. There is 15 days
forced holiday every year to visit their family members in their villages. Members are
expected to conduct themselves to earn respect from public.
Members are motivated by a strong ethical work culture that is held strongly in their
community. The code of ethics is based on the following precepts:
• Work is worship;
• Serving people is serving God;
• Time is money;
• Unity is power.
These principles motivate the members to excel in their work and provide a feeling of
contentment, security, bonding and happiness from their activities.

TURBLOG D3.9: Urban Logistics practices – Mumbai case study 62
66 EEVVAALLUUAATTIIOONN OOFF TTHHEE GGOOOODD PPRRAACCTTIICCEE
6.1 INTRODUCTION
Section 5 dealt with the analysis of the business model and operating procedures of the
Mumbai dabbawala system. From this analysis, the potential for transferability of the
dabbawala system to other cities and other products in freight logistics system was explored.
As a follow-up to that analysis, the present section evaluates the impacts holistically of the
dabbawala system from 4 different perspectives namely, transportation, local economy,
environment and society.
6.2 SPECIFIC URBAN FREIGHT DATA COLLECTED
With regard to the specific good practice, both quantitative and qualitative data was
collected for the purpose of the Dabbawala case study. The dabbawala system has been
popular in India and gained recognition worldwide after being awarded the Six Sigma title as a
best practice in urban logistics in India. Since then, it has been quoted as a best practice of
urban logistics in the Indian context. As a result a number of news articles, websites, reports,
publications, books, presentations and journal papers have been available. The dabbawala
system has been extensively written about from diverse perspectives (organisational,
operational management, economics, socio-cultural, anthropological, glamour etc.) to
identify its success factors and unique working model. Therefore a thorough literature review
was carried out as the first step in data collection.
Secondly, the dabbawala organisation was contacted and (open ended) interviews were held
with key members of the Trust to gather information of its history, work culture and present
challenges. The author also travelled with one of the dabbawalas in Andheri region for
collection of dabbas from the residences and observed the sorting activities to gain firsthand
experience of the business processes.
Thirdly, Mumbai city development plans, Comprehensive Transportation Study and news
articles on urban transport were collected to understand the strategic development of the
city. Interviews with transportation specialists within the Mumbai Metropolitan Region
Development Authority (MMRDA) were conducted to gather information about the problems,
measures and status of transport projects in Mumbai. These formed the main sources of data
for this case study.

TURBLOG D3.9: Urban Logistics practices – Mumbai case study 63
6.3 IMPACTS
6.3.1 Transport impacts
In this subsection the impact of the dabbawala system on Mumbai city and its citizens is
explored in terms of travel times, goods volumes and delivery system efficiency.
Travel times
The dabbawala logistics system use walking, bicycles and suburban trains as the 3 modes of
collection, transport and delivery of the dabbas to their customers. The last mile i.e. from
railway station to the customer in the CBD area is transported by using handcarts. Mixed
traffic in Mumbai roads to a large extent aggravate congestion problems in the CBD areas
during peak hours. As common road space is utilised by the dabbawalas during morning peak
hours for the movement of the dabbas. This induces congestion especially near the railway
station.
On the other hand, dabbawalas are instrumental in reducing traffic congestion if seen from
another perspective. If dabbawalas were to employ motorised vehicles in the CBD area for
pickup and delivery, it could further aggravate congestion and contribute to slower
movement of traffic during peak hour traffic. This would also add to the problems of on-road
parking issues which would ultimately aggravate the traffic congestion levels on major
arterial roads. Time restrictions on heavy goods vehicle movements in most CBD areas would
force them to employ light commercial vehicles for delivery that would increase the number
of trips or number of vehicles causing more road congestion.
For example, if 15-20% of the employees in a commercial building within the CBD area were
to employ tiffin box delivery system, this would reduce the number of employees travelling
out of their work places for lunch, thereby, proportionally reducing mobility of people and
vehicles during lunch hours on working days. Although no surveys have been conducted to
verify the hypothesis, the authors are convinced that it could have a positive impact to
society by reduction of the amount of private vehicle trips, vehicle-kilometres and overall
travel times in the CBD areas. This ensures that workers and employees are well on time for
duty in the afternoon after lunch hours contributing to the man-hours on the job.
Goods volumes
The dabbawala system is scalable to the changing demand for this service.
As sorting, handling and transport of tiffin boxes are done manually, manpower forms the
main resource for adapting production capacity. Scalability of the dabbawala service is
ensured by a well developed apprentice program that ensures adequate personnel or slack

TURBLOG D3.9: Urban Logistics practices – Mumbai case study 64
capacity to service is available at all times to cater to sudden changes in demand. Incase the
demand drops, the apprentices are temporarily laid off who then seek other employment
sources during slack periods.
Delivery system efficiency
The dabbawala system is greatly dependent on Mumbai’s suburban rail system for operation
and punctuality, without which the main haulage of tiffins would not be possible and the
delivery system would be non-functional. The ‘last-mile’ delivery to the final destination is
relatively slow. Although one could argue that it could have be even slower if vehicles were
used in its place, because of the low average peak hour vehicle speeds (16-17km/hour) and
difficulties in flexibility and manoeuvrability imposed by road restrictions and parking for
commercial vehicles within the CBD area.
6.3.2 Economic impacts
After discussing the impacts on transportation, this subsection throws light on the economic
impacts of the dabbawala system on public and private actors namely, Mumbai city and
citizens and companies.
To city and citizens:
The employment of public transportation and non-motorised modes of transport (walking and
bicycling) for the “last mile” collection and deliveries, contributes to drastic reduction of
operational costs in the dabbawala delivery system. These cost savings are transferred to the
end customer. This makes the service attractive for the lower middle class employees who
constitute the target market segment for the tiffin box delivery services in Mumbai.
The use of hand carts for “last mile” deliveries in the CBD areas allow the dabbawala system
the increased manoeuvrability in negotiating narrow lanes and byroads in addition it helps
them to temporarily park at the building that needs to be serviced, thus contributing to
efficient and timely delivery system. This would have been otherwise difficult as lack of
parking areas, road congestion and traffic regulations within CBD areas would deter the
efficient delivery or collection of tiffin boxes. Another advantage is that the delivery space
required (in area on the road) for the hand carts is smaller than for a motorised vehicle
carrying an equal number of dabbas.

TURBLOG D3.9: Urban Logistics practices – Mumbai case study 65
The dabbawala services have contributed to the positive image of the city. The uniform41
wearing dabbawalas are a common site to see during working days in Mumbai city and have
become a symbol of the megapolis. Their humble and friendly nature is endeared by the
majority of Mumbai citizens. Their widely publicised interactions with VIPs such as Prince
Charles and Richard Bransen have gained them international fame and recognition. These
publicised events have attracted curiosity and admiration from people not just in Mumbai and
India but also across the world.
The dabbawala service is recognised as an outstanding example of service delivery and is the
most talked about Indian example of excellence in logistics operations. Several academic
institutions routinely invite dabbawala representatives to make formal presentations to
compliment and include their case study in their coursework. Also, senior management of
many Indian businesses introduce dabbawala system as a case study in their meetings and
reviews to motivate their managers towards adopting world class systems.
The dabba system has enhanced the employment opportunities for illiterate and semi-
illiterate people in the informal employment sector in Mumbai. The dabbawala system offers
sustainable means of livelihood, economic security and the feeling of legitimacy to its
members, mainly consisting of migrants from rural areas from the Pune region.
To companies:
The virtue of using the existing public transport system as the main transport mode, low wage
structure and manual operations has greatly reduced the overhead costs, operational costs,
logistic complexity and management costs. The fleet used in this system consist of low cost
modalities (i.e. bicycles), which makes the investment costs relatively low.
The dabbawala system is used by many consumer product companies and media services as a
marketing means to launch new products or promote existing products and services with a
particular market segment. This forms a new source of revenue for the dabbawalas while is a
relatively cheaper and simpler means of targeting specific market segment for companies.
6.3.3 Environmental impacts
Due to the use of non-motorised means of transport for freight logistics activities, the
dabbawala system does not contribute directly to the pollution in the city of Mumbai. In this
41 White shirt and pant plus a small white cap popularized by Nehru, the first prime minister of India are
the traditional dress code of the dabbawalas.

TURBLOG D3.9: Urban Logistics practices – Mumbai case study 66
section, the environmental impacts of the dabbawala logistics system on the different
stakeholders are explored.
To city and citizens:
As described earlier, the use of environmental friendly vehicles in the full logistics chain has a
tremendous positive environmental impact on the city and its citizens. As no motorised
vehicles are used for this logistics system, fuel consumption and hence direct emissions such
as such as CO2, CO, HC, NOx, PM and SOx from their activities are totally eliminated, although
indirect emissions from use of trains could be included in their carbon footprint.
The logistics system also has a positive impact by reduction of vehicular noise related
pollution. Dabbawalas sing devotional songs in chorus during their suburban train journeys as
a means of breaking the monotony of work, as well as for entertainment and spiritual
progress. Although loud and noisy for some commuters, the melody and rhythm of the
devotional songs are liked by majority of the co-passengers that travel in the same train.
To companies:
By far, the dabbawala system is a best practice also in terms of its environmental friendly
image because of its “zero emission” activities, at least directly. Since the lunch box delivery
system is one of its kind in Mumbai, the positive image as environment friendly service
matters little in attracting or retaining its customers. Moreover, road traffic regulations and
pollution norms imposed by the authorities have no impact on the dabbawala activities as
they do not operate motorised vehicles.
6.3.4 Social impacts
The dabbawala service impacts society in many ways. This subsection elaborates on the social
impacts of this delivery system on city, its citizens, companies and employees.
To city and citizens:
A majority of commuters in the suburban railways in Mumbai during the peak hours are
familiar with the dabbawalas and their activities. A majority of the regular commuting public
is tolerant to the inconveniences caused by them in the already overcrowded overstretched
suburban rail transport system. Over a period of time the Dabbawalas have become an
essential component of modern Mumbai.
Dabbawalas deliver the dabbas by hand carts in Mumbai’s CBD areas. These handcarts are
pushed by a number of dabbawalas at the side of roads and streets leading to their
customers. As the hand carts are pushed at slow speeds, the risk of injury to pedestrians from

TURBLOG D3.9: Urban Logistics practices – Mumbai case study 67
collision with the hand carts is inconsequential. The road space is also preferred to footpaths,
because the footpaths are poorly maintained. Also a number of obstructions on footpaths
from street hawkers and pedestrian flows restrict the free movement of these carts
A number of advantages of employing the dabba service by its customers are recorded from
various surveys conducted in different studies. At first sight it would seem logical that office
going people carry their own tiffin boxes themselves to work. However, knowing the travel
conditions in suburban trains during peak hours in Mumbai it is easier to understand the
difficulty involved in holding a tiffin box in addition to a briefcase that most employees use to
take with them (Percot 2005). Secondly, the dabbawala offers a link to home for its
customers that are mainly constituted of lower middle class and middle class people. A lot of
its customers travel and work long hours and therefore find inadequate time to spend with
their family. For them, the dabbawala service is an actual link with home as it not only offers
home cooked food but also is used as a letter box to communicate written information and
messages inserted inside the tiffins between family members at home and workplace. By
delivering to each employee this tiffin filled with home cooked food, dabbawalas cater to
individual tastes of an estimated 200,000 customers in a megapolis city such as Mumbai where
the diversity of Indian food habits is difficult to cater to in restaurants. Also the high cost of
living makes it unaffordable for many to eat outside regularly. For many, the diet restrictions
are a reason for people to employ the dabba service.
To companies/employees:
The dabbawala profession was perceived as transitory employment in the hope of
subsequently obtaining a job in the organised sector. This notion is however no longer present
in the dabbawalas’ minds. Although it is often someone’s choice which determines entry into
the profession, the dabbawalas are nevertheless lucky to get into the informal sector as this
is also not always simple.
The dabbawala service has a positive impact on society as it has provided a source of stable
livelihood, job security and means of economic independence in the informal sector to atleast
5,000 members at any given time. Their traditional Maharashtrian uniform is for them the
symbol of their community. Numerous ceremonies are organised such as common prayers in
Mumbai temples, annual pilgrimages or music festivals where they reaffirm their solidarity
and contribute to unity of the group. A 15-day forced holiday per year is imposed on each
member to visit his hometown. Members express pride in having devised this system when
they were illiterate. A few others acknowledge advantages in this work are independence,
freedom as well as comfort and support by working amongst a network of family members.

TURBLOG D3.9: Urban Logistics practices – Mumbai case study 68
The job for each dabbawala is specified to collect, transport and distribute tiffin boxes of
upto 30 customers in a pre-assigned geographical area every day for 25 working days in a
month. This is physically demanding and strenuous job as each member should be able to
carry 30 tiffin boxes (which could weigh up to 100 kg) on their head and walk 2-3 km
effortlessly. The work hours are between 8.30 am to 5.00 pm with an appropriate rest period
of 2.5 hours. They travel in the train along with lunchboxes every day. The regular travel by
dabbawalas on over-crowded suburban local trains is also an occupational hazard. The sorting
and loading operations are time bound. They are carried out in public spaces and are usually
congested. Women are discouraged from employment in this delivery system because it
involves hard manual labour and the employees have to face tough working conditions.
Since the road space is preferred by the dabbawalas to footpaths, there is relatively more
danger (speeding vehicles and errant drivers) to the safety of dabbawalas. A number of
accidents have been reported which have led to injuries of some dabbawalas and even death.
However, this job has also positive sides. The members are never laid off unless they get sick
or meet with an accident or retire. This is not commonly seen in the informal employment
sector or in any private sector in India. Though the members have been living in the city for
years, they persist to claim their rural origins which contribute to their feeling of unity and
identity.
6.4 IMPLEMENTATION OF MEASURES
6.4.1 Specific changes needed to implement measures
The dabbawala system is unique, home grown model developed by a group of individuals with
little or no formal education in the area of logistics. It has been unique to the city of Mumbai.
Although it has been tried in other cities and the brand name used in other cities for
marketing purposes, the scale of operations and size of network of the Mumbai dabbawala
service network is not found in any other city in India. So, comparison of measures is not
possible. There were no changes like any infrastructural changes made in Mumbai city to
support the activities of the dabbawala logistics services.
The business model of the Pune dabbawalas is different from that of Mumbai dabbawalas. The
Pune dabbawalas complement the work of canteens by provision of a home delivery service.
In Mumbai, the unique distribution system is demonstrated by the transfer of the dabba
through the hands of at least 4 dabbawalas during its door to door journey. This exclusivity
can be attributed to the generally linear topography of the city and the presence of the
suburban railway network both of which have facilitated the creation of the delivery service.
TURBLOG D3.9: Urban Logistics practices – Mumbai case study 69
The dabbawala system has evolved continuously making the best use of existing infrastructure
and available resources. The following measures could support the activities of the dabbawala
service system:
• On the arterial roads in the CBD areas, it is recommended to allocate dedicated road
lanes for the movement of slow traffic which could be used by the dabbawalas for
safe and comfortable movement of their loaded carts within the CBD area;
• On the local suburban trains, a dedicated goods compartment for the dabbawalas on
local suburban trains plying during the period and days of their operations (10am –
noon and 2pm to 4 pm) will offer comfort to the dabbawalas in their strenuous train
journeys and to the other travellers;
• Use of information technology to market their services, attract job seekers and offer
better opportunities to their workforce. The dabbawala service is registered with the
JustDial local search engine in Mumbai who provide the mobile numbers of
dabbawalas operating in their area. A potential customer can directly call the
muqaddam and negotiate for starting of the tiffin delivery services. There is scope for
further exploiting IT technology by developing and managing their own website. In
addition, by participating in social networking platforms such as Facebook, Orkut,
Twitter, etc. Dabbawala Trust could market their services in Mumbai Region more
effectively.
6.4.2 Integration aspects
Although the dabbawala service has been operating for over 100 years there has been no
urban transport policy made to support their activities. It was not the city’s transport
infrastructure or services that supported the dabbawala system, but the dabbawala system
that evolved making the best use of the local conditions and available resources.
6.4.3 Acceptability
The dabbawalas are accepted as a part of Mumbai culture for the kind of invaluable service of
connecting the people with their families through the means of home cooked food
distribution.
The dabbawalas have gained customer cooperation through trust generated over long years in
the same business. The dabbawalas do not wait for lunch boxes if they are not ready at the
collection points. Households subscribing to the dabba service system understand the

TURBLOG D3.9: Urban Logistics practices – Mumbai case study 70
importance of being punctual and thus support the functioning of the dabba service and
extend cooperation.
The rail commuting public is largely tolerant to the inconveniences caused by the dabbawalas
in the overcrowded and overstretched suburban rail system of Mumbai. Over a period of time
the dabbawala system has become an essential element of modern city of Mumbai.
The dabba service system has no competition in its core business of delivering home-cooked
food to its customers. Also other urban logistics businesses feel less threatened by the
dabbawalas as their organization is reluctant to diversify their services to deliver other
products or take up more complex delivery systems.
Marketing agencies have realized that dabbawalas have personal contact with a sizable
population of a particular market segment. Therefore, their services are utilized as a
marketing medium for product promotions.
6.4.4 Bottlenecks/barriers
The business of dabbawalas has gone through major challenges in the last few decades. A
substantial customer base of the dabbawalas was lost with the closure of textile mills in
Mumbai and the arrival of in-house canteens in schools and corporate office establishments.
Other factors such as disposable incomes, women holding full time jobs, proliferation of
nuclear families from traditional joint family structure and changes in the operating
environment have eroded the customer base. This could be because of many reasons. There
may be no family member at home to prepare home cooked food. Or canteen food at
workplace may be attractive to the CBD employees.
Changes in the dabbawala operating system have come about when business activities began
to move to the new Mumbai business districts which are further inland from the rail networks
in the last years. This has further complicated the already intricate distribution network.
The dabbawalas have evolved to face the above challenges by adapting their business
practices to the changing market conditions by continuously innovating, offering new services
while riding on their core competence of on-time and reliable delivery services. Some of the
innovations have been as follows:
• Introduction of express delivery service with a pick up at 11am;
• A linkage with a group of housewives to cook and supply dabbas for customers who
prefer home-cooked food;

TURBLOG D3.9: Urban Logistics practices – Mumbai case study 71
• Working with marketing agents like the brand management teams to distribute
product samples alongwith dabbas to the offices;
• Standard dabbas given way to more elaborate and colorful packaging according to
customer requirements;
• Advertising of the dabba service by putting stickers on the dabbas
6.4.5 Success and failure factors
The noteworthy achievement of the Mumbai dabbawala logistics service has been the
adaptation of their operations to the local conditions and available resources as well as
innovation to provide new value added services without sacrificing core competence of
reliable and punctual services on a regular basis.
There are several complimentary aspects which provide exclusivity and uniqueness to the
Mumbai dabbawala logistics service. The first and foremost is the business model that is based
on inexpensive and reliable public infrastructure service. This coupled with the high volumes
of service built over a period of time provides an unparalleled advantage to the dabbawala
service system of Mumbai (Ravichandran 2005). The service has evolved over the Mumbai
topography that is linear. The logistical pattern is such that the origins are dispersed over a
large area while destinations are concentrated over a small geographical area. The availability
of cheap labour for this activity is a prerequisite for this activity. Finally the need and
preference for home based food are important contextual uniqueness specific to the Indian,
particularly Mumbai population.
Unless all the above unique conditions are met in other cities, it might be difficult to
integrate the dabbawala delivery in another city or country in the same way as is done in
Mumbai. The lesson learnt from this case study is that the each urban logistics system will
have to continuously evolve over a period of time to develop customized services that best
fits to its customer requirements and city profile within the constraints of available resources.
One of the important characteristics of the Dabbawala business model is its scalability i.e.
the property of the dabbawala system to accommodate changes in transaction volume
without major changes to the system. This is possible because of an elaborate apprentice
system prevalent in the organization that provides the required manpower. Secondly, the
tiffin box tracking system is an inexpensive variation of the online tracking system relying on
punctuality, trust and co-operation. And thirdly no capital investments are required as
additional costs of the necessary equipment such as bicycle or hand cart are borne by the
new member himself and therefore when he leaves the member gets to keep his bicycle. The

TURBLOG D3.9: Urban Logistics practices – Mumbai case study 72
size, scalable nature of operations, modular structure, customer service and negligible errors
has kept competition away from this attractive business proposition.
Human Resource Management practices are built on member’s pride in work. The members do
not consider themselves as logistics providers but see the job as an opportunity to provide
food to their customers which is a source of pride for them. It is a great motivating factor.
This is supported by a cultural uniformity as all of them belong to the same community and
the system has a well developed apprenticeship development programme. These are some of
the success factors for the sustainability of the dabbawala business model for over a century.
Up to the 1960s dabbawala profession was viewed as a temporary means of employment until
the youth finds another job in the informal sector (Percot 2005). But this notion changed ever
since the association evolved to provide job security, sustainable livelihood and a social
support system for its members that have similar rural backgrounds. This social security is
uncommon in the informal employment sector in India and therefore is a strong success factor
for employee retention.
Although the dabbawala service has been operational for more than 120 years, it has catered
to a specific market segment and customer segment. The simplistic lifestyle of its members
coupled with lack of formal education could be some of the reasons for the absence of
enterprise and initiative to diversify their business into other commercially lucrative urban
logistics markets, customer segments or into other cities. This could be treated as a sort of
‘failure’ of the trust to diversify their business to other related logistics businesses.
TURBLOG D3.9: Urban Logistics practices – Mumbai case study 73
77 CCOONNCCLLUUSSIIOONNSS
The report initially made an overview of India and Mumbai city’s transport profile in the
macro context. Existing transport infrastructure for intra-urban transport has been primarily
road and suburban railways. Almost 90% of the city’s population depends on the public
transport system for their mobility needs. With the growth of the population, private
motorized vehicles, the demand for transport and road space has grown tremendously. Public
transport infrastructure has not been able to keep pace with the demand growth, which has
had negative externalities such as road congestion, overcrowded trains, air pollution, high
rate of accidents etc. and at a macro level dependence on fossil fuels and ultimately the
health and well being of the city’s population.
In India, the institutional framework at the national, state and urban level is fragmented with
a number of departments and agencies managing different aspects of transportation. Due to
the lack of inter-departmental coordination and clear strategic policy goals, the
transportation system as a whole suffers from good integration and connectivity. In the
Mumbai Metropolitan Region a number of large infrastructure projects are ongoing not only to
increase infrastructure capacity along the main North-South transport corridors, but also to
improve north-south and east-west connectivity. Projects for alternative transport modes
such as the Mumbai metro project, the Mumbai monorail project have been initiated to
unburden existing public transport system. Discussions are ongoing for starting new passenger
services to connect the island of Mumbai to the mainland. Although this report focuses on
urban freight transport, certain aspects of the public transport system are also mentioned
because the dabbawalas depend on the public transport system for their tiffin box delivery
system.
After a brief overview of the Mumbai city’s governance structures, present problems and
policy measures underway, the business model of the Mumbai Dabbawala service system was
analysed. One of the remarkable achievement of the dabbawala system has been that change
in the last 120 years since its inception, has not affected the success of the dabbawala
system. This can be attributed to a number of success factors as listed below:
• The dabbawala system is based on strong value and ethics of service to society by
delivering food. This is a source of motivation to its members;
• The delivery system has evolved a simple system to handle large operations with
negligible error;
• The organizational model is almost flat with 3 tiers. It relies on a modular, scalable
and flexible system with sufficient extra capacity;
TURBLOG D3.9: Urban Logistics practices – Mumbai case study 74
• The services are customer centric and employee driven;
• Management practices are intuition based (coding system) taking the employee skills
into consideration;
• Several factors specific to Mumbai such as cheap manpower availability, demand for
home food, urban transport infrastructure and linear geography have contributed
towards establishing this excellent business model based on innovative approach to
satisfy a perpetual demand.
From the perspective of transferability of this best practice, we realize that the core business
of home-cooked food distribution may not be a viable business elsewhere as culture plays a
strong part in the demand side of the business. Even so, the delivery system could be applied
to a local product with characteristics of perpetual demand and homogeneity. Transfer of
management practices and operational procedures of the dabbawala system are worth
exploring in other cities in the world.
The first and the most critical factor in terms of transferability proposition is the utilization
of relatively cheap transport system for urban logistics (e.g. bicycles, public transportation,
etc.). This would allow cost reductions to make the urban logistics services attractive, which
could lead to the generation of formidable business volumes over a period of time.
Another important operational aspect of the dabbawala delivery model is its scalability and
member driven logistic activity. The availability of additional trained personnel allows
flexibility to scale up the logistics operations at short notice. Secondly, flat organizational
structure and empowerment of personnel to manage their own day to day operations provides
harmony, synergy and symphony. Tracking mechanism is an innovative and inexpensive
variation of online tracking system which makes it inexpensive. Even so this simple
codification system of tiffin boxes may be seriously constrained to handle multiple products
with deliveries in many directions. A lesson learnt is to develop a tracking system that is
simple, user-friendly, cheap and locally executable.
This case study demonstrates that the informal sector are capable of managing a complex
urban logistics system as efficiently and effectively as any other logistics company in the
organized sector. The uniqueness of this urban logistics case study has been the efficient and
effective utilization of Mumbai’s cheap public transport system (suburban commuter rail in
this case) as the main mode of transport. This aspect has a potential for transferability
especially in cities where public transport services are reliable, regular, cheap and with the
network that is well connected.
TURBLOG D3.9: Urban Logistics practices – Mumbai case study 75
To replicate the dabbawala model in other cities in totality may not be practicable, because
it caters to a specific market and customer segment. Therefore any urban logistics activity
fully based on this would inherently have less universal transferability unless it is applied in
other cities having similar linear topographies, cheap public transport system and the need to
transport homogeneous products with characteristics of perpetual and regular demand.

TURBLOG D3.9: Urban Logistics practices – Mumbai case study 76
88 RREEFFEERREENNCCEESS
Balakrishnan, N. & Teo, C., 2004. Mumbai Tiffin ( dabba ) Express, Available at: http://www.bschool.nus.edu.sg/staff/bizteocp/dabba.pdf.
Chandra, H., 2006. Working Group on Urban Transport including Mass Rapid Transport System for Eleventh Five Year Plan. , 43. Available at: http://planningcommission.nic.in/aboutus/committee/wrkgrp11/wg11_MRTS.pdf.
Commission, P., 2008. Civil Aviation, Eleventh Five Year Plan 2007-2012 (Volume III), Oxford University Press.
FT, 2008. GDP growth: Surat fastest, Mumbai largest. Economy Section, Financial Times. Available at: http://www.financialexpress.com/news/gdp-growth-surat-fastest-mumbai-largest/266636/.
Huschebeck, M., 2001. BEST Urban Freight Solutions Deliverable D1.1. Contract, (March), 1-14.
Jampani, S. & Dutta, S., 2004. Mumbai’s Dabbawalas–An entrepreneurial success story. Entrepreneurship, 42.
Mahias M.C., 1999. Manger en Inde. Partage et transaction. In Histoire et ethnologie du repas. Paris, pp. 347-369.
Mallik, U. & Mukherjee, D., 2007. Sigma 6 Dabbawalas of Mumbai and their operations Management - An Analysis. The Management Accountant, 42(5), 386-388.
Mumbai, T., 2003. Vision Mumbai - Transforming Mumbai into a world-class city. A Summary of Recommendations. Available at: http://www.bombayfirst.org/pdf/McKinseyReport.pdf.
Pandit, S., 2007. Dabawalas: Lessons For Building Lasting Success Based On Values, New Delhi: McGraw-Hill Education Pvt. Ltd.
Pathak, G., 2010. Delivering the Nation : The Dabbawalas of Mumbai. South Asia: Journal of South Asian Studies, 33(2), 235-257.
Percot, M., 2005. Dabbawalas , Tiffin Carriers of Mumbai : Answering a Need for Specific Catering 1 1 . Home food for office lunch, Paris, France. Available at: http://hal.inria.fr/docs/00/03/54/97/PDF/DABBA.pdf.
Phatak, V., Pendharkar, S. & Patkar, V., 1999. Regional Plan for Mumbai Metropolitan Region 1996-2011, Mumbai: Planning Division, MMRDA. Available at: http://www.regionalplan-mmrda.org/.
Quien, A., 1997. Mumbai ' s Dabbawalla Omnipresent Worker and Absent City-Dweller. Economic And Political Weekly, 32(13), 637-640.
Raghuram, G., 2000. Integrated Transport, India Infrastructure Report 2001 S. Morris, Oxford University Press. Available at: http://3inetwork.org/reports/IIR2001/iir7.pdf.

TURBLOG D3.9: Urban Logistics practices – Mumbai case study 77
Ravichandran, N., 2005. World Class Logistics Operations: The Case of Bombay Dabbawallahs, Ahmedabad. Available at: http://www.iimahd.ernet.in/publications/data/2005-09-01ravichandran.pdf.
Schoemaker, J. et al., 2006. Quantification of Urban Freight Transport Effects I. Presentations. Available at: http://www.bestufs.net/download/BESTUFS_II/key_issuesII/BESTUF_Quantification_of_effects.pdf.
Singh, V., Puvvada, V. & Pradeep, J., 2008. Study on Traffic and Transportation Policies and Strategies in Urban areas in India - Final Report May 2008. , (May), 114. Available at: http://www.urbanindia.nic.in/programme/ut/final_Report.pdf.
Sriraman, S., Venkatesh, A. & Karne, M., 2006. Competition Issues in the Road Goods Transport Industry in India with special reference to The Mumbai Metropolitan Region. Transport Economics, (September), 148. Available at: http://www.competition-commission-india.nic.in/Market_Studies_Research_Projects/CompletedStudies/Link_of_Study1.pdf.
Stantchev, D. & Whiteing, T., 2006. URBAN FREIGHT An overview of the European research and policy, European Commission - DG Tren. Available at: http://www.transport-research.info/Upload/Documents/200608/20060831_105348_30339_Urban_freight.pdf.
TOI, 2010. Centre notifies draft share of states in national truck permit scheme. The Times of India. Available at: http://timesofindia.indiatimes.com/india/Centre-notifies-draft-share-of-states-in-national-truck-permit-scheme/articleshow/5895330.cms.
Unnithan, S., 2001. Delivering the Goods. India Today.