Embed Size (px)
Citation preview
Grape Industry
Analysis
for Investment
and
Redevelopment
FINAL REPORT
15 September 2014

Project lead
Mildura Development Corporation
Project contributors
Regional Development Victoria, Mildura Development Corporation, Dried Fruits Australia,
Australian Table Grape Association and Murray Valley Winegrowers’
Authors Sue Argus and Alison MacGregor, SunRISE Mapping and Research
a division of Mallee Family Care Inc.
Postal Address: PO Box 1870, Mildura VIC 3502
Telephone: (03) 5021 7492 international + 61 3 5021 7492
Facsimile: (03) 5021 4455 international + 61 3 5021 4455
Email: [email protected]
Internet: http://www.sunrisemapping.org.au
Acknowledgments
The following are acknowledged for their contribution to the study:
• Sunbeam Foods
• Australian Premium Dried Fruits
• Andrew Nemtsas, Murray River Organics
• Australian Vintage
• Sunworld for information on proprietary varieties
• Sheehan Genetics for information on proprietary varieties
• Murray Valley irrigators for their participation in the SunRISE mapping program
Disclaimer
Information in this report is derived from analysis of data from a range of sources. The report
may be of assistance to you but SunRISE Mapping and Research and its employees do not
guarantee that the publication is without flaw of any kind or is wholly appropriate for your
particular purposes and therefore disclaims all liability for any errors, loss or other consequence
which may arise from you relying on any information in this report.
mapping & research
SunRISE
SunRISE Mapping & Research Grape Industry Analysis Page 3 of 65
Contents
1. Summary 6
2. Introduction 9
2.1 Study area 10
2.2 Project background and consultant’s brief 11
3. Data sources and method 12
3.1 SunRISE crop data acquisition and accuracy 12
3.2 Source of crop production and crop prices data 13
3.3 Limitations 14
4. Murray Valley grape plantings 1997 to 2014 15
4.1 Change in wine, table & dried plantings 1997 to 2014 15
4.2 Summary of grape varieties 1997 to 2014 16
4.3 Value of grape production in the Murray Valley 17
4.4 Farm gate value of wine, table and dried grapes 18
4.5 Change in irrigation methods 1997 to 2014 19
4.6 Change in rootstocks 1997 to 2014 20
4.7 Change in property numbers and size 1997 to 2014 21
5. Wine grape industry analysis 23
5.1 Change in wine grape varieties 1997 to 2014 23
5.2 Wine grape production 1997 to 2014 28
5.3 Wine grape plantings yet to come into production 29
5.4 Wine grape prices 1997 to 2014 30
5.5 Crop value of wine grapes 1997 to 2014 34
5.6 Irrigation methods for wine grape plantings 36
5.7 Rootstocks of wine grape plantings 1997 to 2014 37
5.8 Wine grape property numbers and size 1997 to 2014 38
6. Dried grape industry analysis 39
6.1 Change in dried grape varieties 1997 to 2014 39
6.2 Dried grape production 1997 to 2014 42
6.3 Dried grape plantings yet to come into production 43
6.4 Dried grape prices 1997 to 2014 44
6.5 Crop value of dried grapes 1997 to 2014 46
6.6 Irrigation methods for dried grape plantings 48
6.7 Rootstocks of dried grape plantings 1997 to 2014 49
6.8 Dried grape property numbers and size 1997 to 2014 50
7. Table grape industry analysis 51
7.1 Change in table grape plantings 1997 to 2014 51
7.2 Table grape production from 1997 to 2014 54
7.3 Table grape plantings yet to come into production 55
7.4 Table grape prices 1997 to 2014 57
7.5 Crop value of table grapes 1997 to 2014 60
7.6 Irrigation methods for table grape plantings 62
7.7 Rootstocks of table grape plantings 1997 to 2014 63
7.8 Table grape property numbers and size 1997 to 2014 64
8. Bibliography 65

SunRISE Mapping & Research Grape Industry Analysis Page 4 of 65
List of figures
Figure 1: Map of the study area 10
Figure 2: Hectares of wine, table and dried grape plantings from 1997 to 2014 15
Figure 3: Summary of changes in grape varieties and areas (hectares) from 1997 to 2014 16
Figure 4: Crop value ($ million) of Murray Valley wine, table and dried grapes 1997 to 2014 17
Figure 5: Farm gate value (weighted average $/hectare) of wine, dried and table grapes 18
Figure 6: Change in irrigation methods for Murray Valley grape plantings from 1997 to 2014 19
Figure 7: Change in rootstocks of grape plantings from 1997 to 2014 20
Figure 8: Change in property numbers and size 1997 to 2014 21
Figure 9: Grape growing properties in 2014 22
Figure 10: Summary of wine, table and dried grape property numbers and average property size 22
Figure 11: Change in wine grape plantings (hectares) from 1997 to 2014 23
Figure 12: Hectares of bearing and non-bearing white wine grape varieties 1997 to 2014 24
Figure 13: Hectares of bearing and non-bearing red wine grape varieties 1997 to 2014 25
Figure 14: Area (hectares) planted to white wine grape varieties 1997 to 2014 26
Figure 15: Area (hectares) planted to red wine grape varieties 1997 to 2014 27
Figure 16: Average yield (tonnes/hectare) from bearing wine grape plantings 1997 to 2014 28
Figure 17: Projected tonnage from wine grape plantings that were non-bearing in 2014 29
Figure 18: Weighted average price ($/tonne) for wine grapes from the Murray Valley 30
Figure 19: Average prices ($/tonne) for white wine grape varieties 1997 to 2014 31
Figure 20: Average prices paid for red wine grape varieties ($/tonne) 1997 to 2014 32
Figure 21: Trends in the planted hectares of Murray Valley wine grapes as prices fluctuate 33
Figure 22: Crop value ($ million) from Murray Valley wine grape crush surveys 1997 to 2014 34
Figure 23: Change in farm gate value ($/hectare) of wine grapes from 1997 to 2014 35
Figure 24: Change in irrigation methods for wine grape plantings from 1997 to 2014 36
Figure 25: Change in rootstocks of wine grape plantings from 1997 to 2014 37
Figure 26: Change in property numbers and size of wine grape properties from 1997 to 2014 38
Figure 27: Wine grape properties in 2014 38
Figure 28: Summary of bearing and non-bearing dried grape plantings 39
Figure 29: Hectares of bearing and non-bearing dried grape varieties 1997 to 2014 40
Figure 30: Change in hectares of dried grape varieties from 1997 to 2014 41
Figure 31: Dried grapes from the Murray Valley (tonnes) delivered to packers 1997 to 2013 42
Figure 32: Average yields (dried tonnes/ha) for dried grape fruit 1997 to 2013 42
Figure 33: Projected tonnage from dried grape varieties that were non-bearing in 2014 43
Figure 34: Weighted average price ($/dried tonne) for dried grape fruit from 1997 to 2013, and
estimated prices for 2014 44
Figure 35: Trends in planted hectares of dried grapes as prices fluctuate 45
Figure 36: Regional income ($ million) from dried grape fruit based on intake data and 2014
estimates 46
Figure 37: Farm gate value or gross income ($/hectare) for dried grape fruit 1997 to 2014 47
Figure 38: Change in irrigation methods for dried grape plantings from 1997 to 2014 48
Figure 39: Change in rootstocks of dried grape plantings from 1997 to 2014 49
Figure 40: Property numbers and average size of dried grape properties 1997 to 2014 50
Figure 41: Dried grape properties in 2014 50
Figure 42: Summary of bearing and non-bearing table grape plantings (hectares) 1997 to 2014 51
Figure 43: Hectares of bearing and non-bearing table grape varieties 1997 to 2014 52
Figure 44: Change in table grape varieties (hectares) 1997 to 2014 53

SunRISE Mapping & Research Grape Industry Analysis Page 5 of 65
Figure 45: Annual production estimate (tonnes) of table grapes 1997 to 2014 54
Figure 46: Seasonality of bearing and non-bearing table grape varieties in 2014 55
Figure 47: Projected tonnage from table grape varieties that were non-bearing in 2014 56
Figure 48: Average wholesale price ($ per kilogram) for table grapes delivered into Melbourne and
Sydney markets 1997 to 2014 57
Figure 49: Monthly average wholesale prices ($ per kilogram) for table grapes at Melbourne and
Sydney markets between January and April, 1997 to 2014 58
Figure 50: Trends in planted hectares of table grapes as prices fluctuate 59
Figure 51: Regional income ($ million) from table grapes 1997 to 2014 60
Figure 52: Changes in farm gate value (weighted average $/ha) of table grapes 1997 to 2014 61
Figure 53: Change in irrigation methods for table grape plantings from 1997 to 2014 62
Figure 54: Change in rootstocks of table grape plantings from 1997 to 2014 63
Figure 55: Change in property numbers and size for table grape growers from 1997 to 2014 64
Figure 56: Table grape properties in 2014 64

SunRISE Mapping & Research Grape Industry Analysis Page 6 of 65
1. Summary
The study area, referred to as the ‘Murray Valley’ in this report, encompasses the Lower Murray
Darling region of Victoria and New South Wales (Figure 1).
The region has over 1,200 growers producing wine, table and dried grapes from 31,085 hectares
of grapevines. This report tracks the three industries over the past seventeen years with respect
to grape varieties, hectares (bearing and non-bearing), production (tonnes), yields (tonnes/ha),
prices, crop value ($ million), farm gate value ($/ha), irrigation methods, rootstocks, grower
numbers and property sizes.
With over-supply of wine grapes still an issue, the table grape industry on the rise and the dried
grape industry looking to increase its production base, an understanding of development and
investment over the past seventeen years will better inform future investment and adjustment in
response to changing markets and growing conditions.
Non-bearing (new and redeveloped) plantings
In 1997, 22% (5,980 ha) of grapevine plantings were non-bearing (less than three years old). This
high proportion of new (including redeveloped) plantings was fuelled by the wine grape boom,
with 4,640 ha of the non-bearing plantings being wine grape varieties (Figure 2).
Possibly high wine grape prices in the late 1990’s also assisted investment in dried and table
grapes as there were 1,845 ha of non-bearing table grape plantings in 2003 and 1,135 ha of dried
grape plantings; the largest areas of new table and dried grape plantings compared with the
1997, 2006, 2009 and 2014 seasons. New dried grape plantings in the early 2000’s would also
coincide with conversion to trellis drying.
By 2014, only 8% (2,420 ha) of all plantings were non-bearing. 69% of the non-bearing plantings
were table grape varieties (1,670 ha); predominantly Crimson Seedless (Figure 43). Production
from the 2014 non-bearing table grape plantings represents a 24% (40,080 tonnes) increase on
2014 production from bearing plantings (170,040 tonnes) (Figure 47).
Grape varieties
Diversification to new grape varieties is evident in the study region. New dried grape varieties
include Sunmuscat, Sunglo, Diamond Muscat, Black Gem, Selma Pete and Summer Muscat. Wine
grape varieties new to the region include Pinot Gris, Fiano, Montepulciano, Nero d’Avola and
other Muscat and Italian varieties. New table grape varieties include Autumn Royal, Ralli
Seedless, Crimson Seedless and a range of proprietary varieties.
The dominant grape varieties (52% of plantings) are Chardonnay (5,145 ha), Sultana/Thompson
Seedless (4,159 ha), Shiraz (3,576 ha) and Crimson Seedless (3,377 ha) (Figure 3).
Sultana (including Thompson Seedless) plantings decreased by 10,289 ha between 1997 and
2014. As there were around 2,000 ha of new Sultana plantings in this period, 12,289 ha of old
Sultana plantings were removed.
Crimson Seedless plantings increased by 3,329 ha between 1997 and 2014. This was the most
popular variety followed by Shiraz (an increase of 2,290 ha) and Chardonnay (2,114 ha).
SunRISE Mapping & Research Grape Industry Analysis Page 7 of 65
Yields
The average yield in 2014 across all wine grapes was 23 tonnes/ha, based on the 2014 Wine
Grape Crush Report (tonnes) and SunRISE crop mapping (hectares). Average wine grape yields
ranged from 18 to 23 tonnes/ha in the seasons 1997, 2003, 2006 and 2009 (Figure 16).
Average dried grape yields across the region ranged from 3.6 to 6.0 dried tonnes per ha, based on
intake tonnages and SunRISE crop mapping (Figure 32).
Table grape production was estimated based on average yields of 20 kg/vine from 1,200 vines/ha.
The greatest increase in production between 1997 and 2014 was in mid- to late-season red grape
varieties; an estimated increase of 59,534 tonnes (Figure 45). There was a significant decrease in
mid-season white table grape production estimated at 22,817 tonnes between 1997 and 2014.
Prices
Prices for wine grapes purchased from the Murray Valley decreased by 59% for red grape
varieties and by 33% for white grape varieties between 1997 and 2014 (Figure 18).
The weighted average price for dried grapes increased from $1,431 per dried tonne in 1997 to an
estimated $1,700 per dried tonne in 2014 (Figure 34).
Average prices returned to table grape growers from the wholesale markets increased overall by
$0.20 between 1997 and 2014 (Figure 48). The greatest price increase ($0.79) was for black
grapes. The price of white grapes between 1997 and 2014 fell by $0.18.
Crop value ($ million)
The estimated crop value of Murray Valley wine, table and dried grapes totalled $362 million in
2014 (Figure 4). Crop value has increased by $101 million (39%) since 1997.
Wine grapes accounted for 35% of the crop value of Murray Valley grapes in 2014, dried grapes
9% and table grapes 56%.
Farm gate value ($/ha)
Farm gate value of wine grapes declined by 37%; from $11,300/ha in 1997 to $7,100/ha in 2014.
For dried and table grapes it increased in the same period by 66% and 19% respectively (Figure 5)
Irrigation methods
Murray Valley grapevines are predominantly (89%) irrigated with drippers or low level sprinklers
(Figure 6).
The dominant irrigation method was furrow in 1997; however this changed to drippers by 2003.
In 2014 wine and dried grape plantings were predominantly drip irrigated, and table grape
plantings predominantly irrigated with low level sprinklers (Figure 24, Figure 38 and Figure 53).

SunRISE Mapping & Research Grape Industry Analysis Page 8 of 65
Rootstocks
The proportion of Murray Valley grape plantings on a rootstock increased from 30% in 1997 to
71% in 2014 (page 20).
The dominant rootstocks are Ramsey (33% of grape plantings), Schwarzmann (13%) and Paulsen
1103 (10%) (Figure 7).
67% of wine grape plantings are on a rootstock (Figure 25), 69% of dried grape plantings are on a
rootstock (Figure 39) and 81% of table grape plantings are on a rootstock (Figure 54).
Grower numbers and property size
From 1997 to 2014 grower numbers declined from an estimated 2,445 to 1,277 properties, while
average property size (grapevine area) increased by 119%, from 11.1 ha to 24.3 ha per property
(Figure 8).
In 2014, 24% of grape properties were over 20 ha, growing 75% of grape plantings (Figure 9).
31% of properties growing wine grapes also produce table and/or dried grapes (page 38).
43% of properties growing dried grapes also produce wine and/or table grapes (page 50).
25% of properties growing table grapes also produce wine and/or dried grapes (page 64).

SunRISE Mapping & Research Grape Industry Analysis Page 9 of 65
2. Introduction
Mildura Development Corporation has a vision of “Our Region. Our Prosperity.” To achieve this,
it is important that we maintain a detailed understanding of the horticultural commodities that
provide a significant contribution to the prosperity of the region. To that end, Mildura
Development Corporation’s 2013-16 Strategic Plan includes a goal to facilitate regional
innovation and business development, which we do by working with industry and business to
facilitate growth in our region, making economic and statistical research on the region available,
identifying investment opportunities through proactive research, assisting in building vibrant and
sustainable communities by making such research accessible, and supporting innovative alliances
to encourage business development.
Grape industries in the Lower Murray Darling have experienced fluctuating conditions in the
recent decade (wine glut, drought, abnormal climatic events, low water allocations, rocketing of
temporary water prices, flooding, water buyback and exit grants, a high Australian dollar, and
opening of markets in China). Significant changes in planting areas, varieties, water use,
rootstocks, property numbers and size, and irrigation methods are evident across the region’s
horticulture (Mallee CMA 2012 Crop Report and 2012 Irrigated Horticulture of the Lower Murray-
Darling (SunRISE 21, 2012)).
With 31,085 hectares of grapevines planted in the region and a further 10,000 hectares of vacant,
irrigable land that has the potential to be brought back into production, it is critical to collate
accurate and comparative information for sound investment and planning decisions, to assist new
investors coming into the region and existing growers transitioning between wine, table and dried
viticulture, or diversifying to other crop types. In particular, a focus on varietal mix and tonnage
projections, based on current and potential plantings, was required to inform industries’ planning
and marketing strategies.
In 2014 the Mildura Development Corporation in collaboration with Regional Development
Victoria and the three grape industry bodies, contracted SunRISE Mapping and Research to
conduct an industry position analysis of grape crops across the three industry sectors in the
Lower Murray Darling region of Victoria and New South Wales.
The analysis is based on SunRISE crop databases (1997 to 2014) obtained from mapping of
irrigated crops utilising orthophoto imagery (scale accurate, digital, aerial photography), grower
input and industry collaboration.

SunRISE Mapping & Research Grape Industry Analysis Page 10 of 65
2.1 Study area
This report covers grapevine plantings in the Lower Murray Darling region of Victoria and New South
Wales (Figure 1). The study area is referred to as the ‘Murray Valley’ in this report. It encompasses the
Murray Darling and Swan Hill wine regions as well as plantings along the Darling River upstream to
Menindee.
Figure 1: Map of the study area

SunRISE Mapping & Research Grape Industry Analysis Page 11 of 65
2.2 Project background and consultant’s brief
Irrigated horticulture in the Lower Murray Darling is recovering from a decade of extreme
conditions. New export market opportunities are fuelling confidence in the industry, with
redevelopment and new investment occurring across different irrigated commodities, and rapid
expansion particularly in table grape varieties. Accurate and detailed industry data is required to
inform investment and redevelopment. With the promise of modernised irrigation delivery in the
Older Irrigated Areas of Merbein, Mildura and Red Cliffs, this information will be critical to
redevelopment and new investment in viticulture. The launch of the National Food Plan and its
focus on Asia, will also deliver new investment into horticultural production as markets grow into
the next decade.
Changes to plantings in each industry (investments, redevelopment) will underlie the economic
success of each industry. Clarity on plantings is required to inform decision making, paramount to
a sustainable recovery, avoidance of another ‘boom and bust’ scenario, and sustainable growth
within each industry.
Significant changes in planting areas, varieties, water use, rootstocks, property numbers and size,
and irrigation methods are already evident across the region’s horticulture (Mallee CMA 2012
Crop Report and 2012 Irrigated Horticulture of the Lower Murray-Darling (SunRISE 21, 2012))
although those Crop Reports did not provide analysis to the grape variety level. Similarly, data on
grape plantings from the state government, industry bodies and ABS census data are not available
to the variety level.
Each of the Murray Darling grape industry sectors has conducted their own analyses, but not
using consistent types or sources of information.
This report represents the first coordinated analysis of data to the grape variety level, including
irrigation and cultural management details.
The SunRISE crop database includes planting details from 1997 to 2014. The crop mapping
provides accurate areas as it is based on a time series of high resolution orthophoto imagery
(scale accurate, digital, aerial photography). Crop details, such as crop type, area and irrigation
method, are derived from input from irrigators, field surveys and visual interpretation of the
imagery.
The analysis encompasses grape plantings in the lower Murray-Darling region of Victoria and New
South Wales (Figure 1). The region is referred to as the ‘Murray Valley’ in this report.
2014 planting data is compared in this report with data from 1997, 2003, 2006 and 2009.
The Brief
SunRISE Mapping and Research was contracted to collect, collate and report on:
1. grape variety data in collaboration with dried, wine and table grape growers and industry
groups, with at least 80% of each industry surveyed to the variety level
2. changes in plantings between 1997 and 2014, by variety, property numbers & size, vine
ages, irrigation methods, rootstocks and new plantings for each of the three industries
(wine, table & dried)
3. average production and crop (farm gate) values
4. production projections for dominant varieties, and by seasonality for table grapes

SunRISE Mapping & Research Grape Industry Analysis Page 12 of 65
3. Data sources and method
3.1 SunRISE crop data acquisition and accuracy
SunRISE crop mapping
SunRISE crop mapping is based on high resolution orthophoto imagery (i.e. scale accurate digital
imagery processed from aerial photography) which has been updated every three years since
1997.
The scale accurate imagery provides accurate areas. Crop database details such as ownership,
crop type, variety, rootstock, irrigation method and year planted are acquired by a combination
of:
• Interpretation of orthophoto imagery and field surveys
• Preparation of property crop maps for Sunbeam Foods contracted growers
• Preparation of property crop maps for Australia Premium Dried Fruits contracted growers
• Preparation of property crop maps for table grape export registration
• Public domain real estate sales information
• Preparation of property maps for growers for property planning and management;
irrigation design, soil surveys, quality assurance, redevelopment.
65% of the Murray Valley’s 1,277 grape growers have had input to the databases within the last
three years. 90% of growers have been surveyed since inception of the mapping system in 1997.
The imagery is used to identify changes to crops. When a change in planting is identified from
the imagery the crop variety is recorded as ‘not surveyed’ and the approximate year of change
recorded. Hence, crop details for growers who have not been surveyed recently will have crop
variety details recorded for plantings that don’t appear to have changed since the survey and ‘not
surveyed’ recorded for plantings that appear to have changed since the survey.
When details are received for crops previously ‘not surveyed’ the earlier databases are back filled
where relevant.
Orthophoto imagery
Information presented in this report is for the years 1997, 2003, 2006, 2009 and 2014. The
orthophoto imagery used as a map base for each of these years was captured at the start of the
year. Hence the information represents the 1996-97, 2002-03, 2005-06, 2008-09 and 2013-14
irrigation seasons respectively. The imagery is high resolution, generally 35cm or 30cm pixels.
Every crop patch is checked against the imagery time series to ensure changes are correctly
recorded.
The imagery from 1997 to 2009 is the property of SunRISE Mapping and was acquired in
collaboration with regional agencies. 2013 and 2014 imagery was sourced from Google Earth and
from NearMap via a web portal.

SunRISE Mapping & Research Grape Industry Analysis Page 13 of 65
3.2 Source of crop production and crop prices data
Wine grapes
Wine grape production and price data was sourced from public domain data:
• Murray Valley Winegrape Utilisation Survey 1997 (Agriculture Victoria, 1997)
• Murray Valley Winegrape Utilisation Survey 2003 (Department of Primary Industries,
2003),
• Australian Regional Wine Grape Crush Survey Murray Darling, Swan Hill 2006
(Department of Primary Industries, 2006),
• Wine Grape Crush Survey Murray Darling / Swan Hill 2009 (Department of Primary
Industries, 2009)
• Wine Grape Crush Report Murray Darling Swan Hill 2014 (Hickey & Hengsen, 2014)
Dried grapes
Dried grape production and price data was sourced from Sunbeam Foods, and from Horticulture
Australia via Dried Fruits Australia.
Table grapes
Table grape production was estimated based on an assumption of 1,200 vines per hectare
yielding an average of 2 boxes per vine in full production (i.e. 2,400 boxes per hectare or 970
boxes per acre).
Table grape prices were sourced from Ausmarket Consultants (2014) based on average prices
($/box):
• for each grape variety
• for grapes sourced from the Murray Valley (Victoria and NSW)
• for grapes sent to Sydney and Melbourne markets in the months January to April
inclusive, for the years 1997, 2003, 2006, 2009 and 2014

SunRISE Mapping & Research Grape Industry Analysis Page 14 of 65
3.3 Limitations
Extrapolation of SunRISE crop data
Information on grape varieties, irrigation methods, rootstocks and property ownership are
derived from analyses of the SunRISE crop databases and extrapolation for unknown (‘not
surveyed’) records.
At least 80% of crop varieties are recorded for each year (1997, 2003, 2006, 2009 and 2014) with
the exception of:
• 2014 non-bearing wine grape varieties where only 25% of non-bearing varieties are
recorded. The 2014 non-bearing wine grape varieties have not been extrapolated (Figure
12, Figure 14, Figure 13 and Figure 15).
• 2014 non-bearing table grape varieties where only 62% of non-bearing varieties are
recorded. The 2014 non-bearing table grape varieties were still extrapolated (Figure 43).
At least 70% of crop rootstocks are recorded for each year (1997, 2003, 2006, 2009 and 2014)
with the exception of:
• 2009 and 2014 table grape plantings where only 63% and 54% respectively of rootstocks
are recorded. The 2009 and 2014 table grape rootstock data was still extrapolated
(Figure 54).
Areas and varieties of non-bearing plantings (less than three years old) are provided however the
areas are likely to be under-stated as not all new and redeveloped plantings will have been
recorded. SunRISE relies on visual identification of changes to plantings from the imagery and
from information provided by growers.
Multi use varieties
Total areas (hectares) of grapevine plantings for each year in this report are accurate as they are
mapped from scale accurate high resolution imagery. However, the area split for multi-use
varieties, such as Gordo and Sultana, between the three markets (wine, table and dried) can be
subject to error.
Given that there are large areas of multi-use varieties their influence on total wine/dried/table
areas can be significant. Without direct input from a grower on the market for their produce in a
given season, SunRISE uses the history of the growers produce types, trellising details, crop prices
etc. to assess the likely market that the fruit was consigned to.
Also, the imagery provides visual clues as to produce type; such as white plastic covers over table
grapes, smaller canopy on wine grape plantings and the patterning of canopy on a Shaw trellis for
drying is often distinct.
Area harvested versus area planted
Areas (hectares) stated in this report are the areas planted, not the area harvested.
No attempt has been made to determine the proportion of crop not harvested in each of the
seasons presented. Production and crop value estimates are based on all bearing plantings
having been harvested, whereas this is not necessarily the case.
Property numbers
Property numbers are estimates only. In the SunRISE crop databases a ‘property’ is a corporate
entity or family business where the family business can encompass multiple farms and family
members. However, ‘property’ names are entered into the crop database as specified by growers
and they may represent individual family members rather than the family company. This would
suggest that property numbers are over stated in the analysis.

SunRISE Mapping & Research Grape Industry Analysis Page 15 of 65
4. Murray Valley grape plantings 1997 to 2014
4.1 Change in wine, table & dried plantings 1997 to 2014
Figure 2 summarises bearing and non-bearing hectares of wine, table and dried grape plantings
across the Murray Valley from 1997 to 2014.
• New plantings and redevelopment in the vineyard has slowed considerably since 1997. While 22%
of plantings were non-bearing in 1997, only 8% were non-bearing in 2014.
• The largest area of non-bearing plantings in 2014 was table grape plantings (1,670 hectares).
• There were 4,400 hectares of non-bearing wine grape plantings in 2006, despite falling grape
prices; however the ensuing years of continued oversupply, low prices, drought and low water
allocations saw non-bearing wine grape plantings decline to just 530 hectares by 2014. Non-
bearing wine grape plantings in 2014 are predominantly on large corporate holdings.
• The large area (1,135 hectares) of non-bearing dried grape plantings in 2003 is mostly Sultana,
Sunmuscat and Carina plantings coinciding with the removal of over 2,000 hectares of old Sultana
plantings between 1997 and 2003. Possibly income generated from the wine grape boom assisted
redevelopment of dried grape plantings along with conversion to trellis drying.
Figure 2: Hectares of wine, table and dried grape plantings from 1997 to 2014
1997 2003 2006 2009 2014
Grapes 1997 2003 2006 2009 2014 % of 2014
total
Change (ha)
1997-2014
Wine Bearing 9,090 17,260 19,400 19,805 18,220 59% +9,130
Non-bearing 4,640 4,430 4,400 2,120 530 2% -4,110
Table Bearing 4,630 5,840 6,465 6,225 7,085 23% +2,455
Non-bearing 910 1,845 1,575 1,095 1,670 5% +760
Dried Bearing 7,520 4,995 4,835 3,455 3,360 11% -4,160
Non-bearing 430 1,135 400 185 220 1% -210
Total hectares 27,220 35,505 37,075 32,885 31,085 100% +3,865
% Bearing 78% 79% 83% 90% 92%
% Non-bearing 22% 21% 17% 10% 8%
0
5,000
10,000
15,000
20,000
25,000
30,000
35,000
40,000
he
cta
res
Wine non-bearing
Wine bearing
Table non-bearing
Table bearing
Dried non-bearing
Dried bearing

SunRISE Mapping & Research Grape Industry Analysis Page 16 of 65
4.2 Summary of grape varieties 1997 to 2014
Figure 3 lists the main grape varieties grown in the Murray Valley region and the change in
hectares from 1997 to 2014. Significant changes in this period were:
• The area of Sultana/Thompson Seedless plantings decreased by 10,289 hectares. (Over 12,290
hectares of Sultanas were removed as there was at least 2,000 hectares of new Sultana
plantings between 1997 and 2014)
• The area of Crimson Seedless increased by 3,329 hectares
• 52% of plantings in 2014 comprised four varieties; Chardonnay (5,145 ha), Sultana/Thompson
Seedless (4,159 ha), Shiraz (3,576 ha) and Crimson Seedless (3,377 ha)
Figure 3: Summary of changes in grape varieties and areas (hectares) from 1997 to 2014
Variety 1997 2003 2006 2009 2014 % of
2014
Change
1997-2014
Dried Other dried 3 10 35 36 124 0% +121
Multi-
use
Black Muscat 18 22 16 14 15 0% -4
Carina 251 285 413 357 363 1% +112
Flame Seedless 171 170 152 113 173 1% +3
Gordo 1,551 1,262 1,291 1,306 1,004 3% -547
Menindee Seedless 905 1,326 1,266 1,074 915 3% +10
Merbein Seedless 49 36 33 24 15 0% -34
Sultana/Thompson 14,448 10,179 7,499 4,660 4,159 13% -10,289
Sunmuscat 17 364 442 480 606 2% +589
Waltham 282 144 102 48 34 0% -249
Zante 390 205 136 35 26 0% -364
Table
black
Autumn Royal 0 13 243 348 354 1% +354
Other black 88 66 77 68 55 0% -33
Table
red
Crimson Seedless 48 808 1,259 1,889 3,377 11% +3,329
Other red 309 231 297 68 30 0% -279
Ralli Seedless 38 112 122 109 210 1% +171
Red Globe 842 1,513 1,496 1,271 1,042 3% +200
Table Other white 350 400 585 263 151 0% -198
Table PBR varieties1 4 15 52 142 597 2% +593
Wine
red
Cab. Sauvignon 1,077 3,463 3,295 2,990 2,629 8% +1,553
Merlot 379 1,900 2,104 1,907 1,664 5% +1,285
Other red 172 565 564 595 560 2% +388
Pinot Noir 12 136 209 284 292 1% +280
Ruby Cabernet 255 571 444 326 225 1% -30
Shiraz 1,287 3,749 4,280 4,089 3,576 12% +2,290
Wine
white
Chardonnay 3,031 5,784 7,439 6,414 5,145 17% +2,114
Colombard 446 1,050 1,046 1,017 660 2% +214
Other white 352 454 559 704 566 2% +214
Pinot Grigio/Gris 0 38 570 827 808 3% +808
Sauvignon Blanc 99 155 513 892 836 3% +737
Semillon 346 480 535 534 476 2% +129
Wine Not surveyed - - - - 397 1% +397
Total hectares 27,220 35,505 37,075 32,885 31,085 100% +3,865
1 PBR (Plant Breeders’ Rights) in this table refers to proprietary varieties only recently, or still waiting to be, granted
plant variety rights

SunRISE Mapping & Research Grape Industry Analysis Page 17 of 65
4.3 Value of grape production in the Murray Valley
Figure 4 summarises crop values for wine grapes (Figure 22), dried grapes (Figure 36) and table
grapes (Figure 51) and provides an estimate of the total value of the grape industry in the Murray
Valley region from 1997 to 2014.
Crop value of Murray Valley grape production increased by 39% ($101 million); from $261 million
in 1997 to $362 million in 2014.
Wine grapes account for 35% of the 2014 Murray Valley grape crop value, dried grape fruit 9%
and table grapes 56%.
Figure 4: Crop value ($ million) of Murray Valley wine, table and dried grapes 1997 to 2014
1997 2003 2006 2009 2014
Grapes 1997 2003 2006 2009 2014 % of 2014
total
Change
1997-2014
White wine $79.8 $101.6 $87.1 $72.3 $70.3 19% - $9.4
Red wine $23.0 $82.4 $68.3 $66.3 $59.0 16% + $36.1
Total wine value $102.7 $184.0 $155.3 $138.6 $129.4 + $26.6
Sultanas $33.3 $18.2 $27.9 $21.9 $18.8 5% - $14.5
Sunmuscat - $1.2 $2.3 $2.9 $5.5 2% + $4.3
Raisins $3.4 $2.2 $2.1 $2.0 $1.9 1% - $1.5
Currants $4.5 $3.8 $3.4 $3.5 $4.2 1% - $0.3
Other - $0.1 $0.1 $0.0 $0.1 0% + 0.0
Total dried value $41.2 $25.4 $35.9 $30.4 $30.6 - $10.6
White table $90.6 $94.6 $98.8 $73.6 $58.6 16% - $32.0
Red table $25.0 $46.8 $81.3 $94.3 $123.2 34% + $98.2
Black table $1.7 $2.0 $2.4 $12.3 $20.3 6% + $18.6
Total table value $117.3 $143.3 $182.5 $180.3 $202.1 + $84.8
Murray Valley
income ($ million) $261 $353 $374 $349 $362 100% + $101
$103
$184$155 $139 $129
$41
$25$36
$30 $31
$117
$143 $183$180 $202
$0
$100
$200
$300
$400
Va
lue
of
gra
pe
s
($ m
illio
n d
olla
rs)
Total table
Total dried
Total wine

SunRISE Mapping & Research Grape Industry Analysis Page 18 of 65
4.4 Farm gate value of wine, table and dried grapes
Figure 5 shows the change in farm gate value of wine, dried and table grapes from 1997 to 2014.
(Values are summarised from Figure 23, Figure 37 and Figure 52 respectively.)
Farm gate value ($/hectare) represents the gross return to growers before deducting costs of
production. Costs of production are not considered in this analysis (and are not a part of the
project brief), but they vary for wine, dried and table grape production and vary over time having
a significant impact on net income. For instance, while farm gate value of table grapes is much
higher than wine and dried grapes, table grapes have considerably higher production costs
impacting on net income. Information on costs of production can be sourced from relevant
industry groups.
Farm gate value of wine grapes declined by 37%; from $11,300 per hectare in 1997 to $7,100 per
hectare in 2014.
Farm gate values of sultanas, sunmuscats, raisins and currants increased between 1997 and 2014,
with a 66% increase overall for dried grapes.
Farm gate value of white table grapes decreased in the same period by 17%, but red and black
table grapes increased by 31% and 88% respectively.
Figure 5: Farm gate value (weighted average $/hectare) of wine, dried and table grapes
DR
IED
Sultanas $5,031 $4,269 $7,150 $8,749 $8,300 +65% +$3,269
Sunmuscat - $8,289 $6,469 $6,882 $10,313 +24% +$2,024
Raisins $8,048 $8,677 $11,172 $11,709 $10,877 +35% +$2,829
Currants $9,867 $11,171 $9,301 $10,033 $11,326 +15% +$1,460
Other dried - $7,046 $6,782 $14,676 $14,924 +112% +$7,878
$/hectare dried
grapes $5,479 $5,076 $7,422 $8,802 $9,104 +66% +$3,625
TA
BLE
White table $25,409 $27,318 $24,468 $20,145 $21,112 -17% -$4,246
Red table $25,506 $26,304 $31,359 $36,533 $33,295 +31% +$8,224
Black table $21,474 $26,659 $30,577 $33,624 $40,396 +88% +$18,180
$/hectare table
grapes $24,657 $26,728 $28,859 $31,625 $29,425 +19% +$4,768
Grapes 1997 2003 2006 2009 2014 Change 1997-2014
% $/ha
WIN
E White wine $10,127 $12,257 $9,058 $7,089 $7,528 -26% -$2,599
Red wine $18,917 $9,180 $6,975 $6,901 $6,650 -65% -$12,267
$/hectare wine
grapes $11,300 $10,658 $8,007 $6,998 $7,100 -37% - 4,200

SunRISE Mapping & Research Grape Industry Analysis Page 19 of 65
4.5 Change in irrigation methods 1997 to 2014
Figure 6 summarises irrigation methods for grapevines across the Murray Valley from 1997 to
2014.
The dominant irrigation method changed from furrow irrigation to drip irrigation between 1997
and 2003.
89% of grapevines are irrigated with drippers or low-level sprinklers.
Figure 6: Change in irrigation methods for Murray Valley grape plantings from 1997 to 2014
1997 2003 2006 2009 2014
Irrigation
method 1997 2003 2006 2009 2014
% of 2014
total
Change (ha)
1997-2014
Drip 3,880 11,885 16,515 19,950 21,420 69% +17,540
Low level 3,890 7,510 7,860 6,765 6,245 20% +2,355
Overhead 8,450 9,715 8,495 4,625 2,600 8% -5,850
Furrow 11,000 6,395 4,205 1,545 820 3% -10,180
Total (ha) 27,220 35,505 37,075 32,885 31,085 100% +3,865
0
10,000
20,000
30,000
40,000
He
cta
res
Drip
Low level
Overhead
Furrow

SunRISE Mapping & Research Grape Industry Analysis Page 20 of 65
4.6 Change in rootstocks 1997 to 2014
Figure 7 lists rootstocks of grapevine plantings in the Murray Valley study area and shows the
proportion of plantings that are not on a rootstock (29% in 2014). Plantings not on a rootstock
are either on their own roots or have been top-worked on to the roots of the previous variety.
The proportion of plantings on a rootstock increased from 30% in 1997 to 71% in 2014. The
dominant rootstocks are Ramsey (33%), Schwarzmann (13%) and Paulsen 1103 (10% of plantings).
Figure 7: Change in rootstocks of grape plantings from 1997 to 2014
1997 2003 2006 2009 2014
1997 2003 2006 2009 2014 % of 2014
total
Change
1997-2014
Not on rootstock 19,188 17,428 14,667 10,784 8,983 29% -10,205
Dog Ridge 176 433 547 596 689 2% +513
Harmony 299 301 274 208 196 1% -104
Kober 5BB 9 242 300 344 355 1% +346
K51-32 51 119 121 98 87 0% +37
K51-40 127 271 286 263 193 1% +66
101-14 25 128 260 276 304 1% +279
Paulsen 1103 40 1,083 2,362 2,678 3,228 10% +3,187
Ramsey 4,943 9,368 11,070 10,620 10,139 33% +5,195
Richter 99,110 14 59 59 90 98 0% +84
Ruggeri 140 229 1,144 1,632 1,606 1,721 6% +1,493
Schwarzmann 1,571 3,902 4,357 4,208 4,000 13% +2,429
SO4 31 57 80 78 70 0% +39
Teleki 5A,5C 486 918 1,004 979 976 3% +490
Other rootstocks2 32 50 57 56 46 0% +14
Total hectares 27,220 35,505 37,075 32,885 31,085 100% +3,865
% No rootstock 70% 49% 40% 33% 29%
% on a rootstock 30% 51% 60% 67% 71%
2 Other rootstocks: 34EMFoex, 3309 Couderc, Freedom, Riparia Gloire, Rupestris du Lot, Salt Creek
0
5,000
10,000
15,000
20,000
25,000
30,000
35,000
40,000
he
cta
res
Other rootstock
Teleki 5A,5C
SO4
Schwarzmann
Ruggeri 140
Richter 99,110
Ramsey
Paulsen 1103
101-14
K51-40
K51-32
Kober 5BB
Harmony
Dog Ridge
Not on rootstock

SunRISE Mapping & Research Grape Industry Analysis Page 21 of 65
4.7 Change in property numbers and size 1997 to 2014
Figure 8 provides estimates of property numbers and average property size (grapevine area)
across the Murray Valley study area from 1997 to 2014.
• The study area has approximately 1,277 properties growing grapevines for wine, dried and/or table
grape production. Average property size (grapevine area) is 24.3 hectares.
• The average property size (grapevine area) more than doubled; from 11.1 hectares in 1997 to 24.3
hectares in 2014.
• There were 1,168 fewer grape growing properties in 2014 than in 1997; a 48% decline in property
numbers.
• The number of properties below 20 hectares decreased by 1,245 properties, while the number of
properties over 20 hectares increased by 77.
Figure 8: Change in the number and size of grape growing properties 1997 to 2014
1997 2003 2006 2009 2014
Property size
(grapevine area) 1997 2003 2006 2009 2014
% of 2014
total
Change
1997-2014
1 to 5 ha 688 667 626 498 322 25% -366
5 to 10 ha 887 792 705 510 366 29% -521
10 to 20 ha 640 629 551 379 282 22% -358
20 to 40 ha 182 229 214 186 188 15% +6
40 to 100 ha 38 59 65 62 75 6% +37
100 to 500 ha 10 39 42 42 38 3% +28
> 500 ha 1 5 6 6 0% +6
Total properties 2,445 2,416 2,208 1,683 1,277 100% -1,168
Average size (ha) 11.1 14.7 16.8 19.5 24.3
688 667 626 498 322
887 792 705
510
366
640 629
551
379
282
0
500
1,000
1,500
2,000
2,500
Nu
mb
er
of
pro
pe
rtie
s
> 500 ha
100 to 500 ha
50 to 100 ha
20 to 50 ha
10 to 20 ha
5 to 10 ha
1 to 5 ha

SunRISE Mapping & Research Grape Industry Analysis Page 22 of 65
4.7.1 Grape growing properties in 2014
In 2014, 24% of grape properties were over 20 ha, growing 75% of grape plantings (Figure 9).
Figure 9: Grape growing properties in 2014
Property size
(grape area)
2014
Properties
% of total
properties
2014
Hectares
% of total
hectares
1 to 5 ha 322 25% 995 3%
5 to 10 ha 366 29% 2,620 8%
10 to 20 ha 282 22% 4,005 13%
20 to 40 ha 188 15% 5,800 19%
40 to 100 ha 75 6% 5,110 16%
100 to 500 ha 38 3% 8,145 26%
> 500 ha 6 0% 4,410 14%
2014 total 1,277 100% 31,085 100%
31% of properties growing wine grapes also produce table and/or dried grapes (page 38).
43% of properties growing dried grapes also produce wine and/or table grapes (page 50).
25% of properties growing table grapes also produce wine and/or dried grapes (page 64).
4.7.2 Summary of wine, table & dried property numbers and size
Figure 10: Summary of wine, table and dried grape property numbers and average property size
Property numbers 1997 2003 2006 2009 2014 % of 2014
total
Change
1997-2014
Wine grapes 1,414 1,509 1,362 997 667 44% -747
Table grapes 590 667 614 512 443 30% -147
Dried grapes 1,270 928 767 497 397 26% -873
Total properties* 2,445 2,416 2,208 1,683 1,277 100% -1,168
Average property size
(grape ha)
Change 1997-2014
% ha
Properties with wine
grapes 13.2 17.7 20.8 25.2 32.9 + 150% + 19.7
Properties with table
grapes 13.6 17.1 18.3 19.5 23.2 + 71% + 9.6
Properties with dried
grapes 9.9 11.1 11.6 11.7 13.6 + 38% + 3.7
Average size (grape ha) 11.1 14.7 16.8 19.5 24.3
*Note: Total property numbers across the study area are less than the sum of property numbers for
each of the wine, table and dried grape growers as many growers produce across two or more of the
three markets.

SunRISE Mapping & Research Grape Industry Analysis Page 23 of 65
5. Wine grape industry analysis
5.1 Change in wine grape varieties 1997 to 2014
5.1.1 Bearing and non-bearing plantings
Wine grape plantings increased by 5,020 hectares between 1997 and 2014, largely due to the
planting of red wine grape varieties between 1997 and 2003.
The area of wine grape plantings peaked around 2006.
In 1997, 34% of wine grape plantings were non-bearing (i.e. new plantings less than 3 years old)
but by 2014, non-bearing plantings reduced to only 3%.
Figure 11: Change in wine grape plantings (hectares) from 1997 to 2014
1997 2003 2006 2009 2014
Wine grapes 1997 2003 2006 2009 2014 % of 2014
total
Change
1997-2014
White non-bearing 2,530 2,958 3,265 1,505 230 1% -2,300
White bearing 7,877 8,287 9,612 10,204 9,342 50% +1,465
Red non-bearing 2,110 1,472 1,135 615 300 2% -1,810
Red bearing 1,213 8,973 9,788 9,601 8,878 47% +7,665
Total wine grapes (ha) 13,730 21,690 23,800 21,925 18,750 100% +5,020
% Bearing 66% 80% 82% 90% 97%
% Non-bearing 34% 20% 18% 10% 3%
% White grapes 76% 52% 54% 53% 51%
% Red grapes 24% 48% 46% 47% 49%
0
5,000
10,000
15,000
20,000
25,000
he
cta
res
White non-bearing
White bearing
Red non-bearing
Red bearing
SunRISE Mapping & Research Grape Industry Analysis Page 24 of 65
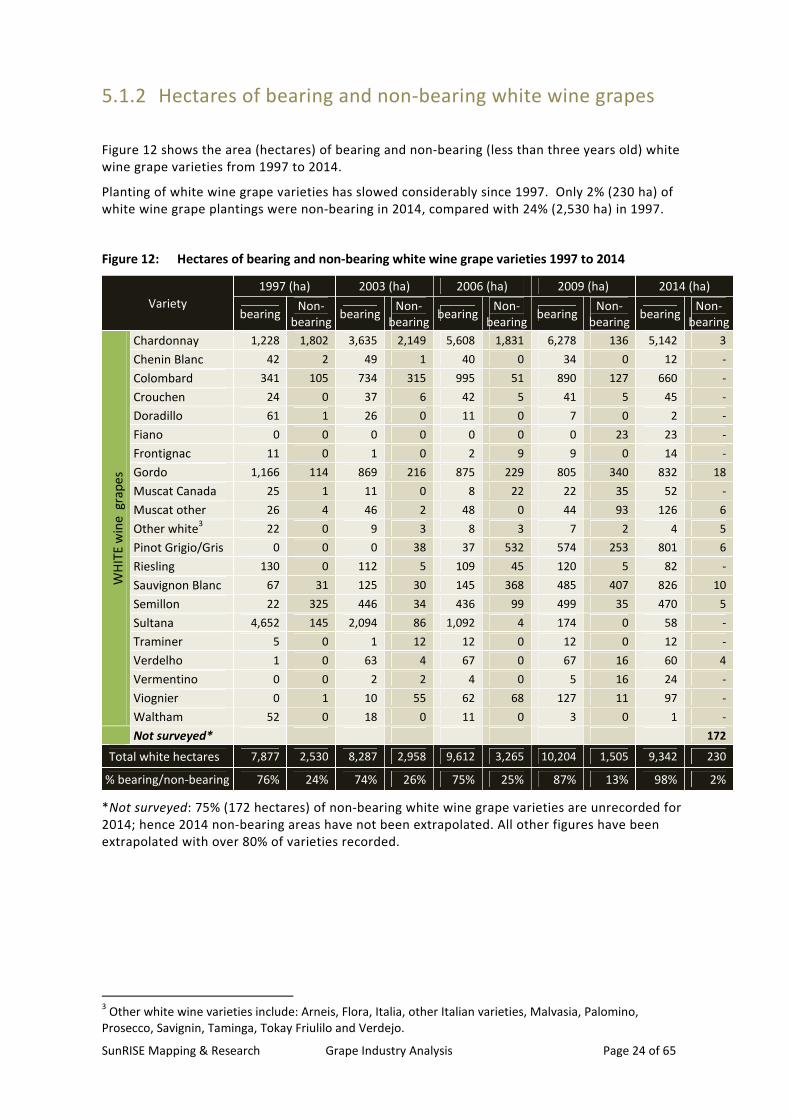
5.1.2 Hectares of bearing and non-bearing white wine grapes
Figure 12 shows the area (hectares) of bearing and non-bearing (less than three years old) white
wine grape varieties from 1997 to 2014.
Planting of white wine grape varieties has slowed considerably since 1997. Only 2% (230 ha) of
white wine grape plantings were non-bearing in 2014, compared with 24% (2,530 ha) in 1997.
Figure 12: Hectares of bearing and non-bearing white wine grape varieties 1997 to 2014
Variety
1997 (ha) 2003 (ha) 2006 (ha) 2009 (ha) 2014 (ha)
bearing Non-
bearing bearing
Non-
bearing bearing
Non-
bearing bearing
Non-
bearing bearing
Non-
bearing
WH
ITE
win
e g
rap
es
Chardonnay 1,228 1,802 3,635 2,149 5,608 1,831 6,278 136 5,142 3
Chenin Blanc 42 2 49 1 40 0 34 0 12 -
Colombard 341 105 734 315 995 51 890 127 660 -
Crouchen 24 0 37 6 42 5 41 5 45 -
Doradillo 61 1 26 0 11 0 7 0 2 -
Fiano 0 0 0 0 0 0 0 23 23 -
Frontignac 11 0 1 0 2 9 9 0 14 -
Gordo 1,166 114 869 216 875 229 805 340 832 18
Muscat Canada 25 1 11 0 8 22 22 35 52 -
Muscat other 26 4 46 2 48 0 44 93 126 6
Other white3 22 0 9 3 8 3 7 2 4 5
Pinot Grigio/Gris 0 0 0 38 37 532 574 253 801 6
Riesling 130 0 112 5 109 45 120 5 82 -
Sauvignon Blanc 67 31 125 30 145 368 485 407 826 10
Semillon 22 325 446 34 436 99 499 35 470 5
Sultana 4,652 145 2,094 86 1,092 4 174 0 58 -
Traminer 5 0 1 12 12 0 12 0 12 -
Verdelho 1 0 63 4 67 0 67 16 60 4
Vermentino 0 0 2 2 4 0 5 16 24 -
Viognier 0 1 10 55 62 68 127 11 97 -
Waltham 52 0 18 0 11 0 3 0 1 -
Not surveyed* 172
Total white hectares 7,877 2,530 8,287 2,958 9,612 3,265 10,204 1,505 9,342 230
% bearing/non-bearing 76% 24% 74% 26% 75% 25% 87% 13% 98% 2%
*Not surveyed: 75% (172 hectares) of non-bearing white wine grape varieties are unrecorded for
2014; hence 2014 non-bearing areas have not been extrapolated. All other figures have been
extrapolated with over 80% of varieties recorded.
3 Other white wine varieties include: Arneis, Flora, Italia, other Italian varieties, Malvasia, Palomino,
Prosecco, Savignin, Taminga, Tokay Friulilo and Verdejo.

SunRISE Mapping & Research Grape Industry Analysis Page 25 of 65
5.1.3 Hectares of bearing and non-bearing red wine grapes
Figure 13 shows the area (hectares) of bearing and non-bearing (less than three years old) red
wine grape varieties from 1997 to 2014.
Planting of red wine grape varieties has slowed considerably since 1997. Only 3% (300 ha) of red
wine grape plantings were non-bearing in 2014, compared with 63% (2,110 ha) in 1997.
Figure 13: Hectares of bearing and non-bearing red wine grape varieties 1997 to 2014
Variety
1997 (ha) 2003 (ha) 2006 (ha) 2009 (ha) 2014 (ha)
bearing Non-
bearing bearing
Non-
bearing bearing
Non-
bearing bearing
Non-
bearing bearing
Non-
bearing
RE
D w
ine
gra
pe
s
Black Muscat 10 0 7 6 8 0 5 0 6 -
Cab. Sauvignon 349 727 3,203 260 3,255 40 2,868 122 2,594 35
Carina, Zante 123 8 48 0 16 2 20 0 1 -
Chambourcin 9 3 9 0 5 0 5 0 3 -
Cienna 0 0 0 30 29 18 47 0 43 -
Dolcetto 0 0 8 4 12 0 12 0 5 -
Durif 0 0 2 12 15 9 24 0 19 -
Graciano 0 0 0 0 0 0 0 8 8 -
Grenache 81 5 52 18 53 8 46 0 36 -
Malbec 2 0 11 0 11 5 12 0 17 12
Mataro 19 2 21 36 49 2 40 0 31 -
Merlot 80 299 1,658 242 1,833 271 1,896 11 1,657 7
Montepulciano 0 0 0 0 0 0 0 7 15 -
Nebbiolo 0 0 7 4 11 0 8 0 8 -
Negro Amaro 0 0 0 0 0 0 0 9 9 -
Nero d'Avola 0 0 0 0 0 0 0 10 12 4
Other red4 7 1 4 7 10 3 11 5 14 -
Petit Verdot 0 0 63 110 159 0 139 45 162 -
Pinot Noir 6 6 69 66 135 74 207 77 292 -
Red Frontignac 0 0 0 0 0 0 0 8 8 -
Rubired 21 0 17 0 0 0 0 8 7 12
Ruby Cabernet 140 114 529 43 438 6 326 0 225 -
Sagrantino 1 0 1 0 1 4 4 0 7 -
Sangiovese 1 2 69 44 89 7 76 0 68 -
Shiraz 345 942 3,179 569 3,630 651 3,817 272 3,570 6
Tarrango 19 0 15 12 21 9 4 0 4 -
Tempranillo 0 0 0 9 9 25 34 33 57 -
Not surveyed* 225
Total red (ha) 1,213 2,110 8,973 1,472 9,788 1,135 9,601 615 8,878 300
% Bearing/non-bearing 37% 63% 86% 14% 90% 10% 94% 6% 97% 3%
*Not surveyed: 75% (225 hectares) of non-bearing red wine grape varieties are unrecorded for
2014; hence these figures have not been extrapolated. All other figures have been extrapolated
with over 80% of varieties recorded.
4 Other red varieties includes; Barbera, Cabernet Franc, Gamay, Italian varieties, Lagrein, Lambrusco Maestri,
Tannat, Touriga and Zinfandal

SunRISE Mapping & Research Grape Industry Analysis Page 26 of 65
5.1.4 White wine grape varieties
Figure 14 shows the total area (bearing plus non-bearing hectares (Figure 12)) of white wine
grape varieties and change from 1997 to 2014.
The dominant white wine varieties Chardonnay (54%), Gordo (9%), Sauvignon Blanc (9%), Pinot
Grigio (8%), Colombard (7%) and Semillon (5%) make up 92% of the 2014 planted area of white
wine grapes.
White wine grape plantings decreased by 835 hectares between 1997 and 2014.
Figure 14: Area (hectares) planted to white wine grape varieties 1997 to 2014
Variety 1997 2003 2006 2009 2014 % of 2014
total white
Change
1997-2014
WH
ITE
win
e g
rap
es
Chardonnay 3,031 5,784 7,439 6,414 5,145 54% +2,114
Chenin Blanc 44 50 40 34 12 0% -32
Colombard 446 1,050 1,046 1,017 660 7% +214
Crouchen 24 43 47 47 45 0% +21
Doradillo 63 26 11 7 2 0% -61
Fiano - - - 23 23 0% +23
Frontignac 11 2 10 9 14 0% +3
Gordo 1,280 1,084 1,104 1,145 850 9% -429
Muscat Canada 25 11 30 58 52 1% +26
Muscat other 30 48 48 137 132 1% +102
Other white5 23 12 11 9 9 0% -14
Pinot Grigio / Gris - 38 570 827 808 8% +808
Riesling 130 116 154 126 82 1% -49
Sauvignon Blanc 99 155 513 892 836 9% +737
Semillon 346 480 535 534 476 5% +129
Sultana 4,797 2,180 1,096 174 58 1% -4,739
Traminer 5 12 12 12 12 0% +7
Verdelho 1 67 67 83 64 1% +62
Vermentino - 4 5 21 24 0% +24
Viognier 1 65 129 138 97 1% +97
Waltham 52 18 11 3 1 0% -51
Not surveyed - - - - 172 2% +172
Total white (ha) 10,407 11,246 12,877 11,709 9,572 100% -835
% Bearing 76% 74% 75% 87% 98%
% Non-bearing 24% 26% 25% 13% 2%
5 Other white wine varieties include: Arneis, Flora, Italia, other Italian varieties, Malvasia, Palomino,
Prosecco, Savignin, Taminga, Tokay Friulilo and Verdejo.
SunRISE Mapping & Research Grape Industry Analysis Page 27 of 65
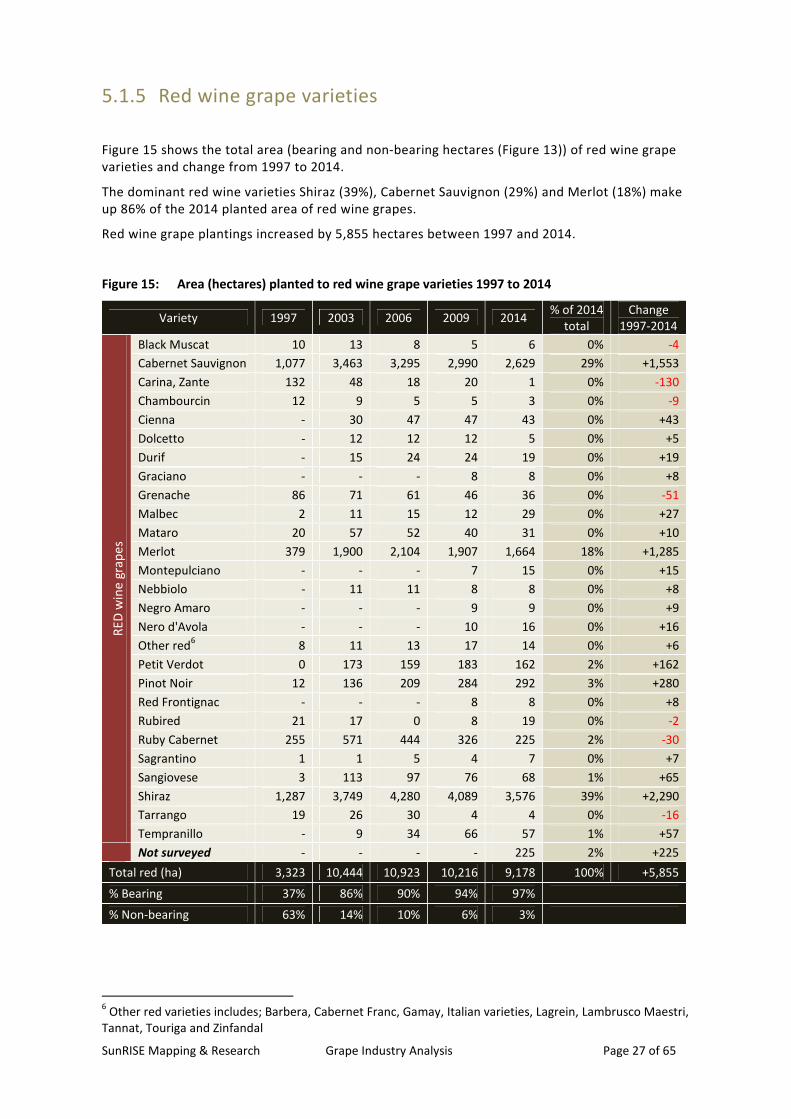
5.1.5 Red wine grape varieties
Figure 15 shows the total area (bearing and non-bearing hectares (Figure 13)) of red wine grape
varieties and change from 1997 to 2014.
The dominant red wine varieties Shiraz (39%), Cabernet Sauvignon (29%) and Merlot (18%) make
up 86% of the 2014 planted area of red wine grapes.
Red wine grape plantings increased by 5,855 hectares between 1997 and 2014.
Figure 15: Area (hectares) planted to red wine grape varieties 1997 to 2014
Variety 1997 2003 2006 2009 2014 % of 2014
total
Change
1997-2014
RE
D w
ine
gra
pe
s
Black Muscat 10 13 8 5 6 0% -4
Cabernet Sauvignon 1,077 3,463 3,295 2,990 2,629 29% +1,553
Carina, Zante 132 48 18 20 1 0% -130
Chambourcin 12 9 5 5 3 0% -9
Cienna - 30 47 47 43 0% +43
Dolcetto - 12 12 12 5 0% +5
Durif - 15 24 24 19 0% +19
Graciano - - - 8 8 0% +8
Grenache 86 71 61 46 36 0% -51
Malbec 2 11 15 12 29 0% +27
Mataro 20 57 52 40 31 0% +10
Merlot 379 1,900 2,104 1,907 1,664 18% +1,285
Montepulciano - - - 7 15 0% +15
Nebbiolo - 11 11 8 8 0% +8
Negro Amaro - - - 9 9 0% +9
Nero d'Avola - - - 10 16 0% +16
Other red6 8 11 13 17 14 0% +6
Petit Verdot 0 173 159 183 162 2% +162
Pinot Noir 12 136 209 284 292 3% +280
Red Frontignac - - - 8 8 0% +8
Rubired 21 17 0 8 19 0% -2
Ruby Cabernet 255 571 444 326 225 2% -30
Sagrantino 1 1 5 4 7 0% +7
Sangiovese 3 113 97 76 68 1% +65
Shiraz 1,287 3,749 4,280 4,089 3,576 39% +2,290
Tarrango 19 26 30 4 4 0% -16
Tempranillo - 9 34 66 57 1% +57
Not surveyed - - - - 225 2% +225
Total red (ha) 3,323 10,444 10,923 10,216 9,178 100% +5,855
% Bearing 37% 86% 90% 94% 97%
% Non-bearing 63% 14% 10% 6% 3%
6 Other red varieties includes; Barbera, Cabernet Franc, Gamay, Italian varieties, Lagrein, Lambrusco Maestri,
Tannat, Touriga and Zinfandal

SunRISE Mapping & Research Grape Industry Analysis Page 28 of 65
5.2 Wine grape production 1997 to 2014
Estimates of wine grape yields (tonnes/hectare) in the Murray Valley study area were derived by
dividing tonnages reported in annual Wine Grape Crush Surveys7 by hectares of bearing vines
from SunRISE crop mapping (Figure 12 and Figure 13).
The average yield in 2014 across all varieties was 23 tonnes/ha, and ranged from 18 to 23
tonnes/ha in the seasons 1997, 2003, 2006 and 2009 (Figure 16). The yield averages are slightly
higher than those reported previously (19 tonnes/ha; Martin, Dunn, & Krstic (2007), or 20
tonnes/ha (range 5 to 43 tonnes/ha); Retallack (2012)).
Note that the average yields in Figure 16 are derived from bearing plantings across corporate,
contracted and uncontracted vineyards. The estimate assumes that:
• All bearing vines were harvested; whereas each season some crop is not harvested due to
being uncontracted or damaged for example by drought, heat damage, flooding or
moulds.
• Vines less than three years old are not harvested (although there may be some small
crop).
Note also that the Wine Grape Crush Survey may slightly over or under-represent intake in the
earlier surveys because not all wineries submit their data, and some Murray Valley fruit is
crushed by wineries outside the survey or wineries bring fruit in from outside the Murray Valley
study area.
Figure 16: Average yield (tonnes/hectare) from bearing wine grape plantings 1997 to 2014
1997 2003 2006 2009 2014
Wine grapes 1997 2003 2006 2009 2014 Change 1997-2014
% t/ha
White 22.9 20.7 24.5 20.8 25.3 + 11% + 2.5
Red 23.3 15.7 18.4 17.0 19.9 - 15% - 3.4
Average tonnes/ha 22.9 18.1 21.4 18.9 22.7 - 1% - 0.2
7 Wine Grape Crush Survey data compiled and published on behalf of Murray Valley Winegrowers Inc. by
Agriculture Victoria (1997), Department of Primary Industries (2003), Department of Primary Industries
(2006), Department of Primary Industries (2009) and Hickey & Hengsen (2014).
10
15
20
25
30
yie
ld (
ton
ne
s/h
ect
are
)
whites
reds
total

SunRISE Mapping & Research Grape Industry Analysis Page 29 of 65
5.3 Wine grape plantings yet to come into production
Only 530 hectares (3%) of wine grape plantings were non-bearing in 2014 (less than three years
old), and these were predominantly planted on large corporate holdings. The non-bearing
plantings will come into production in 2015-2017.
Figure 17 provides an indication of the tonnages (11,801 tonnes) that the 2014 non-bearing
plantings will contribute once they reach full production. The tonnages are estimates based on
2014 average yields as per Figure 16.
Production from the 2014 non-bearing plantings represents a 3% increase on the 2014 production
(413,627 tonnes) from bearing plantings.
Figure 17: Projected tonnage from wine grape plantings that were non-bearing in 2014
2014
Bearing
(ha)
2014 Non-
bearing
(ha)
Production from
2014 Wine Grape
Crush Report
(tonnes)
Projected production
from 2014 non-
bearing plantings
(tonnes)
White wine grapes 9,342 230 236,803 5,820
Red wine grapes 8,878 300 176,824 5,981
Total hectares 18,220 530
Production estimate (tonnes) 413,627 11,801

SunRISE Mapping & Research Grape Industry Analysis Page 30 of 65
5.4 Wine grape prices 1997 to 2014
Price ($/tonne) data presented in Figure 18 is sourced from Wine Grape Crush Reports 1997 to
2014. The prices are averages that include purchased grapes as well as winery grown grapes.
Prices for wine grapes purchased from the Murray Valley decreased by 59% for red grape
varieties and by 33% for white grape varieties between 1997 and 2014.
Figure 18: Weighted average price ($/tonne) for wine grapes from the Murray Valley
1997 2003 2006 2009 2014
Wine grapes 1997 2003 2006 2009 2014 Change 1997-2014
% $
White $ 443 $ 591 $ 369 $ 341 $ 297 - 33 % -$ 146
Red $ 811 $ 586 $ 379 $ 407 $ 334 - 59 % -$ 477
Weighted average
($/tonne) $ 493 $ 589 $ 373 $ 370 $ 313 - 37 % -$ 180
$200
$300
$400
$500
$600
$700
$800
$900
pri
ce
$/t
on
ne
white varieties
red varieties
all varieties.

SunRISE Mapping & Research Grape Industry Analysis Page 31 of 65
5.4.1 Average prices for white wine grape varieties
Average prices ($/tonne) for white wine grapes grown in the Murray Valley (Figure 19) were
collated from annual Wine Grape Crush Surveys.
The weighted average price for white varieties has decreased by $146/tonne since 1997.
Figure 19: Average prices ($/tonne) for white wine grape varieties 1997 to 2014
1997 2003 2006 2009 2014
White varieties 1997 2003 2006 2009 2014 % of 2014
crush
Change8
1997-2014
Chardonnay $1,024 $867 $382 $293 $242 45% -$782
Chenin Blanc $431 $373 $337 $460 $239 0% -$192
Colombard $393 $366 $301 $283 $251 6% -$143
Crouchen $584 $483 $496 $444 $414 1% -$170
Doradillo $206 $258 - -
Fiano $397 1% $397
Frontignac $88 $383 $287 0% $199
Gordo $356 $353 $350 $366 $279 11% -$78
Muscat $1,133 $694 $356 3% -$777
Other white9 $193 $300 $416 $395 $314 0% $120
Pinot Gris $687 $677 $611 $455 14% -$232
Riesling $424 $505 $395 $381 $481 1% $57
Sauvignon Blanc $395 $523 $502 $456 $354 12% -$41
Semillon $528 $483 $378 $309 $233 5% -$296
Sultana $269 $309 $263 $272 $194 0% -$75
Traminer $259 $610 $246 $209 0% -$50
Verdelho $416 $328 $274 $347 0% -$69
Viognier $1,014 $542 $389 $348 1% -$666
Waltham $260 $287 - -
Weighted
average $/tonne $ 443 $ 591 $ 369 $ 341 $ 297 100% -$ 146
8 The change is measured from 2003 if there was no intake reported for a particular variety in 1997.
9 Other white wine varieties include: Arneis, Flora, Italia, other Italian varieties, Malvasia, Palomino,
Prosecco, Savignin, Taminga, Tokay Friulilo and Verdejo
$100
$200
$300
$400
$500
$600
$700
$800
$900
$1,000
$1,100
pri
ce
$/t
on
ne
Chardonnay
Chenin Blanc
Colombard
Crouchen
Gordo
Other white
Pinot Gris
Riesling
SauvignonBlanc
Semillon
Sultana
Viognier
Verdelho

SunRISE Mapping & Research Grape Industry Analysis Page 32 of 65
5.4.2 Average prices for red wine grape varieties
Average prices paid for red wine grapes grown in the Murray Valley (Figure 20) were collated
from annual Wine Grape Crush Reports.
The weighted average price for red varieties has decreased by $477/tonne since 1997.
Figure 20: Average prices paid for red wine grape varieties ($/tonne) 1997 to 2014
1997 2003 2006 2009 2014
Red varieties 1997 2003 2006 2009 2014 % of 2014
crush
Change
1997-2014
Cab. Sauvignon $1,051 $538 $362 $413 $328 27% -$722
Cienna $576 0% -
Grenache $578 $447 $356 $453 $249 0% -$329
Malbec $695 $485 $409 $360 0% -$335
Mataro $723 $320 $262 $238 $315 0% -$408
Merlot $982 $596 $385 $381 $349 19% -$633
Other reds10
$431 $510 $472 $321 $461 0% +$30
Petit Verdot $464 $321 $392 $290 2% -$174
Pinot Noir $682 $509 $448 $475 $366 3% -$315
Red Frontignac $841 $597 0% -$244
Ruby Cabernet $848 $513 $270 $500 $422 2% -$91
Sangiovese $494 $269 $402 $347 0% -$147
Shiraz $1,023 $657 $399 $416 $323 44% -$700
Tempranillo $513 $396 $460 $290 1% -$224
Weighted average
$/tonne $ 811 $ 586 $ 379 $ 407 $ 334 100% -$ 477
10
Other red varieties includes; Barbera, Cabernet Franc, Gamay, Italian varieties, Lagrein, Lambrusco
Maestri, Tannat, Touriga and Zinfandal
$200
$300
$400
$500
$600
$700
$800
$900
$1,000
$1,100
pri
ce
$/t
on
ne
Cabernet Sauvignon
Grenache
Malbec
Merlot
Other red varieties
Petit Verdot
PinotNoir
RubyCabernet
Sangiovese
Shiraz
Tempranillo

SunRISE Mapping & Research Grape Industry Analysis Page 33 of 65
5.4.3 Pricing and wine grape planting trends
High prices for red wine grapes in the late 1990s coincides with a surge in planting of red wine
grape varieties in the Murray Valley between 1997 and 2003. Hectares peaked in 2006 although
prices were very low by 2006.
Similarly, an increase in the average price for white wine grapes between 1997 and 2003 was
followed by an increase in white wine grape plantings that continued to 2006. Wine grape
planted areas have retracted since 2006 coinciding with stable but low average prices.
Figure 21: Trends in the planted hectares of Murray Valley wine grapes as prices fluctuate
1997 2003 2006 2009 2014
1997 2003 2006 2009 2014 Change 1997-
2014
Wh
ite
Hectares 10,407 11,246 12,877 11,709 9,572 - 835 ha
Price ($/t) $ 443 $ 591 $ 369 $ 341 $ 297 -$ 146
Re
d Hectares 3,323 10,444 10,923 10,216 9,178 + 5,855 ha
Price ($/t) $ 811 $ 586 $ 379 $ 407 $ 334 -$ 477
$443
$591
$369$341
$297
-
2,000
4,000
6,000
8,000
10,000
12,000
14,000
$0
$300
$600
$900
he
cta
res
pla
nte
d (
be
ari
ng
an
d
no
n b
ea
rin
g)
retu
rn (
$/t
on
ne
)
$811
$586
$379 $407$334
-
2,000
4,000
6,000
8,000
10,000
12,000
14,000
$0
$300
$600
$900
he
cta
res
pla
nte
d (
be
ari
ng
an
d n
on
be
ari
ng
)
retu
rn (
$/t
on
ne
)
SunRISE Mapping & Research Grape Industry Analysis Page 34 of 65
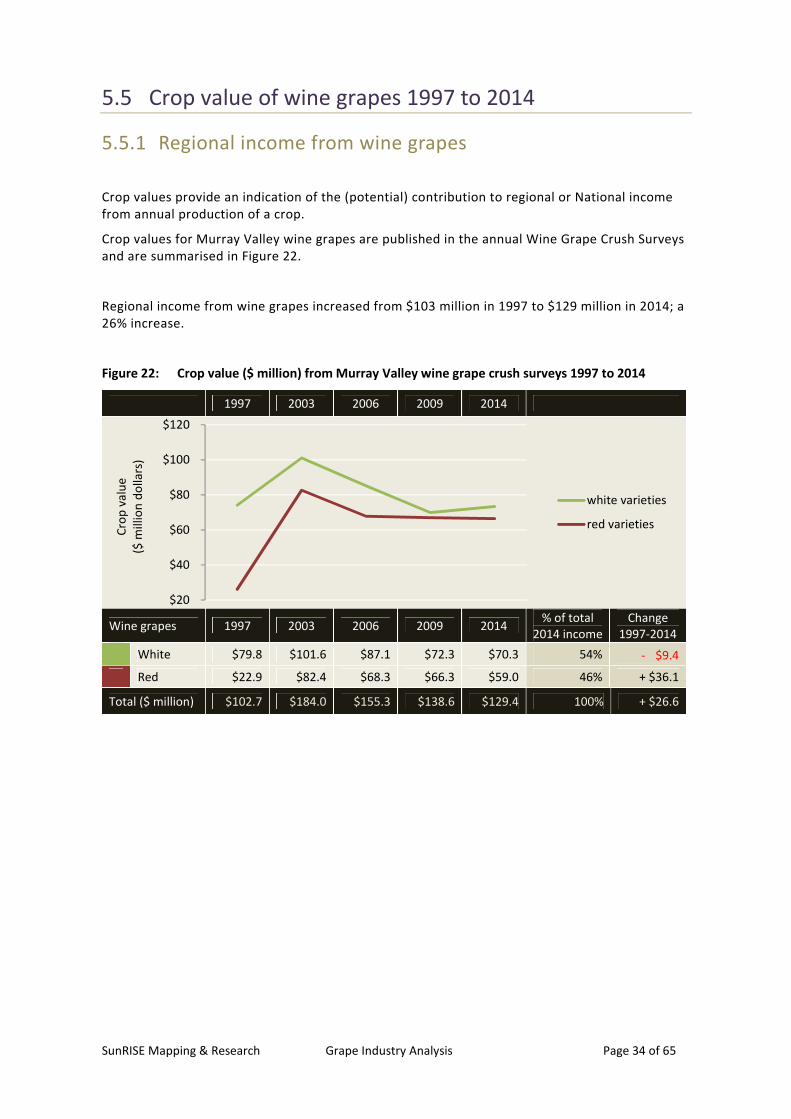
5.5 Crop value of wine grapes 1997 to 2014
5.5.1 Regional income from wine grapes
Crop values provide an indication of the (potential) contribution to regional or National income
from annual production of a crop.
Crop values for Murray Valley wine grapes are published in the annual Wine Grape Crush Surveys
and are summarised in Figure 22.
Regional income from wine grapes increased from $103 million in 1997 to $129 million in 2014; a
26% increase.
Figure 22: Crop value ($ million) from Murray Valley wine grape crush surveys 1997 to 2014
1997 2003 2006 2009 2014
Wine grapes 1997 2003 2006 2009 2014 % of total
2014 income
Change
1997-2014
White $79.8 $101.6 $87.1 $72.3 $70.3 54% - $9.4
7 Red $22.9 $82.4 $68.3 $66.3 $59.0 46% + $36.1
Total ($ million) $102.7 $184.0 $155.3 $138.6 $129.4 100% + $26.6
$20
$40
$60
$80
$100
$120
Cro
p v
alu
e
($ m
illio
n d
olla
rs)
white varieties
red varieties
SunRISE Mapping & Research Grape Industry Analysis Page 35 of 65
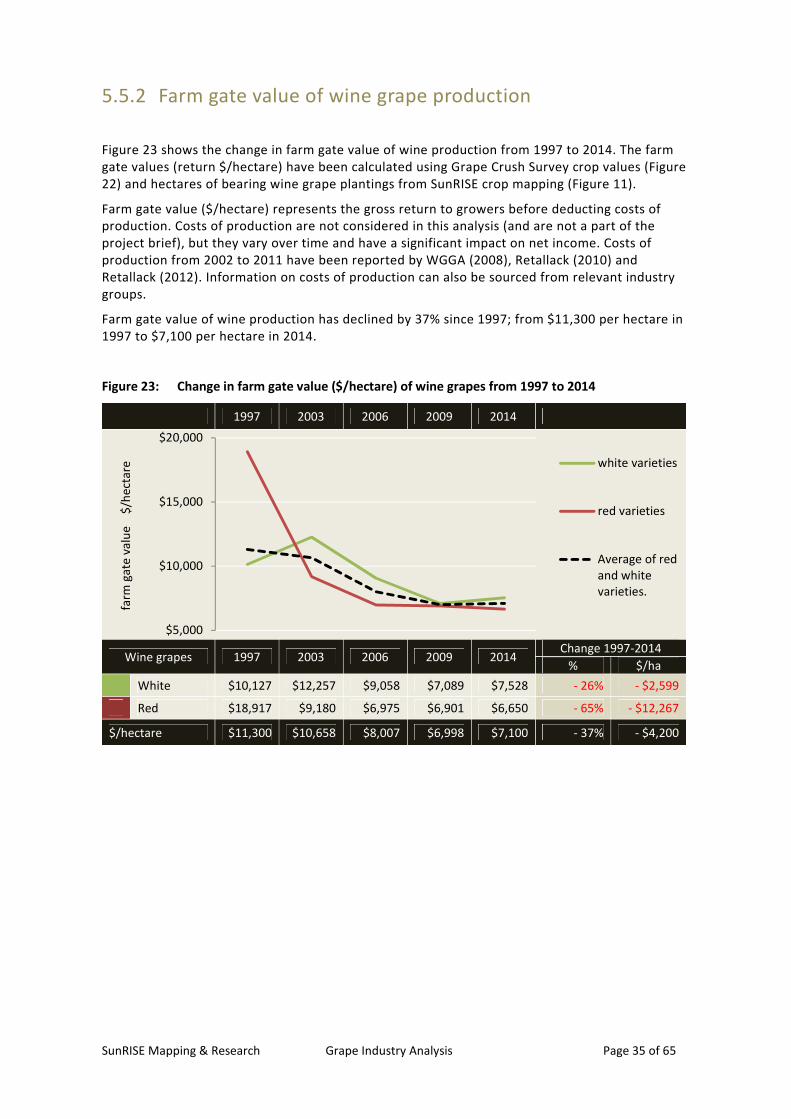
5.5.2 Farm gate value of wine grape production
Figure 23 shows the change in farm gate value of wine production from 1997 to 2014. The farm
gate values (return $/hectare) have been calculated using Grape Crush Survey crop values (Figure
22) and hectares of bearing wine grape plantings from SunRISE crop mapping (Figure 11).
Farm gate value ($/hectare) represents the gross return to growers before deducting costs of
production. Costs of production are not considered in this analysis (and are not a part of the
project brief), but they vary over time and have a significant impact on net income. Costs of
production from 2002 to 2011 have been reported by WGGA (2008), Retallack (2010) and
Retallack (2012). Information on costs of production can also be sourced from relevant industry
groups.
Farm gate value of wine production has declined by 37% since 1997; from $11,300 per hectare in
1997 to $7,100 per hectare in 2014.
Figure 23: Change in farm gate value ($/hectare) of wine grapes from 1997 to 2014
1997 2003 2006 2009 2014
Wine grapes 1997 2003 2006 2009 2014 Change 1997-2014
% $/ha
White $10,127 $12,257 $9,058 $7,089 $7,528 - 26% - $2,599
Red $18,917 $9,180 $6,975 $6,901 $6,650 - 65% - $12,267
$/hectare $11,300 $10,658 $8,007 $6,998 $7,100 - 37% - $4,200
$5,000
$10,000
$15,000
$20,000
farm
ga
te v
alu
e
$/h
ect
are white varieties
red varieties
Average of red
and white
varieties.

SunRISE Mapping & Research Grape Industry Analysis Page 36 of 65
5.6 Irrigation methods for wine grape plantings
Figure 24 summarises irrigation methods for wine grape plantings from 1997 to 2014.
The dominant irrigation method changed from furrow irrigation to drip irrigation between 1997
and 2003.
81% of wine grape plantings are drip irrigated.
Figure 24: Change in irrigation methods for wine grape plantings from 1997 to 2014
1997 2003 2006 2009 2014
Irrigation
method 1997 2003 2006 2009 2014
% of 2014
total
Change (ha)
1997-2014
Drip 2,990 9,200 12,900 15,885 15,190 81% +12,200
Low level 1,090 2,730 2,750 1,950 1,290 7% +200
Overhead 6,000 7,630 6,900 3,750 2,160 12% -3,840
Furrow 3,650 2,130 1,250 340 110 1% -3,540
Total (ha) 13,730 21,690 23,800 21,925 18,750 100% +5,020
0
5,000
10,000
15,000
20,000
25,000
He
cta
res
Drip
Low level
Overhead
Furrow

SunRISE Mapping & Research Grape Industry Analysis Page 37 of 65
5.7 Rootstocks of wine grape plantings 1997 to 2014
Figure 25 lists rootstocks of wine grape plantings in the Murray Valley study area and shows the
proportion of plantings that are not on a rootstock (33% in 2014). Plantings not on a rootstock
are either on their own roots or have been top worked on to the roots of the previous variety.
The proportion of plantings on a rootstock increased from 37% in 1997 to 67% in 2014. The
dominant rootstocks are; Ramsey (30% of plantings), Schwarzmann (12% of plantings), Paulsen
1103 (8% of plantings) and Ruggeri (7% of plantings).
Figure 25: Change in rootstocks of wine grape plantings from 1997 to 2014
1997 2003 2006 2009 2014
1997 2003 2006 2009 2014 % of 2014
total
Change
1997-2014
Not on a rootstock 8,697 9,817 9,005 7,333 6,247 33% -2,449
Dog Ridge 86 209 293 342 318 2% +232
Harmony 149 140 125 82 66 0% -83
Kober 5BB 8 185 232 269 248 1% +240
K51-32 31 99 102 81 64 0% +33
K51-40 114 252 269 249 172 1% +57
101-14 23 125 252 264 266 1% +243
Paulsen 1103 25 676 1,533 1,727 1,477 8% +1,452
Ramsey 2,955 5,696 6,986 6,731 5,698 30% +2,744
Richter 99,110 11 56 55 69 75 0% +63
Ruggeri 140 220 1,062 1,337 1,425 1,362 7% +1,142
Schwarzmann 1,073 2,740 2,913 2,682 2,206 12% +1,133
SO4 31 56 79 78 70 0% +39
Teleki 5A,5C 293 548 589 568 464 2% +171
Other rootstocks 15 29 31 25 18 0% +3
Total hectares 13,730 21,690 23,800 21,925 18,750 100% +5,020
% No rootstock 63% 45% 38% 33% 33%
% on a rootstock 37% 55% 62% 67% 67%
0
5,000
10,000
15,000
20,000
25,000
he
cta
res
Other rootstock
Teleki 5A,5C
SO4
Schwarzmann
Ruggeri 140
Richter 99,110
Ramsey
Paulsen 1103
101-14
K51-40
K51-32
Kober
Harmony
Dog Ridge
Not on rootstock

SunRISE Mapping & Research Grape Industry Analysis Page 38 of 65
5.8 Wine grape property numbers and size 1997 to 2014
Figure 26 provides an estimate of the number of wine grape growers and their average property
size. Property size is the total hectares of grapevines, including table and dried grape plantings.
Figure 26: Change in property numbers and size of wine grape properties from 1997 to 2014
1997 2003 2006 2009 2014
Property size
(grape area) 1997 2003 2006 2009 2014
% of 2014
total
Change
1997-2014
1 to 5 ha 342 354 313 234 141 21% -201
5 to 10 ha 453 442 401 295 172 26% -281
10 to 20 ha 429 443 394 245 154 23% -275
20 to 40 ha 147 182 156 133 110 16% -37
40 to 100 ha 34 53 56 50 55 8% +21
100 to 500 ha 9 34 37 34 28 4% +19
> 500 ha 1 5 6 7 1% +7
Total properties 1,414 1,509 1,362 997 667 100% -747
Average size (ha) 13.2 17.7 20.8 25.2 32.9
In 2014, there were 667 wine grape properties with a total of 21,915 hectares of grapevines. 31%
(205) of the 667 wine grape properties also produced table and/or dried grapes. Production
across the 21,915 hectares of grapevines comprised 1,560 hectares dried, 1,605 hectares fresh
table grapes and 18,750 hectares wine grapes.
30% of wine grape properties are over 20 ha and grow 82% of the grape plantings (Figure 27).
Figure 27: Wine grape properties in 2014
Property
size(grape area)
2014
Properties
% of total
properties
2014
Hectares
% of total
hectares
1 to 5 ha 141 21% 445 2%
5 to 10 ha 172 26% 1,225 6%
10 to 20 ha 154 23% 2,185 10%
20 to 40 ha 110 17% 3,425 16%
40 to 100 ha 55 8% 3,705 17%
100 to 500 ha 28 4% 5,960 27%
> 500 ha 7 1% 4,970 23%
2014 total 667 100% 21,915 100%
342 354 313 234 141
453 442 401
295
172
429 443 394
245
154
0
200
400
600
800
1,000
1,200
1,400
1,600
Nu
mb
er
of
pro
pe
rtie
s
> 500 ha
100 to 500 ha
50 to 100 ha
20 to 50 ha
10 to 20 ha
5 to 10 ha
1 to 5 ha

SunRISE Mapping & Research Grape Industry Analysis Page 39 of 65
6. Dried grape industry analysis
6.1 Change in dried grape varieties 1997 to 2014
In 1997, 2009 and 2014 the proportion of non-bearing areas (less than 3 years old) was 5% to 6%
(Figure 28). The relatively high proportion (19%) of non-bearing areas in 2003 was due to large
plantings of Sultanas as well as new plantings of Carina currants and Sunmuscat.
Further details on the 6% of non-bearing dried grape plantings in 2014 are provided in Figure 33.
Figure 28: Summary of bearing and non-bearing dried grape plantings
1997 2003 2006 2009 2014
1997 2003 2006 2009 2014 % of 2014
total
Change
1997-2014
Cu
rra
nt
Bearing 456 336 370 350 369 10% -88
Non-bearing 53 107 160 22 19 1% -34
Ra
isin
Bearing 420 255 190 174 179 5% -241
Non-bearing 23 10 58 22 3 0% -21
Sult
an
a
typ
es Bearing 6,623 4,254 3,907 2,504 2,270 63% -4,353
Non-bearing 344 795 114 82 124 3% -220
Sun
mu
sca
t
Bearing 7 140 360 425 535 15% +528
Non-bearing 10 222 68 55 71 2% +61
Oth
er1
1
Bearing 13 9 9 2 7 0% -6
Non-bearing 0 1 0 4 5 0% +5
Total (ha) 7,950 6,130 5,235 3,640 3,580 100% -4,370
% Bearing 95% 81% 92% 95% 94%
% Non-bearing 5% 19% 8% 5% 6%
11
Other dried varieties include; Bruce’s Sport, Flame Seedless, Grants, Hannaman Currant, Italia Muscat,
Ruby Seedless
0
1,000
2,000
3,000
4,000
5,000
6,000
7,000
8,000
He
cta
res
Currant non-bear
Currant bearing
Raisin non-bear
Raisin bearing
Sultana non-bear
Sultana bearing
Sunmuscat non-b
Sunmuscat bearing
Other non-bearing
Other bearing
SunRISE Mapping & Research Grape Industry Analysis Page 40 of 65
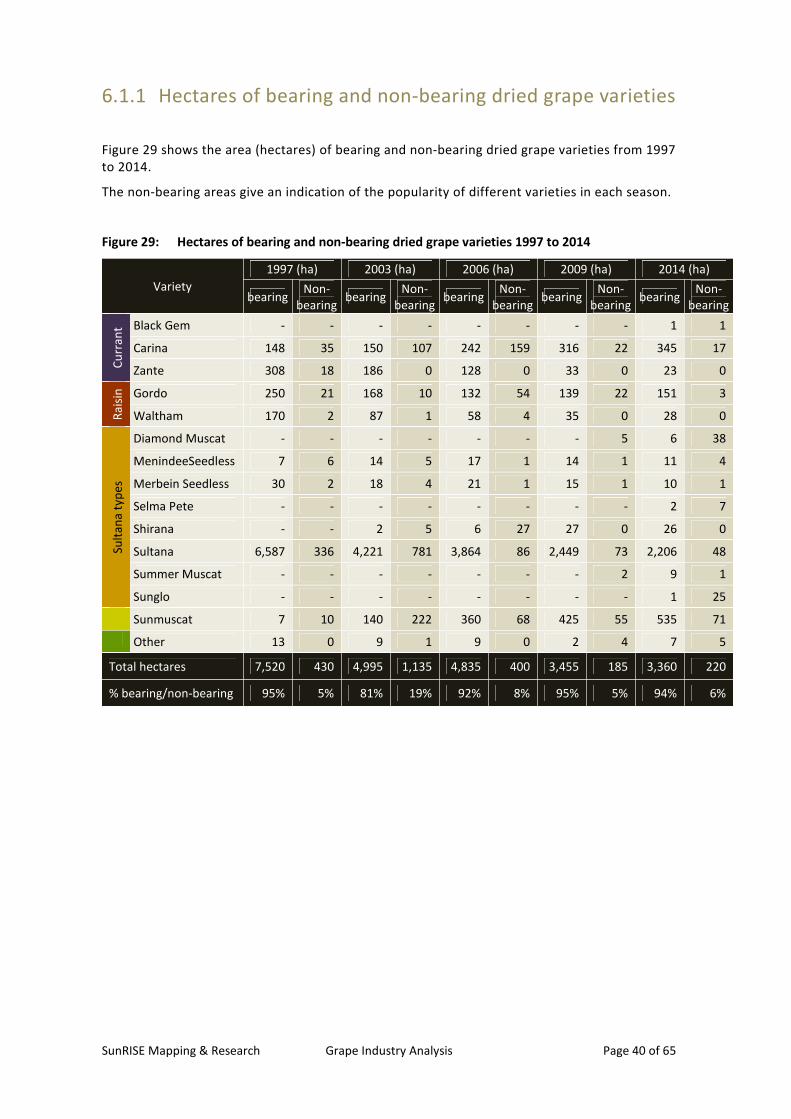
6.1.1 Hectares of bearing and non-bearing dried grape varieties
Figure 29 shows the area (hectares) of bearing and non-bearing dried grape varieties from 1997
to 2014.
The non-bearing areas give an indication of the popularity of different varieties in each season.
Figure 29: Hectares of bearing and non-bearing dried grape varieties 1997 to 2014
Variety
1997 (ha) 2003 (ha) 2006 (ha) 2009 (ha) 2014 (ha)
bearing Non-
bearing bearing
Non-
bearing bearing
Non-
bearing bearing
Non-
bearing bearing
Non-
bearing
Cu
rra
nt Black Gem - - - - - - - - 1 1
Carina 148 35 150 107 242 159 316 22 345 17
Zante 308 18 186 0 128 0 33 0 23 0
Ra
isin
Gordo 250 21 168 10 132 54 139 22 151 3
Waltham 170 2 87 1 58 4 35 0 28 0
Sult
an
a t
ype
s
Diamond Muscat - - - - - - - 5 6 38
MenindeeSeedless 7 6 14 5 17 1 14 1 11 4
Merbein Seedless 30 2 18 4 21 1 15 1 10 1
Selma Pete - - - - - - - - 2 7
Shirana - - 2 5 6 27 27 0 26 0
Sultana 6,587 336 4,221 781 3,864 86 2,449 73 2,206 48
Summer Muscat - - - - - - - 2 9 1
Sunglo - - - - - - - - 1 25
Sunmuscat 7 10 140 222 360 68 425 55 535 71
Other 13 0 9 1 9 0 2 4 7 5
Total hectares 7,520 430 4,995 1,135 4,835 400 3,455 185 3,360 220
% bearing/non-bearing 95% 5% 81% 19% 92% 8% 95% 5% 94% 6%

SunRISE Mapping & Research Grape Industry Analysis Page 41 of 65
6.1.2 Change in dried grape varieties 1997 to 2014
Figure 30 shows the total area (bearing and non-bearing hectares (Figure 29)) of dried grape
varieties and change from 1997 to 2014.
The overall area of Sultana plantings consigned to the dried fruit market declined by 4,669
hectares between 1997 and 2014. Gordo, Waltham, Zante and Merbein Seedless varieties have
also declined.
On the other hand, Sunmuscat plantings increased by 589 hectares and Carina by 179 hectares.
Figure 30: Change in hectares of dried grape varieties from 1997 to 2014
1997 2003 2006 2009 2014
Variety 1997 2003 2006 2009 2014 % of 2014
total
Change
1997-2014
Cu
rra
nt Black Gem - - - - 3 0% +3
Carina 183 257 401 338 363 10% +179
Zante 326 186 129 33 23 1% -303
Ra
isin
Gordo 271 178 187 161 154 4% -118
Waltham 172 88 61 35 28 1% -144
Sult
an
a t
ype
s
Diamond Muscat - - - 5 44 1% +44
Menindee Seedless 12 18 18 14 16 0% +3
Merbein Seedless 31 21 21 16 10 0% -21
Selma Pete - - - - 8 0% +8
Shirana 0 7 32 27 26 1% +25
Sultana 6,923 5,003 3,949 2,522 2,254 63% -4,669
Summer Muscat - - - 2 10 0% +10
Sunglo - - - - 26 1% +26
Sunmuscat 17 361 428 480 606 17% +589
Other 13 10 9 7 12 0% -1
Total hectares 7,950 6,130 5,235 3,640 3,580 100% -4,370
0
1,000
2,000
3,000
4,000
5,000
6,000
7,000
8,000
He
cta
res
Currant
Raisin
Sultana
Sunmuscat
Other

SunRISE Mapping & Research Grape Industry Analysis Page 42 of 65
6.2 Dried grape production 1997 to 2014
The Murray Valley accounts for 98% of National dried grape production. Figure 31 shows
production (dried tonnes) for the Murray Valley based on aggregated data from Horticulture
Australia, made available by Dried Fruits Australia.
Figure 31: Dried grapes from the Murray Valley (tonnes) delivered to packers 1997 to 2013
1997 2003 2006 2009 2013
% of total
in 2013
Change (t)
1997-2013
Sultanas 23,976 13,724 23,182 12,432 11,081 62% - 12,895
Sunmuscat - 895 1,847 1,641 3,247 18% + 3,247
Raisins 1,932 1,304 1,306 1,115 1,120 6% - 812
Currants 2,893 2,010 2,689 1,999 2,494 14% - 399
Other - 31 48 23 65 0% + 65
Total dried tonnes 28,802 17,963 29,072 17,210 18,007 100% - 10,794
Average yields (dried tonnes per hectare) for the Murray Valley were calculated from tonnages in
Figure 31 and SunRISE hectares for bearing dried grape plantings (Figure 28).
Yields have, in general, increased since 1997 with the average yield in 2013 40% (1.5 tonnes/ha)
higher than in 1997. The 2013 yields are approximate as they are based on 2013 tonnages and
2014 hectares. 2014 tonnages were unavailable at the time of the analysis.
Figure 32: Average yields (dried tonnes/ha) for dried grape fruit 1997 to 2013
1997 2003 2006 2009 2013
1997 2003 2006 200912
2013 Change 1997 to 2013
% tonnes/ha
Sultanas 3.6 3.2 5.9 5.0 4.9 + 35% + 1.3
Sunmuscat - 6.4 5.1 3.9 6.1 - 5% - 0.3
Raisins 4.6 5.1 6.9 6.4 6.3 + 36% + 1.7
Currants 6.3 6.0 7.3 5.7 6.8 + 7% + 0.4
Other - 3.4 5.6 4.0 8.8 + 161% + 5.4
weighted average
(dried tonnes/ha) 3.8 3.6 6.0 5.0 5.4 + 40% + 1.5
dried tonnes/acre 1.5 1.5 2.4 2.0 2.2
12
Severe sunburn impacted on the Sunmuscat crop in 2009, hence the unprecedented low Sunmuscat yields
in this season.
3.0
4.0
5.0
6.0
7.0
8.0
Yie
ld (
ton
ne
s/h
ect
are
)
Sultanas
Sunmuscat
Raisins
Currants

SunRISE Mapping & Research Grape Industry Analysis Page 43 of 65
6.3 Dried grape plantings yet to come into production
220 hectares of dried grape plantings were non-bearing (less than three years old) in 2014 and
will come into production in 2015-2017. Figure 33 provides an indication of the tonnages that
those plantings will contribute to annual crops as they reach full production.
The projected tonnage from 2014 bearing plantings (18,007 dried tonnes) has been calculated
using the 2013 average yields from Figure 32. And as 2013 yields are calculated using 2014
hectares, tonnages for 2013 and 2014 are the same.
The projected tonnage from 2014 non-bearing plantings (1,936 tonnes) has been calculated using
the highest 2013 average yield from Figure 32 (8.8 tonnes/ha) as new plantings and new varieties
(e.g. Sunglo) are yielding much higher than district averages.
The projected production from 2014 non-bearing plantings (1,936 tonnes) represents an 11%
increase on the estimated 2014 production from bearing plantings (18,007 tonnes).
Figure 33: Projected tonnage from dried grape varieties that were non-bearing in 2014
Variety
2014
Bearing
(ha)
2014
Non-bearing
(ha)
Production estimate
from 2014 bearing
plantings
(dried tonnes)
Projected production
from 2014 non-bearing
plantings
(dried tonnes)
Cu
rra
nt Black Gem 1 1 8 12
Carina 345 17 2,333 152
Zante 23 - 153 -
Ra
isin
Gordo 151 3 947 22
Waltham 28 - 173 -
Sult
an
a t
ype
s
Diamond Muscat 6 38 30 330
Menindee Seedless 11 4 54 39
Merbein Seedless 10 1 48 5
Selma Pete 2 7 9 58
Shirana 26 - 126 -
Sultana 2,206 48 10,769 424
Summer Muscat 9 1 44 10
Sunglo 1 25 3 222
Sunmuscat 535 71 3,247 621
Other 7 5 65 41
Total hectares 3,360 220
Production estimate
(dried tonnes) 18,007 1,936

SunRISE Mapping & Research Grape Industry Analysis Page 44 of 65
6.4 Dried grape prices 1997 to 2014
Weighted average prices ($ per dried tonne) paid for dried grapes purchased from the Murray
Valley are shown in Figure 34. The weighted average price takes into account the proportion of
fruit received as 5-crown, 4-crown and 3-crown, light or dark.
Consolidated data were provided by Sunbeam Foods and Horticulture Australia with the
exception of 2014 values which are estimates as advised by Dried Fruits Australia. 2014 was a
poor season for Sultanas with only a small proportion of the crop classed as light colour and the
majority being 4 crown brown at $1,700/tonne.
Figure 34: Weighted average price ($/dried tonne) for dried grape fruit from 1997 to 201313
, and
estimated prices for 2014
1997 2003 2006 2007 2008 2009 2010 2011 2012 2013 2014
1997 2003 2006 2007 2008 2009 2010 2011 2012 2013 2014
Sultana $1,390 $1,323 $1,203 $1,252 $1,758 $1,758 $1,726 $1,609 $1,941 $1,701 $1,700
Sunmuscat $1,390 $1,323 $1,285 $1,385 $1,850 $1,820 $1,820 $1,820 $1,880 $1,704 $1,700
Currants $1,557 $1,869 $1,280 $1,280 $1,289 $1,754 $1,759 $1,581 $2,133 $1,776 $1,675
Raisins $1,750 $1,700 $1,625 $1,625 $1,650 $1,825 $1,825 $1,825 $1,965 $1,900 $1,736
Other $1,203 $1,600 $1,600 $1,600 $1,600 $1,600 $1,700
Ave. $/dried
tonne $1,431 $1,412 $1,234 $1,286 $1,752 $1,767 $1,742 $1,646 $1,953 $1,725 $1,699
13
Consolidated data sourced from Horticulture Australia.
$1,000
$1,200
$1,400
$1,600
$1,800
$2,000
$2,200
we
igh
ted
ave
rag
ep
rice
($
/to
nn
e)
sultanas Sunmuscat Currants other Raisins

SunRISE Mapping & Research Grape Industry Analysis Page 45 of 65
6.4.1 Trends in dried grape plantings as prices fluctuate
The charts in Figure 35 track changes from 1997 to 2014 of average prices and corresponding
planted area (hectares) of sultanas, sunmuscat, currants and raisins. Sunmuscat has been the
preferred variety for new or redeveloped dried grape plantings.
Figure 35: Trends in planted hectares of dried grapes as prices fluctuate
1997 2003 2006 2009 2014
1997 2003 2006 2009 2014
Sultana 6,967 5,050 4,021 2,586 2,393 hectares
$ 1,390 $ 1,323 $ 1,203 $ 1,758 $ 1,700 price ($/dried t)
Sunmuscat 17 362 428 480 606 hectares
$ 1,390 $ 1,323 $ 1,285 $ 1,820 $ 1,700 price ($/dried t)
Currant 509 443 530 371 387 hectares
$ 1,557 $ 1,869 $ 1,280 $ 1,754 $ 1,675 price ($/dried t)
Raisin 443 266 248 196 181 hectares
$1,750 $ 1,700 $ 1,625 $ 1,825 $ 1,736 price ($/dried t)
-
2,000
4,000
6,000
8,000
$-
$500
$1,000
$1,500
$2,000
he
cta
res
(be
ari
ng
an
d n
on
be
ari
ng
)
pri
ce (
$/d
rie
d t
on
ne
)
sultanas (hectares) sultanas ($/tonne)
0
250
500
750
1,000
$-
$500
$1,000
$1,500
$2,000
he
catr
es
(be
ari
ng
an
d n
on
be
ari
ng
)
pri
ce (
$/d
rie
d t
on
ne
) sunmuscat (hectares) sunmuscat ($/tonne)
0
250
500
750
1,000
$-
$500
$1,000
$1,500
$2,000
he
cta
res
(be
ari
ng
an
d n
on
be
ari
ng
)
pri
ce $
/ d
rie
d t
on
ne
currants (hectares) currants ($/tonne)
0
250
500
750
1,000
$-
$500
$1,000
$1,500
$2,000
he
cta
res
(be
ari
ng
an
d
no
n b
ea
rin
g)
pri
ce (
$/
dri
ed
to
nn
e)
raisins (hectares) raisins ($/tonne)

SunRISE Mapping & Research Grape Industry Analysis Page 46 of 65
6.5 Crop value of dried grapes 1997 to 2014
6.5.1 Regional income from dried grapes
Crop values provide an indication of the (potential) contribution to regional or National income
from annual production of a crop.
Crop value of Murray Valley dried grape fruit has been calculated from:
• Bearing hectares from SunRISE mapping as per Figure 29
• 98% of National dried fruit intake as per Figure 32, and
• Weighted average prices as per Figure 34
Crop value $ = area bearing (ha) × average yield (tonnes/ha) × average price ($/tonne)
Average yields in 2013 were used to estimate 2014 crop values.
Figure 36: Regional income ($ million) from dried grape fruit based on intake data and 2014
estimates
1997 2003 2006 2007 2008 2009 2010 2011 2012 2013 2014
1997 2003 2006 2007 2008 2009 2010 2011 2012 2013 2014
Sultanas $33.3 $18.2 $27.9 $16.3 $13.3 $21.9 $14.7 $6.8 $16.1 $18.9 $18.8
Sunmuscat - $1.2 $2.3 $2.4 $2.1 $2.9 $3.2 $1.9 $4.8 $5.5 $5.5
Currants $4.5 $3.8 $3.4 $2.3 $2.9 $3.5 $2.1 $1.8 $4.7 $4.4 $4.2
Raisins $3.4 $2.2 $2.1 $1.2 $0.9 $2.0 $2.1 $0.7 $1.4 $2.1 $1.9
Other - $0.1 $0.1 - - - $1.4 $1.0 $0.6 $0.1 $0.1
Total ($
million) $41.2 $25.4 $35.9 $22.2 $19.2 $30.4 $23.4 $12.2 $27.5 $31.0 $30.6
$0
$5
$10
$15
$20
$25
$30
$35
$40
$45
Re
gio
na
l in
com
e (
$ m
illio
n)
Raisins Other Currants Sunmuscat Sultanas

SunRISE Mapping & Research Grape Industry Analysis Page 47 of 65
6.5.2 Farm gate value of dried grape fruit from 1997 to 2014
Farm gate value ($ per hectare) of dried grape production has also been calculated (Figure 37).
Farm gate value represents the gross return to growers before deducting costs of production.
Costs of production are not considered in this analysis (and are not a part of the project brief),
but they vary over time and have a significant impact on net income. Information on costs of
production can be sourced from relevant industry groups.
Between 1997 and 2014, there was a 66% increase in the average gross income ($ per hectare)
for dried grape fruit.
Figure 37: Farm gate value or gross income ($/hectare) for dried grape fruit 1997 to 2014
1997 2003 2006 2009 2014
1997 2003 2006 2009 2014 Change 1997-2014
% $/ha
Sultanas $5,031 $4,269 $7,150 $8,749 $8,300 + 65% + $3,269
Sunmuscat - $8,289 $6,469 $6,882 $10,313 + 24% + $2,024
Raisins $8,048 $8,677 $11,172 $11,709 $10,877 + 35% + $2,829
Currants $9,867 $11,171 $9,301 $10,033 $11,326 + 15% + $1,460
Other - $7,046 $6,782 $14,676 $14,924 + 112% + $7,878
Weighted mean $/ha $5,479 $5,076 $7,422 $8,802 $9,104 + 66% + $3,625
$2,000
$4,000
$6,000
$8,000
$10,000
$12,000
$14,000
gro
ss i
nco
me
($
/ha
)
sultanas
sunmuscat
currants
raisins
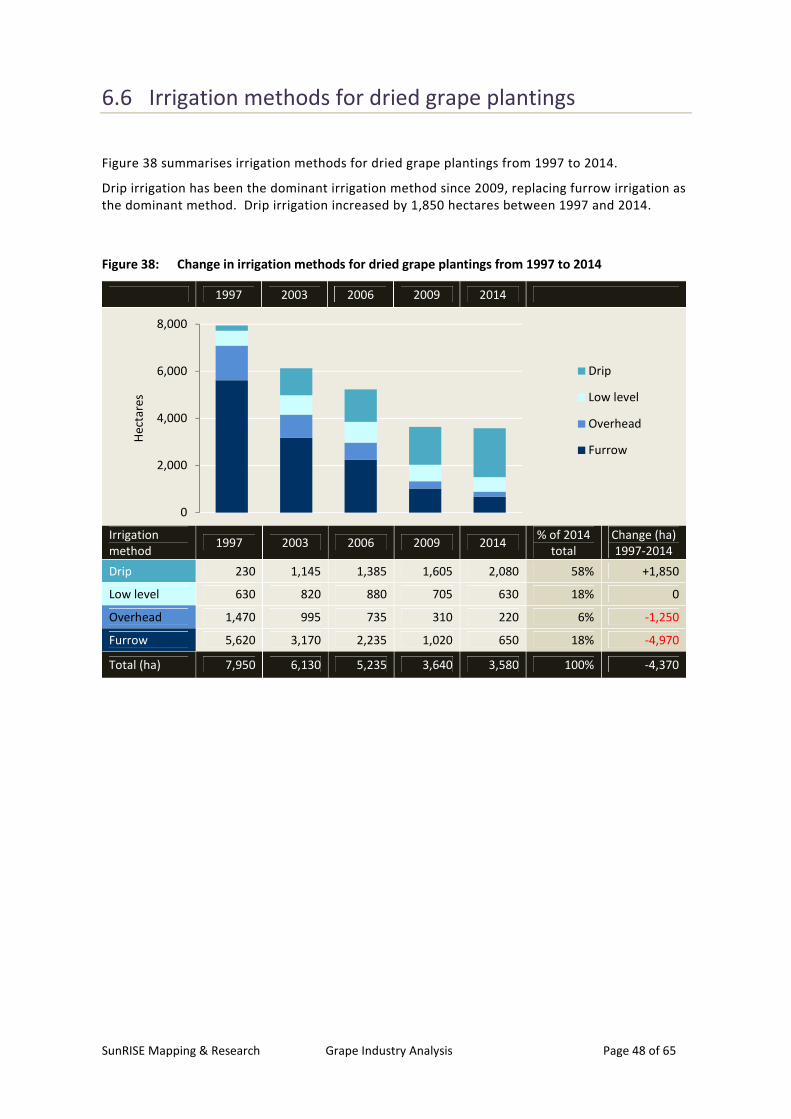
SunRISE Mapping & Research Grape Industry Analysis Page 48 of 65
6.6 Irrigation methods for dried grape plantings
Figure 38 summarises irrigation methods for dried grape plantings from 1997 to 2014.
Drip irrigation has been the dominant irrigation method since 2009, replacing furrow irrigation as
the dominant method. Drip irrigation increased by 1,850 hectares between 1997 and 2014.
Figure 38: Change in irrigation methods for dried grape plantings from 1997 to 2014
1997 2003 2006 2009 2014
Irrigation
method 1997 2003 2006 2009 2014
% of 2014
total
Change (ha)
1997-2014
Drip 230 1,145 1,385 1,605 2,080 58% +1,850
Low level 630 820 880 705 630 18% 0
Overhead 1,470 995 735 310 220 6% -1,250
Furrow 5,620 3,170 2,235 1,020 650 18% -4,970
Total (ha) 7,950 6,130 5,235 3,640 3,580 100% -4,370
0
2,000
4,000
6,000
8,000
He
cta
res
Drip
Low level
Overhead
Furrow

SunRISE Mapping & Research Grape Industry Analysis Page 49 of 65
6.7 Rootstocks of dried grape plantings 1997 to 2014
Figure 39 lists rootstocks of dried grape plantings in the Murray Valley study area and shows the
proportion of plantings that are not on a rootstock (31% in 2014). Plantings not on a rootstock
are either on their own roots or have been top worked on to the roots of the previous variety.
The proportion of plantings on a rootstock increased from 14% in 1997 to 69% in 2014.
The dominant rootstocks are; Ramsey (39% of plantings), Paulsen 1103 (19% of plantings) and
Schwarzmann (7% of plantings).
Figure 39: Change in rootstocks of dried grape plantings from 1997 to 2014
1997 2003 2006 2009 2014
1997 2003 2006 2009 2014 % of 2014
total
Change
1997-2014
Not on a rootstock 6,864 4,005 2,907 1,519 1,092 31% -5,771
Dog Ridge 7 15 23 28 32 1% +25
Harmony 34 32 30 31 28 1% -6
Kober 5BB - 5 8 6 2 0% +2
K51-32 13 11 13 12 16 0% +2
K51-40 6 10 6 7 7 0% +1
101-14 1 1 3 2 7 0% +6
Paulsen 1103 11 293 370 427 688 19% +677
Ramsey 834 1,434 1,509 1,300 1,380 39% +546
Richter 99,110 2 2 2 2 1 0% -1
Ruggeri 140 5 19 49 27 48 1% +43
Schwarzmann 125 253 265 238 245 7% +120
SO4 - - - - - - -
Teleki 5A,5C 41 42 41 36 31 1% -11
Other rootstocks 5 7 8 6 2 0% -3
Total hectares 7,950 6,130 5,235 3,640 3,580 100% -4,370
%Not on rootstock 86% 65% 56% 42% 31%
% On a rootstock 14% 35% 44% 58% 69%
0
1,000
2,000
3,000
4,000
5,000
6,000
7,000
8,000
he
cta
res
Other rootstock
Teleki 5A,5C
Schwarzmann
Ruggeri 140
Richter 99,110
Ramsey
Paulsen 1103
101-14
K51-40
K51-32
Kober 5BB
Harmony
Dog Ridge
Not on rootstock

SunRISE Mapping & Research Grape Industry Analysis Page 50 of 65
6.8 Dried grape property numbers and size 1997 to 2014
Figure 40 provides an estimate of the number of dried grape growers and their average property
size. Property size is the total hectares of grapevines, including any table and wine grape
plantings.
Figure 40: Property numbers and average size of dried grape properties 1997 to 2014
1997 2003 2006 2009 2014
Property size
(grape area) 1997 2003 2006 2009 2014
% of 2014
total
Change
1997-2014
1 to 5 ha 308 237 234 169 114 29% -194
5 to 10 ha 504 349 266 174 149 38% -355
10 to 20 ha 366 269 197 104 90 23% -276
20 to 40 ha 83 61 55 38 32 8% -51
40 to 100 ha 8 7 9 8 7 2% -1
100 to 500 ha 1 4 5 3 4 1% +3
> 500 ha 1 1 1 1 0% +1
No. of properties 1,270 928 767 497 397 100% -873
Average size (ha) 9.9 11.1 11.6 11.7 13.6
In 2014, there were 397 dried grape properties with a total of 5,415 hectares of grapevines. 43%
(169) of the 397 dried grape properties also produced table and/or wine grapes. Production
across the 5,415 hectares of grapevines comprised 3,555 hectares dried, 370 hectares table
grapes and 1,490 hectares wine grapes.
34% of dried grape properties are over 10 ha and grow 75% of the grape plantings (Figure 41).
Figure 41: Dried grape properties in 2014
Property size
(grape area)
2014
Properties
% of total
properties
2014
Hectares
% of total
hectares
1 to 5 ha 114 29% 345 6%
5 to 10 ha 149 38% 1,030 19%
10 to 20 ha 90 23% 1,270 23%
20 to 40 ha 32 8% 900 17%
40 to 100 ha 7 2% 525 10%
100 to 500 ha 4 1% 830 15%
> 500 ha 1 0% 515 10%
2014 total 397 100% 5,415 100%
308 237 234 169 114
504
349 266 174
149
366
269
197
104 90
0
200
400
600
800
1,000
1,200
1,400
Nu
mb
er
of
pro
pe
rtie
s
> 500 ha
100 to 500 ha
50 to 100 ha
20 to 50 ha
10 to 20 ha
5 to 10 ha
1 to 5 ha

SunRISE Mapping & Research Grape Industry Analysis Page 51 of 65
7. Table grape industry analysis
7.1 Change in table grape plantings 1997 to 2014
New table grape plantings between 1997 and 2014 have predominantly been red grape varieties.
The proportion of red table grape plantings increased from 25% of 1997 table grape plantings to
57% of 2014 plantings.
The proportion of black table grape plantings increased slightly, from 2% of 1997 plantings to 8%
of 2014 plantings, while white table grapes declined from 73% of 1997 plantings to just 36% of
2014 plantings.
Figure 42: Summary of bearing and non-bearing table grape plantings (hectares) 1997 to 2014
1997 2003 2006 2009 2014
Table grapes 1997 2003 2006 2009 2014 % of 2014
total
Change
1997-2014
Black non-bearing 16 18 292 206 102 1% +86
Black bearing 80 73 73 342 568 6% +488
Red non-bearing 408 1,099 755 709 1,123 13% +715
Red bearing 991 1,728 2,569 2,744 3,835 44% +2,844
White non-bearing 486 728 528 180 445 5% -41
White bearing 3,558 4,038 3,823 3,139 2,682 31% -876
Total table grapes (ha) 5,540 7,685 8,040 7,320 8,755 100% +3,215
% Bearing 84% 76% 80% 85% 81%
% Non-bearing 16% 24% 20% 15% 19%
% Black grapes 2% 1% 5% 7% 8%
% Red grapes 25% 37% 41% 47% 57%
% White grapes 73% 62% 54% 45% 36%
Note: Grape varieties for 38% of 2014 non-bearing plantings were not recorded. Hence, 2014
non-bearing figures in Figure 42 and Figure 43 are extrapolated from 62% of recorded varieties
and are indicative only. All other figures have been extrapolated with at least 80% of varieties
recorded.
0
1,000
2,000
3,000
4,000
5,000
6,000
7,000
8,000
9,000
He
cta
res
White non-bearing
White bearing
Red non-bearing
Red bearing
Black non-bearing
Black bearing

SunRISE Mapping & Research Grape Industry Analysis Page 52 of 65
7.1.1 Hectares of bearing and non-bearing table grape varieties
The non-bearing areas of table grapes in Figure 43 give an indication of changes in the popularity
of different varieties. For instance, Red Globe was popular from 1997 to 2003 but new plantings
of the variety have since declined.
Figure 43: Hectares of bearing and non-bearing table grape varieties 1997 to 2014
1997 (ha) 2003 (ha) 2006 (ha) 2009 (ha) 2014 (ha)
Colour &
season Variety bearing
Non-
bearing bearing
Non-
bearing bearing
Non-
bearing bearing
Non-
bearing bearing
Non-
bearing
Bla
ck g
rap
es
Early
Mid
Other14
4 2 5 1 6 0 4 0 4 1
PBR varieties 0 0 0 3 3 32 37 63 128 5
Mid Black Muscat 7 2 10 0 7 1 8 1 9 0
PBR varieties 0 0 0 0 0 0 0 14 30 65
M-L Ribier 39 1 20 0 12 0 8 0 7 0
Late
AutumnRoyal 0 0 2 10 11 233 231 116 324 30
Other15
31 11 36 5 35 24 52 5 45 1
PBR variety 0 0 0 0 0 2 2 7 21 0
Re
d g
rap
es
Early
Cardinal 69 1 40 0 18 0 10 0 4 0
Flame 147 16 146 17 140 6 93 16 142 28
Ralli Seedless 7 31 71 42 111 12 103 7 160 50
Mid
Other16
38 2 28 0 19 0 9 0 5 0
PBR varieties 0 0 0 1 1 2 3 2 14 85
Red Emperor 171 10 95 2 66 0 33 0 12 0
Red Globe 509 333 1,177 335 1,376 121 1,220 52 967 75
M-L
Crimson 32 16 154 654 777 482 1,258 632 2,512 865
Other17
17 1 18 48 61 132 16 0 8 0
PBR variety 0 0 0 0 0 0 0 1 10 20
Wh
ite
gra
pe
s
Early
Menindee 607 286 1,031 276 1,126 122 969 90 814 85
Other18
29 8 26 12 33 0 14 0 9 0
PBR varieties 0 0 0 0 0 1 1 7 2 10
Mid
Other19
27 9 32 11 32 116 65 0 9 0
PBR varieties 1 3 6 5 11 0 0 4 6 10
Thompson 2,595 133 2,655 341 2,292 161 1,896 68 1,658 190
M-L Waltham 58 0 38 0 30 0 10 0 5 0
Late
Calmeria 123 44 163 31 178 16 124 8 105 0
Ohanez 118 3 79 10 73 12 58 1 33 0
Other20
1 0 8 40 47 98 2 0 0 0
PBR varieties 0 0 0 0 0 0 0 1 41 150
Total (hectares) 4,630 910 5,840 1,845 6,465 1,575 6,225 1,095 7,085 1,670
% Bearing / non-bearing 84% 16% 76% 24% 80% 20% 85% 15% 81% 19%
PBR varieties are proprietary varieties only recently, or still waiting to be, granted plant variety rights.
14
Other early-mid season black varieties: Fantasy Seedless, Kyoho, Maroo Seedless 15
Other late season black varieties: Black America, Purple Cornichon 16
Other mid season red varieties: Christmas Rose, Queen, Red Malaga, Ruby Seedless 17
Other mid-late season red varieties: Nyora, Red Prince, Red Rob, Zante 18
Other early season white varieties: Centennial, Early Muscat, Merbein Seedless, Perlette, Sunmuscat 19
Other mid season white varieties: Apple, Dawn Seedless, Golden Globe, Italia, Kismiski, Moss Sultana 20
Other late season white varieties: Hunisa, Jade Seedless, Stanley Seedless

SunRISE Mapping & Research Grape Industry Analysis Page 53 of 65
7.1.2 Change in table grape varieties 1997 to 2014
Figure 44 lists table grape varieties by colour and seasonality and shows change in the total area
of each variety between 1997 and 2014.
The dominant table grape varieties, Crimson Seedless (39%), Thompson Seedless (21%), Red
Globe (12%) and Menindee Seedless (10%), make up 82% of the 2014 planted area of table
grapes.
Figure 44: Change in table grape varieties (hectares) 1997 to 2014
Colour &
Season Variety
21 1997 2003 2006 2009 2014
% of 2014
total
Change
1997-2014
Bla
ck g
rap
es
Early
Mid
Other varieties 6 6 6 4 5 0% -1
PBR varieties - 3 35 99 133 2% +133
Mid Black Muscat 8 10 8 9 9 0% +1
PBR varieties - - - 14 95 1% +95
M-L Ribier 40 20 12 8 7 0% -34
Late
Autumn Royal - 13 243 348 354 4% +354
Other varieties 42 40 59 57 46 1% +5
PBR variety - - 2 9 21 0% +21
Re
d g
rap
es
Early
Cardinal 70 40 18 10 4 0% -65
Flame 163 163 146 109 170 2% +8
Ralli Seedless 38 112 122 109 210 2% +171
Mid
Other varieties 40 28 19 9 5 0% -35
PBR varieties - 1 3 5 99 1% +99
Red Emperor 181 97 67 33 12 0% -169
Red Globe 842 1,513 1,496 1,271 1,042 12% +200
M-L
Crimson 48 808 1,259 1,889 3,377 39% +3,329
Other varieties 18 66 193 16 8 0% -10
PBR variety - - - 1 30 0% +30
Wh
ite
gra
pe
s
Early
Menindee 893 1,307 1,248 1,059 899 10% +6
Other varieties 37 38 34 14 9 0% -27
PBR varieties - - 1 8 12 0% +12
Mid
Other varieties 36 43 148 65 9 0% -27
PBR varieties 4 11 12 5 16 0% +12
Thompson 2,728 2,997 2,454 1,965 1,848 21% -880
M-L Waltham 58 38 30 10 5 0% -53
Late
Calmeria 167 195 195 132 105 1% -62
Ohanez 121 89 85 59 33 0% -88
Other varieties 1 48 145 2 0 0% -1
PBR varieties - - - 1 191 2% +191
Total (hectares) 5,540 7,685 8,040 7,320 8,755 100% +3,215
% Bearing 84% 76% 80% 85% 81%
% Non-bearing 16% 24% 20% 15% 19%
M-L = Mid to Late season.
PBR (Plant Breeders’ Rights) in this table refers to proprietary varieties only recently, or still waiting to be, granted
plant variety rights
21
Details of ‘other varieties’ are listed in a footnote on page 52.
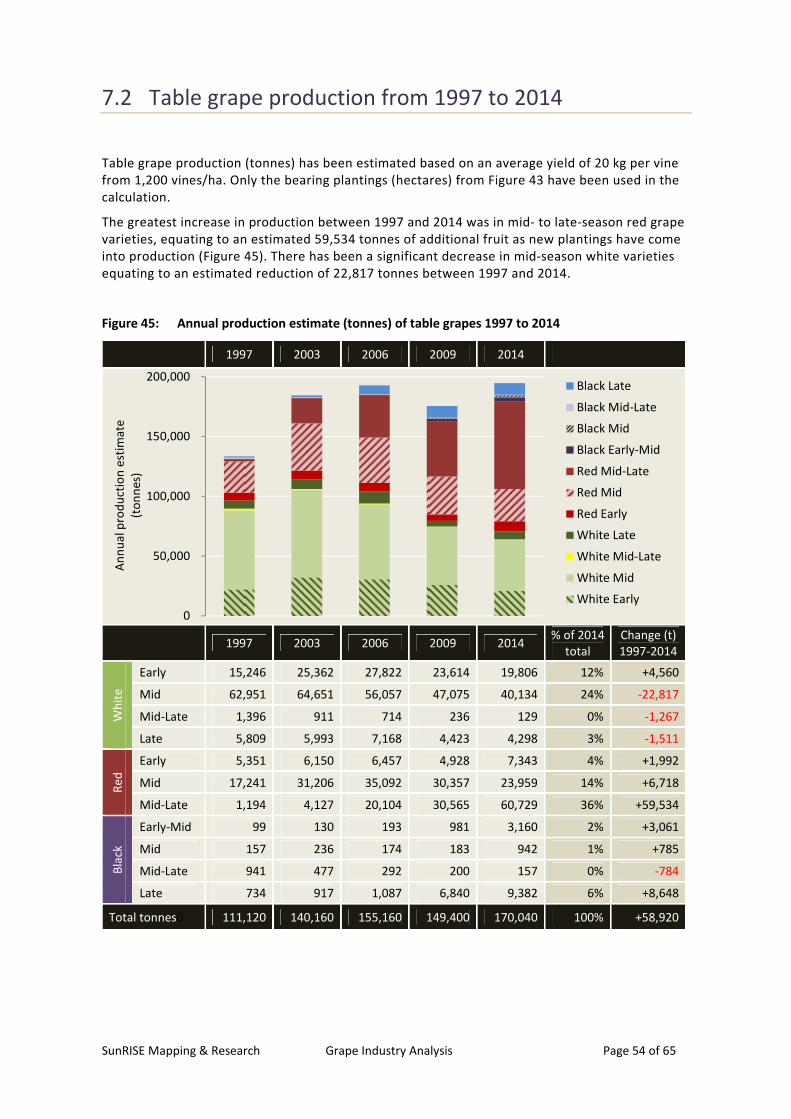
SunRISE Mapping & Research Grape Industry Analysis Page 54 of 65
7.2 Table grape production from 1997 to 2014
Table grape production (tonnes) has been estimated based on an average yield of 20 kg per vine
from 1,200 vines/ha. Only the bearing plantings (hectares) from Figure 43 have been used in the
calculation.
The greatest increase in production between 1997 and 2014 was in mid- to late-season red grape
varieties, equating to an estimated 59,534 tonnes of additional fruit as new plantings have come
into production (Figure 45). There has been a significant decrease in mid-season white varieties
equating to an estimated reduction of 22,817 tonnes between 1997 and 2014.
Figure 45: Annual production estimate (tonnes) of table grapes 1997 to 2014
1997 2003 2006 2009 2014
1997 2003 2006 2009 2014
% of 2014
total
Change (t)
1997-2014
Wh
ite
Early 15,246 25,362 27,822 23,614 19,806 12% +4,560
Mid 62,951 64,651 56,057 47,075 40,134 24% -22,817
Mid-Late 1,396 911 714 236 129 0% -1,267
Late 5,809 5,993 7,168 4,423 4,298 3% -1,511
Re
d
Early 5,351 6,150 6,457 4,928 7,343 4% +1,992
Mid 17,241 31,206 35,092 30,357 23,959 14% +6,718
Mid-Late 1,194 4,127 20,104 30,565 60,729 36% +59,534
Bla
ck
Early-Mid 99 130 193 981 3,160 2% +3,061
Mid 157 236 174 183 942 1% +785
Mid-Late 941 477 292 200 157 0% -784
Late 734 917 1,087 6,840 9,382 6% +8,648
Total tonnes0 111,120 140,160 155,160 149,400 170,040 100% +58,920
0
50,000
100,000
150,000
200,000
An
nu
al p
rod
uct
ion
est
ima
te
(to
nn
es)
Black Late
Black Mid-Late
Black Mid
Black Early-Mid
Red Mid-Late
Red Mid
Red Early
White Late
White Mid-Late
White Mid
White Early

SunRISE Mapping & Research Grape Industry Analysis Page 55 of 65
7.3 Table grape plantings yet to come into production
Figure 46 shows the proportion of bearing and non-bearing table grape plantings in 2014 by
seasonality.
The main non-bearing (less than three years old) plantings comprise 885 hectares of mid to late
season red grapes. The 885 hectares of mid to late season red grapes are Crimson Seedless (865
ha) and PBR varieties (20 ha) as shown in Figure 47.
Figure 46: Seasonality of bearing and non-bearing table grape varieties in 2014
Early Early-
Mid Mid
Mid-
Late Late
Table grapes in 2014 Early Early-
Mid Mid
Mid-
Late Late Total
% of 2014
total ha
Black non-bearing - 6 65 - 31 102 1%
Black bearing - 132 39 7 391 568 6%
Red non-bearing 78 - 160 885 - 1,123 13%
Red bearing 306 - 998 2,530 - 3,835 44%
White non-bearing 95 - 200 - 150 445 5%
White bearing 825 - 1,672 5 179 2,682 31%
Total table grapes (ha) 1,304 138 3,135 3,427 751 8,755
% Bearing 87% 96% 86% 74% 76%
% Non-bearing 13% 4% 14% 26% 24%
0
500
1,000
1,500
2,000
2,500
3,000
3,500
He
cta
res
White non-bearing
White bearing
Red non-bearing
Red bearing
Black non-bearing
Black bearing

SunRISE Mapping & Research Grape Industry Analysis Page 56 of 65
7.3.1 Table grape varieties yet to come into production
Significant areas (1,670 hectares) of table grapes were non-bearing in 2014 and will come into
production in 2015–2017. Figure 47 provides an indication of the tonnages (40,080 tonnes) that
those areas will contribute to the annual crop as they reach full production.
The largest area of non-bearing plantings in 2014 was Crimson Seedless which will contribute an
estimated 20,760 tonnes in coming seasons; a 34% increase on 2014 production.
Production from the 2014 non-bearing plantings represents a 24% increase on the estimated
2014 production from bearing plantings (170,040 tonnes).
Figure 47: Projected tonnage from table grape varieties that were non-bearing in 2014
Colour &
season Variety
22
2014
Bearing
(ha)
2014 Non-
bearing
(ha)
Estimated
production for
2014 bearing areas
(tonnes)
Projected production
from 2014 non-
bearing areas
(tonnes)
Bla
ck g
rap
es
Early
Mid
Other varieties 4 1 87 24
PBR varieties 128 5 3,073 120
Mid Black Muscat 9 - 219 0
PBR varieties 30 65 723 1,560
M-L Ribier 7 - 157 0
Late
Autumn Royal 324 30 7,786 720
Other varieties 45 1 1,091 24
PBR variety 21 - 505 0
Re
d g
rap
es
Early
Cardinal 4 - 101 0
Flame 142 28 3,412 672
Ralli Seedless 160 50 3,830 1,200
Mid
Other varieties 5 - 126 0
PBR varieties 14 85 331 2,040
Red Emperor 12 - 297 0
Red Globe 967 75 23,205 1,800
M-L
Crimson 2,512 865 60,291 20,760
Other varieties 8 - 196 0
PBR variety 10 20 241 480
Wh
ite
gra
pe
s
Early
Menindee 814 85 19,540 2,040
Other varieties 9 - 222 0
PBR varieties 2 10 45 240
Mid
Other varieties 9 - 210 0
PBR varieties 6 10 140 240
Thompson 1,658 190 39,784 4,560
M-L Waltham 5 - 129 0
Late
Calmeria 105 - 2,526 0
Ohanez 33 - 793 0
Other varieties - - 0 0
PBR varieties 41 150 979 3,600
Total hectares 7,085 1,670
Production estimate (tonnes) 170,040 40,080
22
Details of ‘other varieties’ are listed in a footnote under Figure 43 on page 52.

SunRISE Mapping & Research Grape Industry Analysis Page 57 of 65
7.4 Table grape prices 1997 to 2014
Wholesale prices ($/kg) paid for table grapes sent into the Melbourne and Sydney wholesale
markets between January and April (inclusive) from 1997 to 2014 were sourced from Ausmarket
Consultants.
The data provided by Ausmarket Consultants represented averages and highest and lowest prices
per month by variety. SunRISE Mapping are unable to further calculate a weighted average,
however the average monthly prices already take the volume of delivery at each price into
consideration, by variety.
The average prices returned to growers from the wholesale markets increased overall by $ 0.20
between 1997 and 2014. The greatest price increase ($0.79) was for black grapes. The price of
white grapes between 1997 and 2014 fell by $0.18.
Figure 48: Average wholesale price ($ per kilogram) for table grapes delivered into Melbourne and
Sydney markets 1997 to 2014
1997 2003 2006 2009 2014
Table grapes 1997 2003 2006 2009 2014 Change ($)
1997-2014
White $ 1.06 $ 1.14 $ 1.02 $ 0.84 $ 0.88 - $ 0.18
Red $ 1.06 $ 1.10 $ 1.31 $ 1.52 $ 1.39 + $ 0.32
Black $ 0.89 $ 1.11 $ 1.27 $ 1.40 $ 1.68 + $ 0.79
Average price $/kg $ 1.03 $ 1.11 $ 1.20 $ 1.32 $ 1.23 + $ 0.20
$0.80
$0.90
$1.00
$1.10
$1.20
$1.30
$1.40
$1.50
$1.60
$1.70
wh
ole
sale
ma
rke
t p
rice
($
/kg
)
Black
Red
White

SunRISE Mapping & Research Grape Industry Analysis Page 58 of 65
7.4.1 Monthly wholesale prices for table grapes delivered into
the Melbourne and Sydney markets
Figure 49: Monthly average wholesale prices ($ per kilogram) for table grapes at Melbourne and
Sydney markets between January and April, 1997 to 2014
1997 2003 2006 2009 2014
1997 2003 2006 2009 2014
Wh
ite
January $ 1.31 $ 1.08 $ 1.09 $ 1.17 $ 1.00
February $ 1.01 $ 0.91 $ 1.08 $ 0.90 $ 0.87
March $ 0.93 $ 1.21 $ 0.88 $ 0.69 $ 0.79
April $ 0.97 $ 1.25 $ 1.04 $ 0.79 $ 0.85
Re
d
January $ 1.19 $ 1.16 $ 1.36 $ 1.89 $ 1.63
February $ 1.01 $ 1.12 $ 1.31 $ 1.44 $ 1.32
March $ 1.03 $ 1.16 $ 1.32 $ 1.35 $ 1.31
April $ 1.03 $ 0.99 $ 1.18 $ 1.30 $ 1.32
Bla
ck
January $ 1.04 $ 1.90 $ 1.74 $ 3.70 $ 1.91
February $ 0.82 $ 1.08 $ 1.15 $ 1.43 $ 1.84
March $ 0.89 $ 1.02 $ 1.17 $ 1.30 $ 1.59
April $ 0.86 $ 1.06 $ 1.40 $ 1.19 $ 1.31
Average $/kg $ 1.03 $ 1.11 $ 1.20 $ 1.32 $ 1.23
$0.50
$1.00
$1.50
$2.00
$2.50
$3.00
$3.50
$4.00
wh
ole
sale
ma
rke
t p
rice
($
/kg
)
Black Red White

SunRISE Mapping & Research Grape Industry Analysis Page 59 of 65
7.4.2 Trends in pricing and areas of table grape plantings
The charts in Figure 50 show change from 1997 to 2014 in average prices for table grape plantings
(dashed blue lines) and corresponding changes in planted area (hectares).
Figure 50: Trends in planted hectares of table grapes as prices fluctuate
1997 2003 2006 2009 2014
1997 2003 2006 2009 2014 Change 1997-
2014
Bla
ck
Hectares 96 92 365 548 670 +574
Price ($/kg) $0.89 $1.11 $1.27 $1.40 $1.68 +$0.79
Re
d Hectares 1,399 2,827 3,324 3,453 4,958 +3,558
Price ($/kg) $1.06 $1.10 $1.31 $1.52 $1.39 +$0.33
Wh
ite
Hectares 4,044 4,766 4,351 3,319 3,127 -917
Price ($/kg) $1.06 $1.14 $1.02 $0.84 $0.88 -$0.18
0
1,000
2,000
3,000
4,000
5,000
$0.00
$0.50
$1.00
$1.50
he
cta
res
(be
ari
ng
an
d
no
n b
ea
rin
g)
Pri
ce $
/kg
Black hectares planted Black $/kg
0
1,000
2,000
3,000
4,000
5,000
$0.00
$0.50
$1.00
$1.50
he
cta
res
(be
ari
ng
an
d n
on
be
ari
ng
)
Pri
ce $
/kg
Red hectares planted Red $/kg
0
1,000
2,000
3,000
4,000
5,000
$0.00
$0.50
$1.00
$1.50
he
catr
es
(be
ari
ng
an
d n
on
be
ari
ng
)
Pri
ce $
/kg
White hectares planted White $/kg

SunRISE Mapping & Research Grape Industry Analysis Page 60 of 65
7.5 Crop value of table grapes 1997 to 2014
Crop value provides an indication of the (potential) annual contribution to regional or National
income from annual production of a crop.
Crop value of Murray Valley table grapes was calculated from:
• The area (hectares) of bearing table grape plantings from SunRISE mapping (Figure 43)
• Assuming an average table grape yield of 24,000 kilograms/hectare (20 kg/vine and 1,200
vines/ha), and
• Average prices ($/kilogram) in the Melbourne and Sydney markets. The market price
applied to each variety is based on the approximate month it is harvested (assuming it is
sent directly to the market)
Crop value $ = area bearing (ha) × average yield (kilograms/ha) × average price ($/kilogram)
Figure 51: Regional income ($ million) from table grapes 1997 to 2014
1997 2003 2006 2009 2014
1997 2003 2006 2009 2014
% of total
in 2014
Change
1997-2014
Wh
ite
Early $20.0 $27.4 $30.4 $27.7 $19.8 10% -$0.2
Mid $63.6 $58.5 $60.3 $42.2 $35.0 17% -$28.6
Mid-late $1.3 $1.1 $0.6 $0.2 $0.1 0% -$1.2
Late $5.6 $7.5 $7.4 $3.5 $3.7 2% -$2.0
Re
d Early $6.4 $7.1 $8.8 $9.3 $12.0 6% +$5.6
Mid $17.4 $34.9 $46.0 $43.8 $31.7 16% +$14.3
Mid-late $1.2 $4.8 $26.5 $41.2 $79.6 39% +$78.4
Bla
ck
Early-mid $0.1 $0.2 $0.3 $3.6 $6.0 3% +$5.9
Mid $0.1 $0.3 $0.2 $0.3 $1.7 1% +$1.6
Mid-late $0.8 $0.5 $0.3 $0.3 $0.2 0% -$0.6
Late $0.6 $1.0 $1.5 $8.1 $12.2 6% +$11.6
Total $ million $117.3 $143.3 $182.5 $180.3 $202.1 100% +$84.8
Farm gate value ($/hectare) of table grape production has also been calculated (Figure 52). Farm
gate value represents the gross return to growers before deducting costs of production. Costs of
production are not considered in this analysis (and are not part of the project brief), but they vary
over time and have a significant impact on net income. Information on production costs can be
sourced from relevant industry groups.
$-
$20
$40
$60
$80
$100
$120
$140
$160
$180
$200
$220
Co
ntr
ibu
tio
n t
o r
eg
ion
al
inco
me
($
mill
ion
)
White Late
White Mid-Late
White Mid
White Early
Red Mid-Late
Red Mid
Red Early
Black Late
Black Mid-Late
Black Mid
Black Early-Mid

SunRISE Mapping & Research Grape Industry Analysis Page 61 of 65
7.5.1 Farm gate value of table grapes 1997 to 2014
Figure 52: Changes in farm gate value (weighted average $/ha) of table grapes 1997 to 2014
1997 2003 2006 2009 2014
Change 1997-2014
% $
Wh
ite
Early $31,559 $25,960 $26,261 $28,193 $24,013 -24% -$7,545
Mid $24,261 $21,729 $25,817 $21,526 $20,927 -14% -$3,334
Mid-late $22,263 $29,108 $21,076 $16,549 $19,011 -15% -$3,252
Late $23,276 $30,075 $24,907 $19,029 $20,425 -12% -$2,851
$/hectare $25,409 $27,318 $24,468 $20,145 $21,112 -17% -$4,246
1997 2003 2006 2009 2014
Change 1997-2014
% $
Re
d Early-mid $28,642 $27,813 $32,535 $45,421 $39,132 +37% +$10,490
Mid $24,174 $26,811 $31,483 $34,624 $31,705 +31% +$7,531
Mid-late $24,810 $27,814 $31,693 $32,372 $31,460 +27% +$6,650
$/hectare $25,506 $26,304 $31,359 $36,533 $33,295 +31% +$8,224
1997 2003 2006 2009 2014
Change 1997-2014
% $
Bla
ck
Early-mid $24,861 $45,620 $41,667 $88,893 $45,836 +84% +$20,975
Mid $19,759 $26,007 $27,607 $34,389 $44,158 +123% +$24,399
Mid-late $21,457 $24,416 $28,129 $31,152 $38,204 +78% +$16,747
Late $20,735 $25,339 $33,522 $28,495 $31,333 +51% +$10,599
$/hectare $21,474 $26,659 $30,577 $33,624 $40,396 +88% +$18,180
Wgtd ave. $/ha $24,657 $26,728 $28,859 $31,625 $29,425 +19% +$4,768
$15,000
$25,000
$35,000
$45,000
$/h
a g
ross
in
com
e
White Early
White Mid
White Mid-
Late
White Late
$15,000
$25,000
$35,000
$45,000
$/h
a g
ross
in
com
e
Red Early
Red Mid
Red Mid-
Late
$15,000
$35,000
$55,000
$75,000
$95,000
$/h
ect
are
g
ross
in
com
e
Black
Early-Mid
Black Mid
Black Mid-
Late
Black Late

SunRISE Mapping & Research Grape Industry Analysis Page 62 of 65
7.6 Irrigation methods for table grape plantings
Low level sprinklers remained the dominant irrigation method for table grape plantings from
1997 to 2014.
96% of plantings are irrigated with low level sprinklers or drippers.
Figure 53: Change in irrigation methods for table grape plantings from 1997 to 2014
1997 2003 2006 2009 2014
Irrigation
method 1997 2003 2006 2009 2014
% of 2014
total
Change (ha)
1997-2014
Drip 660 1,540 2,230 2,460 4,150 47% +3,490
Low level 2,170 3,960 4,230 4,110 4,325 49% +2,155
Overhead 980 1,090 860 565 220 3% -760
Furrow 1,730 1,095 720 185 60 1% -1,670
Total (ha) 5,540 7,685 8,040 7,320 8,755 100% +3,215
0
1,000
2,000
3,000
4,000
5,000
6,000
7,000
8,000
9,000
He
cta
res Drip
Low level
Overhead
Furrow

SunRISE Mapping & Research Grape Industry Analysis Page 63 of 65
7.7 Rootstocks of table grape plantings 1997 to 2014
Figure 54 lists rootstocks of table grape plantings in the Murray Valley study area and shows the
proportion of plantings that are not on a rootstock (19% in 2014). Plantings not on a rootstock
are either on their own roots or have been top worked on to the roots of the previous variety.
The proportion of plantings on a rootstock increased from 35% in 1997 to 81% in 2014. The
dominant rootstocks are; Ramsey (35% of plantings), Schwarzmann (18% of plantings) and
Paulsen 1103 (12% of plantings).
Figure 54: Change in rootstocks of table grape plantings from 1997 to 2014
1997 2003 2006 2009 2014
1997 2003 2006 2009 2014 % of 2014
total
Change
1997-2014
Not on a rootstock 3,628 3,605 2,755 1,932 1,643 19% -1,985
Dog Ridge 83 210 232 226 339 4% +257
Harmony 116 129 120 95 101 1% -15
Kober 5BB 1 52 60 70 105 1% +104
K51-32 6 9 6 5 7 0% +1
K51-40 6 9 10 8 15 0% +8
101-14 1 1 4 10 31 0% +30
Paulsen 1103 4 114 459 524 1,062 12% +1,058
Ramsey 1,154 2,238 2,575 2,589 3,060 35% +1,906
Richter 99,110 0 1 1 19 22 0% +22
Ruggeri 140 4 64 246 155 312 4% +308
Schwarzmann 373 909 1,179 1,287 1,549 18% +1,177
SO4 0 1 1 0 0 0% 0
Teleki 5A,5C 151 328 373 375 481 5% +330
Other rootstocks 12 14 18 25 26 0% +14
Total hectares 5,540 7,685 8,040 7,320 8,755 100% +3,215
% No rootstock 65% 47% 34% 26% 19%
% on a rootstock 35% 53% 66% 74% 81%
0
1,000
2,000
3,000
4,000
5,000
6,000
7,000
8,000
9,000
he
cta
res
Other rootstock
Teleki 5A,5C
SO4
Schwarzmann
Ruggeri 140
Richter 99,110
Ramsey
Paulsen 1103
101-14
K51-40
K51-32
Kober 5BB
Harmony
Dog Ridge
Not on rootstock

SunRISE Mapping & Research Grape Industry Analysis Page 64 of 65
7.8 Table grape property numbers and size 1997 to 2014
Figure 55 provides an estimate of the number of table grape growers and their average property
size. Property size is the total hectares of grapevines, including dried and wine grape plantings.
Figure 55: Change in property numbers and size for table grape growers from 1997 to 2014
1997 2003 2006 2009 2014
Property size
(table grape area) 1997 2003 2006 2009 2014
% of 2014
total
Change
1997-2014
1 to 5 ha 94 111 118 111 86 19% -8
5 to 10 ha 205 227 204 151 103 23% -102
10 to 20 ha 205 210 174 146 120 27% -85
20 to 40 ha 75 94 86 69 94 21% +19
40 to 100 ha 8 12 18 20 28 6% +20
100 to 500 ha 3 13 13 14 10 2% +9
Total properties 590 667 615 513 443 100% -147
Average size (ha) 13.6 17.1 18.3 19.6 23.2
110 of the 443 table grape properties also produced wine and/or dried grapes in 2014.
Production across the 10,275 hectares of grapevines comprised 220 hectares dried, 1,300
hectares wine grapes and 8,755 hectares table grapes.
30% of table grape properties are over 20 hectares and grow 73% of grape plantings (Figure 56).
Figure 56: Table grape properties in 2014
Property size
(grape area)
2014
Properties
% of total
properties
2014
Hectares
% of total
hectares
1 to 5 ha 86 19% 240 2%
5 to 10 ha 103 23% 775 8%
10 to 20 ha 120 27% 1,725 17%
20 to 40 ha 94 21% 2,935 29%
40 to 100 ha 28 6% 1,925 19%
100 to 500 ha 12 3% 2,675 26%
2014 total 443 100% 10,275 100%
94 111 118 111 86
205 227 204
151 103
205 210
174
146
120
75 94
86
69
94
0
100
200
300
400
500
600
700
Nu
mb
er
of
pro
pe
rtie
s
100 to 500 ha
50 to 100 ha
20 to 50 ha
10 to 20 ha
5 to 10 ha
1 to 5 ha

SunRISE Mapping & Research Grape Industry Analysis Page 65 of 65
8. Bibliography
Agriculture Victoria. (1997). Murray Valley Wine Grape Industry Advisory Council Winegrape Utilisation
Survey 1997. Department of natural Resources and Environment, Agriculture Victoria.
Department of Natural Resources and Environment.
Ausmarket Consultants. (2003). Melbourne Monhtly Grape Prices collated by Fresh Port. Sydney:
Ausmarket Consultants.
Ausmarket Consultants. (2014). Melbourne Monthly Grape Prices 1997, 2003, 2006, 2009, 2014 high-
low-average-best from informaton collected by Fresh State. Sydney: Ausmarket Consulting.
Ausmarket Consultants. (2014). Sydney Monthly Grapes 1997, 2003, 2006, 2009 and 2014 high-low-
average-best price reports compiled from Sydney Market Reporting Service. Sydney: Ausmarket
Consultants.
Department of Primary Industries. (2003). Australian Regional Winegrape Crush Survey - Victoria / NSW
Murray Valley. Department of Prinary Industries.
Department of Primary Industries. (2006). Australian Regional Wine Grape Crush Survey Murray
Darling, Swan Hill. Vicitorian Government.
Department of Primary Industries. (2009). Winegrape Crush Survey Murray Darling / Swan Hill.
Department of Prinary Industries. Victorian Government.
Hickey, T., & Hengsen, K. (2014). Wine Grape Crush Report Murray Darling/Swan Hill. Mildura: Murray
Valley Wine Grape Industry Advisory Committee.
Martin, S. R., Dunn, G. M., & Krstic, M. P. (2007). Regulating Yield to Improve Wine Quality and Reduce
Industry Costs. Final Report to Grape and Wie Research and Development Corporation. Project
DNR 03/02. Department of Primary Industries, Victoria. Grape and Wine Research and
Development Corporation.
Retallack, M. (2010). Updating vineyard costs of production data for the Murray Valley Wine Region.
Mildura: Murray Valley Wine Growers Inc.
Retallack, M. (2012). Economic Benchmarking for the Murray Valley Wine Region seasons 2010/11.
Mildura: Murray Valley Winegrowers Inc.
Retallack, M. (2012). Murray Valley and Riverina Water Use Efficiency Study 2011/12. Murray Valley
Winegrowers Inc and Riverina Winegrapes Marketing Board.
Sydney Market Reporting Service. (2003). Sydney Monthly Grape Prices . Sydney: Ausmarket
Consulting.
Sydney Market Reporting Service. (2006). Sydney Monthly Grape Prices. Sydney: Ausmarket Consulting.
Sydney Market Reporting Service. (2009). Sydney Monthly Grape Prices. Sydney: Ausmarket Consulting.
WGGA. (2008). Regional Benchmarking Report prepared as part of the 'Capacity Building for Australian
Wine Grape Growers' project. Adelaide: prepared for Wine Grape Growers Australia by
Scholefield Robinson Horticultural Services.