Embed Size (px)
Citation preview
Graph-Based Data Mining
Diane J. Cook
University of Texas at Arlington
http://www-cse.uta.edu/~cook
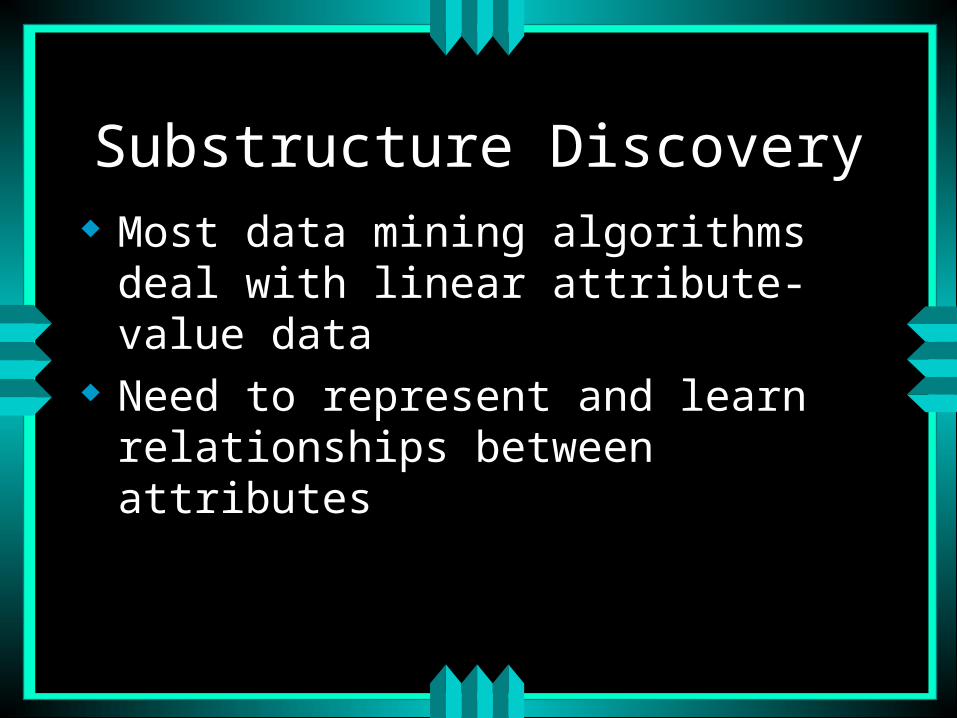
Substructure Discovery Most data mining algorithms deal with
linear attribute-value data Need to represent and learn relationships
between attributes
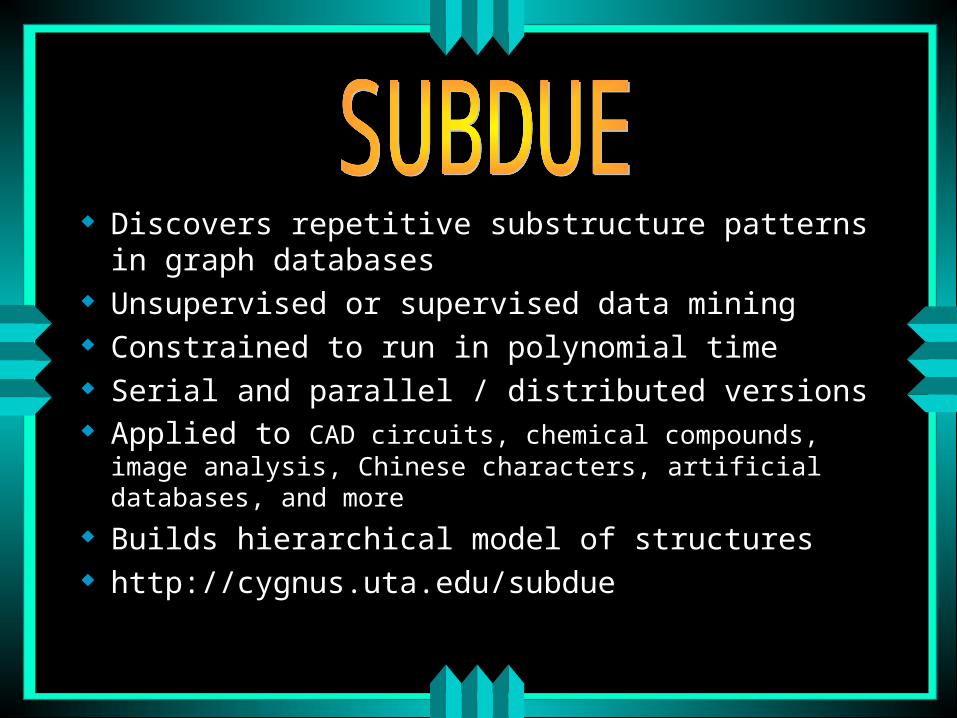
Discovers repetitive substructure patterns in graph databases
Unsupervised or supervised data mining Constrained to run in polynomial time Serial and parallel / distributed versions Applied to CAD circuits, chemical compounds, image
analysis, Chinese characters, artificial databases, and more
Builds hierarchical model of structures http://cygnus.uta.edu/subdue
SUBDUE KNOWLEDGE DISCOVERY SYSTEM
SUBDUE discovers patterns (substructures) in structural data sets
SUBDUE represents data as a labeled graph.Vertices represent objects or attributesEdges represent relationships between objectsInput: Labeled graphOutput: Discovered patterns and instances
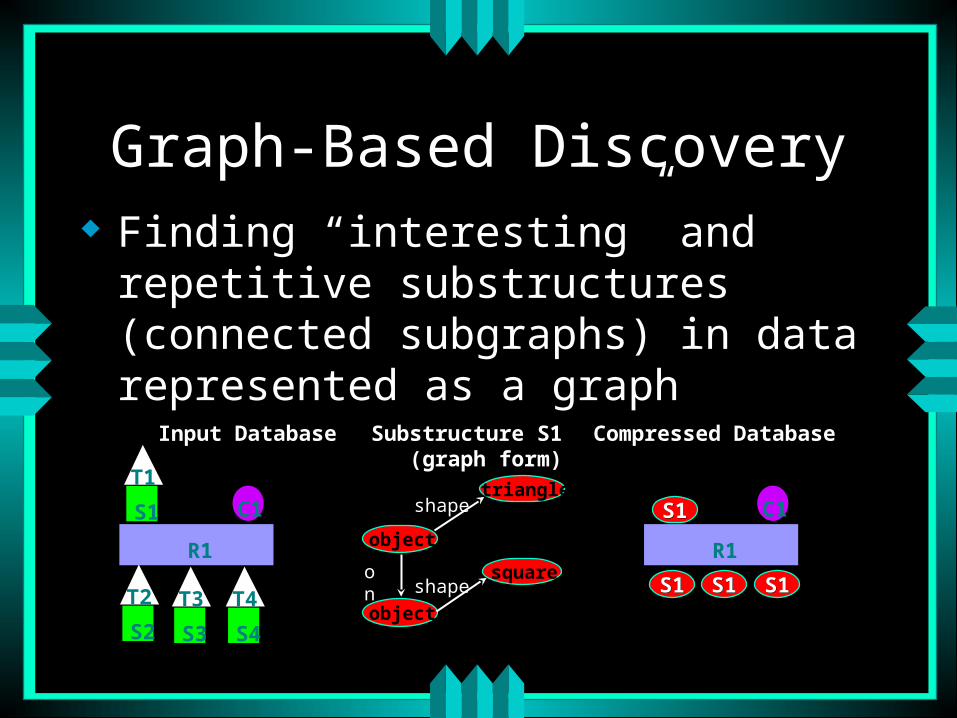
Graph-Based Discovery Finding “interesting” and repetitive
substructures (connected subgraphs) in data represented as a graph
object
triangle
R1
C1
T1
S1
T2
S2
T3
S3
T4
S4
Input Database Substructure S1 (graph form)
Compressed Database
R1
C1object
squareon
shape
shape S1S1 S1S1 S1S1
S1S1
object
triangle
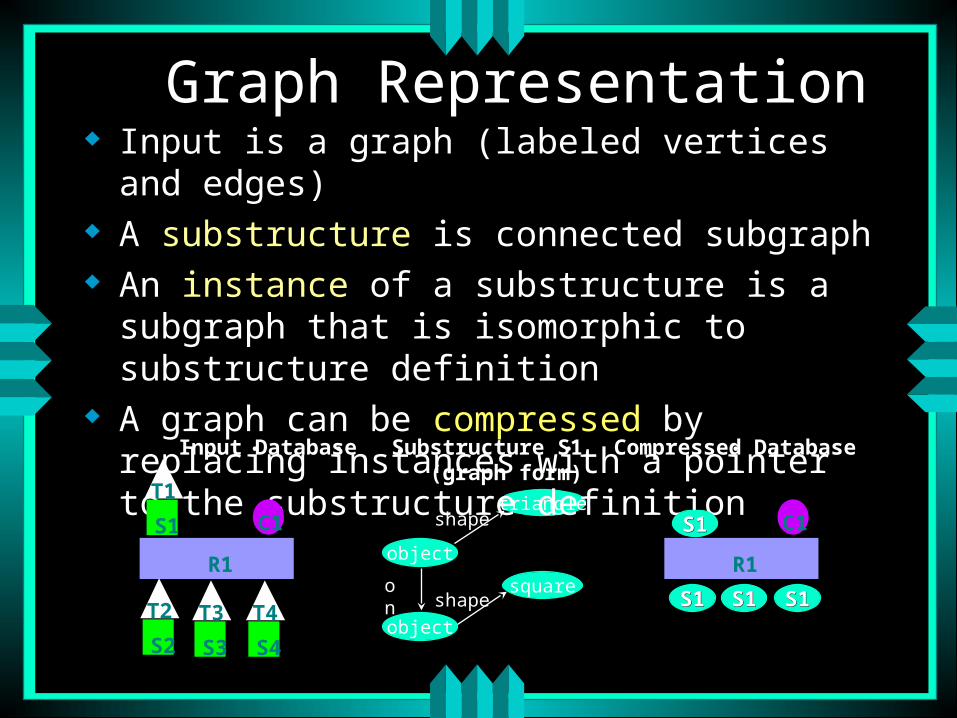
Graph Representation Input is a graph (labeled vertices and edges) A substructure is connected subgraph An instance of a substructure is a subgraph that is
isomorphic to substructure definition A graph can be compressed by replacing instances
with a pointer to the substructure definition
R1
C1
T1
S1
T2
S2
T3
S3
T4
S4
Input Database Substructure S1 (graph form)
Compressed Database
R1
C1object
squareon
shape
shape S1S1 S1S1 S1S1
S1S1
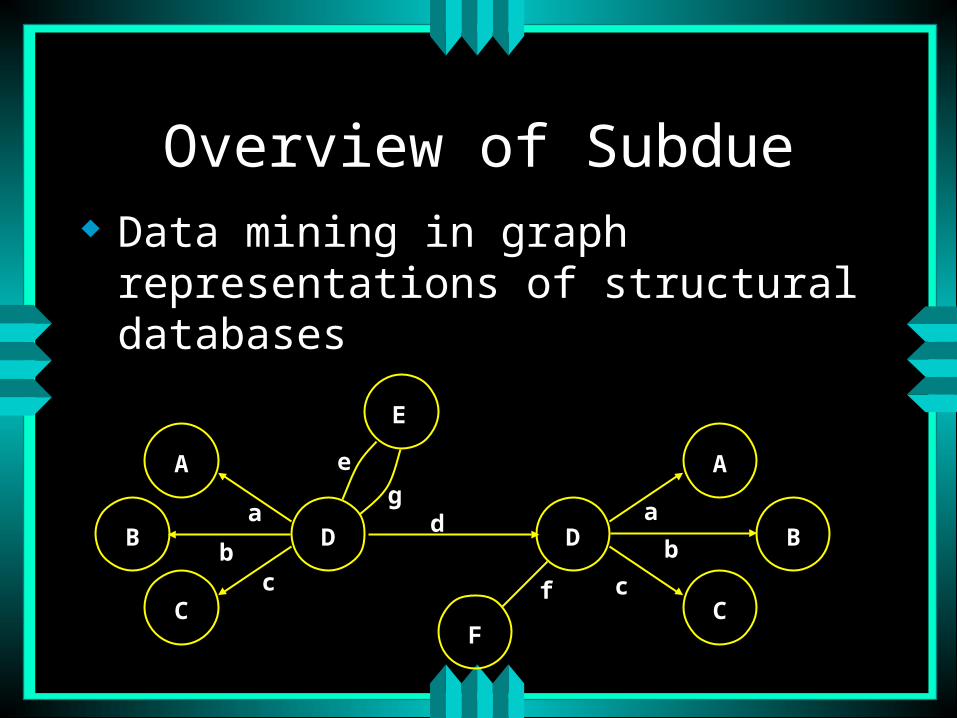
Overview of Subdue Data mining in graph representations of
structural databases
A
C
B D
A
C
BD
F
E
f c
b
ad
e
a
bc
g
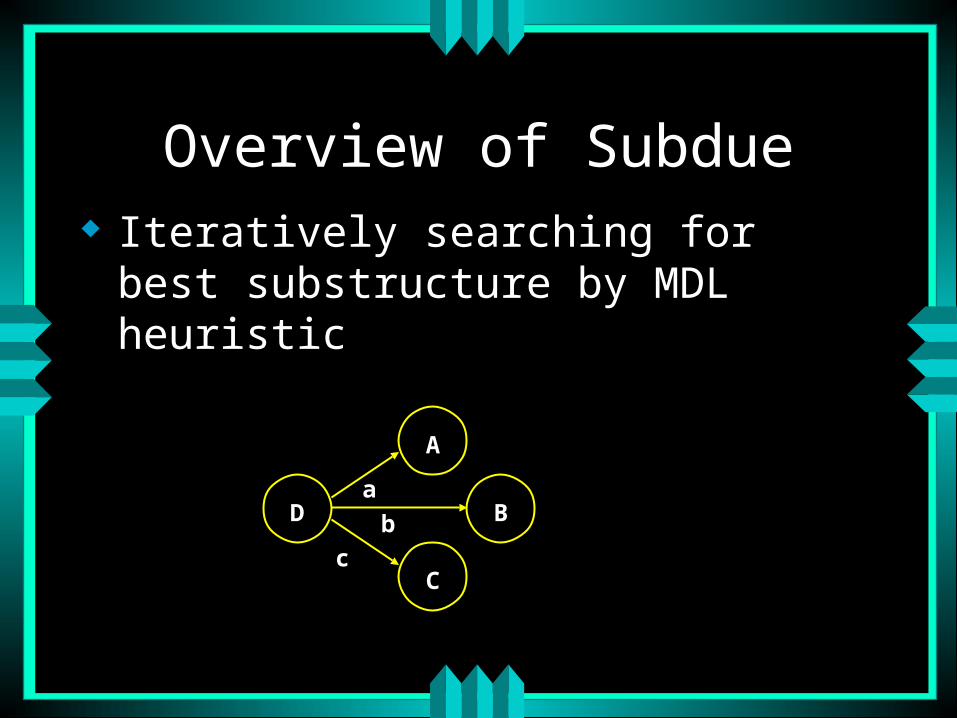
Overview of Subdue Iteratively searching for best substructure
by MDL heuristic
A
C
BD
c
b
a
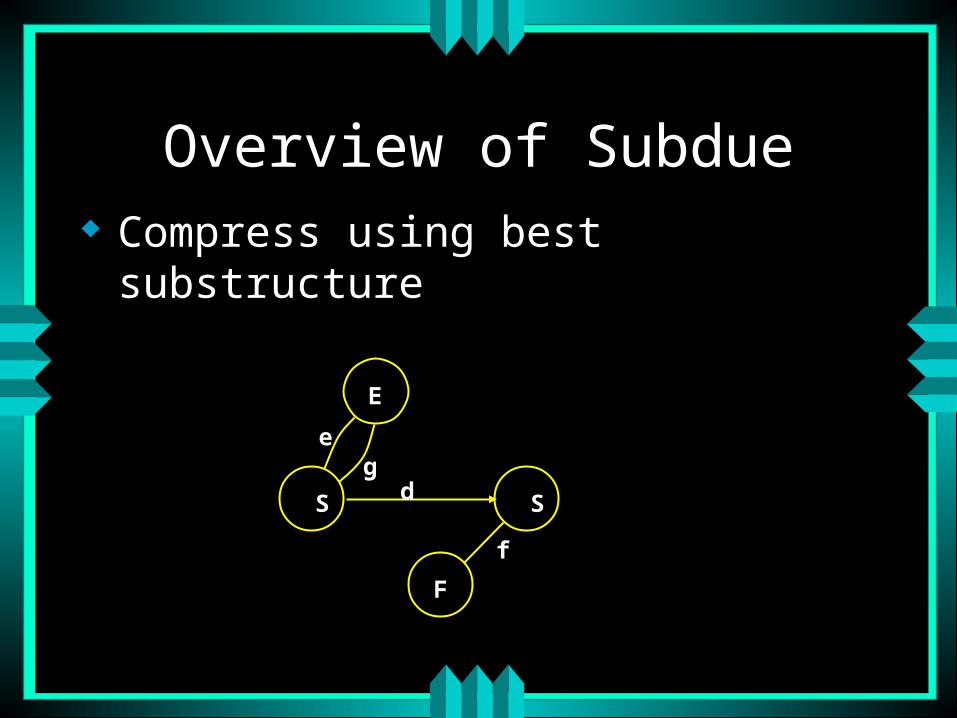
Overview of Subdue Compress using best substructure
S S
F
E
f
d
eg
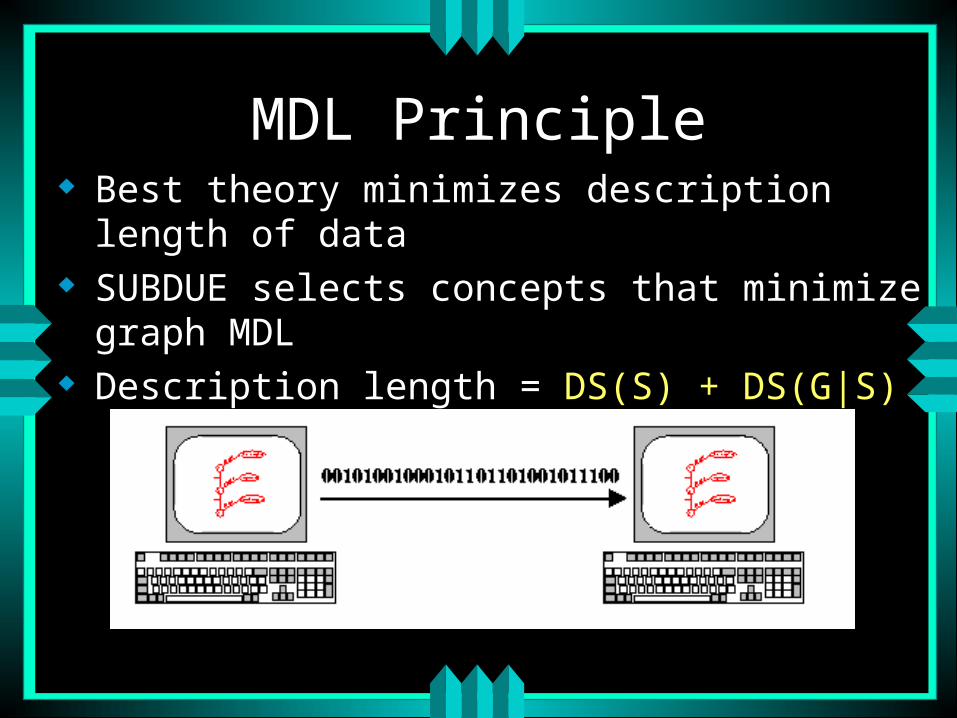
MDL Principle Best theory minimizes description length of data SUBDUE selects concepts that minimize graph MDL Description length = DS(S) + DS(G|S)
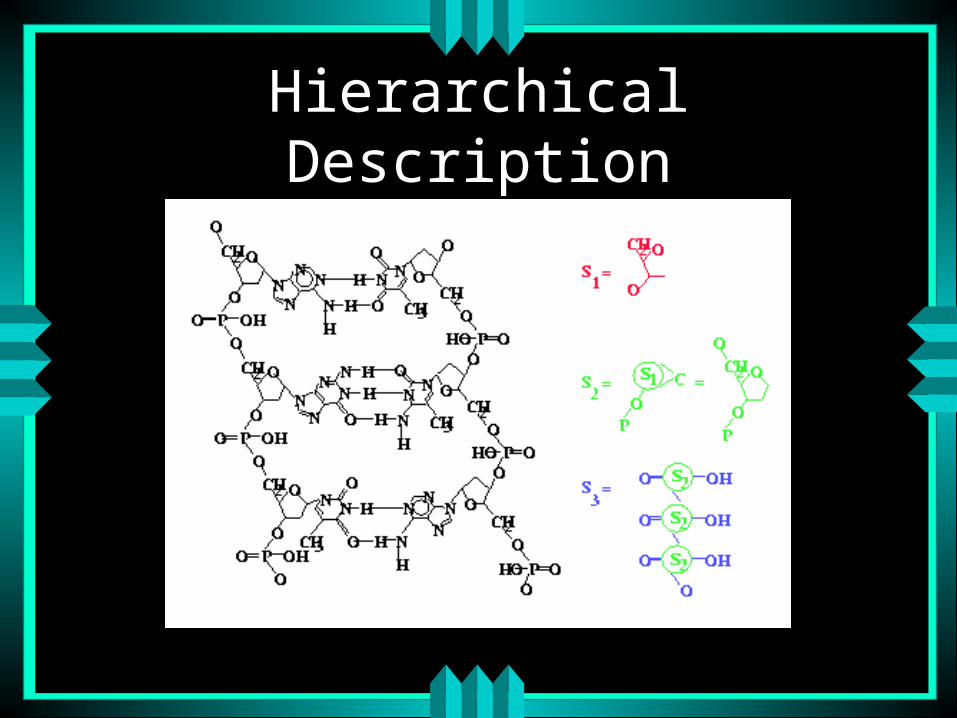
Hierarchical Description
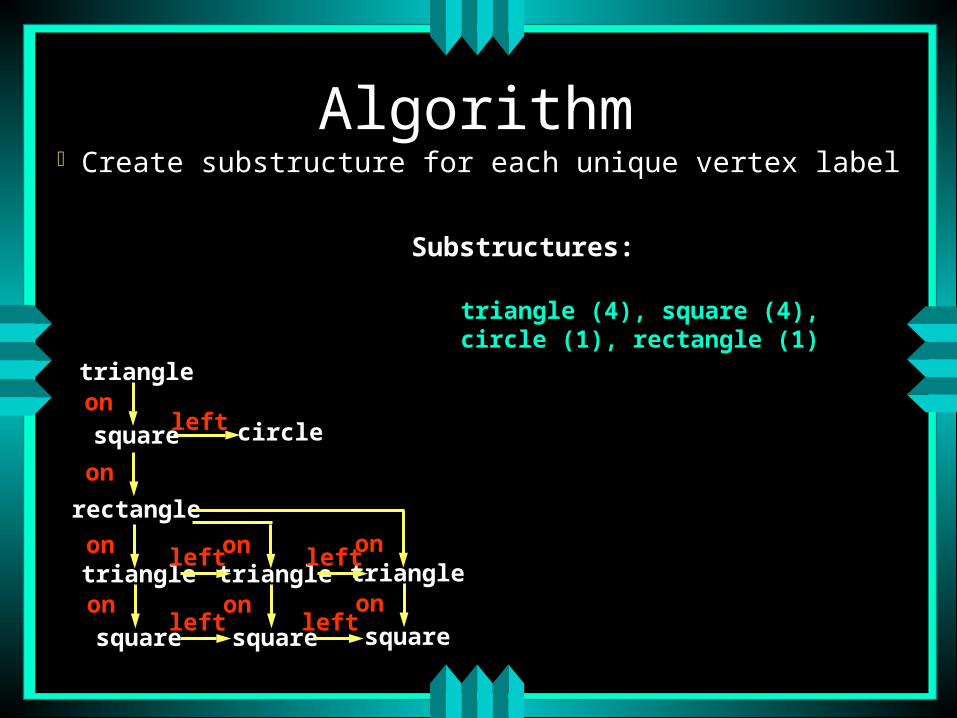
AlgorithmCreate substructure for each unique vertex label
circle
rectangle
left
triangle
square
on
on
triangle
square
on
ontriangle
square
on
ontriangle
square
on
onleft
left left
left
Substructures:
triangle (4), square (4),circle (1), rectangle (1)
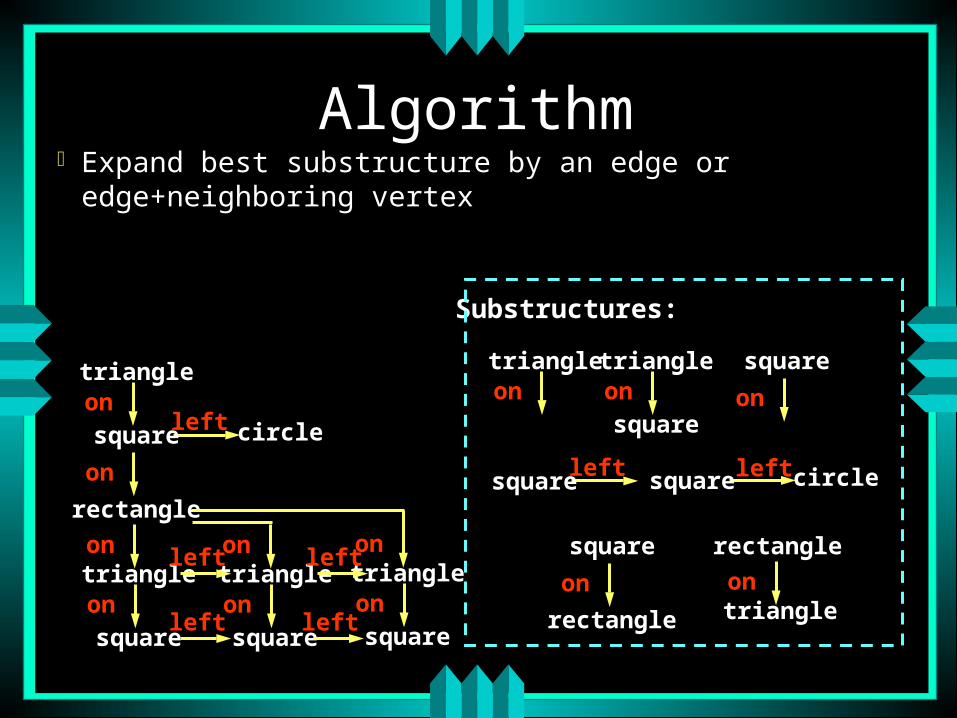
Algorithm Expand best substructure by an edge or edge+neighboring vertex
circle
rectangle
left
triangle
square
on
on
triangle
square
on
ontriangle
square
on
ontriangle
square
on
onleft
left left
left
Substructures:
triangleon
triangle
square
on
circleleftsquareleftsquare
square
on
rectangle
square
on
rectangle
triangleon
AlgorithmKeep only best substructures on queue
(specified by beam width)Terminate when search queue is empty or
when #discovered substructures >= limitCompress graph and repeat to generate
hierarchical description
Inexact Graph Match Some variations may occur between instances Noise, small differences Want to abstract over minor differences Difference = cost of transforming one graph to
make it isomorphic to another Vertex/edge addition, delete, label substitution Match if cost/size < threshold
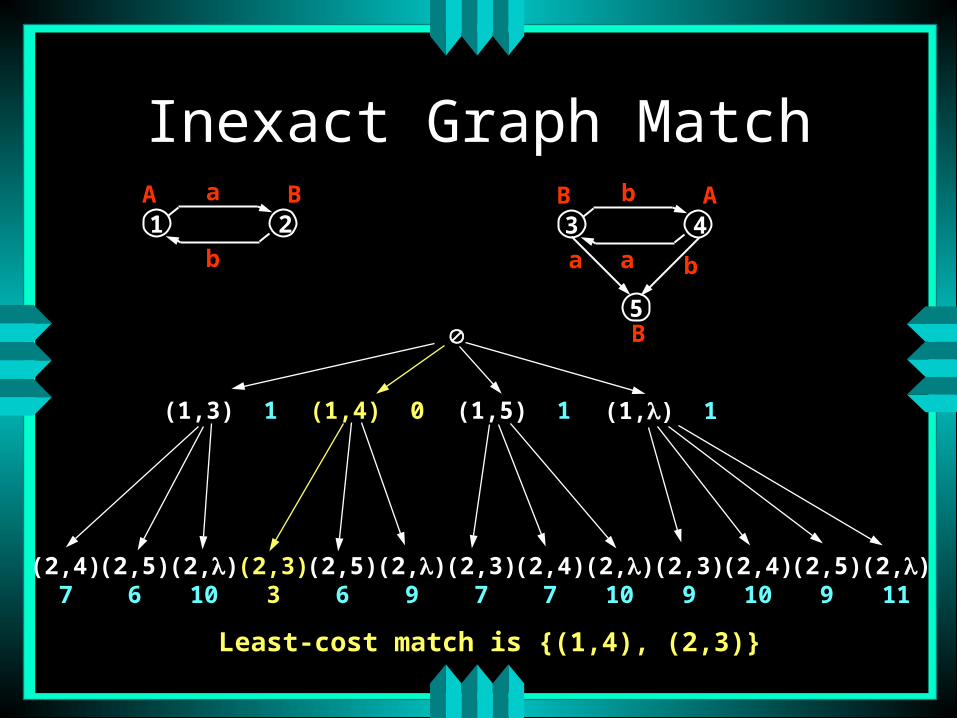
Inexact Graph Match
5
1 2A Ba
b
3 4B Ab
aa b
B
(1,3) 1 (1,4) 0 (1,5) 1 (1,) 1
(2,4)7
(2,5)6
(2,)10
(2,3)3
(2,5)6
(2,)9
(2,3)7
(2,4)7
(2,)10
(2,3)9
(2,4)10
(2,5)9
(2,)11
Least-cost match is {(1,4), (2,3)}
Background Knowledge Some substructures not relevant Background knowledge can direct search Two types
• Model knowledge
• Graph match rules
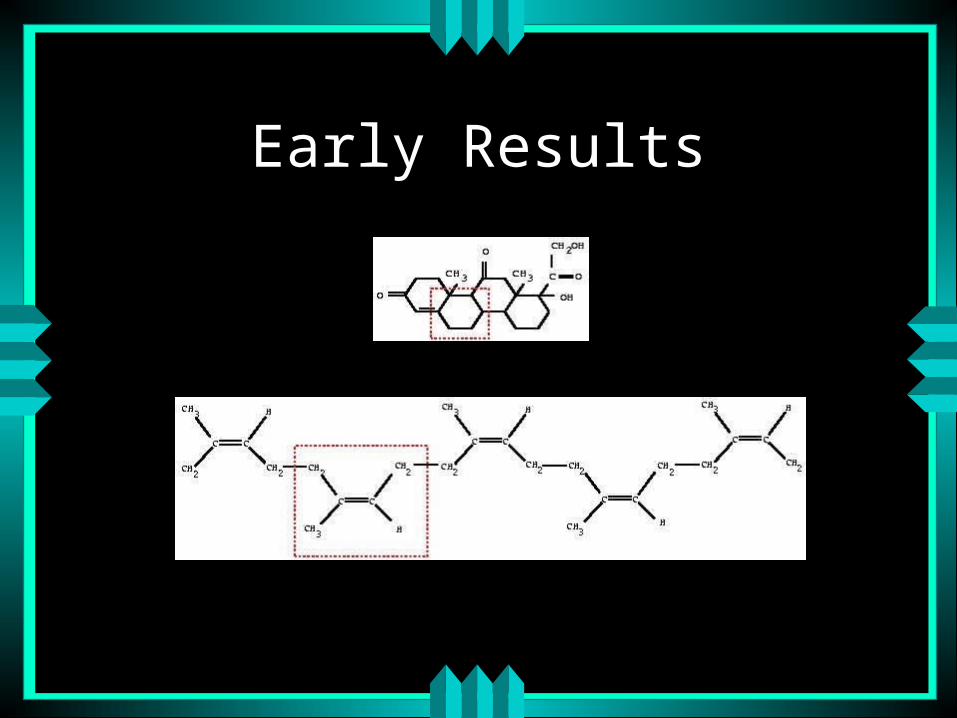
Early Results
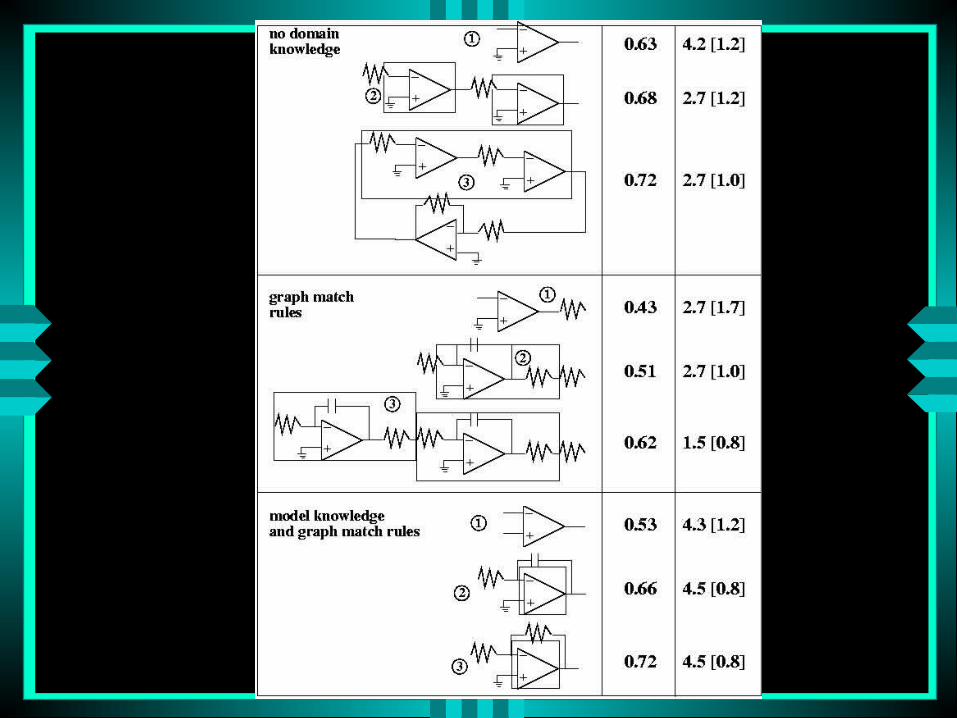
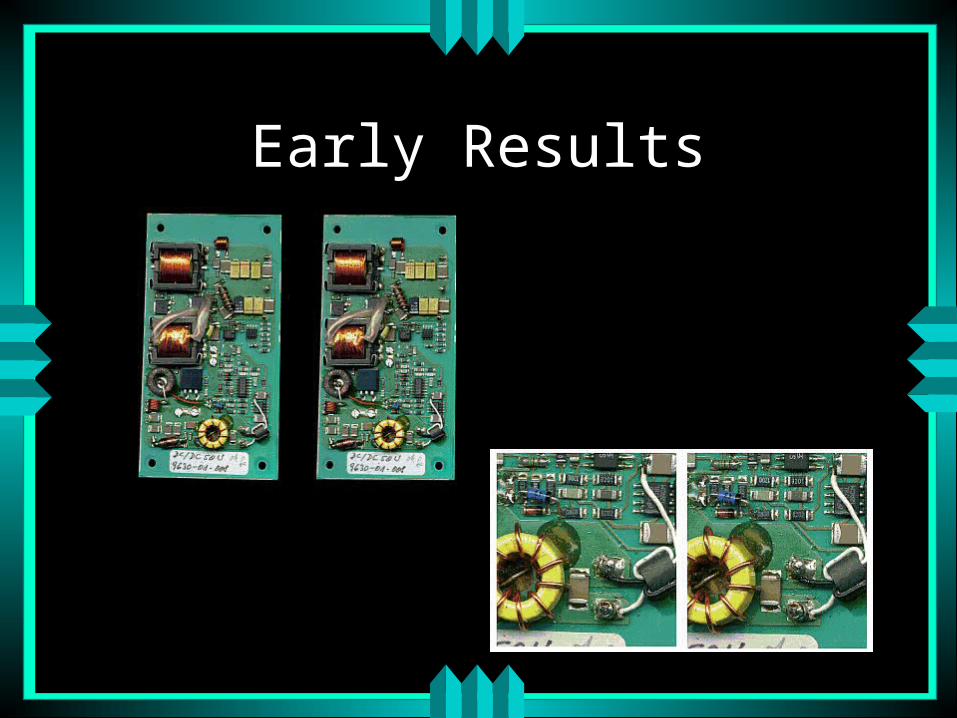
Early Results
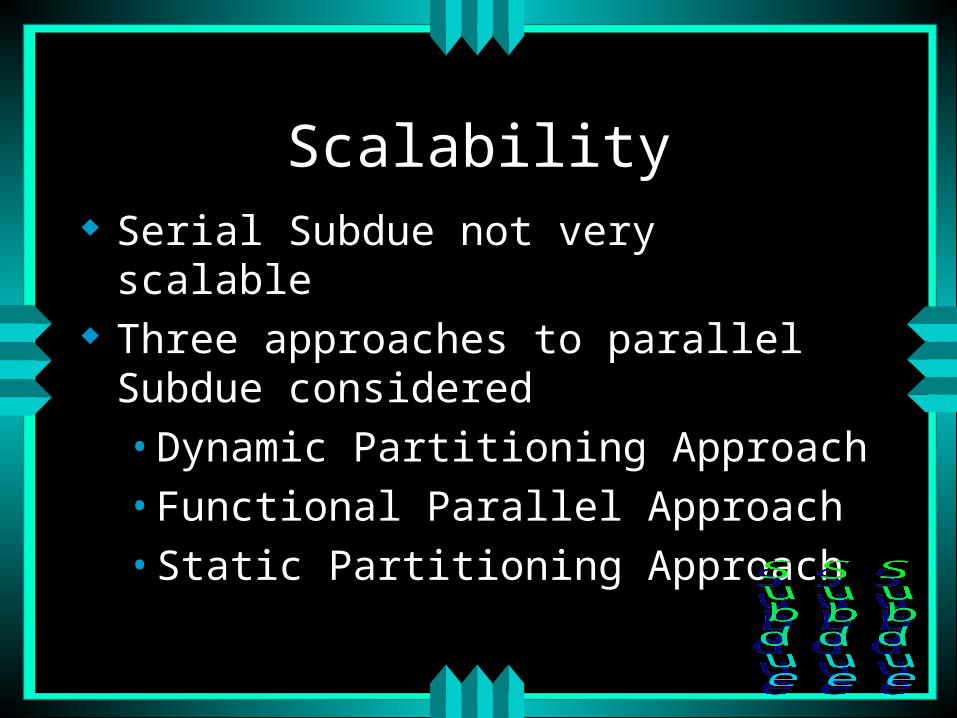
Scalability Serial Subdue not very scalable Three approaches to parallel Subdue
considered
• Dynamic Partitioning Approach
• Functional Parallel Approach
• Static Partitioning Approach
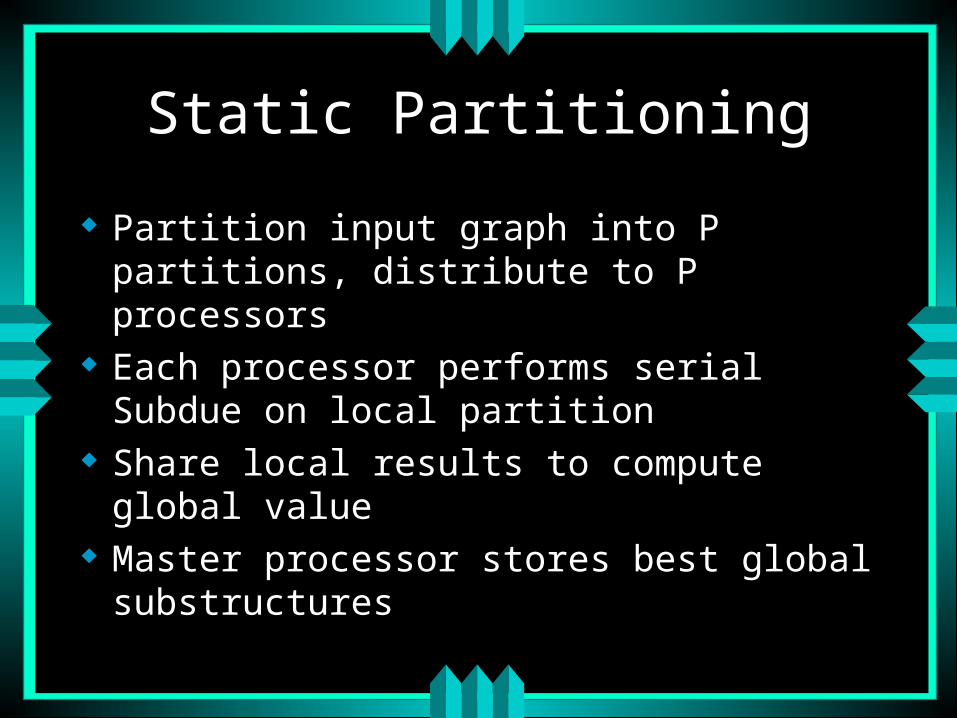
Static Partitioning
Partition input graph into P partitions, distribute to P processors
Each processor performs serial Subdue on local partition
Share local results to compute global value Master processor stores best global
substructures
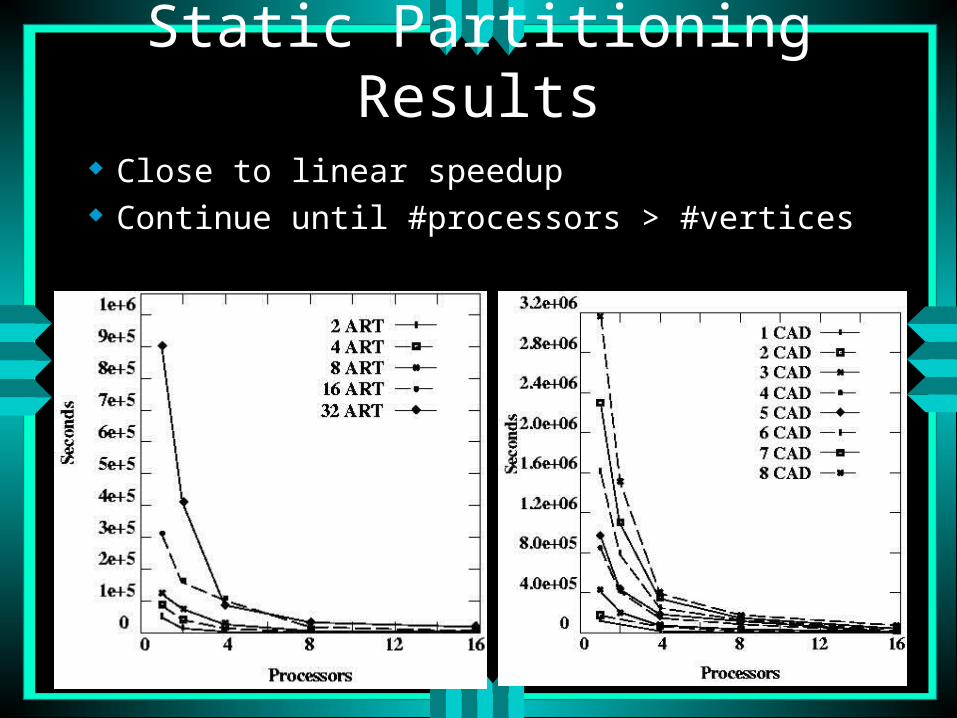
Static Partitioning Results Close to linear speedup Continue until #processors > #vertices
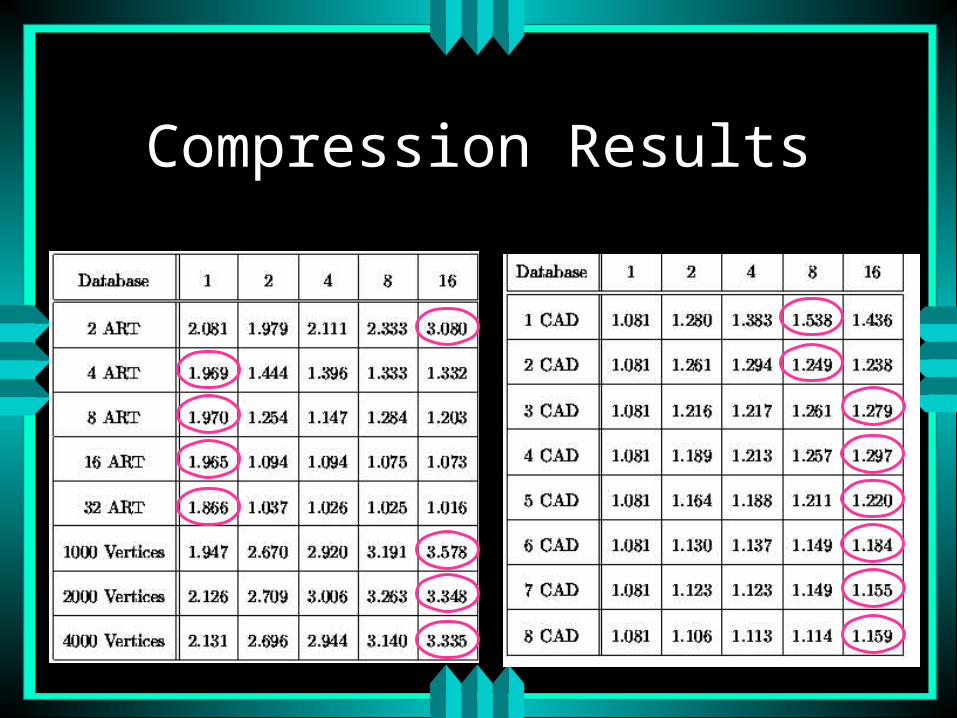
Compression Results
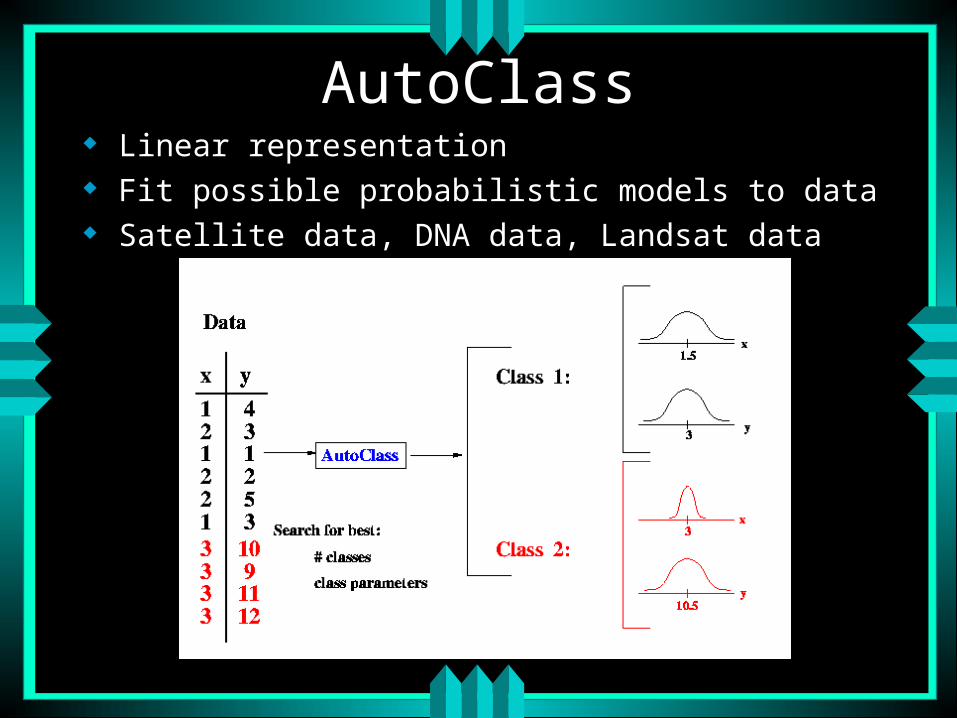
AutoClass Linear representation Fit possible probabilistic models to data Satellite data, DNA data, Landsat data
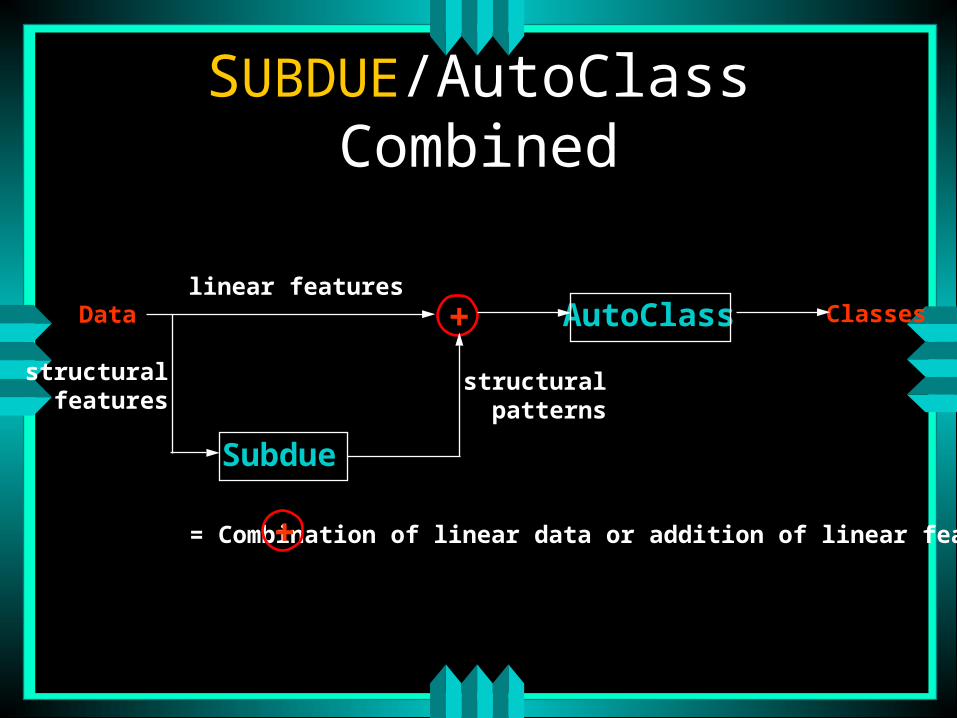
SUBDUE/AutoClass Combined
Data
structural features
structural patterns
Classeslinear features
= Combination of linear data or addition of linear features
Subdue
AutoClass+
+
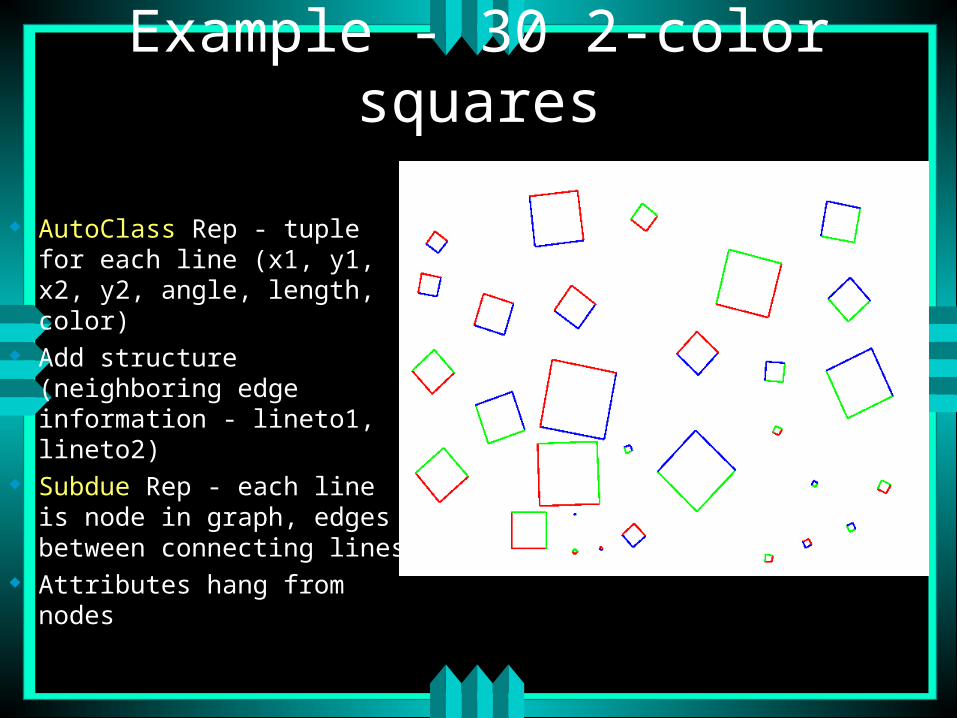
Example - 30 2-color squares
AutoClass Rep - tuple for each line (x1, y1, x2, y2, angle, length, color)
Add structure (neighboring edge information - lineto1, lineto2)
Subdue Rep - each line is node in graph, edges between connecting lines
Attributes hang from nodes
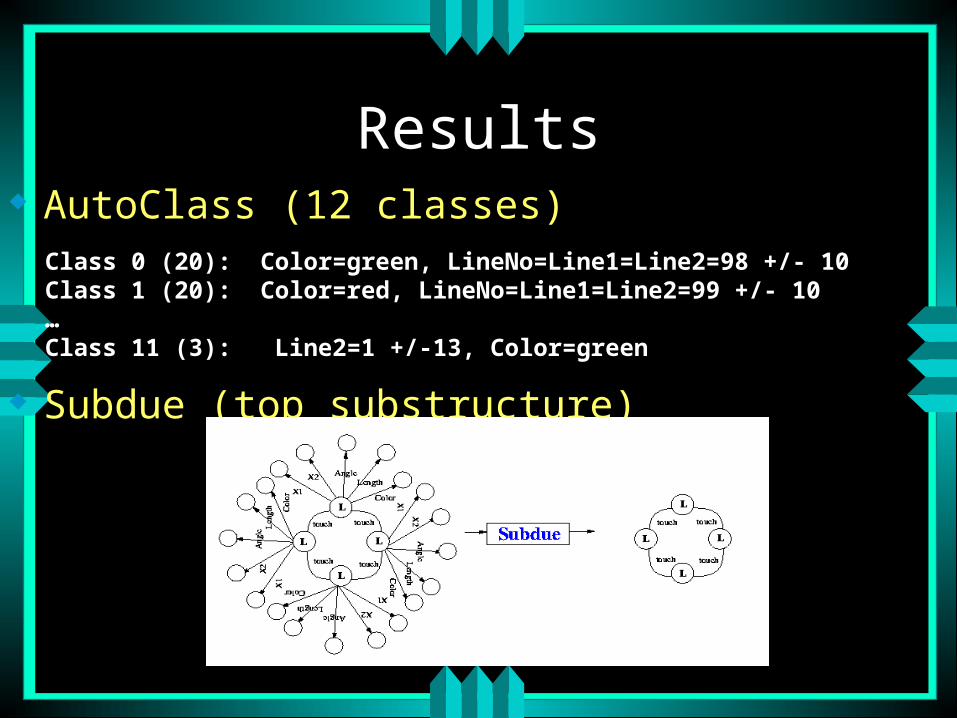
Results AutoClass (12 classes)
Subdue (top substructure)
Class 0 (20): Color=green, LineNo=Line1=Line2=98 +/- 10Class 1 (20): Color=red, LineNo=Line1=Line2=99 +/- 10…Class 11 (3): Line2=1 +/-13, Color=green
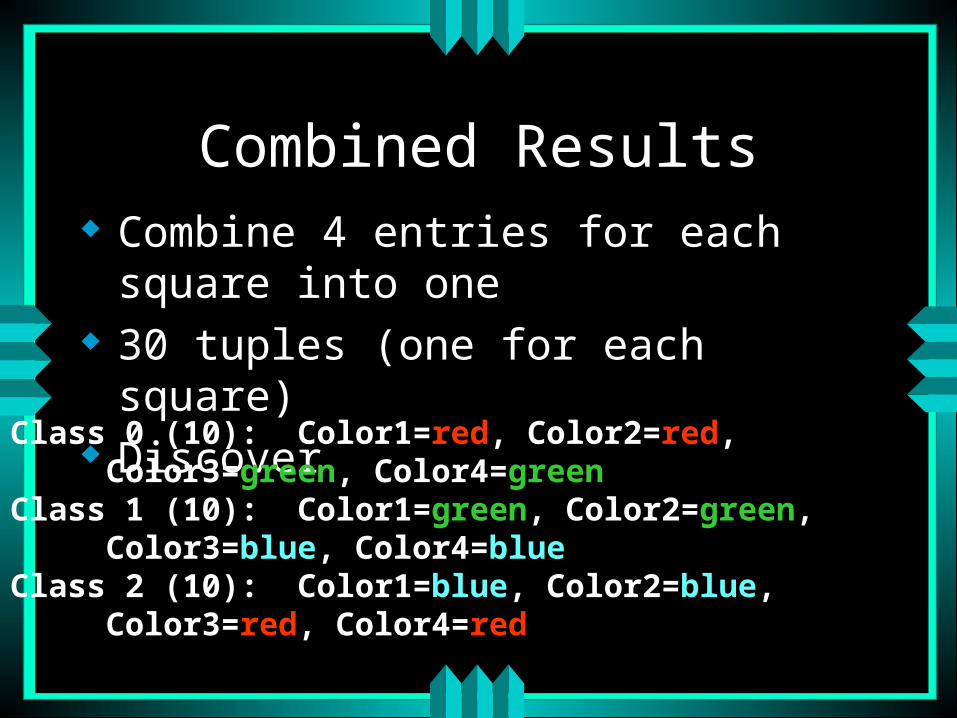
Combined Results Combine 4 entries for each square into one 30 tuples (one for each square) Discover
Class 0 (10): Color1=red, Color2=red,Color3=green, Color4=green
Class 1 (10): Color1=green, Color2=green, Color3=blue, Color4=blue
Class 2 (10): Color1=blue, Color2=blue,Color3=red, Color4=red
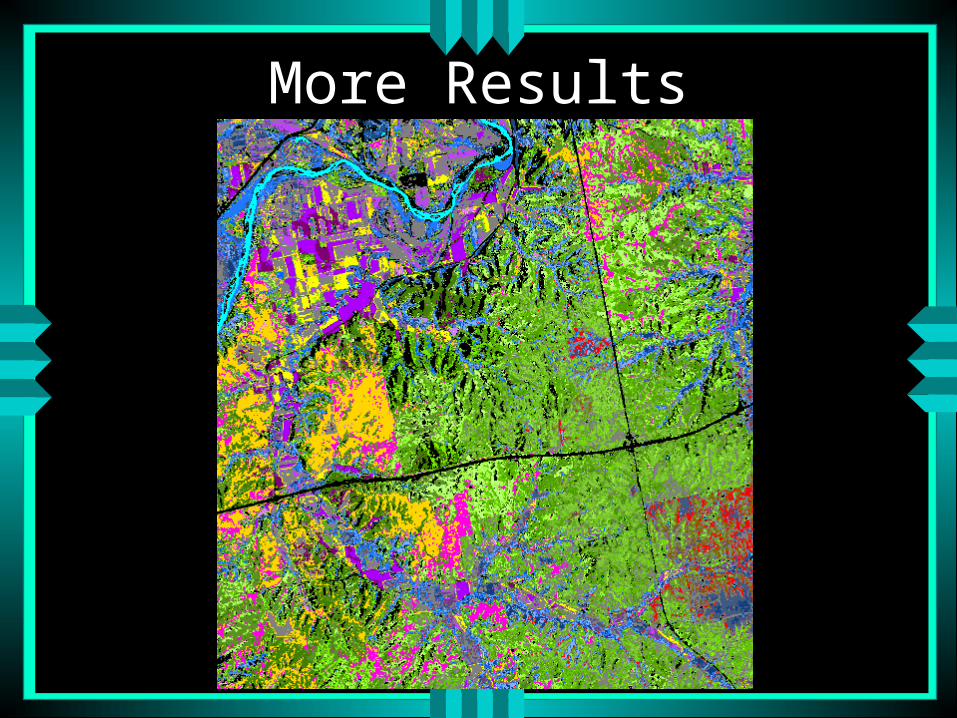
More Results
Supervised SUBDUE One graph stores positive examples One graph stores negative examples Find substructure that compresses positive
graph but not negative graph
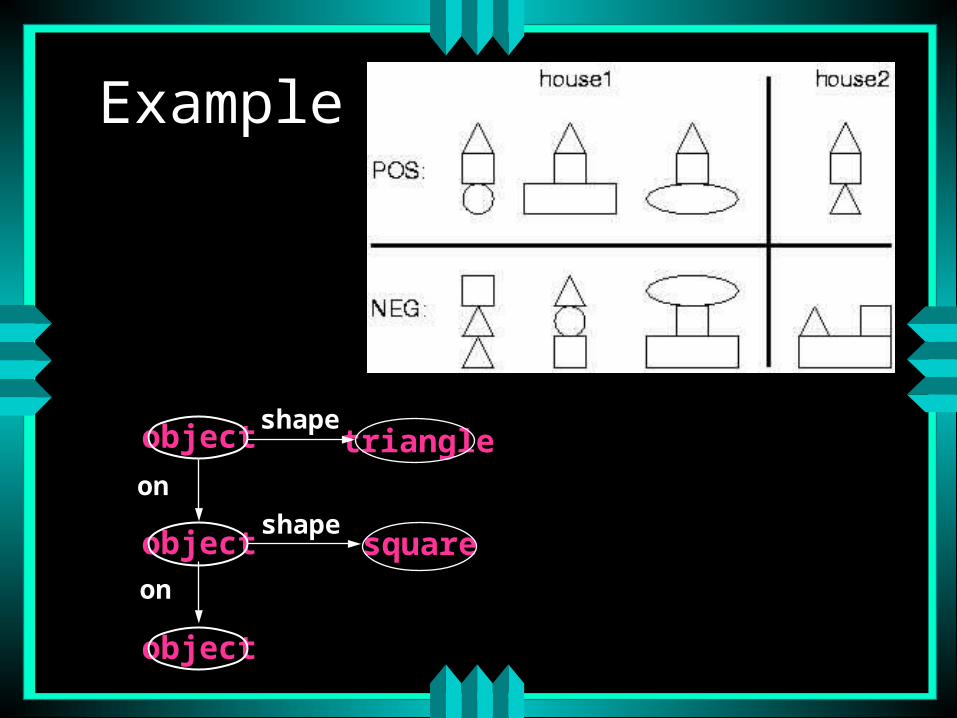
Example
object
object
object
on
on
triangle
square
shape
shape
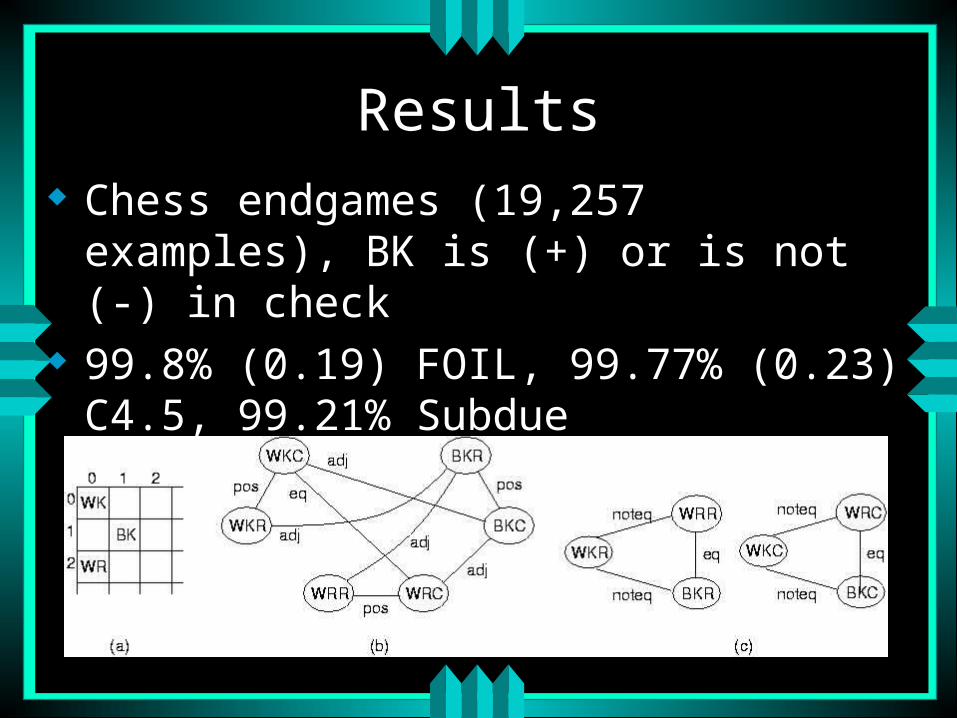
Results Chess endgames (19,257 examples), BK is (+)
or is not (-) in check 99.8% (0.19) FOIL, 99.77% (0.23) C4.5,
99.21% Subdue
More Results Tic Tac Toe endgames
• End configurations (958 examples), + is win for X
• 100% Subdue, 92.35% (0.21) FOIL, 96.03% (0.03) C4.5
Bach chorales
• Musical sequences (20 sequences)
• 100% Subdue, 85.71% (0.06) FOIL, 82.00% (0.00) C4.5
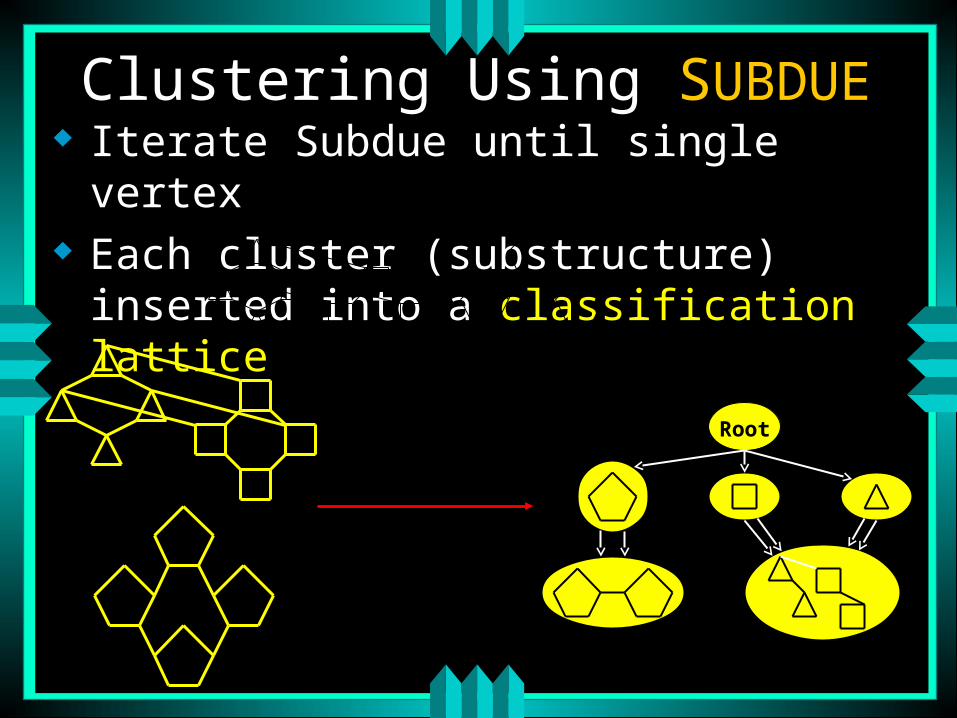
Clustering Using SUBDUE Iterate Subdue until single vertex Each cluster (substructure) inserted into a
classification lattice
Root
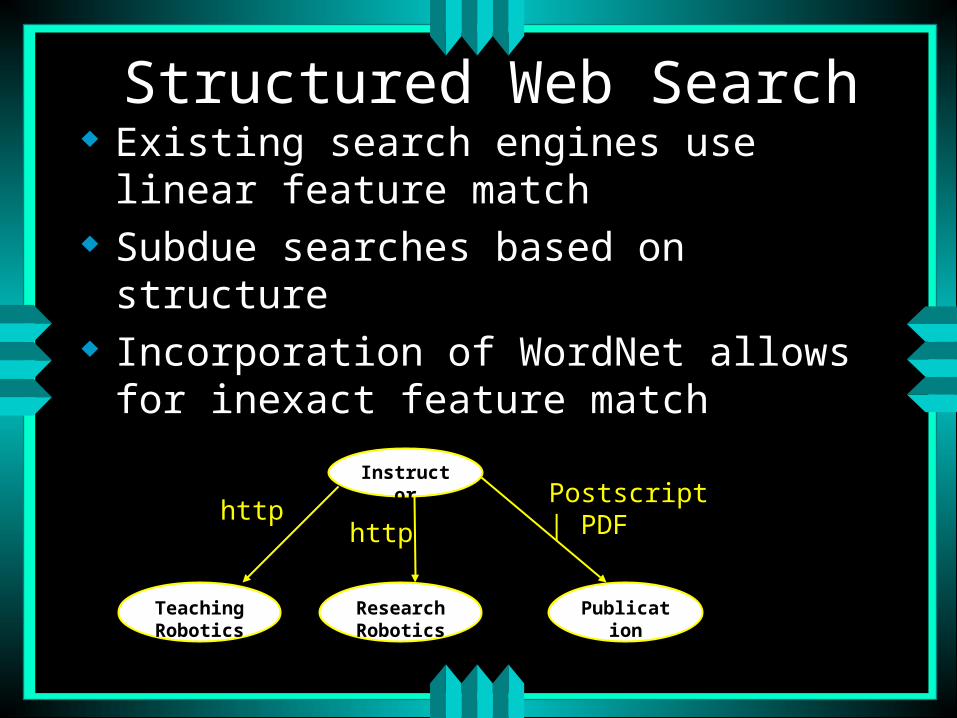
Structured Web Search Existing search engines use linear feature
match Subdue searches based on structure Incorporation of WordNet allows for
inexact feature match
Instructor
TeachingRobotics
ResearchRobotics
Publication
Robotics
httphttp
Postscript| PDF
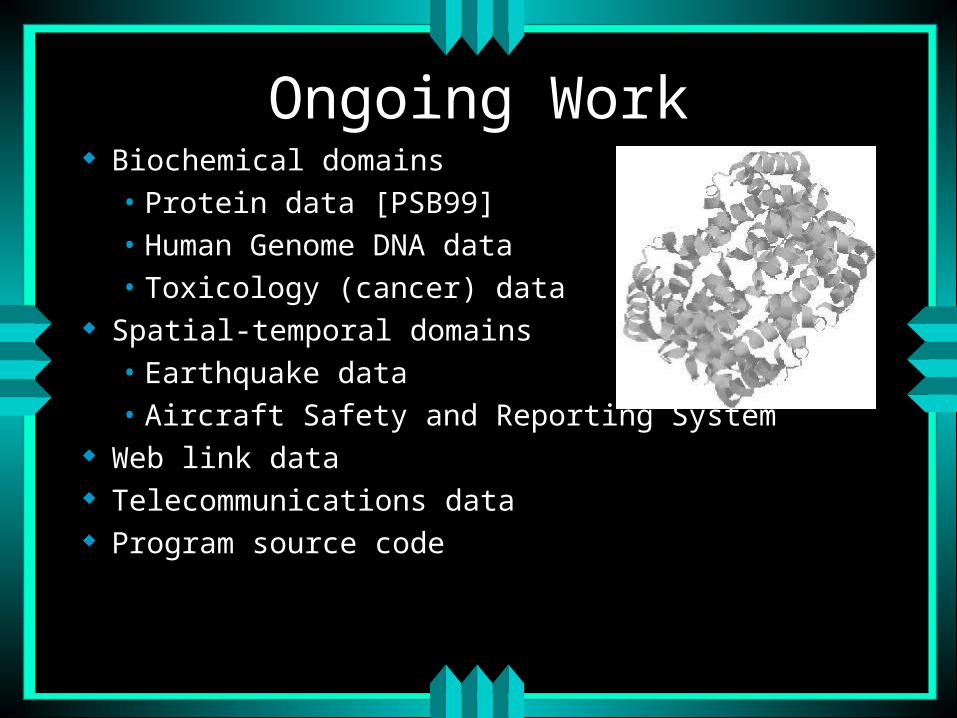
Ongoing Work Biochemical domains
• Protein data [PSB99]• Human Genome DNA data• Toxicology (cancer) data
Spatial-temporal domains• Earthquake data• Aircraft Safety and Reporting System
Web link data Telecommunications data Program source code