Embed Size (px)
Citation preview
Graph Drawing
Zsuzsanna Hollander
Reviewed Papers
Effective Graph Visualization via Node Grouping Janet M. Six and Ioannis G. Tollis. Proc InfoVis 2001
Visualization of State Transition Graphs Frank van Ham, Huub van de Wetering, Jarke J. van Wijk. Proc InfoVis 2001.
FADE: Graph Drawing, Clustering, and Visual Abstraction Aaron J. Quigley and Peter Eades, Proc. Graph Drawing 2000
Effective Graph Visualization via Node Grouping
visualizes large graphs 2D drawing assumes the existence of complete or almost
complete subgraphs in the graph to be visualized
use of two type of techniques: force directed orthogonal drawing
Levels of Abstraction
total abstraction proximity abstraction explicit proximity abstraction interactive abstraction
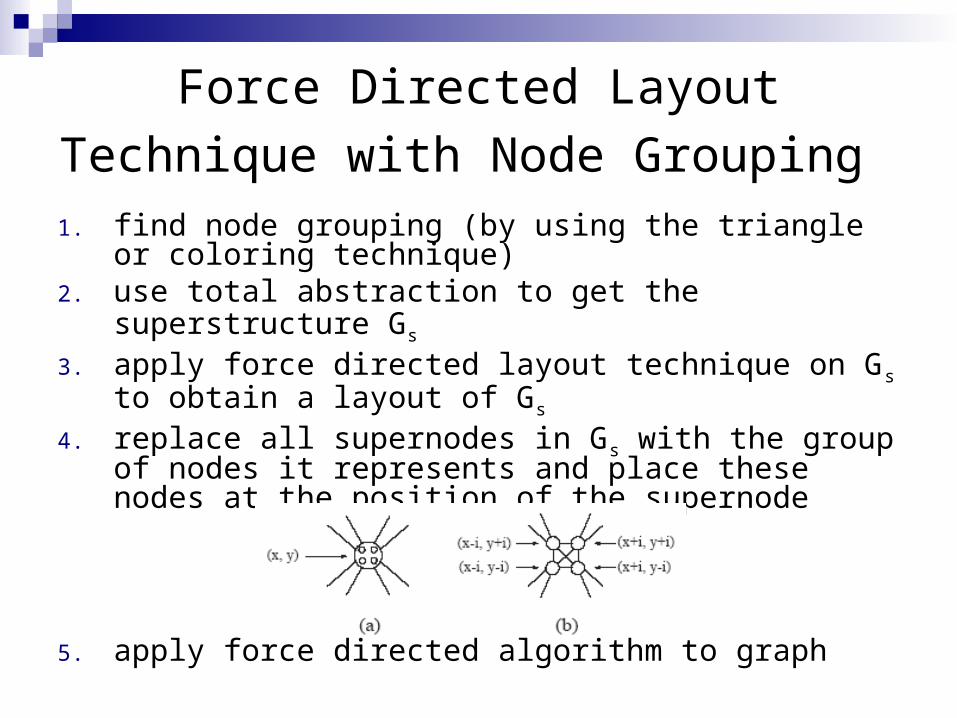
Force Directed Layout Technique with
Node Grouping 1. find node grouping (by using the triangle or
coloring technique)2. use total abstraction to get the superstructure Gs
3. apply force directed layout technique on Gs to obtain a layout of Gs
4. replace all supernodes in Gs with the group of nodes it represents and place these nodes at the position of the supernode
5. apply force directed algorithm to graph
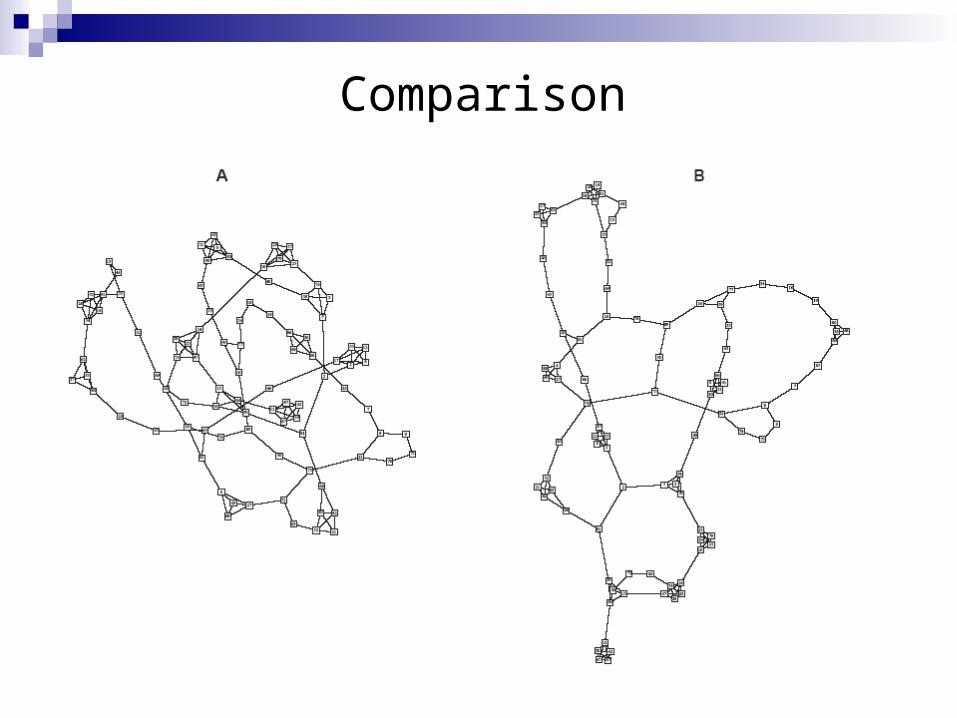
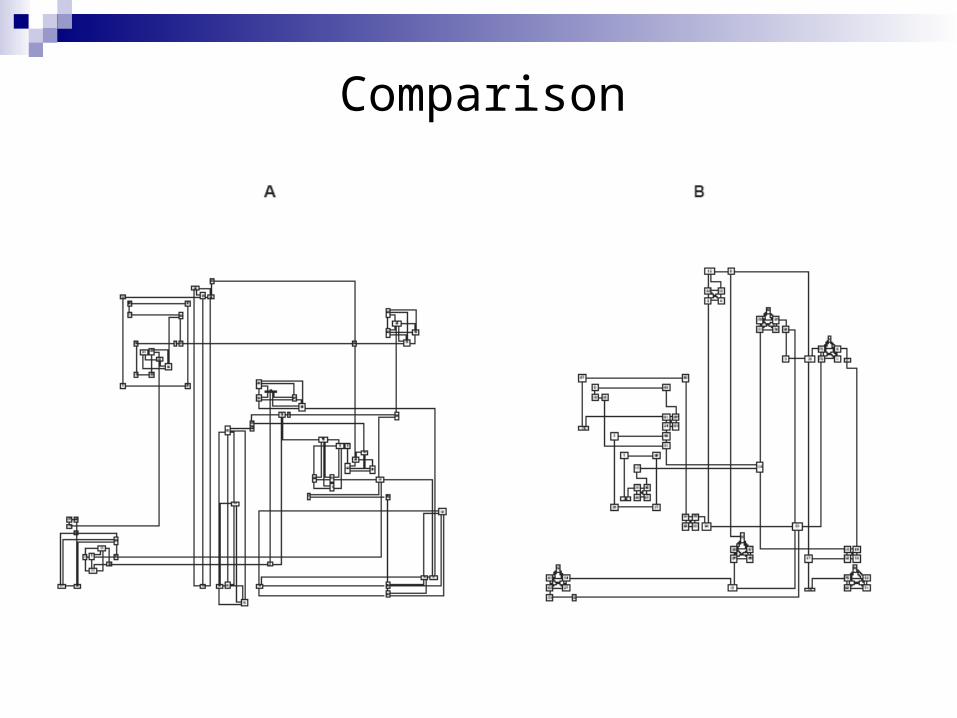
Comparison
Comparison
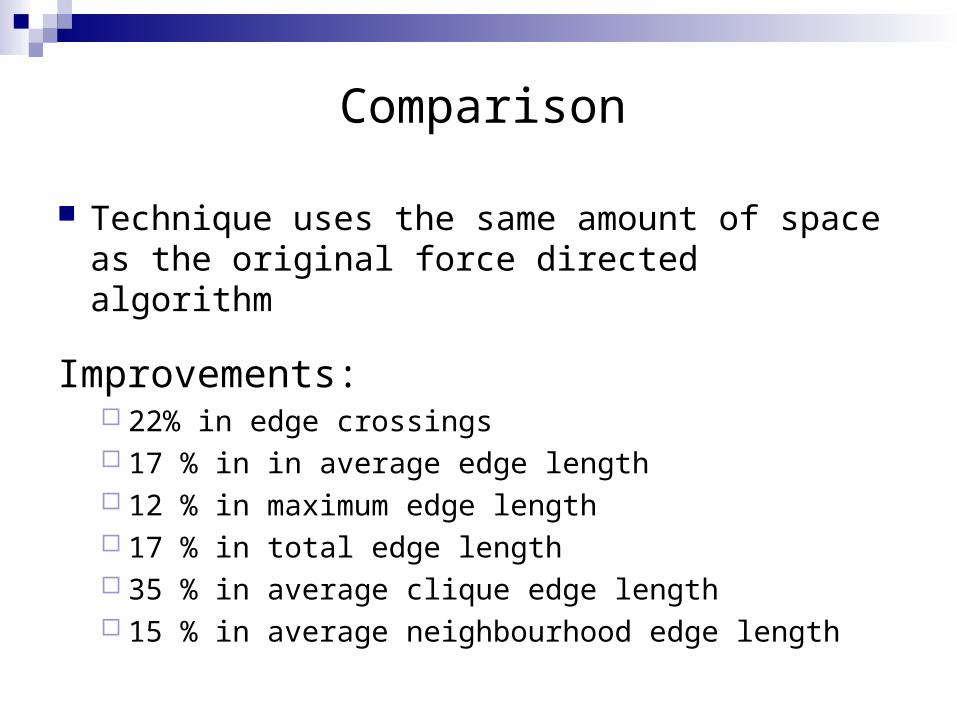
Technique uses the same amount of space as the original force directed algorithm
Improvements: 22% in edge crossings 17 % in in average edge length 12 % in maximum edge length 17 % in total edge length 35 % in average clique edge length 15 % in average neighbourhood edge length
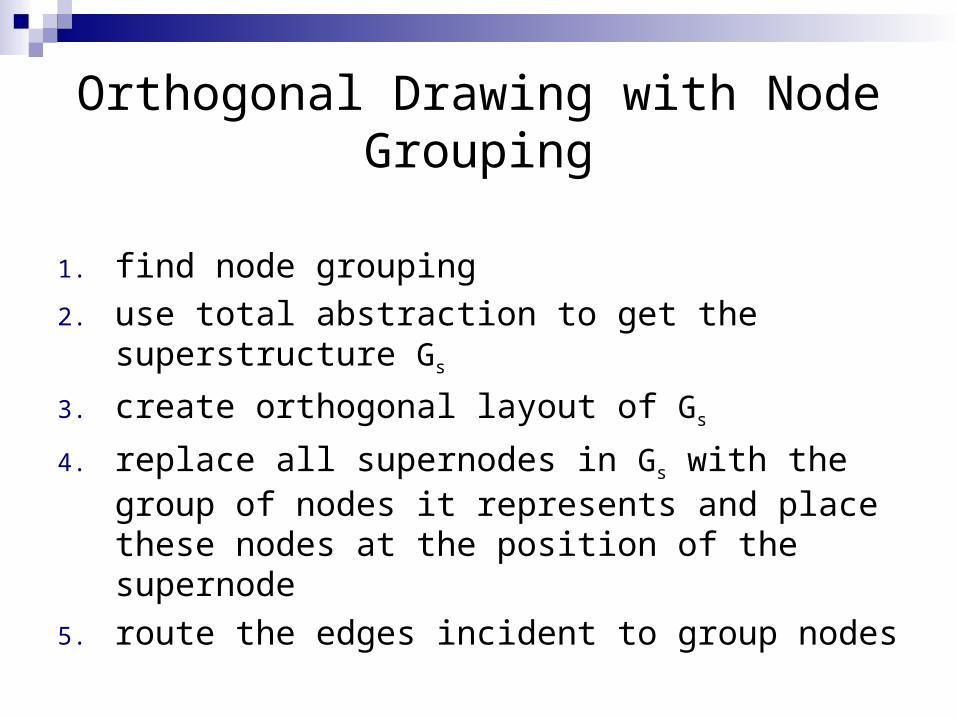
Orthogonal Drawing with Node Grouping
1. find node grouping
2. use total abstraction to get the superstructure Gs
3. create orthogonal layout of Gs
4. replace all supernodes in Gs with the group of nodes it represents and place these nodes at the position of the supernode
5. route the edges incident to group nodes
Comparison
Comparison
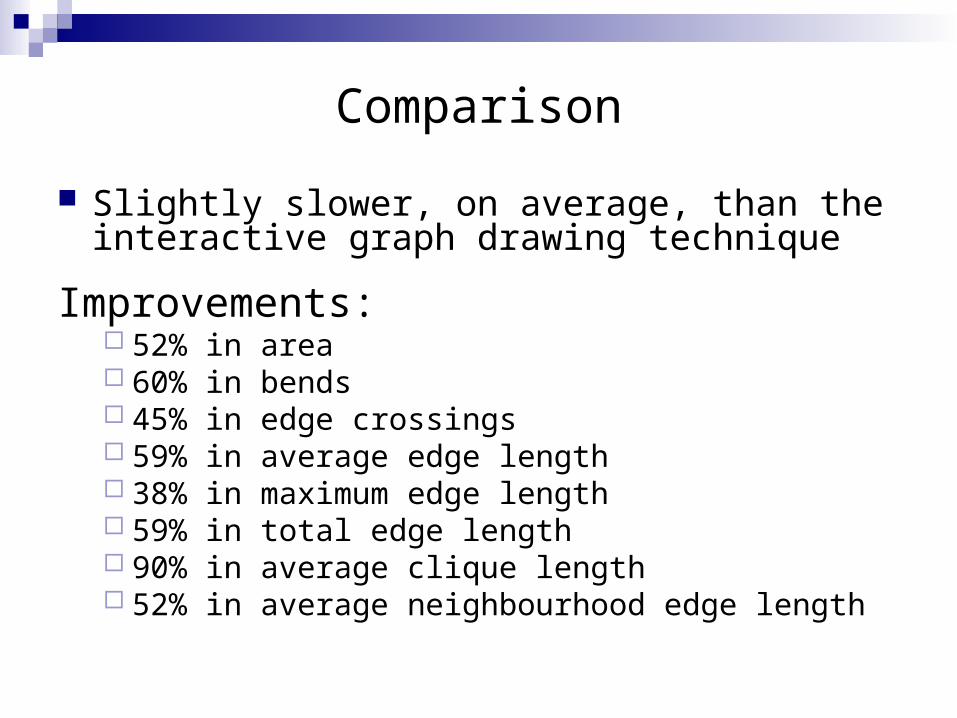
Slightly slower, on average, than the interactive graph drawing technique
Improvements: 52% in area 60% in bends 45% in edge crossings 59% in average edge length 38% in maximum edge length 59% in total edge length 90% in average clique length 52% in average neighbourhood edge length
Comparison
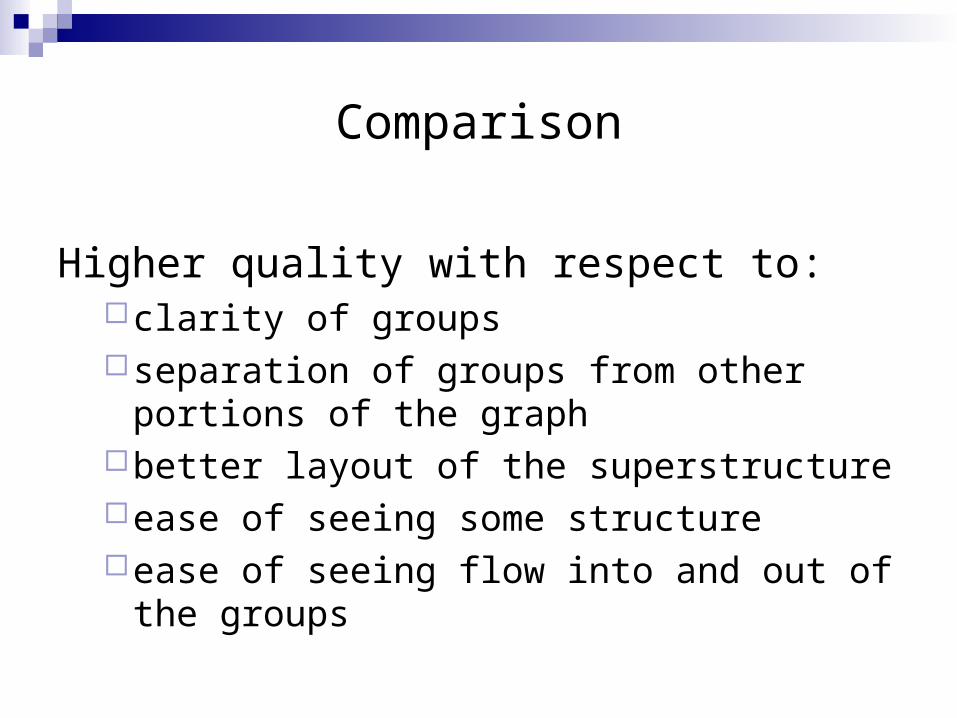
Higher quality with respect to:clarity of groupsseparation of groups from other portions of
the graphbetter layout of the superstructureease of seeing some structureease of seeing flow into and out of the groups
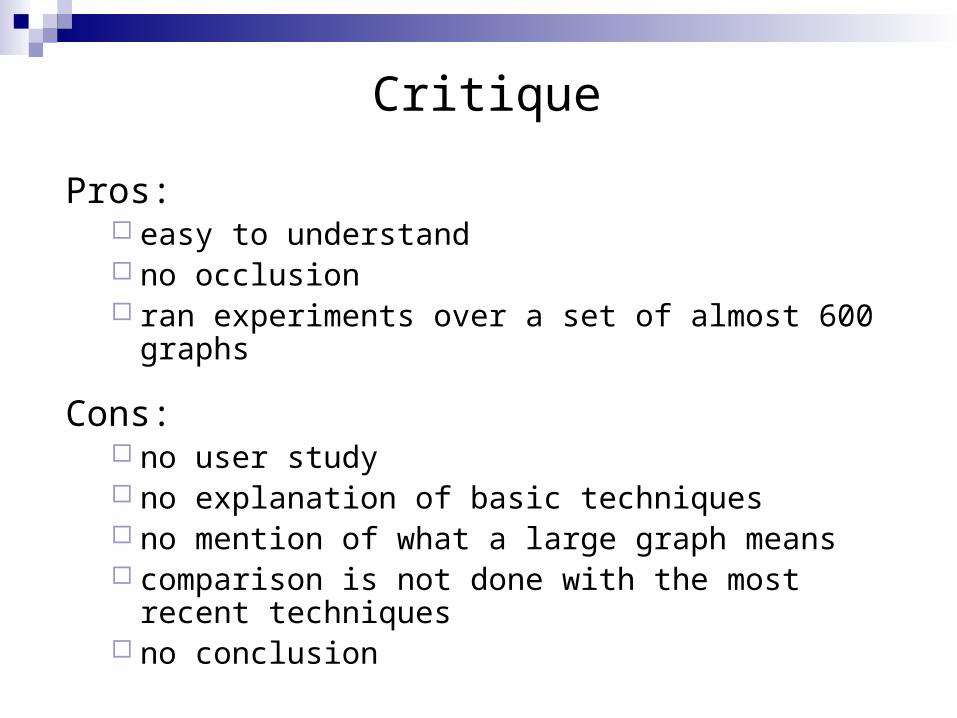
Critique
Pros: easy to understand no occlusion ran experiments over a set of almost 600 graphs
Cons: no user study no explanation of basic techniques no mention of what a large graph means comparison is not done with the most recent
techniques no conclusion
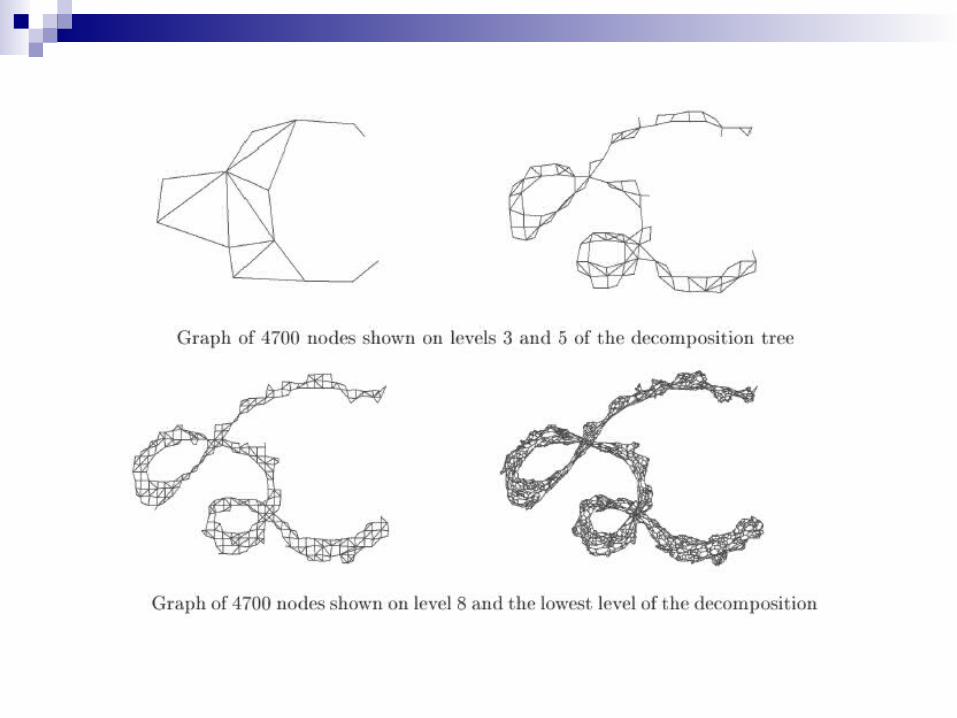
FADE: Graph Drawing, Clustering, and Visual Abstraction
fast algorithm for the drawing of large undirected graphs
is based on the force directed approach clustering space decomposition
2D drawing
Main Concepts
Clustering: performed based on the structure of graph allows performance improvement allows multi-level viewing
Geometric clustering: points close to each other belong to the
same cluster points far apart belong to different clusters
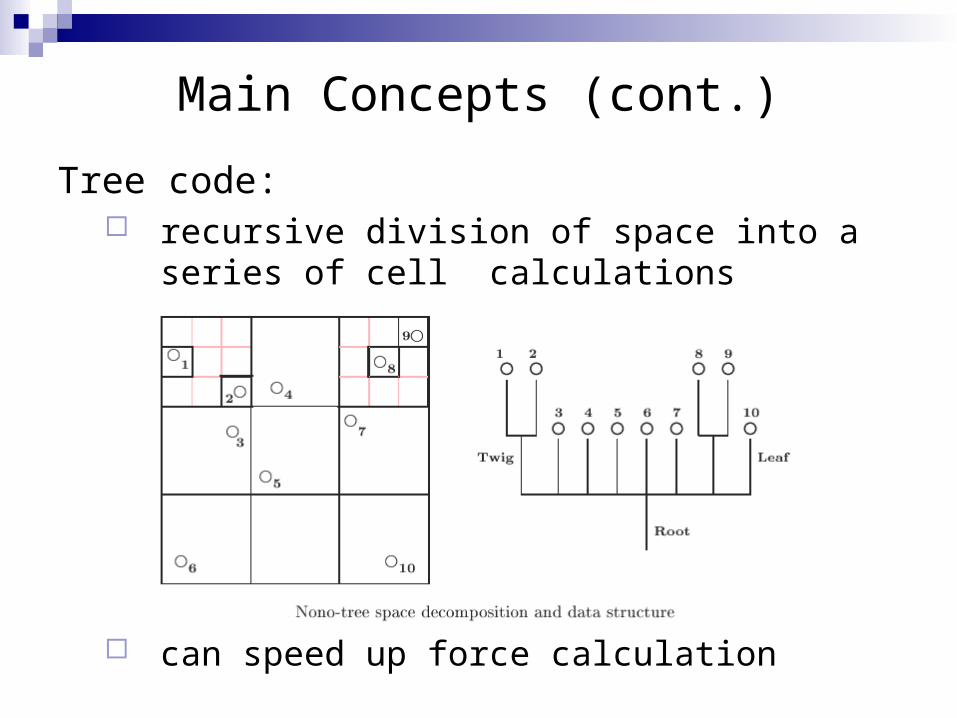
Main Concepts (cont.)
Tree code: recursive division of space into a series of cell
calculations
can speed up force calculation

FADE Algorithm
REPEAT
1. Construct geometric clustering using space decomposition
2. Compute edge forces
3. Compute non-edge forces
4. Move nodes
UNTIL convergence
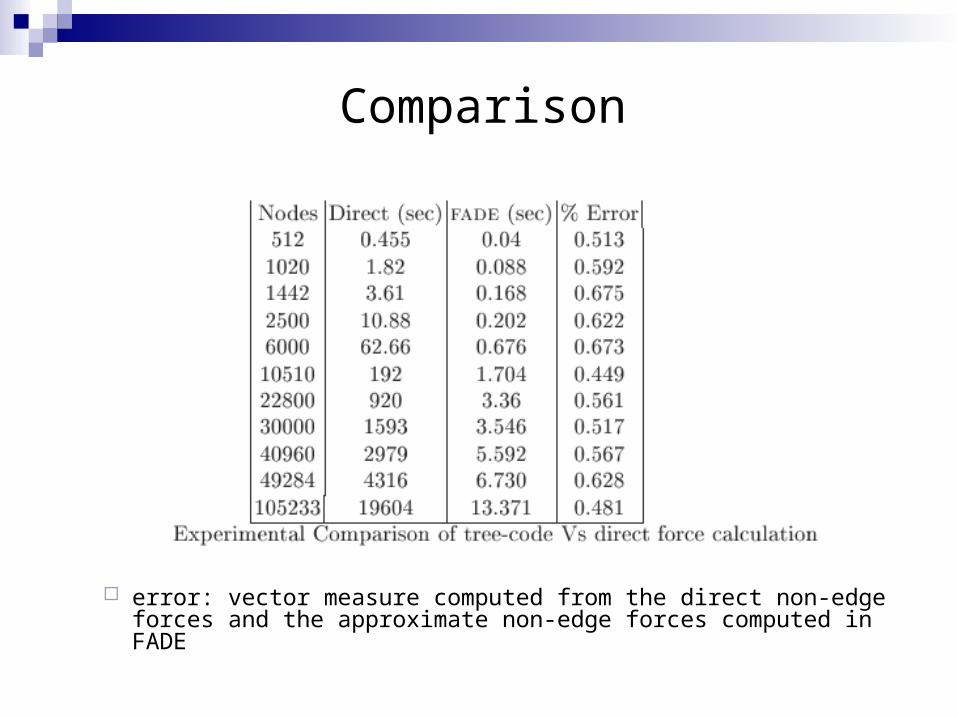
Comparison
error: vector measure computed from the direct non-edge forces and the approximate non-edge forces computed in FADE
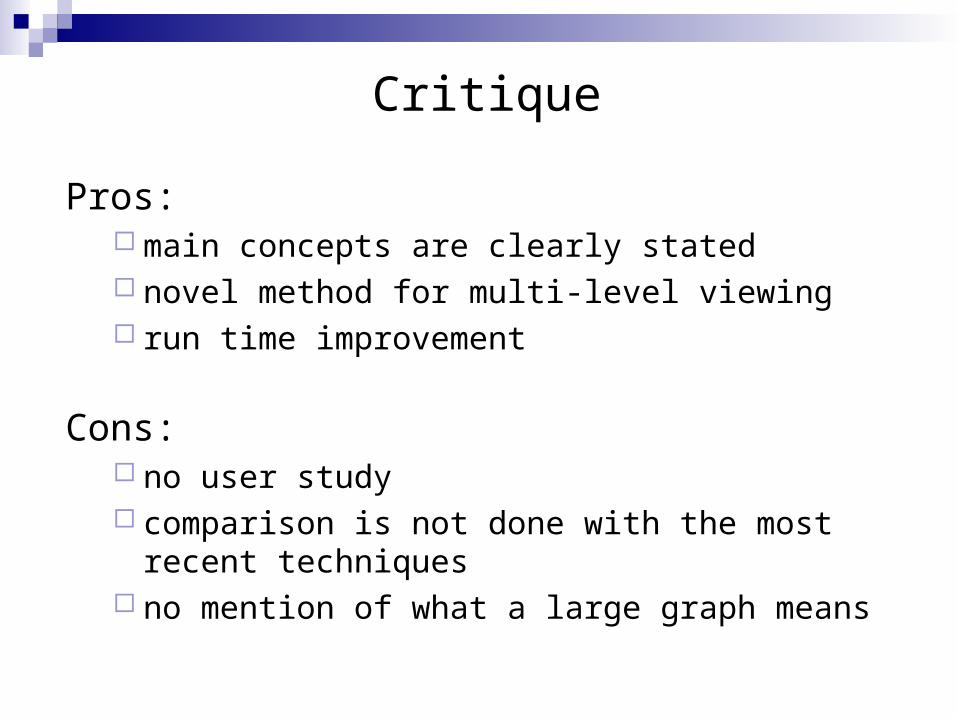
Critique
Pros: main concepts are clearly stated novel method for multi-level viewing run time improvement
Cons: no user study comparison is not done with the most recent
techniques no mention of what a large graph means
Visualization of State Transition Graphs
visualizes large graphs uses ranking uses clustering 3D visualization
Based on the Principles:
1. enable user to identify symmetrical and similar substructures
2. provide the user with overview of entire graph’s structure
Steps of the Visualization Process
1. Assign a rank to all nodes
2. Cluster graph based on structural property
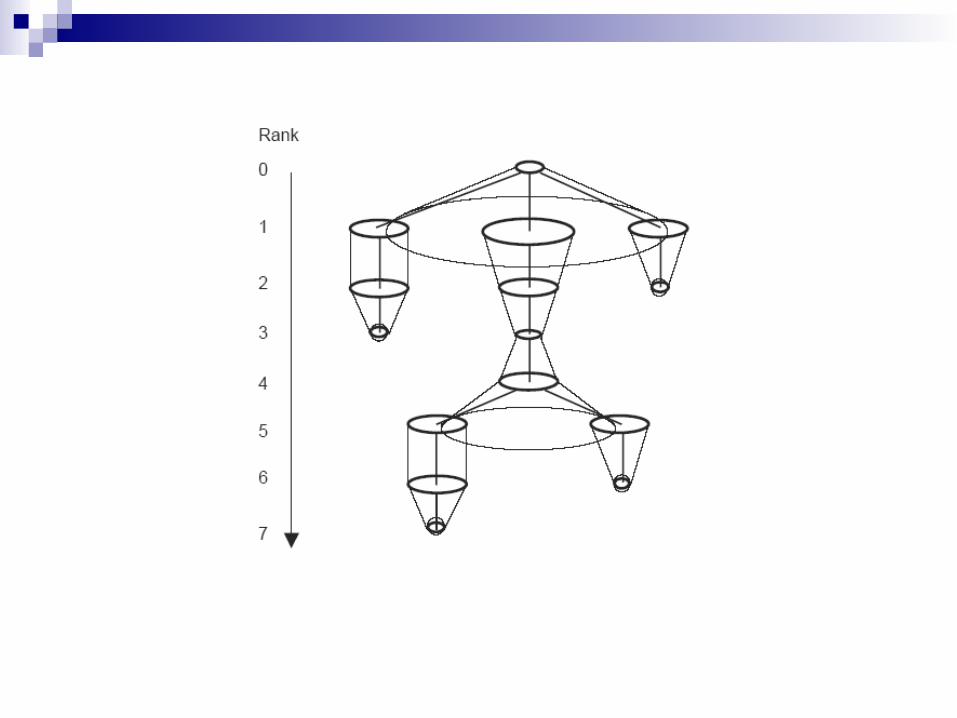
3. Visualize structure using cone trees
4. Place individual nodes and edges on graph
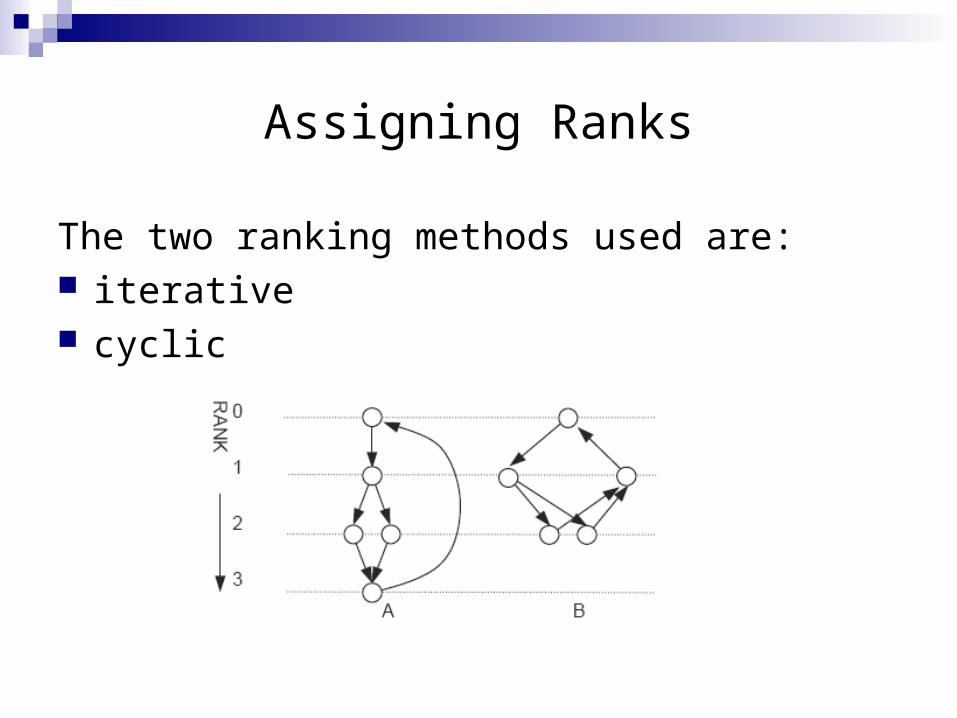
Assigning Ranks
The two ranking methods used are: iterative cyclic
Steps of the Visualization Process
1. Assign a rank to all nodes
2. Cluster graph based on structural property
3. Visualize structure using cone trees
4. Place individual nodes and edges on graph
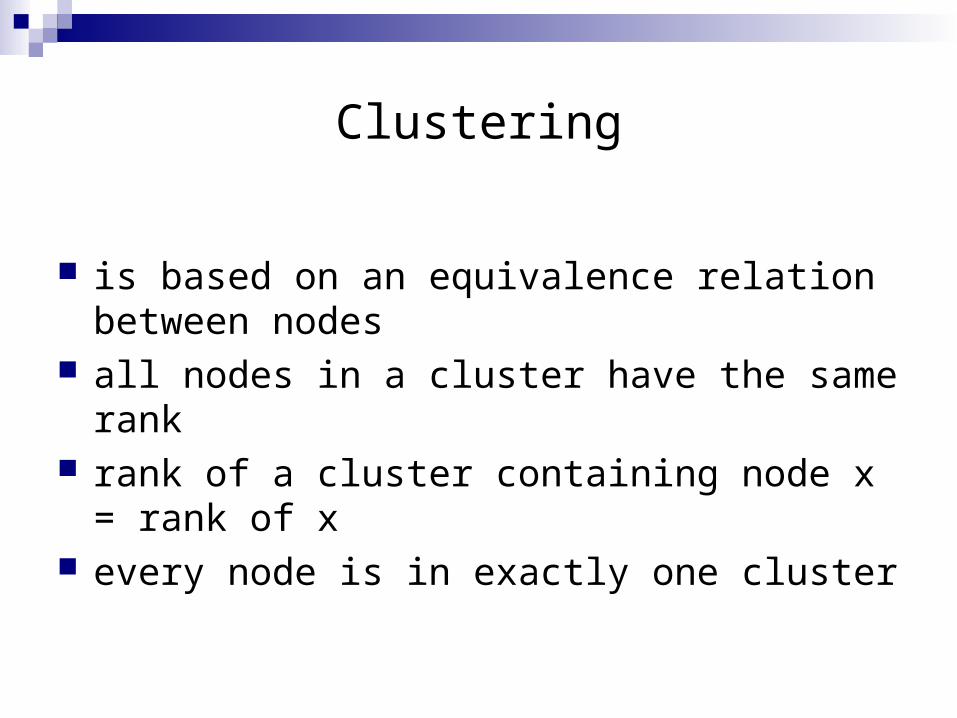
Clustering
is based on an equivalence relation between nodes
all nodes in a cluster have the same rank rank of a cluster containing node x = rank of x every node is in exactly one cluster
Steps of the Visualization Process
1. Assign a rank to all nodes
2. Cluster graph based on structural property
3. Visualize structure using cone trees
4. Place individual nodes and edges on graph
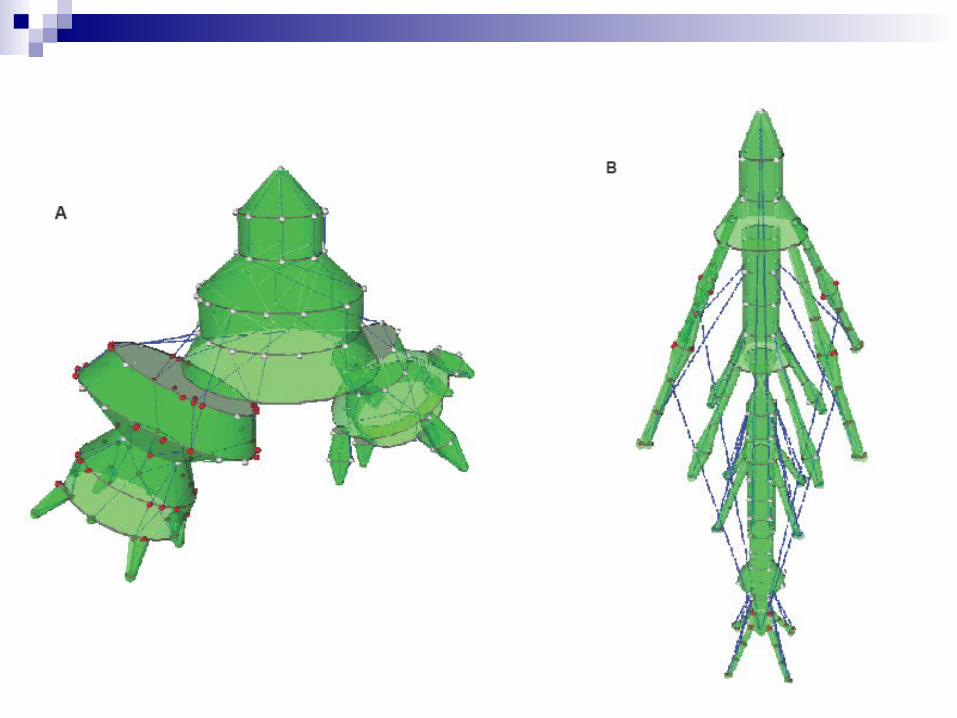
Visualizing the Structure
symmetry (clusters are placed on the graph according to some structure based rules)
clear visual relationship between backbone structure and actual graph
clusters with many nodes are represented by bigger circles
Steps of the Visualization Process
1. Assign a rank to all nodes
2. Cluster graph based on structural property
3. Visualize structure using cone trees
4. Place individual nodes and edges on graph
Placing the Nodes
emphasizes symmetry in the structure (nodes with the same properties are positioned the same way)
short edges between nodes maximum possible distance between nodes
within the same cluster (to reduce clutter and to avoid coinciding of nodes)

Placing the Nodes
To position the nodes: nodes are placed on graph based on the position
of ancestor and descendent nodes adjust position of nodes to increase space
between nodes in the same cluster

Critique
Pros: easy to read (provides good examples) occlusion is avoided (by rotating the non-centered
clusters and by using transparency) authors state when is the cyclic and when is the
iterative ranking more efficient real data is used at testing
Cons: no user study method not good when visualizing highly connected
graphs