Embed Size (px)
Citation preview

7/31/2019 Graph of Sines and Cosines
http://slidepdf.com/reader/full/graph-of-sines-and-cosines 1/20
Graph of Trigonometric Functions
I. Graph of Sine
A. Graphing a Function in the Form of
Procedure
1. Identify the amplitude and period.
2. Find the value of for the five key points – the three , the maximumpoint, and the minimum point. Start with the value of where the cycle begins and add
quarter – periods – that is,
to find successive values of .
3. Find the values of for the five key points by evaluating the function at each value of from step 2.
4. Connect the five key points with a smooth curve and graph the complete cycle of thegiven function.
5. Extend the graph in step 4 to the left or right as desired.
Example 1. Graph .
Solution
1. Identify the amplitude and the period. The equation is of the form
with . Thus, the amplitude is
. This means that the maximum value of
y is and the minimum value of is
. The period for both and is
.
2. Find the values of x for the five key points. We need to find the three ,the maximum point, and the minimum point on the interval . To do so, we beginby dividing the period, by 4.

7/31/2019 Graph of Sines and Cosines
http://slidepdf.com/reader/full/graph-of-sines-and-cosines 2/20
We start with the value of x where the cycle begins: Now we add quarter
periods, to generate for each of the key points. The five are
3. Find the values of y for the five key points. We evaluate the function at each value of from step 2.
Value of xValue of y:
Coordinates of key point
0
(0,0)
There are at . The maximum and minimum can be seen onthe graph below.
4. Connect the five key points with a smooth curve and graph one complete cycle of the
given function. The five key points for are shown below. By connecting the
points with a smooth curve, the figure shows one complete cycle of . Also
shown is the graph of . The graph is the graph of vertically
shrunk by a factor of.

7/31/2019 Graph of Sines and Cosines
http://slidepdf.com/reader/full/graph-of-sines-and-cosines 3/20
Note: The green color is the graph of and the blue color is the graph of
.
Example 2 . Graph .
Solution
1. Identify the amplitude and the period. The equation is of the form with . Thus, the amplitude is . This means that themaximum value of y is and the minimum value of is . The period for is .
2. Find the values of x for the five key points. Begin by dividing the period, by 4.
We start with the value of x where the cycle begins: Adding quarter-periods,
the five for the key points are
Although we will be graphing on –, we select rather than .
Knowing the graph’s shape on will enable us to continue the pattern and extendit to the left to and to the right to .

7/31/2019 Graph of Sines and Cosines
http://slidepdf.com/reader/full/graph-of-sines-and-cosines 4/20
3. Find the values of y for the five key points. We evaluate the function at each value of from step 2.
Value of xValue of y:
Coordinates of key point
0 (0,0)
There are at . The maximum and minimum points are on thegraph below.
4. Connect the five key points with a smooth curve and graph one complete cycle of thegiven function. The five key points for are shown below. By connecting thepoints with a smooth curve, the figure shows one complete cycle of . Alsoshown is the graph of . The graph is the graph of reflected about the and vertically stretched by a factor of 2.
5. Extend the graph in step 4 to the left or right as desired. The blue and red portions ofthe graphs below are from . In order to graph for , continue thepattern of each graph to the left and right. These extensions are shown in figure below.

7/31/2019 Graph of Sines and Cosines
http://slidepdf.com/reader/full/graph-of-sines-and-cosines 5/20
Note: The red color is the graph of and the blue color is the graph of
Example 3 . Graph .
Solution
1. Identify the amplitude and the period. The equation is of the form with .
Amplitude:
Period:
The amplitude, 3, tells us that the maximum value of is 3 and the minimum value of
. The Period,
, tells us that the graph completes one cycle from
.
2. Find the values of x for the five key points. Begin by dividing the period, by 4.
We start with the value of x where the cycle begins: Adding quarter-periods,
the five for the key points are
3. Find the values of y for the five key points. We evaluate the function at each value of from step 2.
Value of xValue of y:
Coordinates of key point
0
(0,0)
7/31/2019 Graph of Sines and Cosines
http://slidepdf.com/reader/full/graph-of-sines-and-cosines 6/20
In the interval , there are at . The maximum and
minimum points are indicated on the graph below.
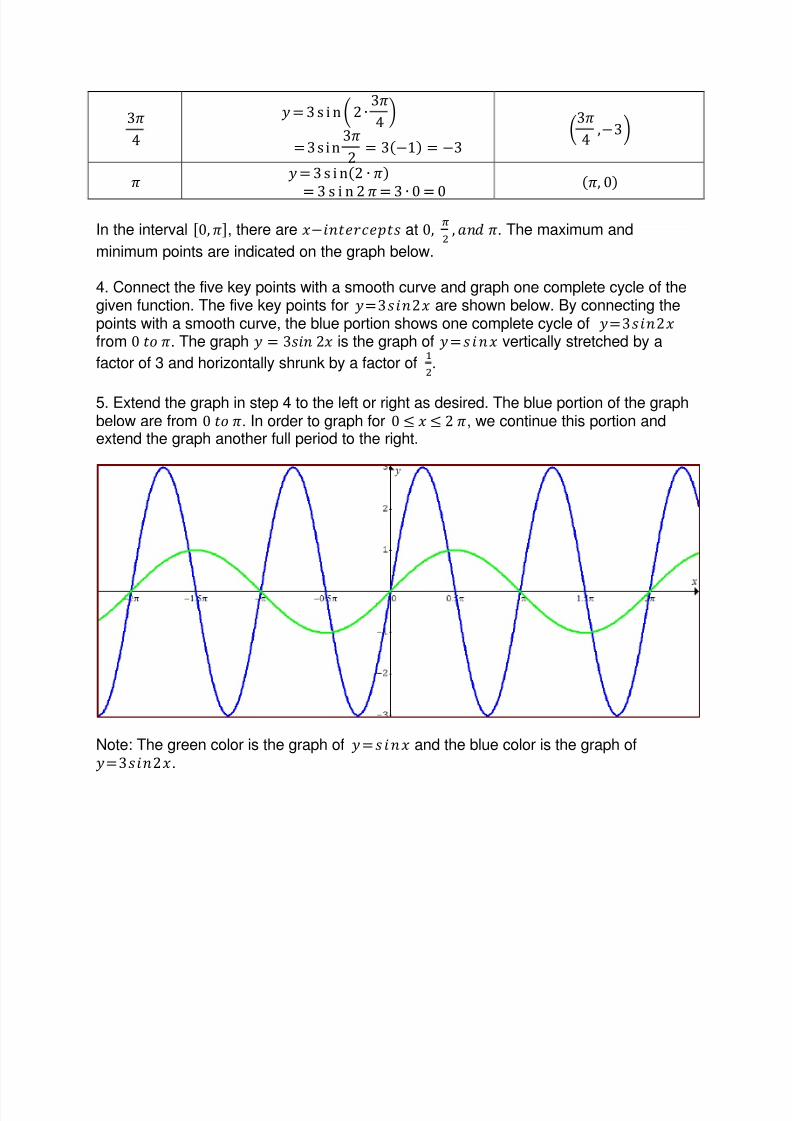
4. Connect the five key points with a smooth curve and graph one complete cycle of thegiven function. The five key points for are shown below. By connecting thepoints with a smooth curve, the blue portion shows one complete cycle of from . The graph is the graph of vertically stretched by a
factor of 3 and horizontally shrunk by a factor of.
5. Extend the graph in step 4 to the left or right as desired. The blue portion of the graphbelow are from . In order to graph for , we continue this portion andextend the graph another full period to the right.
Note: The green color is the graph of and the blue color is the graph of.
7/31/2019 Graph of Sines and Cosines
http://slidepdf.com/reader/full/graph-of-sines-and-cosines 7/20
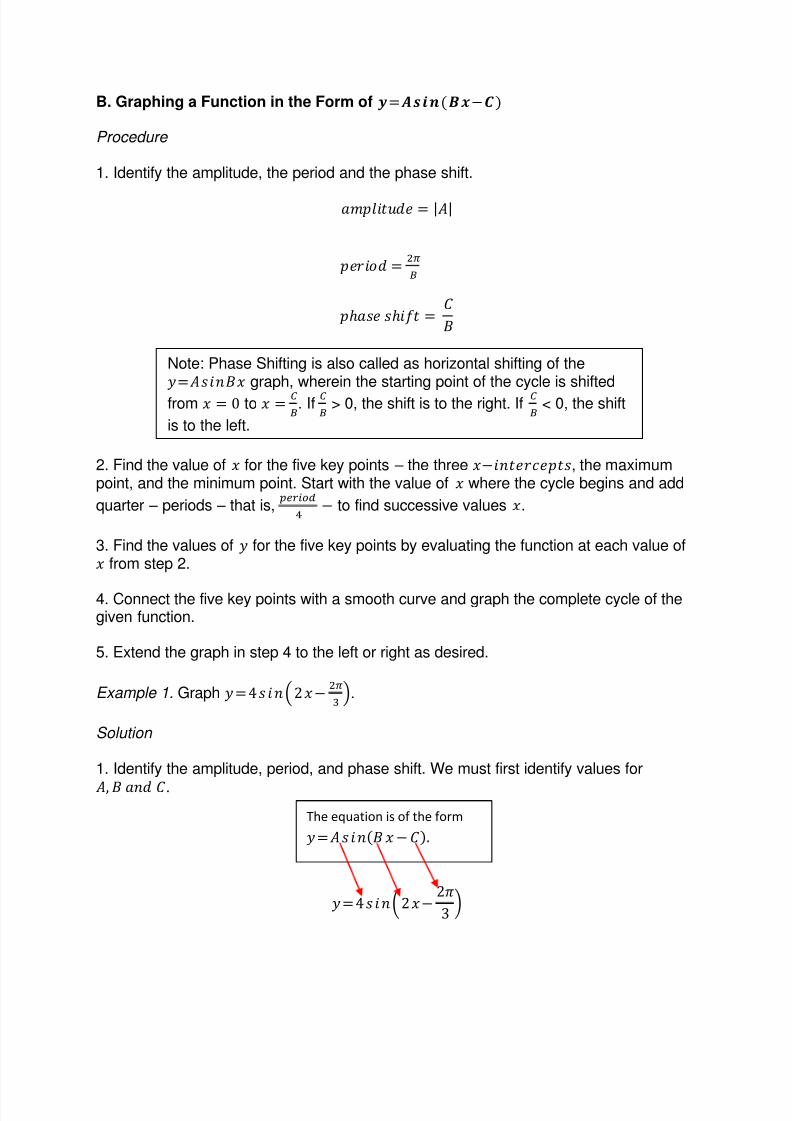
B. Graphing a Function in the Form of
Procedure
1. Identify the amplitude, the period and the phase shift.
2. Find the value of for the five key points – the three , the maximumpoint, and the minimum point. Start with the value of where the cycle begins and add
quarter – periods – that is,
to find successive values .
3. Find the values of for the five key points by evaluating the function at each value of from step 2.
4. Connect the five key points with a smooth curve and graph the complete cycle of thegiven function.
5. Extend the graph in step 4 to the left or right as desired.
Example 1. Graph .
Solution
1. Identify the amplitude, period, and phase shift. We must first identify values for
.
Note: Phase Shifting is also called as horizontal shifting of the
graph, wherein the starting point of the cycle is shifted
from to . If > 0, the shift is to the right. If < 0, the shift
is to the left.
The equation is of the form
7/31/2019 Graph of Sines and Cosines
http://slidepdf.com/reader/full/graph-of-sines-and-cosines 8/20
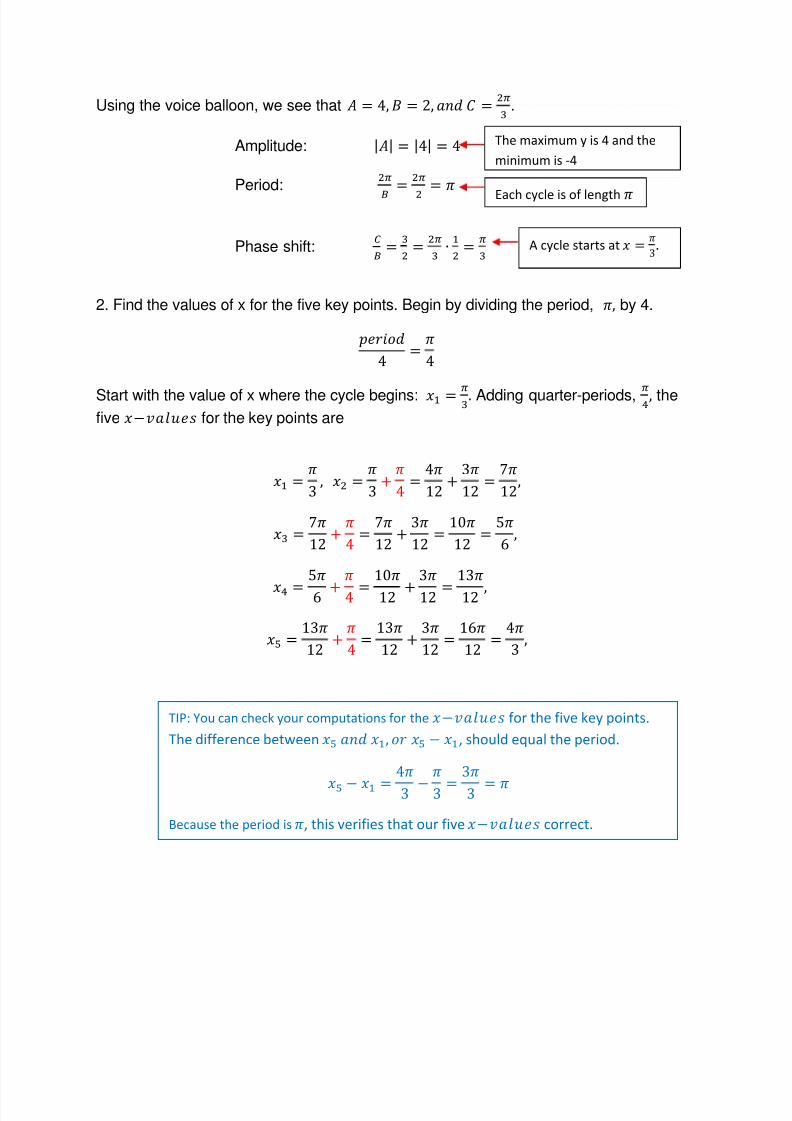
Using the voice balloon, we see that .
Amplitude:
Period:
Phase shift:
2. Find the values of x for the five key points. Begin by dividing the period, by 4.
Start with the value of x where the cycle begins: Adding quarter-periods, thefive for the key points are
The maximum y is 4 and the
minimum is -4
Each cycle is of length
A cycle starts at .
TIP: You can check your computations for the for the five key points.
The difference between , should equal the period.
Because the period is , this verifies that our five correct.

7/31/2019 Graph of Sines and Cosines
http://slidepdf.com/reader/full/graph-of-sines-and-cosines 9/20
3. Find the values of y for the five key points. We evaluate the function at each value of from step 2.
Value of xValue of y:
Coordinates of key point
The key points ,
indicate that in the interval
, there are
at
. The
is a maximum point and
is a
minimum point.
4. Connect the five key points with a smooth curve and graph one complete cycle of the
given function. The five key points,
, and
the graph of are shown below.

7/31/2019 Graph of Sines and Cosines
http://slidepdf.com/reader/full/graph-of-sines-and-cosines 10/20
C. Graphing a Function in the Form of
Procedure
1. Identify the amplitude, the period and the phase shift.
2. Find the value of
for the five key points – the three
, the maximum
point, and the minimum point. Start with the value of where the cycle begins and addquarter – periods – that is,
to find successive values .
3. Find the values of for the five key points by evaluating the function at each value of from step 2.
Note: Phase Shifting is also called as horizontal shifting of the graph, wherein the starting point of the cycle is shifted
from to . If
> 0, the shift is to the right. If
< 0, the shift
is to the left.

7/31/2019 Graph of Sines and Cosines
http://slidepdf.com/reader/full/graph-of-sines-and-cosines 11/20
4. Identify the vertical shift of .
5. Connect the five key points with a smooth curve and graph the complete cycle of thegiven function.
6. Extend the graph in step 5 to the left or right as desired.
Example 1. Graph .
Solution
1. Identify the amplitude, period, phase shift, and the vertical shift. We must first identifyvalues for .
Amplitude:
Period:
Phase shift:
Vertical shift:
Note: If is positive, the shift is units upward. If is negative, theshift of units downward. These vertical shifts result in sinusoidalgraphs oscillating about the horizontal line
rather than about
the . Thus, the maximum is and the minimum is .
The equation is of the form
The maximum y is 2 and the
minimum is -2 for the graph of
Each cycle is of length
A cycle starts at .
Each key point of graph will
move one (1) unit upward. Hence, the
maximum y will become 3 and the
minimum will become -1 to form the graph
of .
7/31/2019 Graph of Sines and Cosines
http://slidepdf.com/reader/full/graph-of-sines-and-cosines 12/20
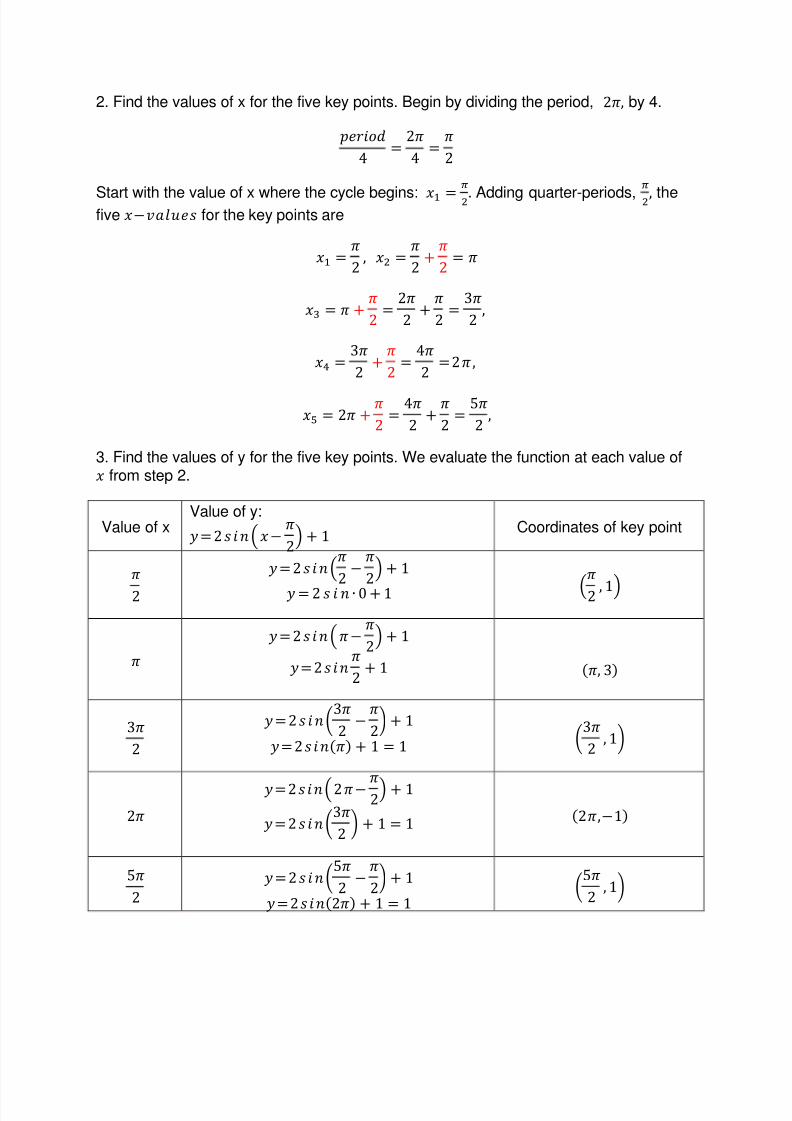
2. Find the values of x for the five key points. Begin by dividing the period, by 4.
Start with the value of x where the cycle begins: Adding quarter-periods,
the
five for the key points are
3. Find the values of y for the five key points. We evaluate the function at each value of from step 2.
Value of xValue of y:
Coordinates of key point
7/31/2019 Graph of Sines and Cosines
http://slidepdf.com/reader/full/graph-of-sines-and-cosines 13/20
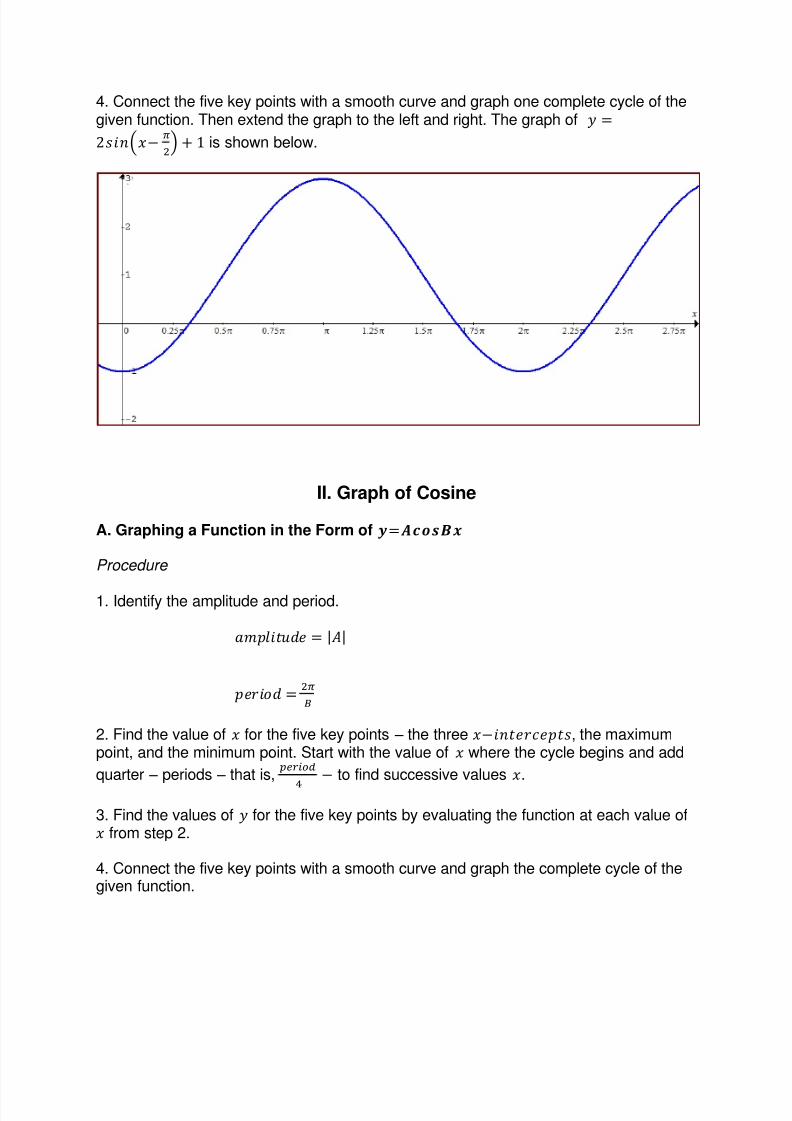
4. Connect the five key points with a smooth curve and graph one complete cycle of thegiven function. Then extend the graph to the left and right. The graph of
is shown below.
II. Graph of Cosine
A. Graphing a Function in the Form of
Procedure
1. Identify the amplitude and period.
2. Find the value of for the five key points – the three , the maximumpoint, and the minimum point. Start with the value of where the cycle begins and add
quarter – periods – that is,
to find successive values
.
3. Find the values of for the five key points by evaluating the function at each value of from step 2.
4. Connect the five key points with a smooth curve and graph the complete cycle of thegiven function.

7/31/2019 Graph of Sines and Cosines
http://slidepdf.com/reader/full/graph-of-sines-and-cosines 14/20
5. Extend the graph in step 4 to the left or right as desired.
Example 1. Graph .
Solution
1. Identify the amplitude and the period. The equation is the form
with A = - 3 and B =.
Amplitude:
Period:
2. Find the for the five key points. Begin by dividing the period, 4, by 4.
Start with the value of where the cycle begins: Adding quarter-periods, 1, thefive key points are
3. Find the values of for the five key points. We evaluate the function at each value ofx from step 2.
Value of x Value of y: Coordinates of key point
The maximum is 3 and the
minimum is -3.
Each cycle is of length 4.

7/31/2019 Graph of Sines and Cosines
http://slidepdf.com/reader/full/graph-of-sines-and-cosines 15/20
In the interval , there are at 1 and 3.
4. Connect the five key points with a smooth curve and graph one complete cycle of the
given function. The five key points for are show in below figure. By
connecting the points with a smooth curve, the curve below shows one complete cycle
of from 5. Extend the graph in step 4 to the left and right as desired. The graph below has aperiod . In order to graph the for , we can continue the graph andextend it another full period to the left and right as we can in the graph below.
B. Graphing a Function in the Form of
Procedure
1. Identify the amplitude, the period and the phase shift.
Note: Phase Shifting is also called as horizontal shifting of the graph, wherein the starting point of the cycle is shifted
from to . If
> 0, the shift is to the right. If
< 0, the shift
is to the left.

7/31/2019 Graph of Sines and Cosines
http://slidepdf.com/reader/full/graph-of-sines-and-cosines 16/20
2. Find the value of for the five key points – the three , the maximumpoint, and the minimum point. Start with the value of where the cycle begins and add
quarter – periods – that is,
to find successive values .
3. Find the values of
for the five key points by evaluating the function at each value of
from step 2.
4. Connect the five key points with a smooth curve and graph the complete cycle of thegiven function.
5. Extend the graph in step 4 to the left or right as desired.
Example 1. Graph
Solution
1. Identify the amplitude, the period, and the phase shift. We must first identify for To do this, we need to express the equation in the form .
Thus, we write equation as
. Now we can
identify values for .
Amplitude:
Period:
Phase shift:
2. Find the for the five key points. Begin by dividing the period,, by 4.
The maximum is and the
minimum is .
Each cycle is of length.
The equation is of the form
A cycle starts at l .
7/31/2019 Graph of Sines and Cosines
http://slidepdf.com/reader/full/graph-of-sines-and-cosines 17/20
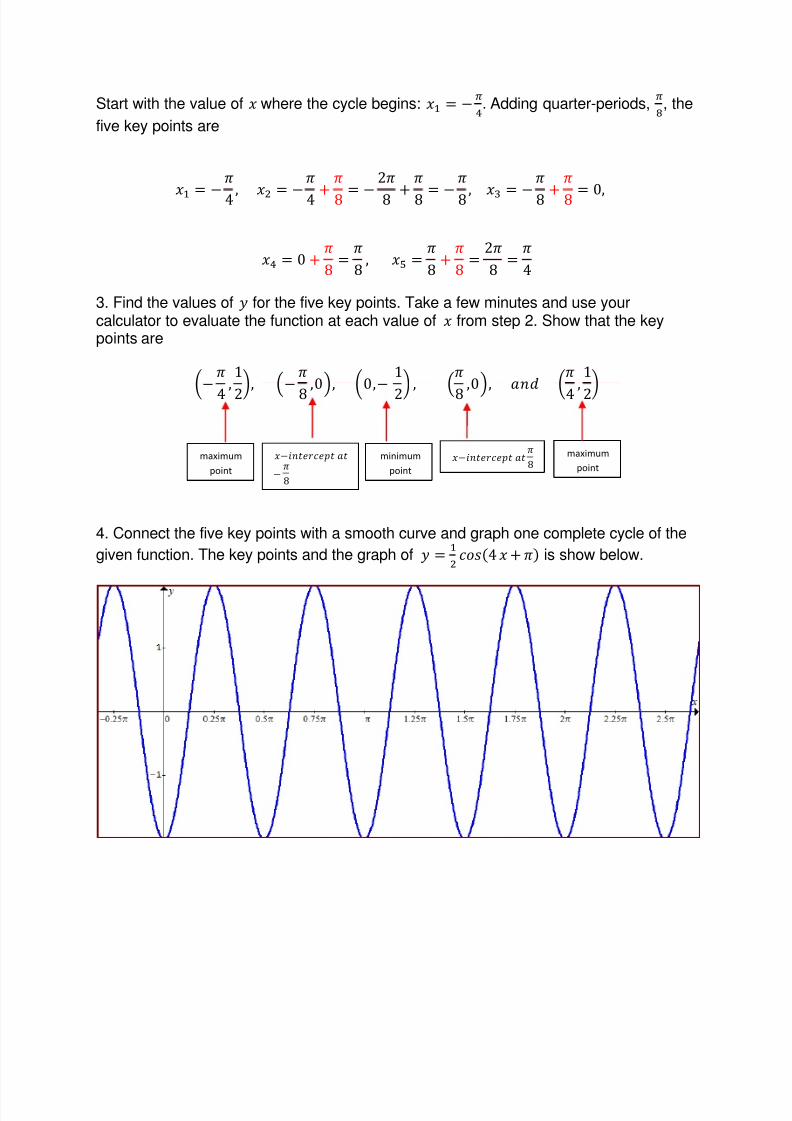
Start with the value of where the cycle begins: Adding quarter-periods,
, the
five key points are
3. Find the values of for the five key points. Take a few minutes and use yourcalculator to evaluate the function at each value of from step 2. Show that the keypoints are
4. Connect the five key points with a smooth curve and graph one complete cycle of the
given function. The key points and the graph of is show below.
maximum
point
minimum
point
maximum
point

7/31/2019 Graph of Sines and Cosines
http://slidepdf.com/reader/full/graph-of-sines-and-cosines 18/20
C. Graphing a Function in the Form of
Procedure
1. Identify the amplitude, the period and the phase shift.
2. Find the value of for the five key points – the three , the maximumpoint, and the minimum point. Start with the value of where the cycle begins and add
quarter – periods – that is,
to find successive values .
3. Find the values of for the five key points by evaluating the function at each value of from step 2.
4. Identify the vertical shift of .
5. Connect the five key points with a smooth curve and graph the complete cycle of thegiven function.
6. Extend the graph in step 5 to the left or right as desired.
Note: Phase Shifting is also called as horizontal shifting of the
graph, wherein the starting point of the cycle is shifted
from to . If > 0, the shift is to the right. If < 0, the shift
is to the left.
Note: If is positive, the shift is units upward. If is negative, theshift of units downward. These vertical shifts result in sinusoidalgraphs oscillating about the horizontal line rather than aboutthe . Thus, the maximum is and the minimum is .

7/31/2019 Graph of Sines and Cosines
http://slidepdf.com/reader/full/graph-of-sines-and-cosines 19/20
Example 1. Graph
Solution
The graph of
is the graph of
shifted one unit downward. The
period of is , which is also the period for the vertically shifted graph. The
key points on the interval for are found by first determining the
. The quarter-period is , or
. The cycle begins at . As always,
we add quarter-periods to generate for each of the key points. The fivevalues are
The values of for the five key points and their coordinates are determined as follows.
Value of x
Value of y:
Coordinates of key point

7/31/2019 Graph of Sines and Cosines
http://slidepdf.com/reader/full/graph-of-sines-and-cosines 20/20
The graph of is show below as the key points are being connected.
Prepared by: Aldren B. Narzoles
Twitter Account:@ aldrennarzoles
Facebook Account: [email protected]
Yahoo Account: [email protected]
Blogger Account: lpuelearning.blogspot.com